HAL Id: tel-01404689 https://tel.archives-ouvertes.fr/tel-01404689 Submitted on 29 Nov 2016 HAL is a multi-disciplinary open access archive for the deposit and dissemination of sci- entific research documents, whether they are pub- lished or not. The documents may come from teaching and research institutions in France or abroad, or from public or private research centers. L’archive ouverte pluridisciplinaire HAL, est destinée au dépôt et à la diffusion de documents scientifiques de niveau recherche, publiés ou non, émanant des établissements d’enseignement et de recherche français ou étrangers, des laboratoires publics ou privés. Dark fermentative biohydrogen production from organic waste and application of by-products in a biorefinery concept Anish Ghimire To cite this version: Anish Ghimire. Dark fermentative biohydrogen production from organic waste and application of by-products in a biorefinery concept. Material chemistry. Université Paris-Est, 2015. English. NNT: 2015PESC1197. tel-01404689
Transcript
HAL Id: tel-01404689https://tel.archives-ouvertes.fr/tel-01404689
Submitted on 29 Nov 2016
HAL is a multi-disciplinary open accessarchive for the deposit and dissemination of sci-entific research documents, whether they are pub-lished or not. The documents may come fromteaching and research institutions in France orabroad, or from public or private research centers.
L’archive ouverte pluridisciplinaire HAL, estdestinée au dépôt et à la diffusion de documentsscientifiques de niveau recherche, publiés ou non,émanant des établissements d’enseignement et derecherche français ou étrangers, des laboratoirespublics ou privés.
Dark fermentative biohydrogen production from organicwaste and application of by-products in a biorefinery
conceptAnish Ghimire
To cite this version:Anish Ghimire. Dark fermentative biohydrogen production from organic waste and application ofby-products in a biorefinery concept. Material chemistry. Université Paris-Est, 2015. English. �NNT :2015PESC1197�. �tel-01404689�
Spécialité : Science et Technique de l’Environnement
Dottore di Ricerca in Tecnologie Ambientali
Degree of Doctor in Environmental Technology
Thèse – Tesi di Dottorato – PhD thesis
Anish Ghimire
Dark fermentative biohydrogen production from organic waste and application of by-products in a biorefinery concept
Defended on December 17th, 2015
In front of the PhD committee
Prof. Dr. Ing. Massimiliano Fabbricino Reviewer Prof. Dr. Ing. Raffaella Pomi Reviewer Dr. Hab. E.D. van Hullebusch Examiner Prof. Dr. Ing. Giovanni Esposito Promotor Prof. Dr. Ir. Piet N.L. Lens Co-promotor Prof. Dr. Ing. Francesco Pirozzi Co-promotor Prof. Michel Madon Co-promotor
Erasmus Joint doctorate programme in Environmental Technology for Contaminated Solids, Soils
Thesis committee Thesis Promotor Prof. Dr. Ing. G. Esposito, Associate Professor of Sanitary and Environmental Engineering University of Cassino and Southern Lazio, Cassino, Italy Thesis co-promotors and supervisors Prof. Dr. Ir. P.N.L. Lens Professor of Biotechnology UNESCO-IHE, Delft, The Netherlands Prof. Dr. Ing. Francesco Pirozzi Professor of Sanitary and Environmental Engineering University of Naples Federico II, Naples, Italy Dr. Ing. L. Frunzo Assistant Professor in Applied Mathematics University of Naples “Federico II”, Naples, Italy Dr. R. Escudié Research Scientist Laboratory of Environmental Biotechnology (LBE), INRA, Narbonne, France Dr. E. Trably Research Scientist Laboratory of Environmental Biotechnology (LBE), INRA, Narbonne, France Prof. Michel Madon Professor University of Paris-Est, France Other members Prof. Dr. Ing. Massimiliano Fabbricino Associate Professor of Sanitary and Environmental Engineering University of Naples Federico II, Naples, Italy Dr. Ing. Raffaella Pomi, Assistant Professor of Sanitary and Environmental Engineering Sapienza University of Rome, Rome, Italy Dr. Hab. E.D. van Hullebusch Associate Professor of Biogeochemistry University of Paris-Est, France This research was conducted under the auspices of the Erasmus Mundus Joint Doctorate Environmental Technologies for Contaminated Solids, Soils, and Sediments (ETeCoS3).
iii
TABLE OF CONTENTS
TABLE OF CONTENTS ......................................................................................... iii LIST OF FIGURES ................................................................................................. vi
LIST OF TABLES ................................................................................................... ix ABSTRACT ............................................................................................................ xi
SINTESI ................................................................................................................. xii
RÉSUMÉ ............................................................................................................... xiv
SAMENVATTING ................................................................................................. xv ACKNOWLEDGEMENT ...................................................................................... xvi
1.1 Background and problem statement ............................................................... 2 1.2 Scope of the PhD thesis ................................................................................. 5
State of the art in dark fermentation of complex waste biomass by mixed culture and utilization of dark fermentation effluents in photo fermentation .................................... 9
2.1 Dark fermentative biohydrogen production from organic biomass ............... 10
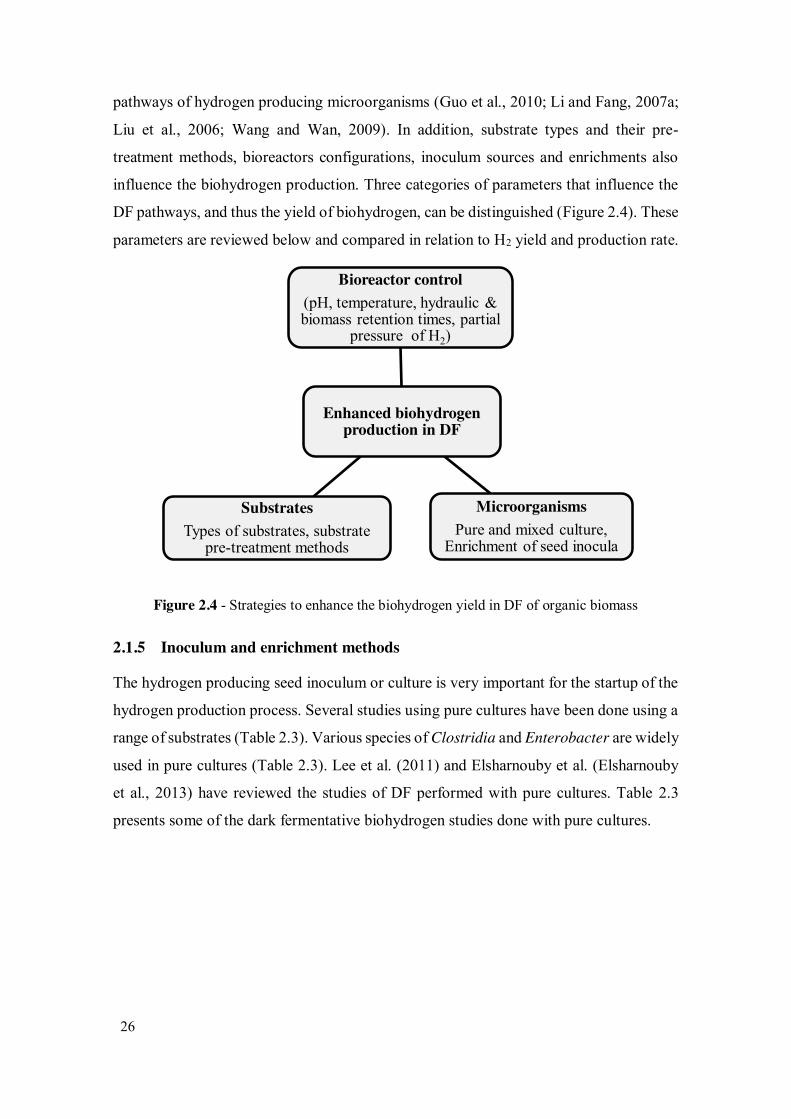
2.1.2 Microbiology and biochemical pathways of DF ....................................... 14 2.1.3 Potential sources of organic biomass for fermentative biohydrogen production ........................................................................................................... 18 2.1.4 Factors affecting DF pathways and H2 yield ............................................. 25
2.1.5 Inoculum and enrichment methods........................................................... 26 2.1.6 Design and operation of bioreactors ......................................................... 32
2.1.7 Substrate pre-treatment for enhanced H2 yield ......................................... 41 2.1.8 Use of by-products ................................................................................... 45
2.1.9 Pilot scale applications ............................................................................. 57 2.1.10 Challenges and future prospects ............................................................... 57
2.1.11 Conclusions ............................................................................................. 61 2.2 Valorization of dark fermentation effluents via photo fermentative production of biohydrogen and biopolymers ............................................................................. 62
Operational Strategies to improve dark fermentative H2 production using complex waste biomass ..................................................................................................................... 124
3.1 Evaluation of methods for obtaining H2 producing seed inoculum for dark fermentation .......................................................................................................... 125
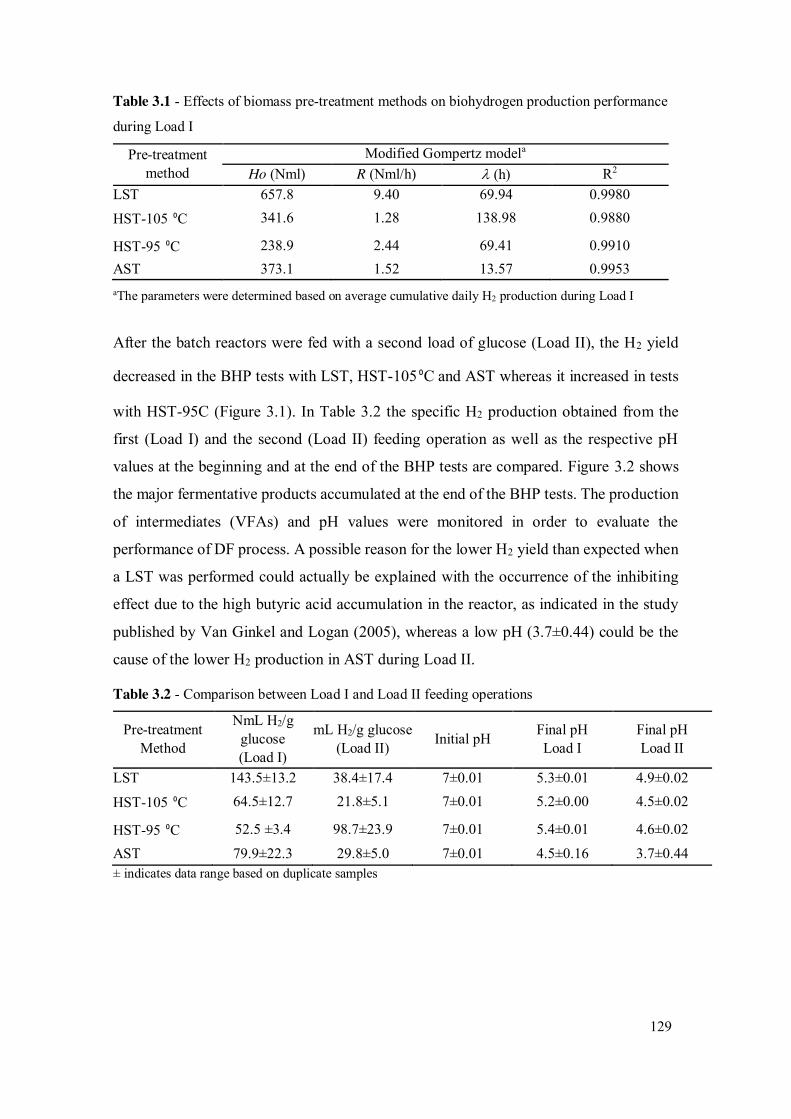
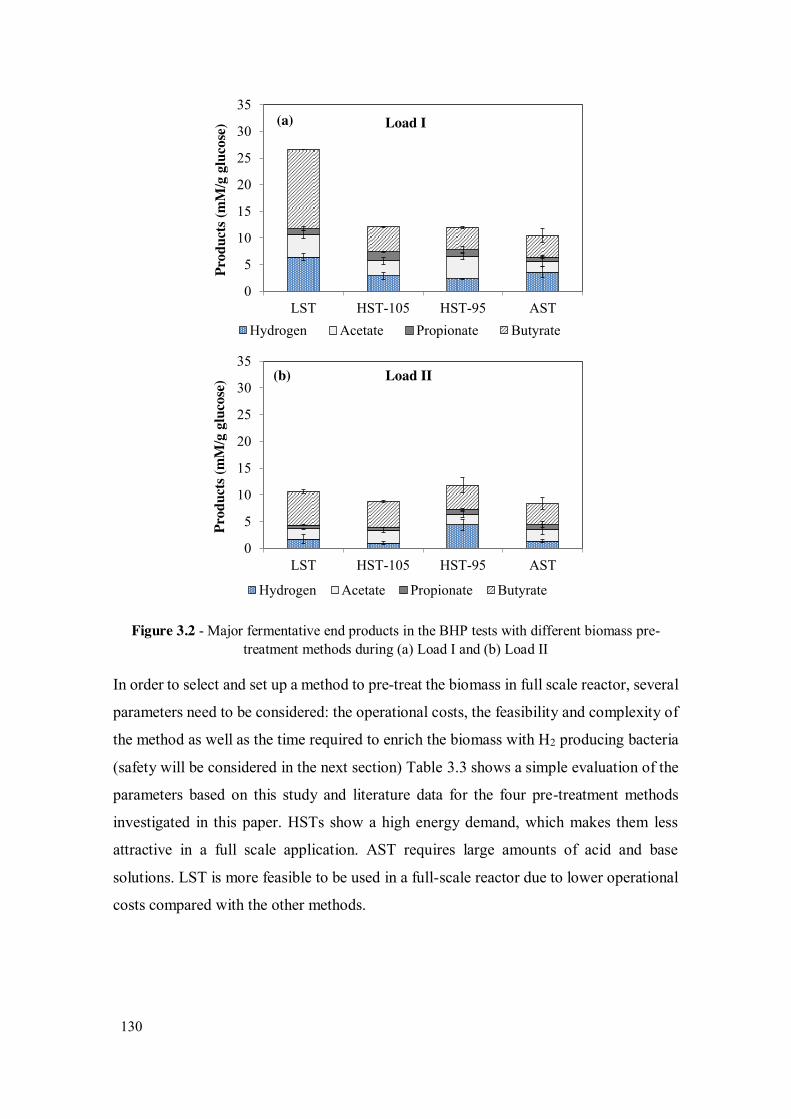
3.1.3 Materials and methods ........................................................................... 126 3.1.4 Results and discussions .......................................................................... 128
3.1.5 Conclusions ........................................................................................... 132 3.2 Effects of operational parameters on dark fermentative H2 production ....... 133
3.2.1 Introduction ........................................................................................... 133 3.2.2 Materials and methods ........................................................................... 136
Integration of dark fermentation in A biorefinery concept ......................................... 193
5.1 Integration of dark-photo fermentation and anaerobic digestion for enhanced energy yields ......................................................................................................... 194
5.1.2 Materials and methods ........................................................................... 196 5.1.3 Results and discussion ........................................................................... 200
5.1.4 Conclusion............................................................................................. 208 5.2 H2 and biopolymer production by phototofermentation .............................. 209
5.2.1 Introduction ........................................................................................... 209 5.2.2 Materials and methods ........................................................................... 211
5.2.3 Results and discussions .......................................................................... 215 5.2.4 Conclusions and future perspective ........................................................ 223
5.3 Solid State Dark Fermentation for production of H2 and organic acids ....... 224 5.3.1 Introduction ........................................................................................... 224
5.3.2 Materials and methods ........................................................................... 226 5.3.3 Results ................................................................................................... 228
Discussion and future perspective ............................................................................. 245 6.1 Introduction and objectives ........................................................................ 246
6.2 Major findings and highlights .................................................................... 247 6.2.1 Effect of operational parameters on dark fermentative H2 yields ............ 247
6.2.2 Continuous biohydrogen production ...................................................... 249 6.2.3 Integration of dark fermentation in a biorefinery concept ....................... 250
6.3 Future research prospective ....................................................................... 252 REFERENCES ..................................................................................................... 254
vi
LIST OF FIGURES
Figure 1.1 - A general schematic representation of the thesis study ............................... 5
Figure 2.1 - Biological pathways to produce hydrogen ................................................ 12
Figure 2.2 - Number of peer reviewed publications on DF published in the last decade (Google Scholar, 2014; Scopus, 2014) ....................................................... 13
Figure 2.3 - Biodegradation and microbiological pathways involved in the fermentative breakdown of waste biomass (Adapted and modified from Peiris et al. (2006) ........................................................................................................ 15
Figure 2.4 - Strategies to enhance the biohydrogen yield in DF of organic biomass ..... 26
Figure 2.5 - Different strategies for integrating DF with post treatment processes for improved biofuel production ...................................................................... 46
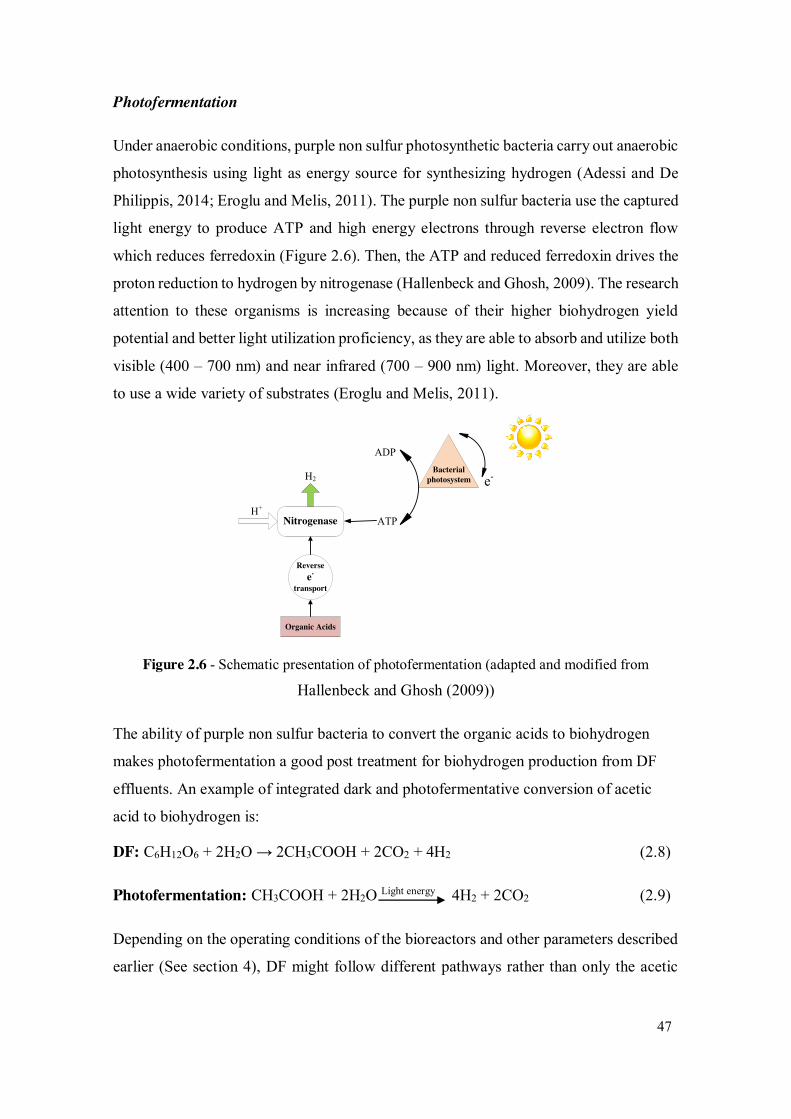
Figure 2.6 - Schematic presentation of photofermentation (adapted and modified from Hallenbeck and Ghosh (2009))................................................................... 47
Figure 2.7 - Schematic diagram of two chambered MEC separated by a proton exchange membrane and power supply (adapted and modified from Liu et al. (2005))....................................................................................................... 51
Figure 2.8 - Two-stage process for hydrogen and methane production from organic waste ......................................................................................................... 52
Figure 2.9 - Classification of anoxygenic photosynthetic bacteria................................ 65
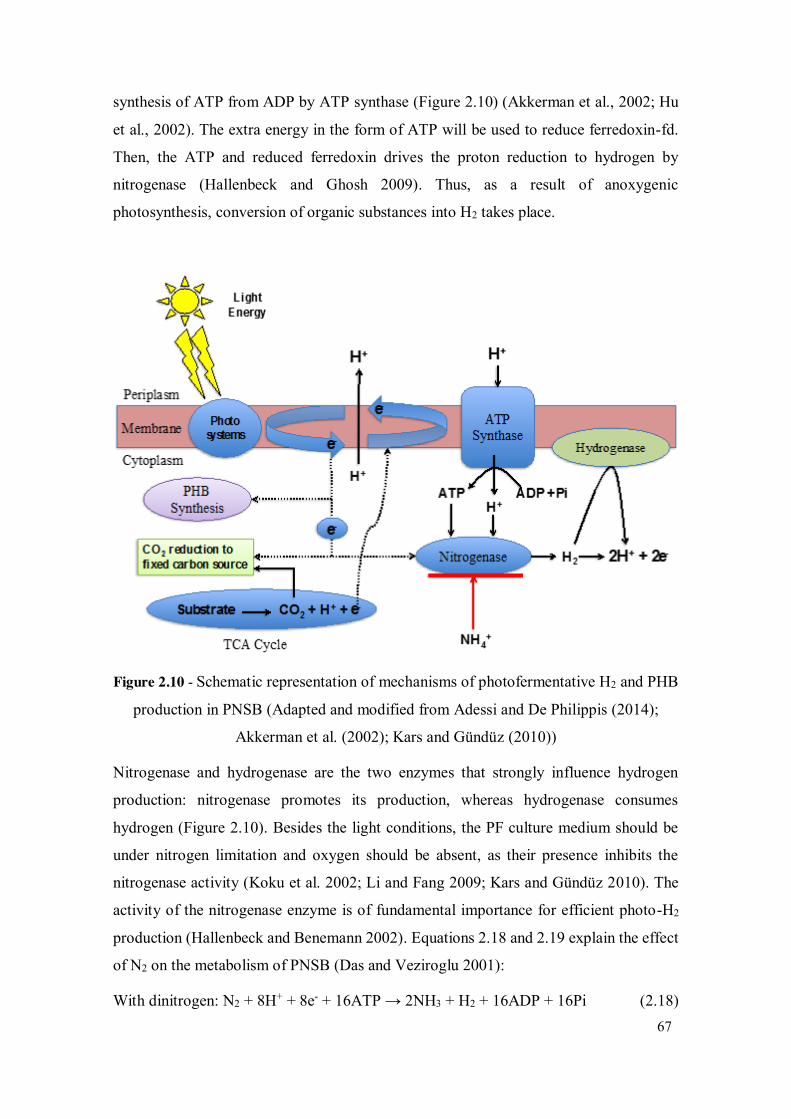
Figure 2.10 - Schematic representation of mechanisms of photofermentative H2 and PHB production in PNSB (Adapted and modified from Adessi and De Philippis (2014); Akkerman et al. (2002); Kars and Gündüz (2010)) .......... 67
Figure 2.11 - Sunlight and light absorption by purple bacteria (Akkerman et al., 2002) 70
Figure 2.12 - Effect of light intensity on biohydrogen production by Rhodobacter sphaeroides O.U. 001 (Uyar et al., 2007) ................................................... 79
Figure 2.13 - Schematic representation of the potential PBRs for PF ........................... 85
Figure 2.14 - Sequential DF-PF process ...................................................................... 96
Figure 3.1 - Average Cumulative H2 Production in BHP tests ................................... 128
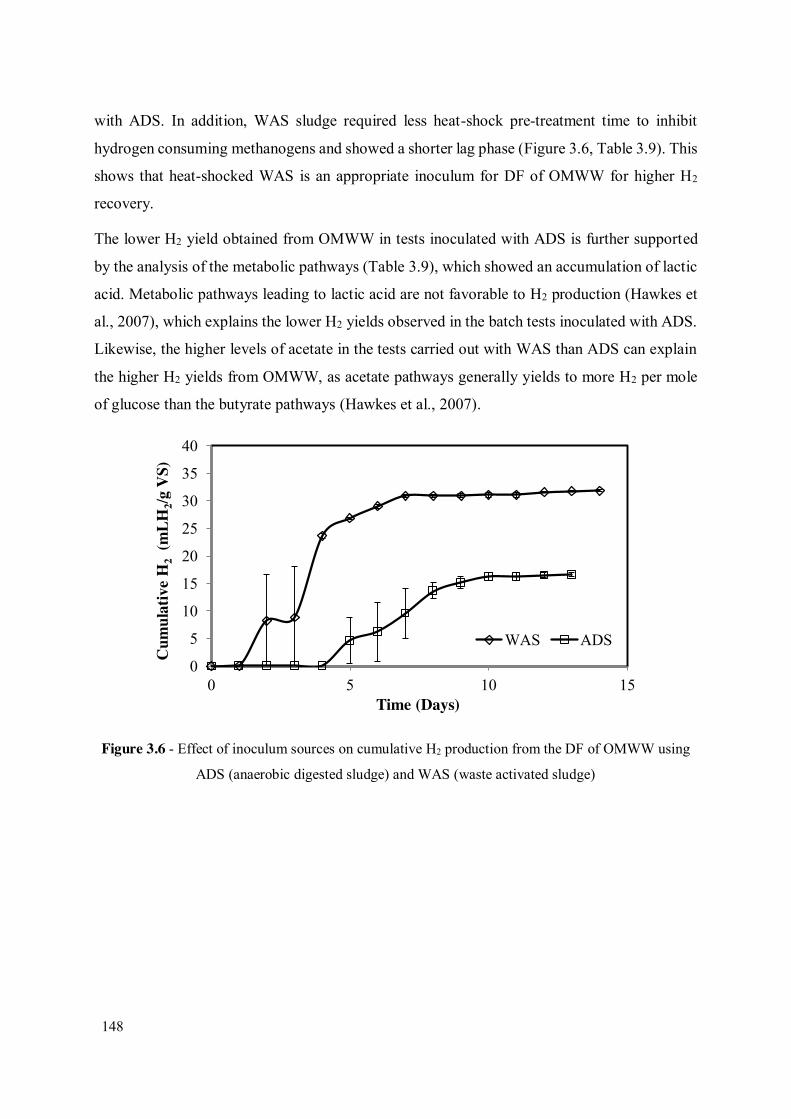
Figure 3.2 - Major fermentative end products in the BHP tests with different biomass pre-treatment methods during (a) Load I and (b) Load II .......................... 130
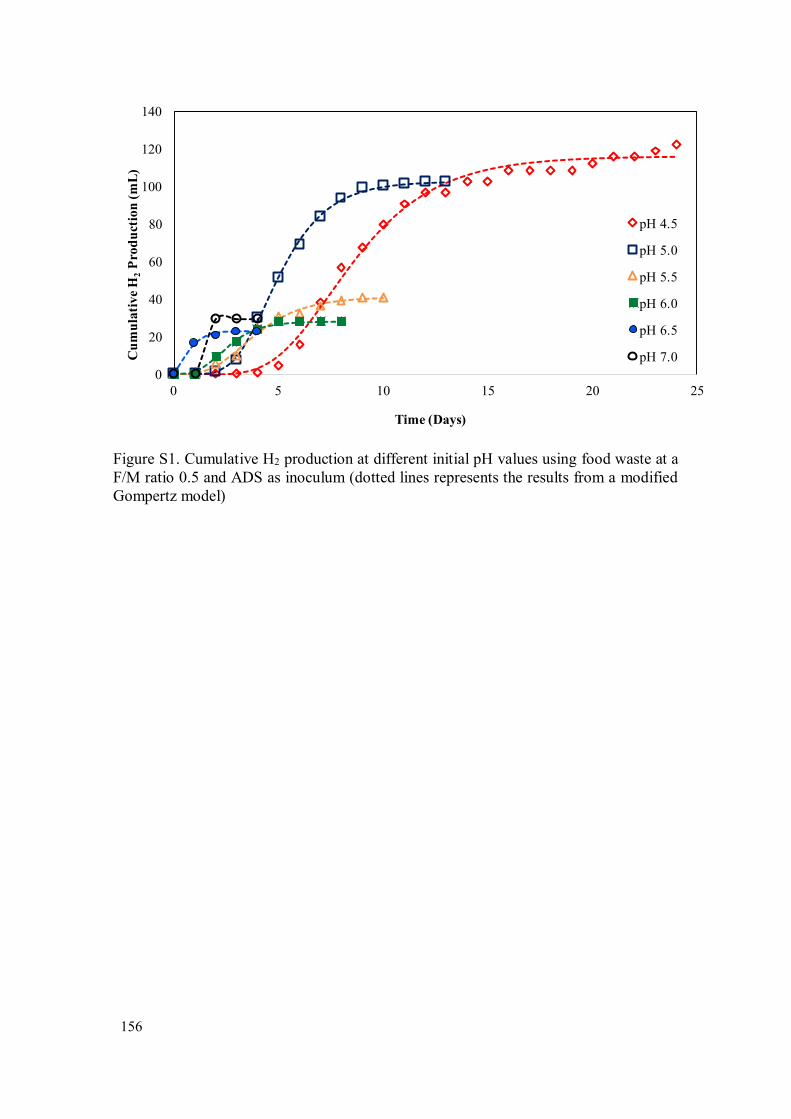
Figure 3.3 - Effect of initial pH on H2 yield and time required for H2 production to achieve 95% of the maximum yield during the DF of food waste at F/M ratio 0.5 and thermophilic temperature (55 ± 2 °C) using ADS ........................ 142
Figure 3.4 - H2 yields and B/A ratio as a function of pH in the thermophilic DF of food waste at F/M ratio 0.5 .............................................................................. 143
Figure 3.5 - Effect of alkaline pre-treatment of rice straw on H2 yields ...................... 147
Figure 3.6 - Effect of inoculum sources on cumulative H2 production from the DF of OMWW using ADS (anaerobic digested sludge) and WAS (waste activated sludge) ..................................................................................................... 148
vii
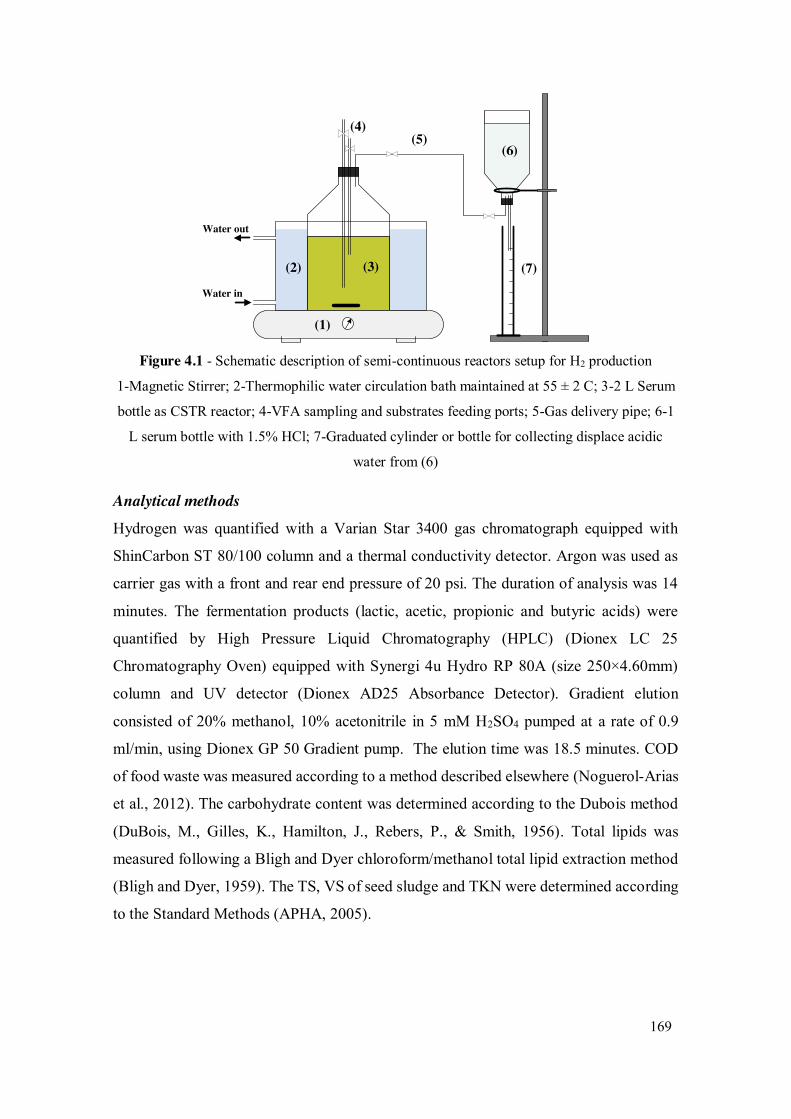
Figure 4.1 - Schematic description of semi-continuous reactors setup for H2 production ............................................................................................... 169
Figure 4.2 - (a) HPR (mL H2/L/d) (b) pH trends in semi-continuous thermophilic DF bioreactor (the shaded region in Figure 4.2 (a) represents the experimental period when the DF residues were recycled back to the reactor and 1 (b) represents the period when pH was adjusted at pH 5.5) ............................ 172
Figure 4.3 - Correlation circle of pH, HRT, OLR, HPR and HY formed by the first three principle components dim1, Dim 2 and Dim 3 representing 53.25, 23.26 and 15.15 % of the total variance, respectively (a) Projections according to the first two factors (Dim 1 and Dim 2). (b) Projects according to the first and third factors (Dim 1 and Dim 3) ............................................................... 173
Figure 4.4 - Correlation circle of six metabolites, pH and OLR formed by the first three principle components dim1, Dim 2 and Dim 3 representing 33.29, 16.81 and 16.54 % of the total variance, respectively (a) Projections according to the first two factors (Dim 1 and Dim 2). (b) Projects according to the first and third factors (Dim 1 and Dim 3) ............................................................... 176
Figure 4.5 - Daily H2 yields during the different buffalo manure feeding strategies in semi-continuous DF reactor using CHW as main substrate and BM as co-substrate .................................................................................................. 183
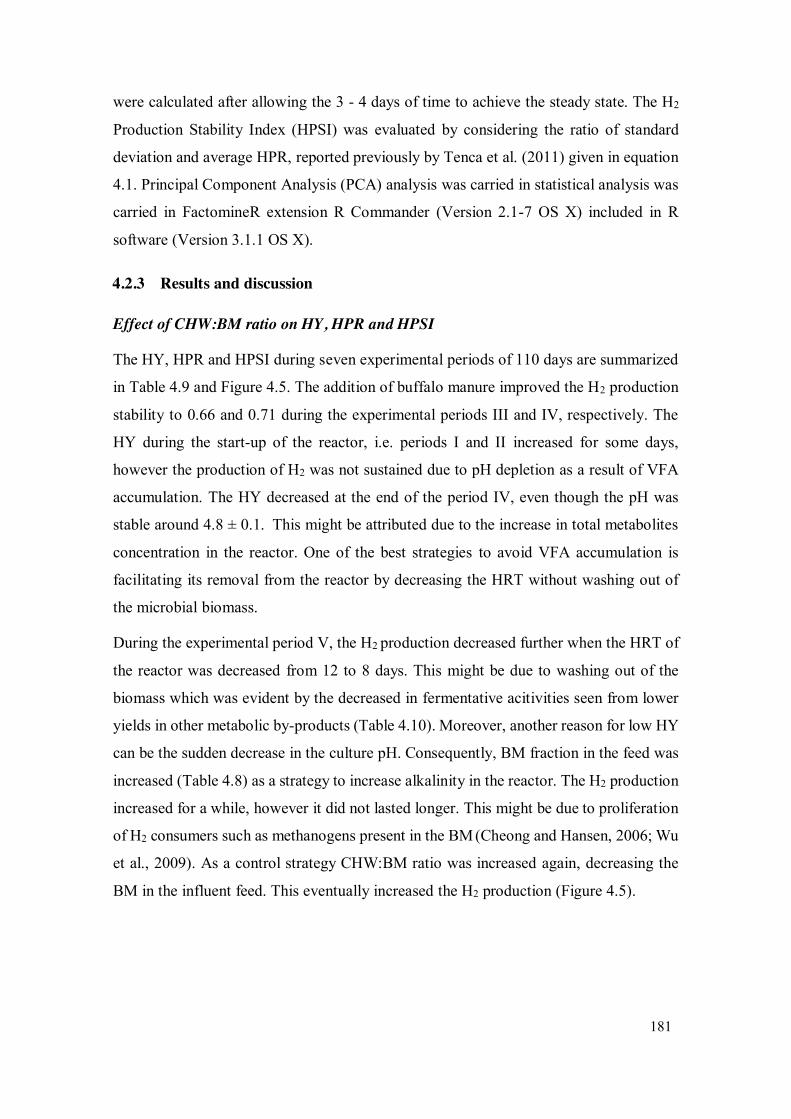
Figure 4.6 - CHW:BM ratio, total alkalinity (as mg CaCO3/L), and ammonium concentration (as NH4
+N/L) (A) and pH trends (B), during the different buffalo manure feeding strategies in a semi-continuous DF reactor .......... 184
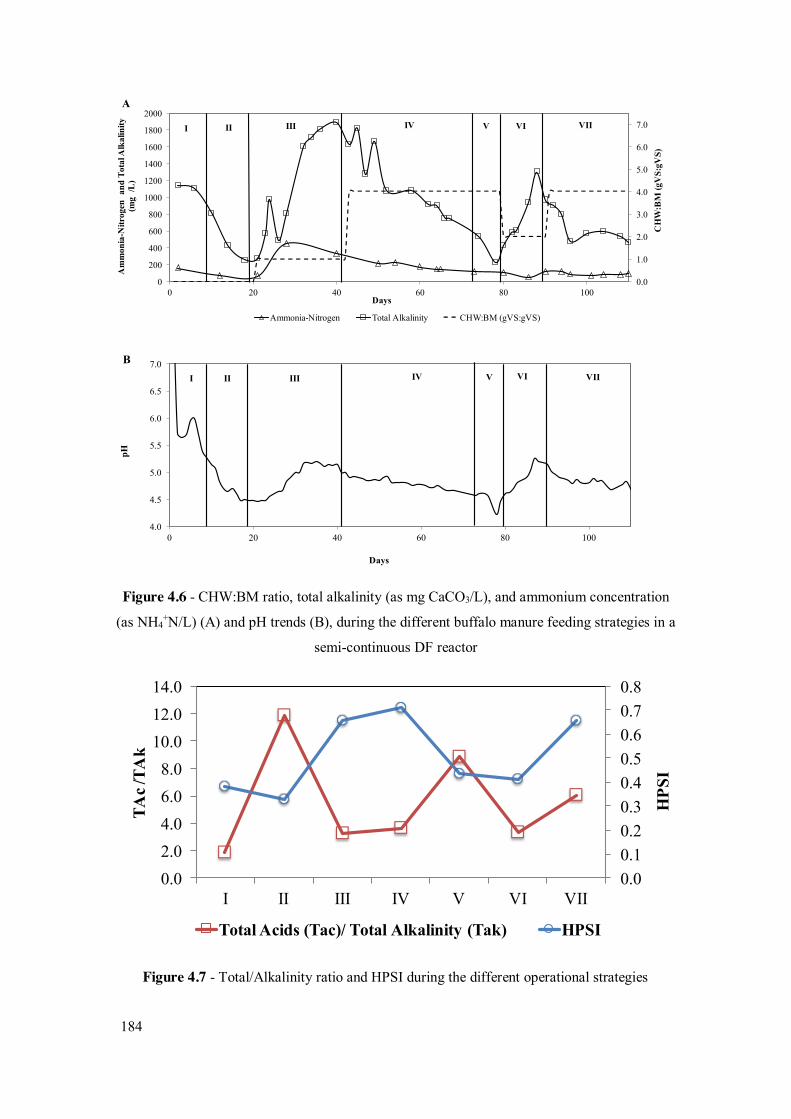
Figure 4.7 - Total/Alkalinity ratio and HPSI during the different operational strategies.................................................................................................. 184
Figure 4.8 - Correlation circle of six metabolites formed by the first two principle components dim1 and Dim 2 representing 26.56 and 23.65 % of the total variance, respectively. .............................................................................. 186
Figure 5.1 - Schematic of the three-stage conversion of FW to hydrogen and methane. .................................................................................................. 195
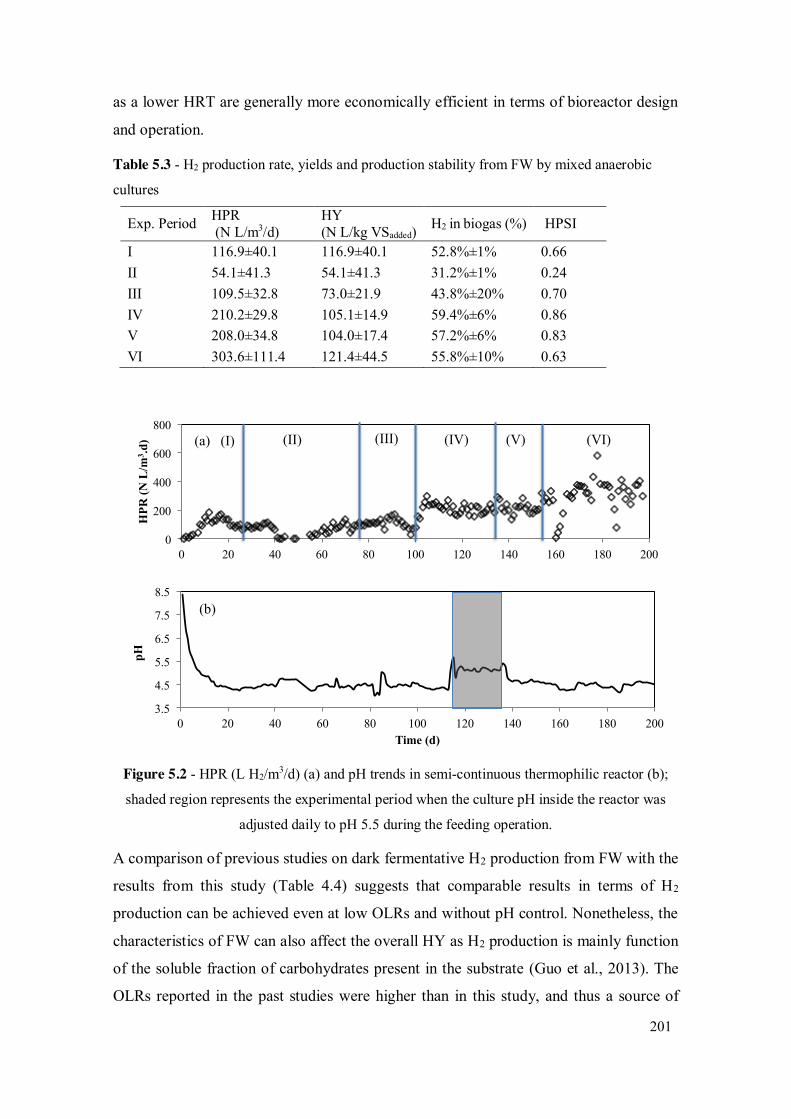
Figure 5.2 - HPR (L H2/m3/d) (a) and pH trends in semi-continuous thermophilic reactor (b); shaded region represents the experimental period when the culture pH inside the reactor was adjusted daily to pH 5.5 during the feeding operation. ................................................................................................. 201
Figure 5.3 - Correlation circle of five metabolites and HY formed by the first three principle components Dim1, Dim 2 and Dim 3 representing 35.00, 18.03 and 16.54 % of the total variance, respectively. Projections according to the first two (Dim 1 and Dim 2) (a) and first and third factors (Dim 1 and Dim 3) (b) ............................................................................................................ 203
Figure 5.4 - Cumulative hydrogen production (a) and depletion of major VFAs (acetate, propionate and butyrate) (b) in a PF tests using DFE and R. sphaeroides AV1b. ...................................................................................................... 204
Figure 5.5 - Methane yields from mesophilic AD of waste stream generated in the coupled DF-PF processes ......................................................................... 206
viii
Figure 5.6 - Cumulative H2 production (A) and VFAs depletion and PHB concentration (B) in the reactor during the test using RS-I medium and Rhodobacter sphaeroides AV1b ................................................................................... 216
Figure 5.7 - Cumulative hydrogen production (A, D) and biomass and PHB concentrations (B, E) and depletion of major VFAs (C, F) in RS-D (left) and PM-D (right) tests .................................................................................... 219
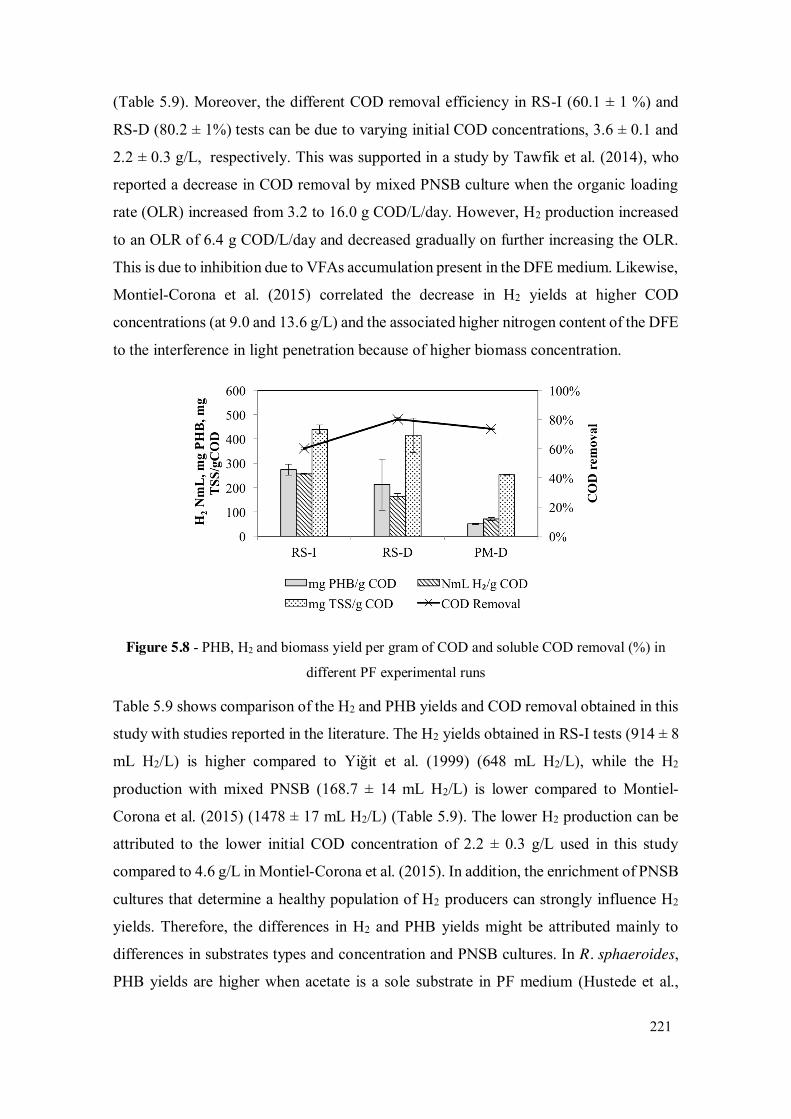
Figure 5.8 - PHB, H2 and biomass yield per gram of COD and soluble COD removal (%) in different PF experimental runs ...................................................... 221
Figure 5.9 - Substrate degradation (in g COD per kg of initial TS) (a); End metabolites accumulation (mM per kg of initial TS) (b); at different TS content ......... 229
Figure 5.10 - Principal component analysis correlation circle plot (a) Hydrogen and major metabolic by-products production. (b) Substrate degradation and metabolic products. .................................................................................. 230
Figure 5.11 - Substrate degradation using FW (in g COD per kg of initial TS) (a); Substrate degradation using FW (in g COD per kg of initial TS) (b); at the end of two fermentation times (14 ≥14 d, 21 ≥ 21 d) and different pH2 of of A = 532 ± 33 mbar, B = 1,086 ± 29 mbar and C = 0 mbar at 25 % TS content ..................................................................................................... 231
Figure 5.12 - Substrate degradation in WS (in g COD per kg of initial TS) (a); Substrate degradation using WS (in g COD per kg of initial TS) (b); at the end of two fermentation times (14 ≥14 d, 21 ≥ 21 d) and different pH2 of A = 552 ± 31 mbar, B= 1,087 ± 30 mbar and C = 0 mbar at 25% TS ............................. 233
ix
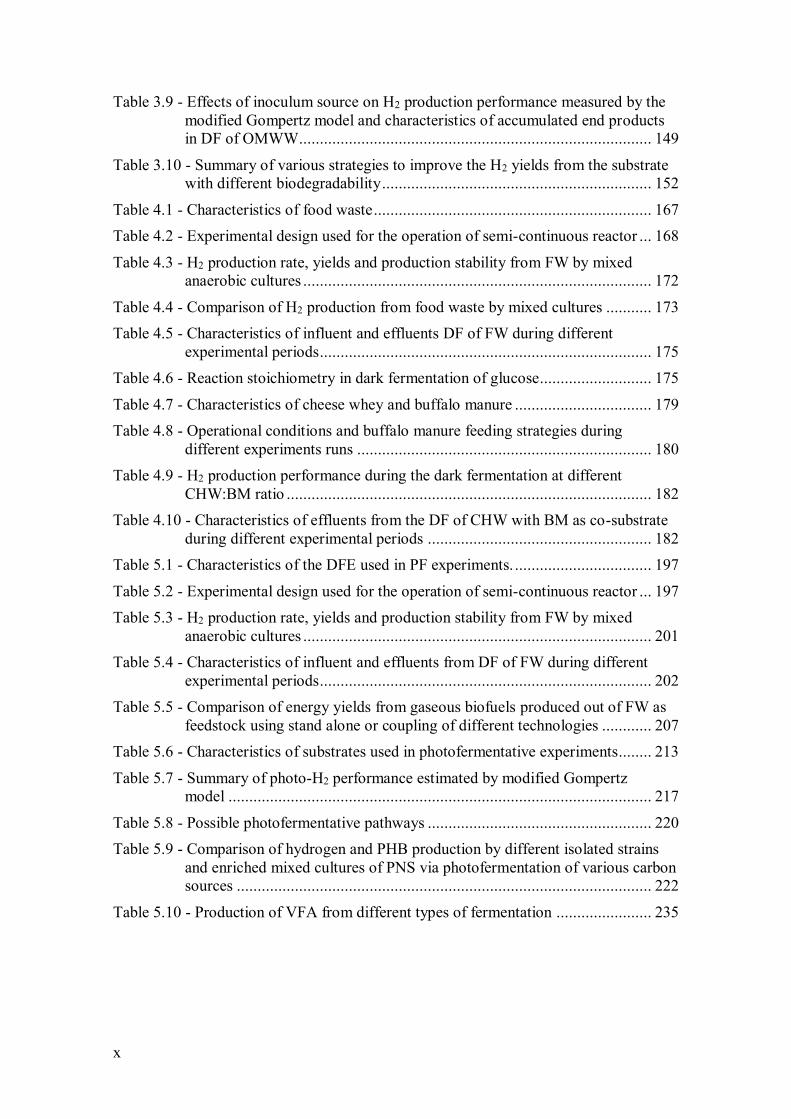
LIST OF TABLES
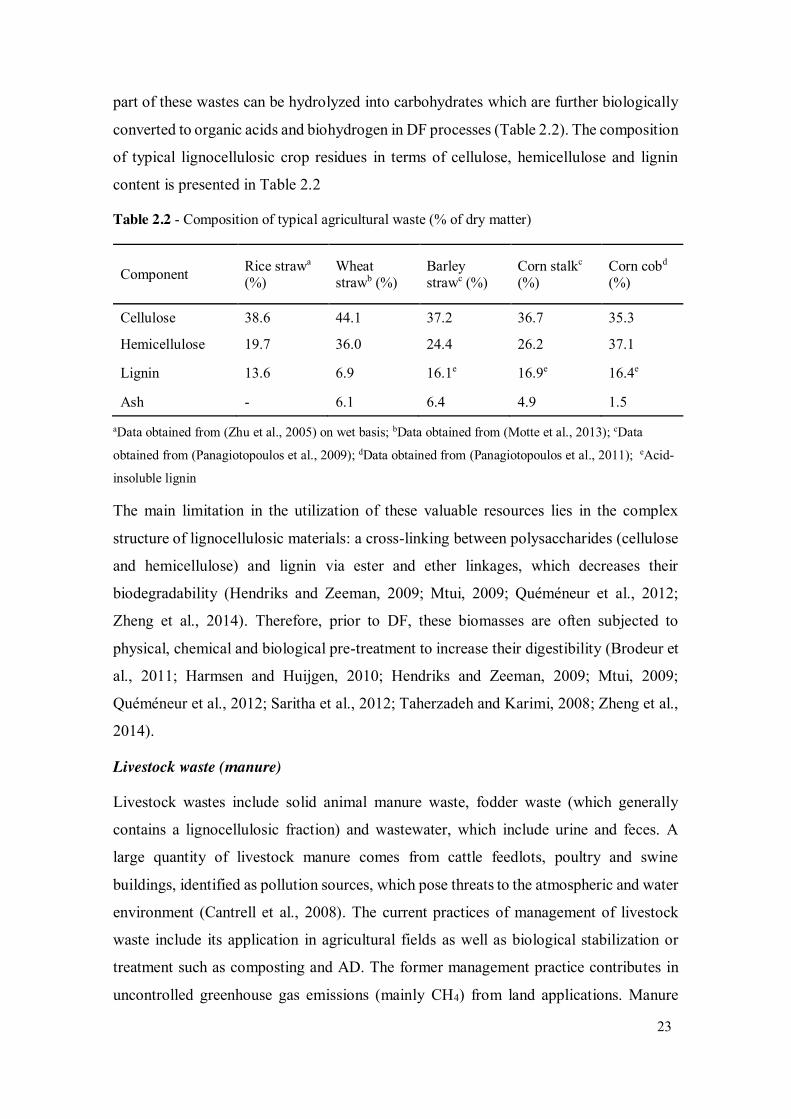
Table 2.1 - Dark fermentative biohydrogen potential of different waste biomass under varying operating conditions ...................................................................... 20
Table 2.2 - Composition of typical agricultural waste (% of dry matter) ...................... 23
Table 2.3 - Biohydrogen production studies using pure culture.................................... 27
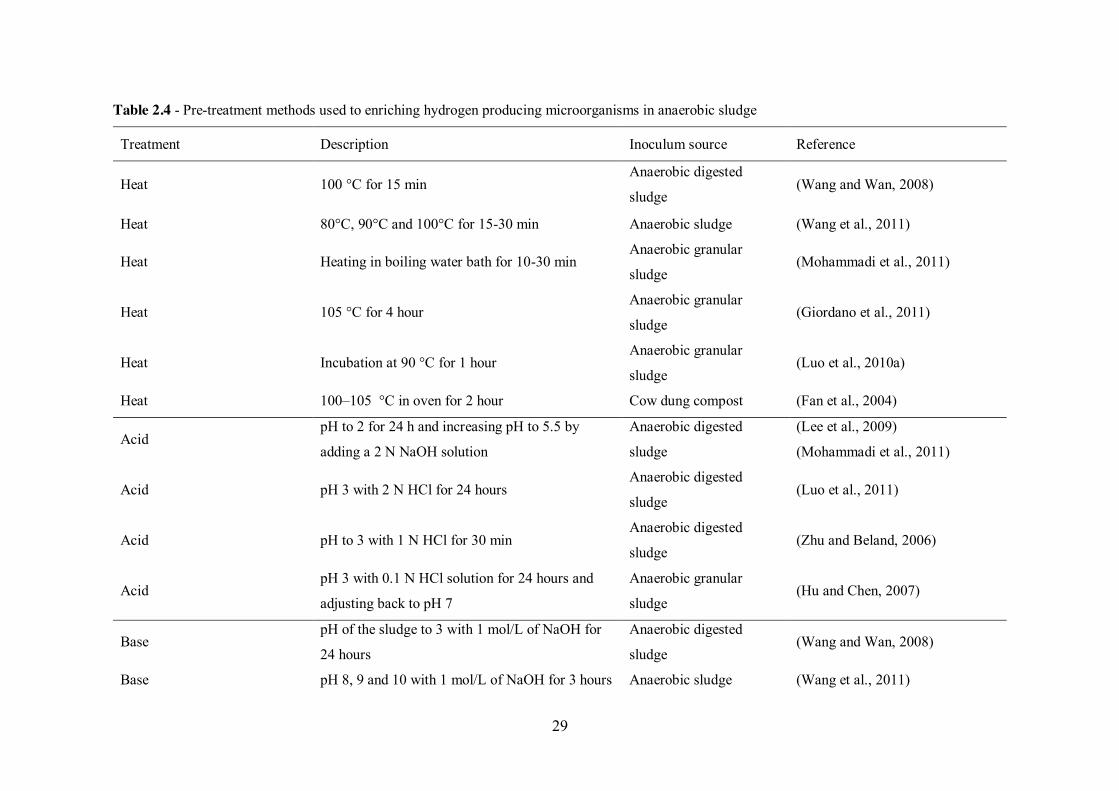
Table 2.4 - Pre-treatment methods used to enriching hydrogen producing microorganisms in anaerobic sludge .......................................................... 29
Table 2.5 - Comparison of various inoculum pre-treatment methods for enriching hydrogen producing inocula ....................................................................... 31
Table 2.6 - Evaluation of inoculum pre-treatment methods to enhance the DF capacity of the inoculum sludge ............................................................................... 32
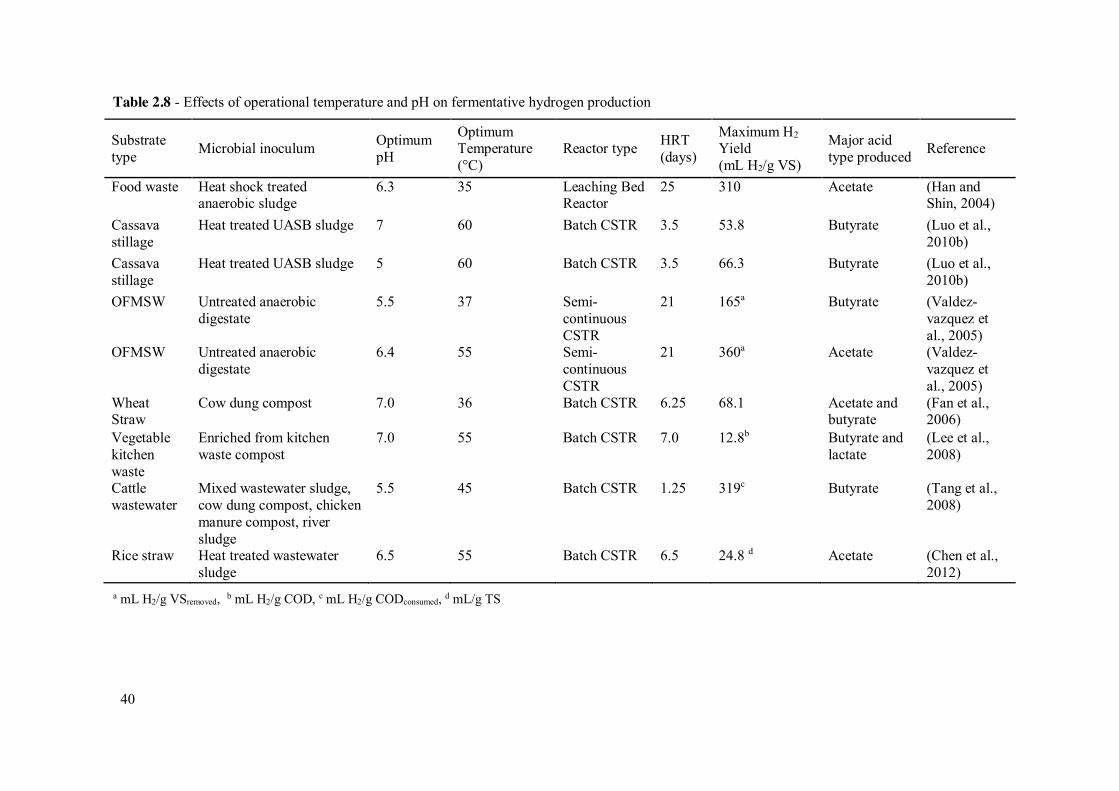
Table 2.8 - Effects of operational temperature and pH on fermentative hydrogen production ................................................................................................. 40
Table 2.9 - Examples of different pre-treatment methods applied to complex substrates used in DF ................................................................................................. 43
Table 2.10 - Examples of operational conditions and system performances of integrated DF systems ................................................................................................ 55
Table 2.11 - Comparison of photo and fermentation dark systems for biohydrogen production ................................................................................................. 69
Table 2.12 - Comparison of photo-H2 production by different isolated and mixed PNSB strains from various inoculum sources ....................................................... 74
Table 2.13 - Comparison of hydrogen and PHB production by different isolated strains and enriched mixed cultures of PNS via photofermentation of various carbon sources ...................................................................................................... 80
Table 2.14 - Variation of different operational parameters in PF studies ...................... 83
Table 2.15 - Comparison of Tubular and Plate PBRs under outdoor conditions ........... 89
Table 3.1 - Effects of biomass pre-treatment methods on biohydrogen production performance during Load I ...................................................................... 129
Table 3.2 - Comparison between Load I and Load II feeding operations.................... 129
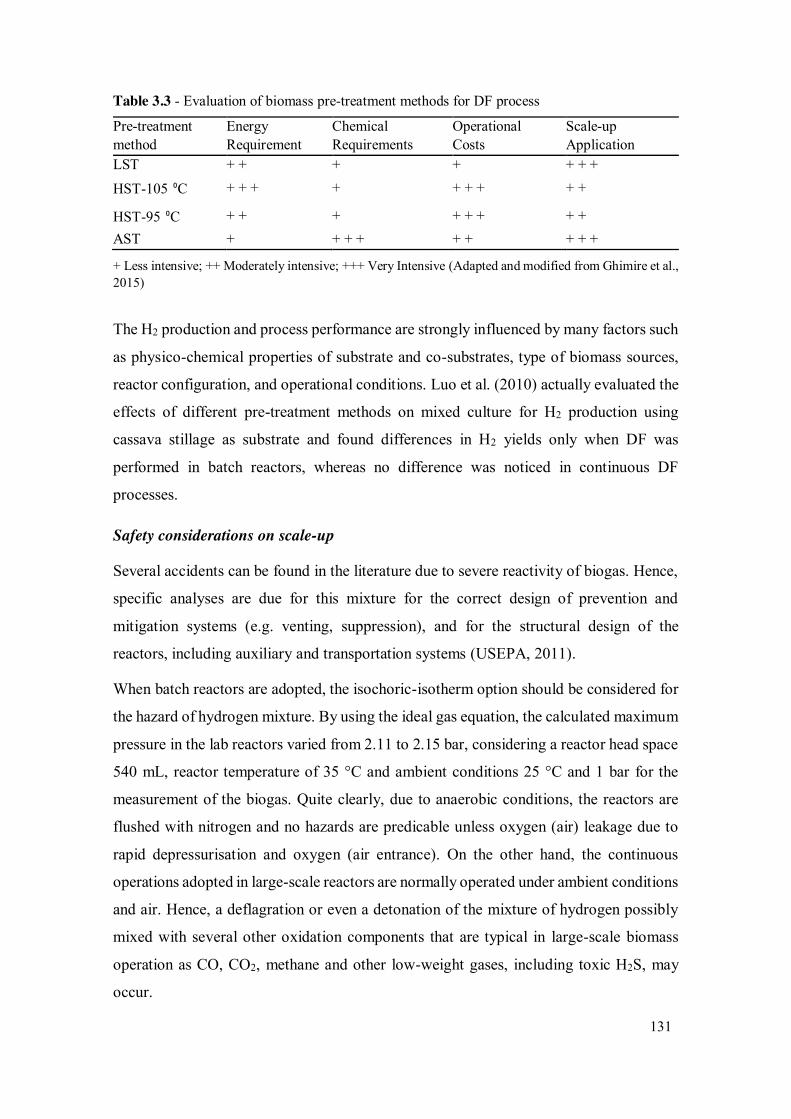
Table 3.3 - Evaluation of biomass pre-treatment methods for DF process .................. 131
Table 3.4 - Characteristics of the substrates and inocula used in this study ................ 137
Table 3.5 - Experimental conditions applied in the DF batch tests of the tested substrates ................................................................................................. 138
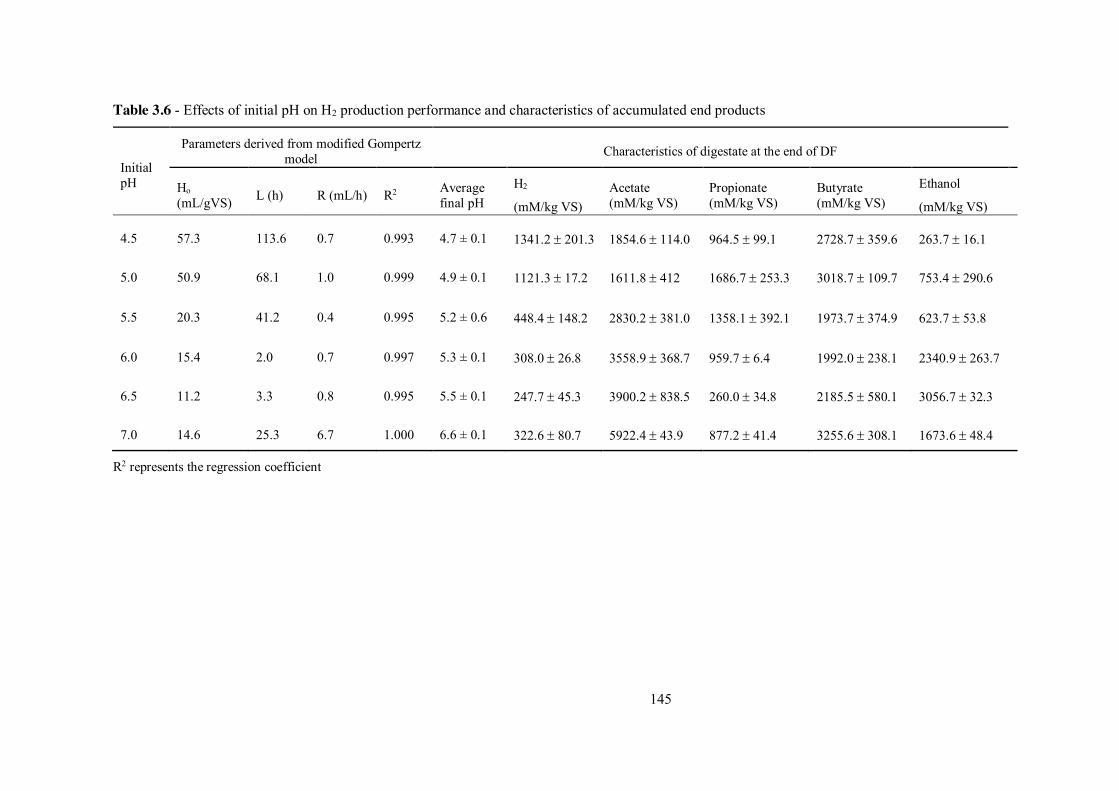
Table 3.6 - Effects of initial pH on H2 production performance and characteristics of accumulated end products ........................................................................ 145
Table 3.7 - Effects of initial pH and F/M ratio on H2 production performance and characteristics of accumulated end products in DF of food waste ............. 146
Table 3.8 - Effect of substrate pre-treatment on biohydrogen production performance measured by the modified Gompertz model ............................................. 149
x
Table 3.9 - Effects of inoculum source on H2 production performance measured by the modified Gompertz model and characteristics of accumulated end products in DF of OMWW..................................................................................... 149
Table 3.10 - Summary of various strategies to improve the H2 yields from the substrate with different biodegradability ................................................................. 152
Table 4.1 - Characteristics of food waste ................................................................... 167
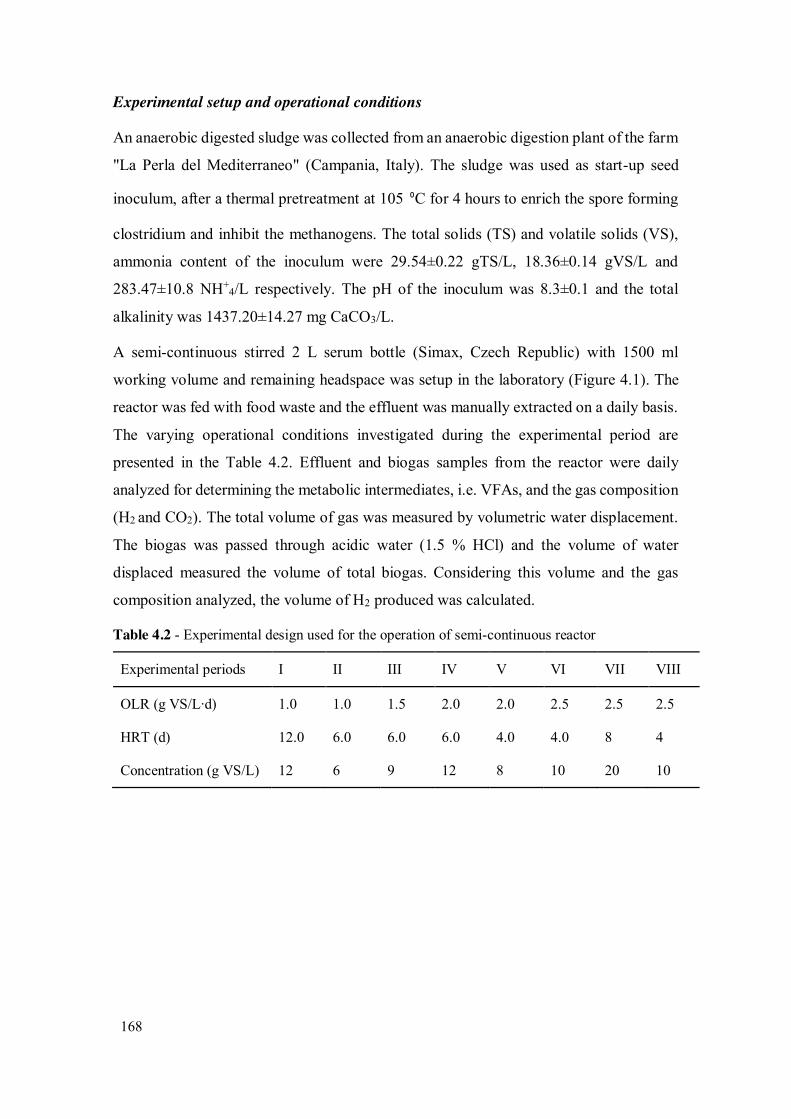
Table 4.2 - Experimental design used for the operation of semi-continuous reactor ... 168
Table 4.3 - H2 production rate, yields and production stability from FW by mixed anaerobic cultures .................................................................................... 172
Table 4.4 - Comparison of H2 production from food waste by mixed cultures ........... 173
Table 4.5 - Characteristics of influent and effluents DF of FW during different experimental periods ................................................................................ 175
Table 4.6 - Reaction stoichiometry in dark fermentation of glucose ........................... 175
Table 4.7 - Characteristics of cheese whey and buffalo manure ................................. 179
Table 4.8 - Operational conditions and buffalo manure feeding strategies during different experiments runs ....................................................................... 180
Table 4.9 - H2 production performance during the dark fermentation at different CHW:BM ratio ........................................................................................ 182
Table 4.10 - Characteristics of effluents from the DF of CHW with BM as co-substrate during different experimental periods ...................................................... 182
Table 5.1 - Characteristics of the DFE used in PF experiments. ................................. 197
Table 5.2 - Experimental design used for the operation of semi-continuous reactor ... 197
Table 5.3 - H2 production rate, yields and production stability from FW by mixed anaerobic cultures .................................................................................... 201
Table 5.4 - Characteristics of influent and effluents from DF of FW during different experimental periods ................................................................................ 202
Table 5.5 - Comparison of energy yields from gaseous biofuels produced out of FW as feedstock using stand alone or coupling of different technologies ............ 207
Table 5.6 - Characteristics of substrates used in photofermentative experiments ........ 213
Table 5.7 - Summary of photo-H2 performance estimated by modified Gompertz model ...................................................................................................... 217
Table 5.8 - Possible photofermentative pathways ...................................................... 220
Table 5.9 - Comparison of hydrogen and PHB production by different isolated strains and enriched mixed cultures of PNS via photofermentation of various carbon sources .................................................................................................... 222
Table 5.10 - Production of VFA from different types of fermentation ....................... 235
xi
ABSTRACT
Low biohydrogen (H2) yields and limited use of process by-products from dark
fermentation (DF) of waste biomass is limiting its scaled-up application. This study aims
to investigate the effects of culture pH, substrate concentration, pre-treatment of substrate
and inoculum adaptation on H2 yields during the DF of three organic wastes biomass (i.e.
food waste, rice straw and olive mill wastewater). The results showed that the
biodegradability of the substrates is important for the selection and application of optimal
operational parameters aimed at enhancing H2 production.
Moreover, long-term operational feasibility and stability of dark fermentative H2
production was demonstrated using food waste and cheese whey in two semi-continuous
thermophilic DF reactors. The effect of Organic Loading Rates (OLRs), Hydraulic
Retention Times (HRTs) and co-substrates (buffalo manure) addition, as a source of
alkalinity, on culture pH and H2 production stability was discussed. The results showed
that combination of OLR, HRT and co-substrate addition could play a vital role in the
culture pH and stability of H2 production.
The by-products of DF process were utilized for H2 production via photo fermentation
(PF), while the waste stream generated from coupling of DF and PF processes was
converted to methane in anaerobic digestion. The three-step conversion of food waste in
a biorefinery concept increased the total energy yields. Moreover, PF also showed a good
potential for concomitant production of H2 and polyhydroxybutyrate (biopolymer).
Likewise, dry fermentation of waste biomass could be promising for the production of
bioenergy and biochemicals (organic acids and alcohols) in a biorefinery concept.
xii
SINTESI
La produzione di Idrogeno mediante Dark-Fermentation (DF) rappresenta ad oggi uno
dei processi biologici più promettenti nel campo della valorizzazione energetica delle
biomasse di scarto. Sebbene, tale bio-tecnologia presenti un potenziale notevole, le basse
rese in termini di produzione di idrogeno e l’assenza di metodologie che prevedano il
riutilizzo dei sottoprodotti di pregio, rendono l’applicazione di tale processo non
sostenibile a scala reale.
Il lavoro risulta articolato in quattro fasi distinte. Nella prima fase sono stati investigati
gli effetti sulla produzione biologica di H2 di specifici parametri operativi. In particolare,
si è proceduto ad analizzare: i) l’effetto del pH, ii) l’effetto combinato del pH e della
concentrazione iniziale di substrato, iii) l’effetto di pretrattamenti del substrato, iv)
l’utilizzo di biomasse microbiche adattate. In fase di sperimentazione sono state utilizzate
tre differenti tipologie di substrato. I risultati hanno mostrato che la biodegradabilità dei
differenti substrati risulta fondamentale nella corretta definizione dei parametri di
processo al fine di massimizzare la produzione di Bio-idrogeno.
La seconda parte dell’attività sperimentale è stata dedicata alla messa a punto e alla
conduzione di due reattori di DF operanti in regime di termofilia e alimentati con frazione
organica di rifiuto solido urbano e reflui caseari, mediante i quali viene dimostrata la
fattibilità e la stabilità del processo di DF nel lungo periodo. Vengono, altresì, discussi
gli effetti dovuti all’applicazione di differenti Carichi Organici (Organic Loading Rates –
OLRs), differenti Tempi di Ritenzione Idraulica (Hydraulic Retention Times – HRTs) e
dell’aggiunta di substrati ad elevato tenore di alcalinità. I risultati hanno dimostrato che
la combinazione di OLR, HRT e l’aggiunta di co-substrato (refluo bufalino) possono
giocare un ruolo fondamentale nella stabilità del processo di DF.
In un contesto di bio-raffineria, nella terza parte del lavoro viene proposto un sistema
integrato costituito dall’abbinamento del processo di Dark Fermentation ai processi di
Photo Fermentation (PF) e di digestione anaerobica (AD). Attraverso tale sistema a triplo
stadio, è stato possibile non solo incrementare la resa energetica totale, ma, aspetto non
trascurabile, ottenere mediante l’applicazione del processo di PF, la sintesi del
biopolimero Poly-Hydroxy-Butyrate (PHB) che può essere utilizzato per la produzione
di bioplastiche.
Infine, nella quarta ed ultima parte dello studio, è stato valutato il processo di DF in
condizioni dry. Tale applicazione ha consentito la contestuale produzione di bio-energia
xiii
e di ulteriori bio-prodotti (e.g. alcoli, acidi organici etc.), amplificando ulteriormente il
concetto di bio-raffineria.
xiv
RÉSUMÉ
La fermentation sombre est un procédé utilisant des déchets organiques dont le passage à
l'échelle pilote est limité par les faibles rendements de production d’hydrogène ainsi que
par l'utilisation des sous-produits métaboliques. Cette étude a pour premier objectif
d'étudier des paramètres opératoires, par exemple, l'effet du pH, de la concentration en
substrat, du prétraitement du substrat et de l'adaptation de l'inoculum microbien sur la
fermentation sombre de trois types de déchets différents (i.e. déchets alimentaires, paille
de riz et les eaux usées de pressoirs à d’olives). Il a été montré que la biodégradabilité des
substrats jouait un rôle majeur dans le choix des paramètres opérationnels utilisés pour
optimiser la production d'hydrogène.
De plus, la faisabilité et la stabilité à long terme de la production d'hydrogène par le
procédé de fermentation sombre ont été observées en utilisant des déchets
agroalimentaires et du petit lait dans deux réacteurs thermophiles fonctionnant en mode
semi-continu. En particulier, il a été discuté de l’influence de la charge organique (OLR),
du temps de rétention hydraulique (HRT) et de l’addition de co-substrats (fumier de
buffle) comme source d’alcalinité. Ainsi, cette étude a permis de montrer que la
combinaison de ces trois paramètres pouvait jouer un rôle important sur le pH et la
stabilité de la production d'hydrogène.
Les sous-produits métaboliques de la fermentation sombre ont également été utilisés pour
produire de l'hydrogène via la photo-fermentation, alors que les déchets générés par le
couplage de la fermentation sombre et de la photo-fermentation ont été valorisés pour la
production de méthane par digestion anaérobie. Ce concept de bioraffinerie basé sur la
conversion en trois étapes des déchets agroalimentaires augmente le rendement
énergétique global du procédé. Par ailleurs, le potentiel important du procédé de photo-
fermentation pour la production concomitante de polyhydroxybutyrate (polymère) et de
l’hydrogène a ainsi été démontré.
En conclusion, la fermentation par voie sèche de déchets organiques pour la production
de bioénergie et de produits biochimiques (i.e. acides organiques et alcools) paraît
prometteuse dans un contexte d’optimisation de la production d’énergies et de
biomolécules au sein d’une bioraffinerie environnementale.
xv
SAMENVATTING
Lage biowaterstof (H2) produktierendementen en beperkt gebruik van bijproducten van
in vergisting (dark fermentaiton, DF) van biomassa beperken de opschaling van dit
process. Deze studie onderzocht het effect van pH, combinatie van substraat concentratie
en cultuur pH, voorbehandeling van het substraat en entmateriaal op de H2 opbrengst via
DF van drie verschillende types afvalbiomassa, met name (i.e. keukenafval, rijststro en
afvalwater van olijfolieproductie. Uit het onderzoek bleek dat de biologische
afbreekbaarheid van de substraten een belangrijke rol speelde bij de selectie en toepassing
van de optimale operationele parameters ter verbetering van de H2-productie.
De operationele haalbaarheid en stabiliteit op lange termijn van H2-productie via DF werd
gedemostreerd met keukenafval en wei in twee semi-continue thermofiele DF reactoren.
Het effect van de organische belasting OLRs), hydraulische retentietijd (HRT) en
toevoeging van co-substraten (buffel mest als bron van alkaliteit) op de cultuur pH en H2
productiestabiliteit zijn bestudeerd. Uit deze studie bleek dat een combinatie van OLR,
HRT en co-substraat toediening een belangrijke rol kunnen spelen in de pH van de
fermentor en de stabiliteit van de H2-productie.
Bovendien werden de bijprodukten van het DF-proces gebruikt voor H2 productie via
photofermentatie (PF), terwijl de afvalstroom gegenereerd uit de koppeling van DF en PF
processen omgezet werd naar methaan via anaërobe vergisting (AD). De drie-staps
conversie van keukenafval in een bioraffinage concept verhoogde de totale energie
opbrengst. Bovendien toonde PF een goede potentie voor de gelijktijdige productie van
H2 en polyhydroxybutyraat (biopolymeer). Ook droge fermentatie kan veel belovend zijn
voor voor de productie van bio-energie en biochemicaliën (VFAs en alcoholen) in een
bioraffinage concept op basis van afvalbiomassa.
xvi
ACKNOWLEDGEMENT
Persuing a doctoral degree was one of the aspirations of my life. I am grateful to all my
friends, colleagues, mentors, supervisors and my family who have continuously inspired
and supported during this journey. I would like to dedicate this Doctoral Thesis to all
these people who did not gave up on me during the difficult times and shared joyful
pleasant time together.
This desertation is a part of the Erasmus Mundus Joint Doctoral Program Environmental
Technologies for Solids, Soils and Sediments (ETeCoS3) developed in collaboration
between the University of Cassino and Southern Lazio (Italy), University of Paris Est
(France) and UNESCO-IHE (the Netherlands) and several other partner institutions. I am
thankful for Erasmus Mundus comminssion for the funding support. Likewise, it has been
a great opportunity to carry out my resaserch activites at the Department of Civil,
Architectural and Environmental Engineering, University of Naples Federico II (Naples,
Italy) and INRA, Laboratoire de Biotechnologie de l’Environnement (Narbonne, France).
First of all, I am thankful to my supervisor Prof. Ing. Giovanni Esposito for his support
throughtout my doctoral studies. I am equally grateful to my co-supervisors Prof. Dr. Ir.
P.N.L. Lens and Prof. Dr. Ing. Francesco Pirozzi for their constant support and guidance
during the PhD desertation. I would like to thank Dr. R. Escudié and Dr. E. Trably for
their guidance and care during my stay at INRA, LBE (Narbonne, France). Moreover, I
do not have enough words to thank my mentor Dr. Ing. Luigi Frunzo for being supportive
and who have become one of my closest friends at the end of my PhD.
Similarly, I would like to thank all my colleagues from the laboratories in Naples, Cassino
and Narbonne with whom I have spent quality time at work and outside. I am thankful to
Vincenzo, Alberto, Maria Rosaria, Marco, Fabio, Serena, Ester, Amelia and Martha from
Naples for the joyful time in the laboratory in Naples (Italy). I am thankful to all the
collegues from LBE, INRA, Narbonne (France) for their immense help and
companionship during my stay there. Finally, I would like to thanks my parents Madav
and Kalpana and my brothers Anup and Anil for their continuous inspirations and support
throughout all these years.
1
CHAPTER 1
INTRODUCTION
2
1.1 Background and problem statement
The global reserves of fossil fuels are depleting due to their increasing consumption in
energy and chemical sectors. In addition, environment is facing severe pollution problems
due to the gaseous emissions (NOx, SOx, CO, CO2, etc.) and waste generated from the
production and use of fossil fuels. The scientific community has widely accepted the fact
that the increasing CO2 levels has impacted global warming phenomena, which is
threatening the entire earth’s ecosystem (Ciais et al., 2013). Therefore, a current need is
to explore and invest in alternative ways to harness the energy and chemicals from the
clean renewable sources that are carbon neutral and can reduce the global CO2 emissions
at the same time.
In this context, hydrogen gas (H2) could represent a promising alternative energy carrier
due to its social, economic and environmental credentials (Kotay & Das, 2008). The net
energy content of the H2 per unit mass is higher than other conventional fuels. The lower
heating value (LHV) of hydrogen varies between 2.4-2.8 and is 4 times higher than that
of methane, gasoline and coal respectively (Marbán & Valdés-Solís, 2007). H2 is a
carbon-free clean fuel as the ultimate by-products of combustion is only water. Thus, H2
carries a long term potential to reduce consumption of fossil fuels that can be helpful in
combating global warming and pollution problems.
A preliminary major challenge in the use of this promising source of energy carrier lies
in the sustainable production of H2. In commercial applications, H2 have been produced
from natural gas by steam reforming process, coal gasification and water electrolysis
(Kotay & Das, 2008; Manish & Banerjee, 2008). At present, steam reforming of methane
is the cheapest H2 production method. However, for the equivalent amount of energy, it
is four times more costly than gasoline (Crabtree et al., 2004). Bartels et al. (2010)
reported an estimated cost of 0.36-1.83 $/kg and 2.48-3.17 $/kg for H2 production from
coal and natural gas, respectively. H2 from conventional sources are economically
convenient compared to biological routes for H2 production (i.e. thermophilic dark
fermentation process), which costs about $28.35/kg H2 (€21/kg H2 with €1=$1.35 in
2011) (HYVOLUTION, 2011). In a study, Das, (2009) reported a low production cost of
energy as H2 from dark fermentation of sewage sludge ($1.3/Million British Thermal unit,
MBTU) compared to natural gas ($2–$7/MBTU, in 2007) and gasoline ($23.5/MBTU in
2008).
3
However, most of the physical and chemical H2 production processes are highly energy
intensive and/or dependent on fossil fuels. Moreover, the physical and chemical
technologies do not reduce the consumption of fossil fuels or CO2 emissions. This only
shifts the point of CO2 emissions to H2 producing industries from vehicular emissions or
emission from stationary hydrogen power stations, which makes them less attractive from
environmental point of view. On the other hand, H2 produced from biological processes,
also known as biohydrogen is expected to be less energy intensive and can be produced
H2 can be produced biologically by autotrophic as well as heterotrophic microorganisms
(Hallenbeck & Ghosh, 2009) (detailed in Chapter 2). Autotrophic conversions are
mediated by microalgae utilizing inorganic carbondioxide as a carbon source whereas
heterotrophs convert the organic carbon sources into simpler compounds producing
molecular H2. There are two types of heterotrophic conversions; one driven by light
energy (photofermentation) and other that occurs in absence of light (dark fermentation).
Dark fermentation (DF) represents one of the most promising and cost-effective
technologies for biohydrogen production due its faster conversion efficiencies. Moreover,
DF process can utilize wide range of renewable complex waste biomass as feedstock and
production of other valuable platform biochemicals of economic interest (Ghimire et al.,
2015a). Currently, the major barriers in application of DF in scaled-up systems for H2
production are: low H2 yields and the high cost of production mainly due to the high cost
of feedstock (Ren et al., 2011). Moreover, an inherent challenge of DF systems is to
maximize the process conversion efficiencies, utilization and valorization of the by-
products and minimize the ecological footprint of the process by reducing the water and
energy input to the process.
In order to achieve a scaled-up development of dark fermentative processes, an immediate
attention is required to improve H2 yields utilizing the low cost materials like waste
biomass such as agricultural residues, organic waste generated from municipalities and
industries, that could also give competitive economic advantage (Chong et al., 2009;
Kapdan & Kargi, 2006). The H2 yields and production rates can be enhanced by
optimizing the operational parameters such as culture pH and temperature and substrate
concentration as well as by inoculum enrichment and substrate pre-treatment (Guo et al.,
2010; Urbaniec & Bakker, 2015). Moreover, knowledge gaps in the long-term operational
4
feasibility of the DF process for continuous H2 production needs to be filled for its
development.
The by-products of DF process, which mostly includes volatile fatty acids (VFAs), lactic
acid, alcohols and un-hydrolyzed residues, can be utilized in other biological systems for
their valorization by energy recovery or can be used as a feedstock in production of
platform chemicals of economic interests (Agler et al., 2011; Bastidas-Oyanedel et al.,
2015; Ghimire et al., 2015a). The dark fermentation effluent (DFE) can be converted to
H2 photo fermentation (PF) process, which is mediated by purple non sulfur bacteria
(PNSB). In addition to H2 production, PNSB are known to synthesize
polyhydroxybutyrate (PHB), a precursor for biopolymers (Hustede et al., 1993).
Likewise, un-utilized biomass residues as well as the waste streams generated from
coupling of DF and PF process can be further converted to methane in anaerobic digestion
process (Ghimire et al., 2015b). In this way, utilization of DF by-products can lead to
realization of a biorefinery concept that could help in industrial development of DF
technology. Moreover, Solid State Dark Fermentation (SSDF) process has been recently
proposed for biorefinery concept due to its inherent characteristics such as higher process
yields and less energy and water requirements (Motte et al., 2015; Elsamadony and
Tawfik, 2015). Therefore, a study of major limitations in SSDF is necessary to exploit
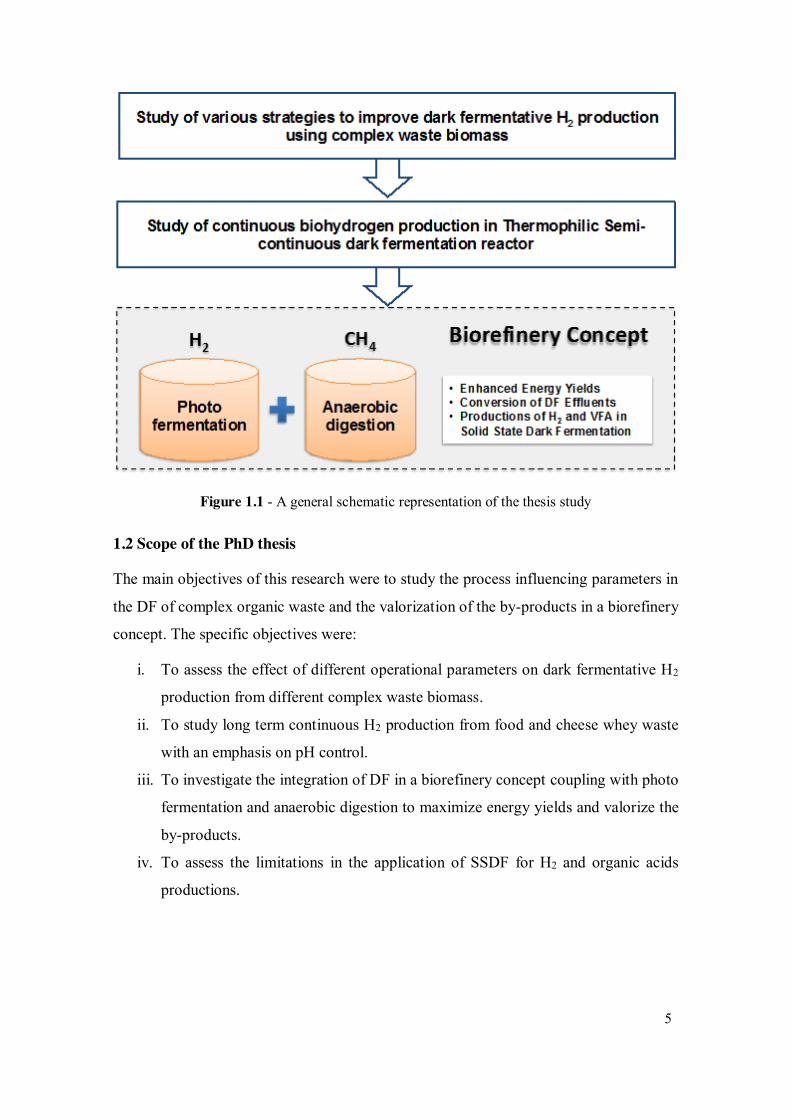
this technology. In this context, a general scheme of the present doctoral research is
reported in Figure 1.1.
5
Figure 1.1 - A general schematic representation of the thesis study
1.2 Scope of the PhD thesis
The main objectives of this research were to study the process influencing parameters in
the DF of complex organic waste and the valorization of the by-products in a biorefinery
concept. The specific objectives were:
i. To assess the effect of different operational parameters on dark fermentative H2
production from different complex waste biomass.
ii. To study long term continuous H2 production from food and cheese whey waste
with an emphasis on pH control.
iii. To investigate the integration of DF in a biorefinery concept coupling with photo
fermentation and anaerobic digestion to maximize energy yields and valorize the
by-products.
iv. To assess the limitations in the application of SSDF for H2 and organic acids
productions.
6
To achieve these four major aims, the research activities that were carried out are outlined
as follows:
Chapter 1 explains the motivation, hypothesis and scheme of the doctoral research.
Chapter 2 provides the comprehensive state-of-art in parameters influencing the DF of
complex waste biomass and use of by-products. Moreover, it also discusses the potential
application of photofermentation processes to valorize the dark fermentation by-products
by H2 and biopolymer production.
Chapter 3 presents the influence of different operational parameters in DF of complex
waste biomass. Various operational parameters such as inoculum sources and enrichment
methods, pH, temperature and substrate concentration were studied.
Chapter 4 demonstrates the effects of different reactor operating conditions, such as
organic loading rates (OLRs) and hydraulic retention times (HRTs), on long-term
operational feasibility of H2 production. This chapter also discusses the use of low OLRs
and co-substrate addition as pH controlling strategies using food waste and cheese whey
waste, respectively, in two separate studies.
Chapter 5 discusses the potential for the integration of DF process in a biorefinery
concept. The coupling with photofermentation and anaerobic digestion by using DFE was
studied to explore the potential for futher energy recovery. Similarly, this section presents
the prospective of photofermentation process for maximizing the valorization of DFE via
concomitant H2 and biopolymer production. Moreover, possible limitations during the
conversion of waste biomass in SSDF were studied.
Chapter 6 highlights the major findings and the implications of the research and provides
future recommendations.
7
REFERENCES
Bartels, J.R., Pate, M.B., Olson, N.K., 2010. An economic survey of hydrogen production from conventional and alternative energy sources. Int. J. Hydrogen Energy 35, 8371–8384.
Chong, M., Sabaratnam, V., Shirai, Y., Ali, M., Hassan, M.A., 2009. Biohydrogen production from biomass and industrial wastes by dark fermentation. Int. J. Hydrogen Energy 34, 3277–3287.
Ciais, P., Sabine, C., Bala, G., Bopp, L., Brovkin, V., Canadell, J., Chhabra, a., DeFries, R., Galloway, J., Heimann, M., Jones, C., Quéré, C. Le, Myneni, R.B., Piao, S., Thornton, P., France, P.C., Willem, J., Friedlingstein, P., Munhoven, G., 2013. 2013: Carbon and Other Biogeochemical Cycles. Clim. Chang. 2013 Phys. Sci. Basis. Contrib. Work. Gr. I to Fifth Assess. Rep. Intergov. Panel Clim. Chang. 465–570.
Crabtree, G.W., Dresselhaus, M.S., Buchanan, M. V., 2004. The Hydrogen Economy. Phys. Today 57, 39.
Das, D., 2009. Advances in biohydrogen production processes: An approach towards commercialization. Int. J. Hydrogen Energy 34, 7349–7357.
Das, D., Veziroglu, T.N., 2001. Hydrogen production by biological processes : a survey of literature 26, 13–28.
Elsamadony, M., & Tawfik, A. (2015). Potential of biohydrogen production from organic fraction of municipal solid waste (OFMSW) using pilot-scale dry anaerobic reactor. Bioresource Technology, 196, 9–16. http://doi.org/10.1016/j.biortech.2015.07.048.
Ghimire, A., Frunzo, L., Pirozzi, F., Trably, E., Escudie, R., Lens, P.N.L., Esposito, G., 2015a. A review on dark fermentative biohydrogen production from organic biomass: Process parameters and use of by-products. Appl. Energy 144, 73–95.
Ghimire, A., Valentino, S., Frunzo, L., Trably, E., Escudié, R., Pirozzi, F., Lens, Piet N.L., Esposito, G. 2015b. Biohydrogen production from food waste by coupling semi-continuous dark-photofermentation and residue post-treatment to anaerobic digestion: A synergy for energy recovery. International Journal of Hydrogen Energy, 1–11.
Guo, X.M., Trably, E., Latrille, E., Carrère, H., Steyer, J.-P., 2010. Hydrogen production from agricultural waste by dark fermentation: A review. Int. J. Hydrogen Energy 35, 10660–10673.
Hallenbeck, P.C., Ghosh, D., 2009. Advances in fermentative biohydrogen production: the way forward? Trends Biotechnol. 27, 287–97.
HYVOLUTION, 2011. Non-thermal production of pure hydrogen-Final Activity Report. Wageningen, The Netherlands.
Kapdan, I.K., Kargi, F., 2006. Bio-hydrogen production from waste materials. Enzyme Microb. Technol. 38, 569–582.
Kotay, S.M., Das, D., 2008. Biohydrogen as a renewable energy resource -Prospects and potentials. Int. J. Hydrogen Energy 33, 258–263.
Manish, S., Banerjee, R., 2008. Comparison of biohydrogen production processes 33, 279–286.
8
Marbán, G., Valdés-Solís, T., 2007. Towards the hydrogen economy? Int. J. Hydrogen Energy 32, 1625–1637.
Motte, J.-C., Sambusiti, C., Dumas, C., & Barakat, A. (2015). Combination of dry dark fermentation and mechanical pretreatment for lignocellulosic deconstruction: An innovative strategy for biofuels and volatile fatty acids recovery. Applied Energy, 147, 67–73.
Ren, N., Guo, W., Liu, B., Cao, G., Ding, J., 2011. Biological hydrogen production by dark fermentation: challenges and prospects towards scaled-up production. Curr. Opin. Biotechnol. 22, 365–70.
Urbaniec, K., Bakker, R.R., 2015. Biomass residues as raw material for dark hydrogen fermentation – A review. Int. J. Hydrogen Energy 40, 3648–3658.
9
CHAPTER 2
STATE OF THE ART IN DARK FERMENTATION OF COMPLEX WASTE BIOMASS BY MIXED CULTURE AND UTILIZATION OF DARK
FERMENTATION EFFLUENTS IN PHOTO FERMENTATION
The section 2.1 of this chapter has been published as Ghimire, A., Frunzo, L., Pirozzi, F., Trably, E.,
Escudie, R., Lens, P.N.L., Esposito, G., (2015). A review on dark fermentative biohydrogen production
from organic biomass: Process parameters and use of by-products. Applied Energy 144, 73–95
The section 2.2 of this chapter has been submitted as Ghimire, A., Luongo, V., Frunzo, L., Pirozzi, F.,
a Calculated based on the information provided from references at Standard Temperature (0°C and Pressure 1 atm), bHS :Heat shock, cBESA:2-bromoethanesulfonic
Clostridium thermocellum 7072 Corn stalks 740 140 (Cheng and Liu,
2011)
Klebsiella sp. TR17 Glycerol 48 128.6b (Chookaew et al., 2015)
amL H2/g COD is calculated from the data provided in the publications bmL H2/g COD consumed The photofermentative H2 production efficiency can also be measured as photochemical
efficiency (PE), which is an efficiency parameter with which the light is utilized to
produce energy stored as hydrogen in a PF process. The PE depends on the
70
photosynthetically active radiation (PAR) range, which determines the light energy
absorbed by the photofermentative species. For example, green algae have a PAR range
of 400-700 nm, while the range for PNSB is 400-950 nm (Figure 2.11). Akkerman et al.
(2002) reported the PE values vary between 3 to 10% in green algae. Redwood et al.
(2012) achieved a 71% increase in combined photosynthetic activity by illuminating both
Rhodobacter sphaeroides and Arthrospira (Spirulina) platensis by dividing a single beam
of simulated sunlight using a dichroic mirror.
Figure 2.11 - Sunlight and light absorption by purple bacteria (Akkerman et al., 2002)
In addition to H2 yield and the other parameters mentioned before, the performance of a
PF process can be evaluated by the light conversion efficiency. Light or solar energy
conversion efficiency can be calculated as the ratio of total energy produced, i.e. stored
in the form of H2, to the total energy input to the bioreactor (energy as photons in case of
solar conversion efficiencies). The light conversion efficiency (η) can be calculated with
an empirical formula, i.e. the ratio of the total energy (heat of combustion) value of
hydrogen to energy input to the PBR by solar radiation (Koku et al. 2002). The η can be
evaluated as
η (%) =[33.61 · ρH2 · VH2 ]
[I · A · t] · 100 (2.20)
Where,
VH2 is the volume of produced H2 in l,
Sunlight intensity
71
ρH2 is the density of the produced hydrogen gas in g/l,
I is the light intensity in W/m2,
A is the irradiated area in m2 and
t is the duration of hydrogen production in hours.
Koku et al. (2002) reported a varying range of light conversion efficiencies between 1–
5% on the average for different strains of Rhodobacter sphaeroides. According to the best
of knowledge of the authors, a PE higher than 10% has not been reported so far. However,
a wide range of approaches to increase the PE has been suggested in the literature,
including the design of efficient PBR and improving lighting conditions (Adessi and De
Philippis 2014; Chen et al. 2011), genetic modifications of PNSB for enhancing
nitrogenase activity (Ozturk et al. 2006), reduction of the pigment content for higher light
uptake (Kondo et al. 2002), deletion or inactivation of the genes responsible for PHB
synthesis (Kim et al. 2011; Franchi et al. 2005) and developing hydrogenase deficient
(hup-) mutant PNSB strains responsible for H2 uptake (Franchi et al. 2005; Uyar et al.
2015).
2.2.3 Operating conditions of PF
PNSB inoculum
PNSB are widely distributed in nature and prefer aquatic environments with low oxygen
concentrations, significant amounts of soluble organic matter, moderate temperatures and
weak as well as stronger light conditions (Imhoff et al. 2005). Besides freshwater,
members of the PNSB group can also be found in marine and hypersaline environments
and even in sediments that are exposed to light. These organisms can also thrive in
thermal springs and alkaline soda lakes (Imhoff et al., 2005). An eutrophic lake is an
example of a favorable habitat for members of these genera (Imhoff et al. 2005; Bianchi
et al. 2010).
Rhodopseudomonas palustris, Rhodobacter sphaeroides, Rhodobacter capsulatus and
others are the most studied PNSB stains. However, PNSB strains capable of utilizing the
substrates and light at higher conversion efficiencies are of research interest. Many studies
have successfully isolated H2 producing PNSB strains from different mixed consortia.
72
Some examples of isolated H2 producing PNSB and their H2 yields and production rates
are presented in Table 2.12.
Afsar et al. (2011) carried out PF studies using different PNSB strains, which showed the
PF efficiency highly depends on the effluent composition and bacterial strain used. The
PF was carried out using the effluents from the thermophilic DF of glucose and potato
steam peel hydrolysate as carbon source under indoor batch conditions. The PNS strains,
such as Rhodobacter capsulatus (DSM1710), Rhodobacter capsulatus hup- (YO3),
The substrate types and their concentration used in PF can influence the H2 production
rates and yields. Han et al. (2012) studied the effect of different carbon sources and their
concentrations on the photo-H2 production using a batch culture of Rhodobacter
sphaeroides RV. The substrates used were either individual substrates such as acetate,
propionate, butyrate, lactate, malate, succinate, ethanol, glucose, citrate or sodium
carbonate or mixed carbon sources such as malate and succinate, or lactate and succinate.
The results of the study showed that the H2 production for the mixed substrates is higher
(794 mmol H2/mol substrate for 2.02 g/L lactate and 2.0 g/L succinate) than using a single
substrate (424 mmol H2/mol substrate for 0.8 g/L sodium propionate). This makes PF
prominent for the application in the treatment of DFE that typically contains more than
one organic acid (Nasr et al. 2014; Rai et al. 2014).
Effect of OLR and HRT
Similarly, the OLR and HRT could affect the performance of PBRs as they determine the
substrate degradation efficiency and the hydrogen production rate. Mohan et al. (2008)
studied the effect of different OLRs on photo-H2 production and substrate degradation
efficiency. The synthetic wastewater gave the maximum substrate degradation efficiency
(1.4 kg COD/m3/day) at an OLR of 2.45 kg COD/m3/day, while higher specific H2
production (19.29 mol H2/kg CODremoved) was achieved at an OLR of 1.4 kg COD/m3/day
with 45% COD removal. In another study, Tawfik et al. (2014) studied the effect of
varying OLR (3.2 to 16 kg COD/m3/day) using mixed PNSB cultures, which resulted in
maximum H2 production at an OLR of 6.4 kg COD/m3/day. Increasing OLR caused VFAs
accumulation, which might inhibit the PNSB. Therefore, inhibition of the nitrogenase
activity resulted in decreasing H2 production when the OLR was higher than 6.4 kg
COD/m3/day (Tawfik et al. 2014). This is supported by another PF study carried out with
acid hydrolyzed wheat starch and a pure culture of Rhodobacter sp. (Kapdan et al. 2009).
The results of the study showed that, upon increasing the initial sugar concentration from
2.2 to 13.0 g/L, the H2 yield (H2Y) increased, with a maximum H2Y achieved at 5 g/L
(143.5 mL H2/g COD).
A range of optimum HRT, varying from 2.5 h (Tawfik et al., 2014) to 3 days (Ozmihci
and Kargi 2010) has been reported in the literature for achieving higher photo-H2
76
production in a continuous reactor. Tawfik et al. (2014) found an optimum HRT at 2.5 h
(0.97 ± 0.12 LH2/gCODremoved/d), when studying a range of HRT from 0.9 to 4.0 h. They
also observed the improvement in removal efficiency of butyrate and lactate when the
HRT was increased. Similarly, another study carried out with mixed PNSB by Zhang et
al. (2015) showed that varying HRTs from 12 to 72 h significantly affected the H2Y with
the highest H2Y of 482.4 mmol H2/L obtained at a HRT of 36 h. In contrast, Ozmihci and
Kargi (2010) obtained the highest H2Y and production rate at an HRT of 72 h during PF
of DFE using Rhodobacter sphaeroides. The differences in optimum HRT may be
attributed to differences in PNSB strains, substrate concentration, carbon to nitrogen ratio
(C/N) and other operating conditions such as pH, temperature and light intensity.
Effect of C/N ratio
The carbon to nitrogen ratio plays an important role in the growth of PNSB, photo-H2 and
PHB production. However, higher levels of nitrogen inhibit H2 production while higher
C/N ratios enhance the production of PHB (Eroglu et al. 1999; Koku et al. 2003; Argun
et al. 2008; Waligórska et al. 2009). A low C/N ratio can result in the accumulation of
ammonia, which inhibits the nitrogenase and thus the H2 production process. Therefore,
it is always desirable to have nitrogen-limited conditions in the PBR. Due to the nitrogen
requirements for bacterial photosynthetic metabolism and inhibition of nitrogenase at
higher ammonium concentrations, there is a tradeoff between the minimum amount of
nitrogen for bacterial growth and non-inhibiting levels.
A range of C/N ratios has been reported in the literature, i.e. from as low as 8 to as high
as 120. Eroglu et al. (1999) reported the optimum C/N ratio of 15 mM to 2 mM (malic
acid to glutamic acid) for the maximum hydrogen production rate. In another study, Boran
et al. (2010) reported a C/N ratio of 45 with 40 mM of acetic acid and 2 mM of sodium
glutamate in PF by Rhodobacter capsulatus in a solar tubular photobioreactor under
outdoor conditions. Similarly, Argun et al. (2008) reported the optimum total VFAs and
NH+4-N concentrations of 2350 mg/L and 47 mg/L, respectively, for increasing the H2
production by Rhodobacter sphaeroides strains. In another study (Eroğlu et al. 2009), the
highest H2 production potential of 19.9 m3 H2/m3 was obtained from olive mill wastewater
with the highest C/N molar ratio of 73.8.
Waligórska et al. (2009) found that accumulation of PHB increased by 30 fold when the
C/N ratio increased from 6 to 120 in R. sphaeroides. However, the amount of PHB
77
accumulation mainly depends on the PNSB strains and the other process operational
conditions (De Philippis et al., 1992; Montiel-Corona et al., 2015). As PHB biosynthesis
is a H2 competing pathway, its concomitant production with H2 could raise future
interests, as PHB possesses economic value as a biodegradable polymer (Koku et al.
2002). Some of the results from previous studies on H2 and PHB production in PF
processes are summarized in Table 2.13.
Micronutrients
Microorganisms need different micronutrients such as iron and nickel for their
metabolism and growth. The PF process relies on the photosynthetic electron transport
systems from which bacteria obtain their energy (Figure 2.10). The constituents of the
electron transport systems such as cytochromes are Fe protein complexes and PNSB
strains have 24 Fe atoms in each nitrogenase (Zhu et al., 2007). Another electron carrier,
ferrodoxin, also contains Fe. Thus, Fe limitation can influence the metabolism of PNSB
and production of H2.
Uyar et al. (2009) found that the hydrogen yield increases from 0.3 to 1.0 L/Lculture when
iron was added to micronutrient. They suggested 0.1 mM of ferric citrate as optimum
concentration for hydrogen production. Similarly, Zhu et al. (2007) studied the effect of
ferrous ion (0 - 3.2 mg/l) on PF using Rhodobacter sphaeroides and found that the photo-
H2 production was significantly suppressed when Fe2+ was limited. The H2 production
increased when increasing the Fe2+ concentration and reached the maximum at the
concentration of 2.4 mg/l. In another study, Rai et al. (2014) studied the effects of Ni2+,
Fe2+ and Mg2+ on the PF of cheesewhey for H2 production, and showed significant effects
of Ni2+ and Fe2+ supplementation on H2 yields. However, the presence of nickel might
also enhance the hydrogenase activity, which takes up the H2 produced by the nitrogenase
activity, thus decreasing the net H2 production yield (Li and Fang, 2009).
Presence of bicarbonate
Some studies have shown that addition of bicarbonate and carbonate ions enhances the
H2 production in PF (Montiel-Corona et al., 2015; Takabatake et al., 2004). Bicarbonate
and carbonate function as electron acceptors and enhance the utilization of butyric and
propionic acids, while their absence unbalances the oxidation-reduction potential
resulting in decreased H2 production. Takabatake et al. (2004) reported that the presence
78
of carbonate improves assimilation of ammonium (NH4+) and VFAs. They also observed
that the uptake of acetate releases carbonate, however it was not enough to promote
butyrate and propionate consumption, which are more oxidative than bacterial cells. For
PNSB growth on butyrate, each mole of butyrate requires 0.7 mol of CO2 (Montiel-
Corona et al. 2015).
Effect of light intensities and wavelength
The light conversion efficiency (η) varies for different PNSB strains because of their
different light harvesting antenna pigments, thus they have a different photosynthetically
active radiation (PAR) range. However, η also depends on the light intensity, illuminated
area of the PBR, reactor design and other operational conditions of the PF process.
Generally, the intensity of light has a positive influence on the H2 production. There are
some studies dedicated to assess the effect of the light intensity on growth and H2
production by PNSB (Koku et al. 2002; Uyar et al. 2007; Sevinç et al. 2012; Androga et
al. 2014; Akman et al. 2015).
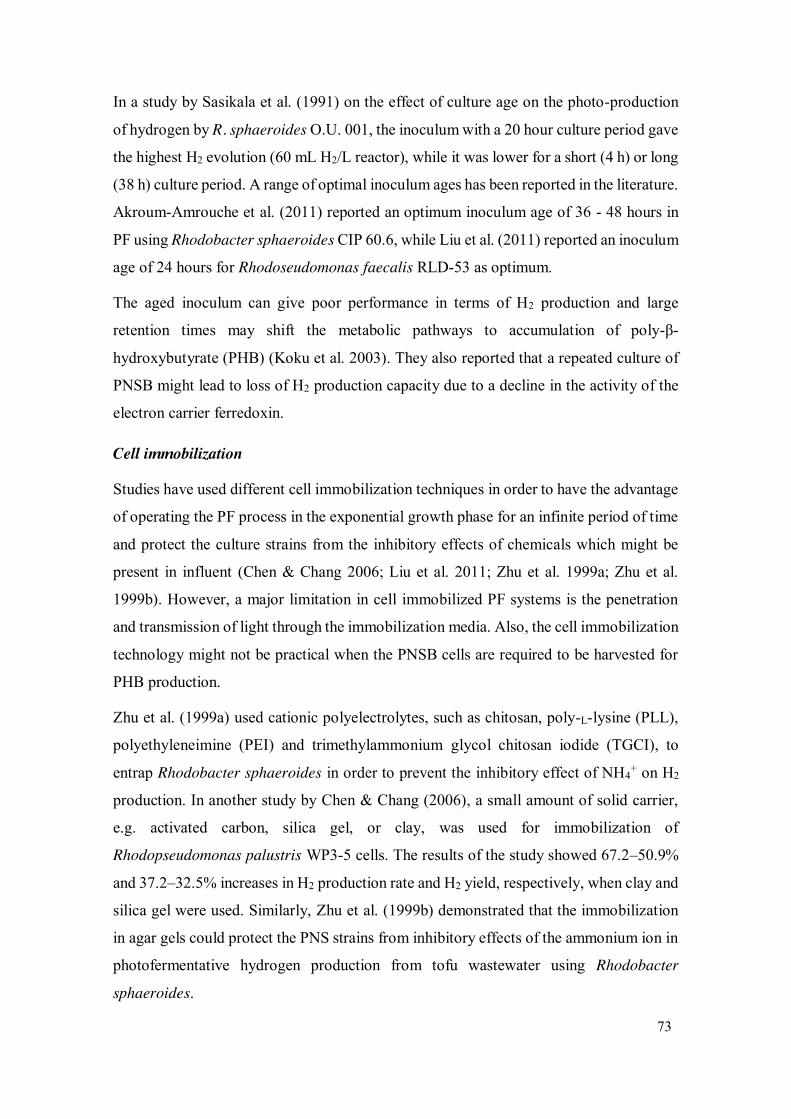
Uyar et al. (2007) studied the effect of intensity of light, light wavelength and illumination
protocol on the growth and H2 production by Rhodobacter sphaeroides O.U. 001 in
photobioreactors (Figure 2.12). The hydrogen production increased with increasing the
light intensity and the highest production was reached at 270 W/m2. The results also
showed the decrease in photoproduction of hydrogen by 39% when there is a lack of
infrared light (750-950 nm wavelength). The substrate conversion efficiency was
increased and hydrogen production was stimulated when the light was illuminated after
inoculation and no hydrogen was produced during the dark periods.
Sevinç et al. (2012) studied the effect of temperature (20, 30 and 38 °C) and light intensity
(1500, 2000, 3000, 4000 and 5000 lux) on the kinetic parameters and hydrogen
production in PF of acetic and lactic acid using Rhodobacter capsulatus. The results of
the study reported the maximum hydrogen production at 5000 lux for 20 °C and 3000 lux
for 30 and 38 °C. In a more recent study, Androga et al. (2014) established an optimal
light intensity and temperature of 287 W/m2 (4247.6 Lux) and 27.5 °C, respectively, in
PF tests carried out using R. capsulatus DSM 1710 in a medium containing acetate, lactate
and glutamate. In another recent study, Akman et al. (2015) reported an optimum light
intensity of 263.6 W/m2 (3955 lux) in a PF study carried out with acetate as the carbon
source and R. capsulatus, which is in accordance with the study from Androga et al.
79
(2014), that established 287 W/m2 as optimum light intensity in PF carried out using R.
capsulatus.
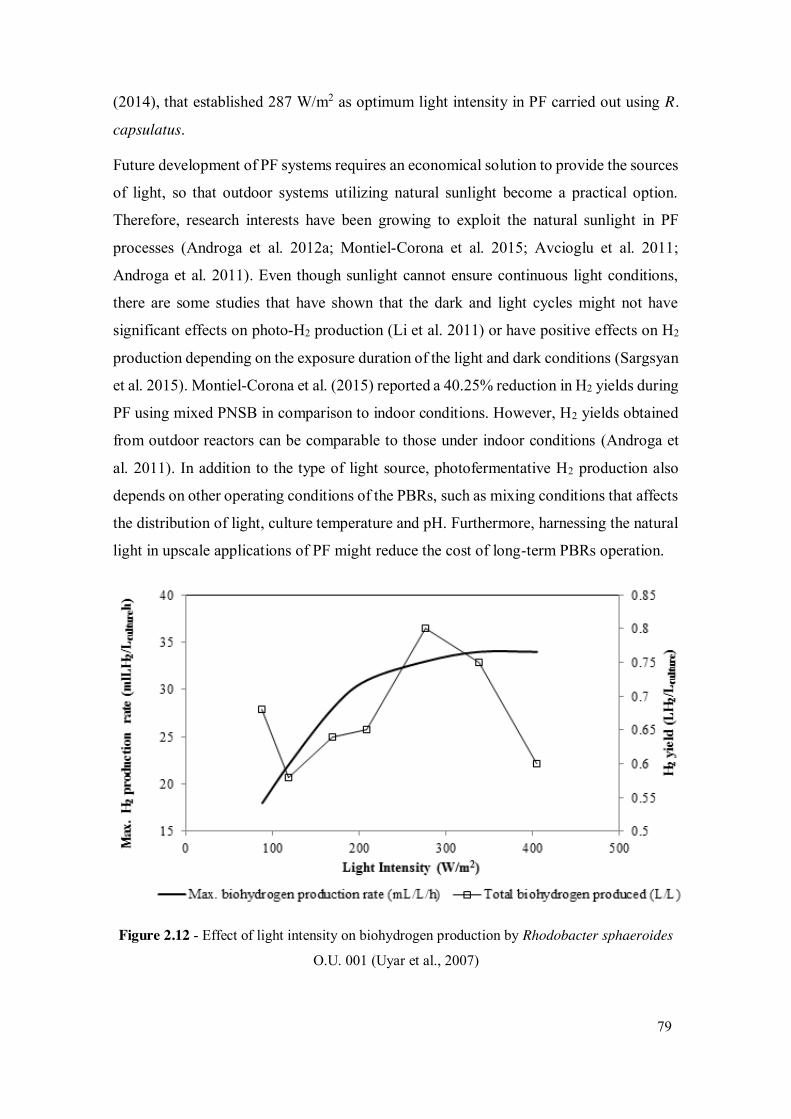
Future development of PF systems requires an economical solution to provide the sources
of light, so that outdoor systems utilizing natural sunlight become a practical option.
Therefore, research interests have been growing to exploit the natural sunlight in PF
processes (Androga et al. 2012a; Montiel-Corona et al. 2015; Avcioglu et al. 2011;
Androga et al. 2011). Even though sunlight cannot ensure continuous light conditions,
there are some studies that have shown that the dark and light cycles might not have
significant effects on photo-H2 production (Li et al. 2011) or have positive effects on H2
production depending on the exposure duration of the light and dark conditions (Sargsyan
et al. 2015). Montiel-Corona et al. (2015) reported a 40.25% reduction in H2 yields during
PF using mixed PNSB in comparison to indoor conditions. However, H2 yields obtained
from outdoor reactors can be comparable to those under indoor conditions (Androga et
al. 2011). In addition to the type of light source, photofermentative H2 production also
depends on other operating conditions of the PBRs, such as mixing conditions that affects
the distribution of light, culture temperature and pH. Furthermore, harnessing the natural
light in upscale applications of PF might reduce the cost of long-term PBRs operation.
Figure 2.12 - Effect of light intensity on biohydrogen production by Rhodobacter sphaeroides
O.U. 001 (Uyar et al., 2007)
80
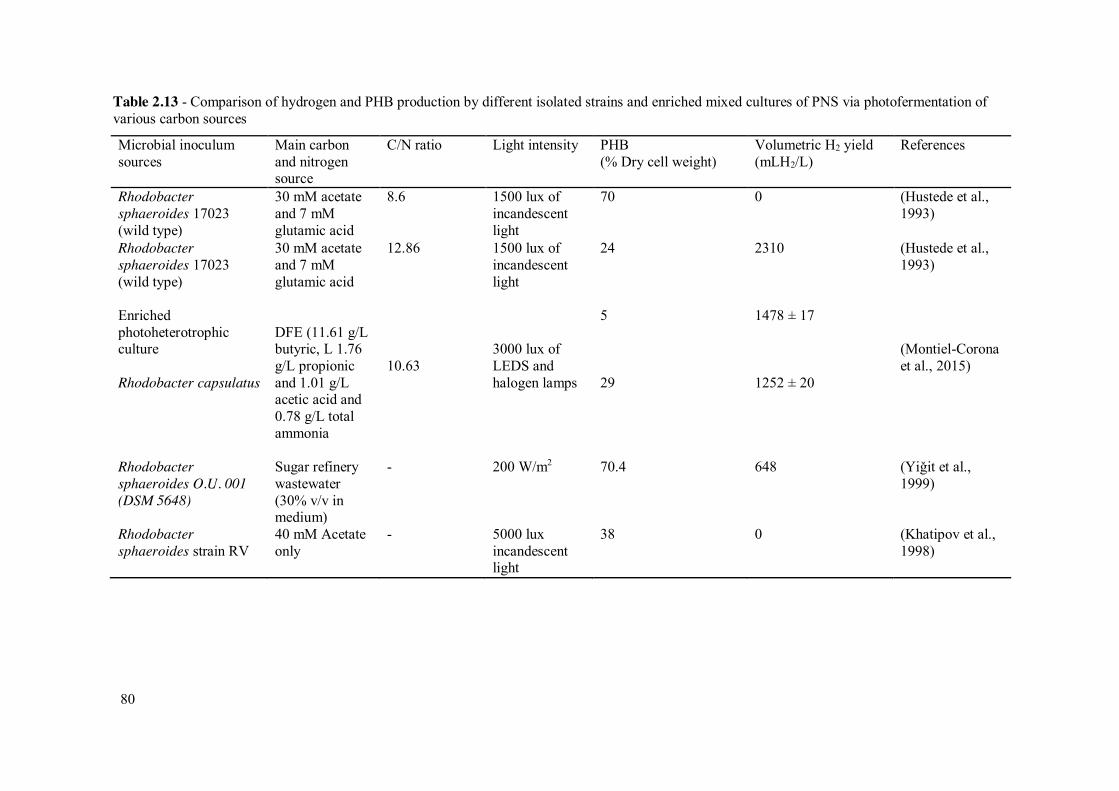
Table 2.13 - Comparison of hydrogen and PHB production by different isolated strains and enriched mixed cultures of PNS via photofermentation of various carbon sources
Microbial inoculum sources
Main carbon and nitrogen source
C/N ratio Light intensity PHB (% Dry cell weight)
Volumetric H2 yield (mLH2/L)
References
Rhodobacter sphaeroides 17023 (wild type)
30 mM acetate and 7 mM glutamic acid
8.6 1500 lux of incandescent light
70 0 (Hustede et al., 1993)
Rhodobacter sphaeroides 17023 (wild type)
30 mM acetate and 7 mM glutamic acid
12.86 1500 lux of incandescent light
24 2310 (Hustede et al., 1993)
Enriched photoheterotrophic culture
DFE (11.61 g/L butyric, L 1.76 g/L propionic and 1.01 g/L acetic acid and 0.78 g/L total ammonia
10.63
3000 lux of LEDS and halogen lamps
5 1478 ± 17 (Montiel-Corona et al., 2015)
Rhodobacter capsulatus 29 1252 ± 20
Rhodobacter sphaeroides O.U. 001 (DSM 5648)
Sugar refinery wastewater (30% v/v in medium)
- 200 W/m2 70.4 648 (Yiǧit et al., 1999)
Rhodobacter sphaeroides strain RV
40 mM Acetate only
- 5000 lux incandescent light
38 0 (Khatipov et al., 1998)
81
Culture temperature and pH
The operating temperature of a culture is one of the important parameters that affects the
bacterial metabolism or metabolic pathways as well as substrate conversion efficiency
and thus H2 production. Basak and Das (2007) reported 31 to 36 °C as optimum
temperature for Rhodobacter sp., while Androga et al. (2014) reported 26.8 °C (and 285
W/m2) as optimum culture temperature for a higher H2 yield. Moreover, culture pH affects
the biochemical reactions as it determines the ionic form of the active sites for enzymatic
activity (Chen et al., 2011). PF studies have been carried out in the pH range varying
between 5.5 to 7.5 (Table 2.12 and 2.14). Akroum-Amrouche et al. (2011) reported an
optimum pH of 7.5 (± 0.1) for the H2 production by Rhodobacter sphaeroides, while Nath
and Das (2009) have reported an optimum H2 production at pH 6.5 for the same PNSB
species. This difference of change in optimum pH can be attributed to the difference in
substrate type used in PF experiments as lactate was used as a sole carbon source in the
former, while DF spent medium was used in the latter study. In another study, Koku et
al. (2002) reported an optimum pH of 7.1 - 7.3 for the activity of the nitrogenase enzyme,
while the range of 6.5 to 7.5 is optimum for the activity of the hydrogenase enzyme.
During most of the PF tests, pH has shown an increasing trend which could be due to
PHB production (Khatipov et al. 1998; Nath and Das 2009). Eroglu et al. (1999) reported
a slight decrease in pH during the bacterial growth phase and pH increase during H2
production. The effluents from DF are generally in the acidic pH range (Ghimire et al.
2015), and are required to be adjusted to a pH range 6.5 – 7.5 to ensure the optimum
operating conditions in the PF process. However, the range of optimum pH seems to be
dependent on the PNSB species. Some studies by Tawfik et al. (2014) and Tao et al.
(2008) have shown the feasibility of H2 production by mixed PNSB at pH 5.5 - 6.0, which
is generally an ideal pH range of DFE obtained from DF processes.
Effect of mixing
Mixing is required in PBRs to keep the PNSB biomass suspended and uniformly
distribute the substrates and nutrients in the culture medium. Moreover, mixing ensures
the uniform distribution of light throughout the PBRs, avoiding light gradients. It also
helps to maintain sufficient mass transfer, which generally includes the exchange of
gases, i.e. H2 and CO2. Akroum-Amrouche et al. (2011) found unstable H2 production
82
with a 13.0% and 60.8% reduction of the average and maximum H2 production rate when
mixing was stopped during the exponential phase of PF. In another study, Li et al. (2011)
reported that mixing during the H2 production phase of the PNSB stationary growth phase
as vital for higher H2 yields than during the exponential cell growth phase. Moreover, the
type of mixing system may also affect the photo-H2 production performance. Zhang et al.
(2015) showed that baffled PBRs can outperform magnetic-stirred PBRs as supported by
higher H2 yields as well as faster cell growth and substrate conversion. This higher H2
production can be attributed to enhanced gas transfer and distribution of light in the PBRs
due to well mixing conditions.
Inhibition of photo-H2 production
Nitrogenase plays an important role in the hydrogen generation. Thus, the presence of
chemical substances that disrupt the nitrogenase activity decreases the photo-H2
production. Koku et al. (2002) reported that the presence of N2 and NH4+ inhibit the H2
production. Also CO, EDTA and O2 are likely to inhibit the nitrogenase activities.
Similarly, an elevated level of CO2 inside the reactor inhibits the photo-H2 production,
while lower levels (4 - 18% w/v) favor the growth phase of PNSB and thus H2 production
(See Carbon sources and nutrients requirements). Furthermore, a lower C/N ratio does
not favor photo-H2 production as it could result in the accumulation of ammonium and
inhibition of nitrogenase in a PF process for H2 production.
83
Table 2.14 - Variation of different operational parameters in PF studies
Figure 2.13 - Schematic representation of the potential PBRs for PF
Plate reactors
Plate reactors are flat panels which consist of a rectangular transparent box with a depth
vary between 1-5 cm (Akkerman et al. 2002). These reactors have received research
attention for photo-H2 production because of their large illumination area and possibilities
of scaling up and suitability in outdoor conditions. Flat plate PBRs are constructed with
86
cheap materials, which are generally transparent to achieve the maximum utilization and
conversion of solar energy.
Eroglu et al. (2008) investigated the performance of an 8 L flat plate PBR under outdoor
operating conditions using a culture of Rhodobacter sphaeroides O.U.001. Among the
different carbon sources such as malate, lactate, acetate and olive mill wastewater used in
the PF, the highest hydrogen production rate (10 mLH2/L/h) was reached with malate as
carbon source and formate was found to be the dominant end product. Ugwu et al. (2008)
reported the following potential problems that flat plate systems can face during scale up:
x requirement of many compartments and support materials
x difficulty in operational temperature control
x wall growth resulting in reduced light penetration
Tubular reactors
Tubular PBRs contain a long transparent tube with a length ranging from 10 to 100 meters
and diameters ranging from 3 to 6 cm (Akkerman, et al. 2002). These PBRs are one of
the most suitable reactors for outdoor conditions. Generally, tubular PBRs are constructed
with transparent glass or plastic tubes. The culture is recirculated with a mixing system
(such as a pump) to provide efficient mass transfer and equal light distribution.
Boran et al. (2010) successfully developed and demonstrated a pilot scale (80 L) tubular
PBR for photofermentation of acetate using Rhodobacter capsulatus in outdoor operating
conditions (during winter seasons) in Ankara (Turkey). The PBR gave an average molar
productivity of 0.31 mol H2/m3/h during daylight hours and the gas contained 99%
hydrogen and 1% carbon dioxide by volume. The system provided an overall hydrogen
yield of 0.6 mol H2/mol acetate and the H2 production with respect to the total illuminated
surface area amounted to 0.112 mol H2/m2/day.
Ugwu et al. (2008) reported some limitations that tubular PBRs face during scale up:
x difficulty in operational temperature control
x fouling and growth on the walls of the tubes
x large space requirements
One of the major problems during the scaling up of tubular PBRs is the decrease in
illumination surface to volume ratio because of the increase in diameter of the tube. This
87
causes a decrease in light intensity (light shading effect) for the cells at the lower part of
the tube, which negatively affects the cell growth. However, a good mixing system
provides also an efficient light distribution (Ugwu et al. 2003).
Vertical-column reactors
Vertical-column reactors have been subject of research for algal biomass production as
they are compact, have low cost and are easy to operate (Ugwu et al., 2008). Bubble
columns, airlift reactors and annular column reactors are common vertical-column PBR
configurations (Posten 2009). Bubble column reactors have a larger diameter than tubular
reactors and are frequently used indoor (at a larger lab scale) or outdoor. Because of the
larger diameters in these reactors, darker zones are created at the center of the column,
which might be disadvantageous for photosynthetic bacterial growth. Besides these three
major reactors types, laboratory scale PF research has been carried out in internally
illuminated reactors (Chen et al. 2010). Dasgupta et al. (2010) have briefed the possibility
of using different configurations such as torus shaped and helical reactors.
The concept of an annular column reactor aims to overcome the problem associated with
the central darker zones in bubble column reactors (Posten 2009). The major advantages
of this reactor configuration are high mass transfer rate, good mixing conditions with less
shear on bacterial cells, low energy consumption and potential for industrial application.
However, the small illumination surface makes this configuration less competitive than
other counterparts.
Comparison between panel and tubular PBRs
Table 2.15 compares studies done in various configurations of PBRs. Flat panel and
tubular reactors have the highest theoretical efficiencies and have been used at pilot scale
under outdoor conditions (Boran et al. 2010; Eroglu et al. 2008; Gebicki et al. 2010).
These studies opened perspectives for scaling up of these two promising PBRs for photo-
H2 production using PNSB cultures. In some lab scale studies, higher H2 productivities
were obtained with flat panel PBRs, while some studies with tubular PBRs have shown
good performance under outdoor light conditions. Moreover, tubular PBRs are easier to
manage and scale-up.
Photo-H2 production through PF can be a promising technology for clean energy
recovery. In addition, recovery of PHB can be of further interest. To establish PF as post
88
treatment of DFE, more research needs to be performed for improving the system
efficiency through optimization of different operating parameters. The system efficiency
can be improved by providing optimum culture conditions and bioreactor design. The PF
systems have been presented as the bottlenecks in the integrated DF-PF process because
of their higher production cost. Thus, innovative low-cost mixing, heating and cooling
systems need to be explored and PBR designs for improving the surface area to volume
(A/V) ratio require future research. Moreover, PHB can add economic value to the PF
process. Using mixed PNSB to utilize the conversion efficiencies of different microbial
consortia can give an economic advantage by the reducing cost of H2 production.
89
Table 2.15 - Comparison of Tubular and Plate PBRs under outdoor conditions PNS strains Carbon
source PBR type Volume in
liters (Dimension)
Operations conditions
Maximum H2 yield
Maximu H2 production rate
LH2/m3/h
Productivity per
illuminated surface area LH2/(m2·d)
Productivity per ground
area LH2/(m2·d)
Light conversion efficiency
References
Rhodobacter capsulatus DSM155
Acetate, sodium
lactate and glutamate
Flat-panel 4×25 L Summer (Aachen, Germany)
- 12.3 3.69 29.52 0.20% (Gebicki et al., 2010)
Rhodobacter capsulatus DSM156
Acetate, sodium
lactate and glutamate
Tubular 60 L (0.12 m dia. & 0.65 m length)
Summer (Aachen, Germany)
- 6.3 3.35 3.35 0.19% (Gebicki et al., 2010)
Rhodobacter capsulatus DSM 1710
Acetate, lactate and glutamate
Tubular 80 L Winter (Ankara, Turkey)
15% 6.9 2.46 1.74 1% (Boran et al., 2010)
Rhodobacter capsulatus
YO3 (Hup_)
Acetate and glutamate
Flat-panel 4 L Summer (Ankara, Turkey)
53% 11.4 1.5 4.93 - (Androga et al., 2011)
Rhodobacter capsulatus
YO3 (Hup_)
Acetate and glutamate
Tubular 90 L Outdoor Conditions (Ankara, Turkey)
35% 0.4 mol H2/(m3·h) 0.432 mol H2/(m2·d)
0.3 mol H2/(m2·d)
0.20% (Boran et al., 2012)
Arthrospira platensis M2
(cyanobacteria)
CO2 Tubular 34 L Summer (Florence,
Italy)
- 1.26 mol H2/(L·d) 32.95 mol H2/(m2·d)
- 5.6% a (Tredici & Zittelli, 1998)
Arthrospira platensis M2
(cyanobacteria)
CO2 Flat-panel 5.4 L Summer (Florence,
Italy)
- 1.09 mol H2/(L·d) 30.65 mol H2/(m2·d)
- 4.8% a (Tredici & Zittelli, 1998)
a Photosynthetic efficiency of the cultures was calculated by multiplying the reactor productivity by the mean enthalpy value of the biomass of A. platensis M2 cultivated outdoors (21.56 kJ g−1) and divided by the mean visible solar energy input on the culture surface (14.08 MJ/d). Other photosynthetic efficiency was calculated using equation 2.20.
90
2.2.5 Design considerations for PBRs
In addition to the physical parameters such as quantity of light penetrating into the
bioreactor, a good PBR design should consider various physiochemical parameters such
as pH, temperature, dissolved oxygen and CO2, shear due to agitation, C/N ratio, carbon
sources and availability of nutrients. As mentioned earlier, these parameters influence
various biochemical pathways and ultimately the H2 production in PBRs.
A general consideration to achieve a good design of PBRs as reported by Dasgupta et al.
(2010) includes the following physicochemical parameters which affect the performance
of PBRs:
x high light penetration into PBRs
x high surface area to volume ratio (higher illumination area)
x temperature and pH control
x good mixing system
x better gas exchange or mass transfer
x transparency and durability of the materials
Surface area to volume (A/V) ratio
The amount of light absorbed by a reactor system is a limiting factor in PBR systems.
Surface area to volume ratio is one of the important parameters to be considered during
the design of PBRs as it determines the amount of light entering into the system. The
higher the A/V ratio, the larger will be the surface area for receiving light for growth and
metabolism. Therefore, the A/V ratio can be directly co-related with cell concentration
and the volumetric productivity of the system (Dasgupta et al. 2010).
Gebicki et al. (2009) compared hydrogen productivities of a flat panel (A/V ratio of 20
m-1) and an inclined horizontal tubular (A/V ratio of 15.38 m-1) PBR with respect to
illuminated surface area and ground area occupied by the reactor. The mean hydrogen
productivity of the flat panel reactor was 1250 mlH2/(m2illuminated surface/day), while that of
the tubular reactor was 1100 mlH2/(m2illuminated surface/day). The illuminated area per unit
ground area occupied by the panel reactor was 8.9 times higher than that of the tubular
reactor, which gives the economic edge of the comparison. However, a fenced type
91
tubular PBR (Figure 2.13) could be a research interest in the future as this reactor
configuration occupies less space compared to inclined horizontal tubular PBR.
Mixing systems
Mixing systems in PBRs could include pumping, mechanical stirring and airlift mixers.
Ugwu et al. (2003) proposed a static mixer for tubular bioreactors. The selection of the
type of mixing system is important as the pumps used for mixing or recirculation exert
shear forces that might be harmful to PNSB. Another disadvantage of the mixing system
is the additional cost due to the required energy for its operation.
Construction materials
Selection of materials during the construction of PBRs not only determines the economy,
but also the performance of the system. Several factors should be considered while
selecting the construction materials. PBRs can be constructed from glass, polyvinyl
(PMMA) and fiberglass. Dasgupta et al. (2010) reported the following considerations for
the selection of the construction material for PBRs:
x high transparency
x durable and low cost
x non-toxic to PNS strains and resistant to chemicals and metabolites produced by
the PNS strains
x high weathering resistant and easiness in cleaning
The results of the Net Energy Analysis (NER) of three different materials, viz. glass,
LDPE and PMMA, done by Gebicki et al. (2010) suggests the use of LDPE for the
construction of tubular and panel PBRs.
2.2.6 Mathematical modeling of growth and product kinetics of PNSB
Knowledge on the kinetics of the biological process becomes vital to have a better design
and control of the process. The strong influence of operational parameters such light
intensity and substrate concentrations on photofermentative H2 and PHB synthesis has
been demonstrated (Uyar et al. 2007; Androga et al. 2014; Hustede et al. 1993; Han et al.
2012; Wu et al. 2012). However, very limited work has been done on the kinetic analysis
92
of the photofermentation process (Gadhamshetty et al. 2008; Zhang et al. 2015; Koku et
al. 2002).
Biomass growth
Few mathematical models have been proposed to study growth kinetics of PNSB cultures.
A theoretical cell growth rate can be expressed as:
dXdt = μX − 𝑚𝑋 (2.21)
Where: X is the cell dry weight concentration (g/L), m is maintenance coefficient for
biomass (decay rate) and μ is the specific growth rate (h−1). Gadhamshetty et al. (2008)
proposed the Monod equation to provide the expression for μ to model the growth curve
in a batch PBRs with the assumptions that sufficient light and optimal C/N ratio is
available under stressful nitrogen concentrations. The proposed model simulates the
biomass growth under substrate-limited conditions as:
dXdt = μX = (
μm SKs + S) X (2.22)
where: the specific growth rate μ (hr-1) depends on both maximum specific growth rate
μm (hr-1) and the half saturation constant KS (mg/l).
However, the growth curve obtained for R. sphaeroides O.U. 001 deviated from the
Monod model (Koku et al., 2003). The Equation 2.22 needs to include the substrate
inhibition and inhibition due to higher biomass concentration. Moreover, the inhibition
from higher substrate levels could be due to osmotic stress and/or the presence of one or
more unknown inhibitors such as pigments (Gadhamshetty et al. 2008). Besides higher
biomass concentration reduces the light intensity inside the PBR, causes self-shading
effects and limits the substrate diffusion, which in turn affects the hydrogen production.
Thus, the specific growth rate (μ) in Equation 2.22 is modified in Equation 2.23 to include
the two inhibitory effects:
𝜇 = 𝜇𝑚𝑆
𝐾𝑠 + 𝑆 + 𝑆2
𝐾𝑋𝑖
(1 −𝑋
𝑋𝑚) (2.23)
The inhibitory effect due to biomass concentration is provided by a Logistic model. The
term “Xm” is the maximum cell dry mass concentration at which growth will cease. The
93
specific growth rate in the Equation 2.23 is further modified to include the effect of the
light exposure on PNSB. The modification included the declining effect of excess light
on biomass growth as the surplus absorbed light energy may results in damage and
degradation of the reaction center involved in the photosynthetic process. The final
equation is expressed as:
𝜇 = 𝜇𝑚𝑆
𝐾𝑠 + 𝑆 + 𝑆2
𝐾𝑋𝑖
(1 −𝑋
𝑋𝑚) (
𝐼𝐾𝑋𝐼 + 𝐼 + 𝐾𝐼𝐼2) (2.24)
The smaller the value of KI, the larger is the inhibition effect of light on PNSB growth.
Consumption of substrate
The Contois model can be used to describe the consumption of the substrate:
𝑑𝑆𝑑𝑡 = −
𝜇𝑚𝑆𝑌(𝑆 + 𝐾𝑆𝑋) 𝑋 (2.25)
or
𝑑𝑆𝑑𝑡 =
1𝑌𝑆/𝑋
𝜇𝑋 (2.26)
Relation between biomass growth and product formation
Mu et al. (2006) used the Modified Luedeking-Piret model to establish the relationship
product (Pi) formation, substrate (S) degradation and biomass (X) growth for the DF
hydrogen production by mixed anaerobic cultures. The following Luedeking-Piret model
could be used to describe the relationship between three parameters. The Luedeking–Piret
model and its modified form can describe the relationship between formation of H2 and
PHB as products and biomass:
𝑑𝑃𝑖
𝑑𝑡 = −𝑌𝑃𝑖𝑋
𝑑𝑋𝑑𝑡 + 𝛽𝑋 (2.27)
𝑑𝑃𝑖
𝑑𝑡 = −𝑌𝑃𝑖𝑋
𝑑𝑋𝑑𝑡 (2.28)
where: ‘Pi’ is the concentration of the product ‘i’ and ‘YPi/X’ is the yield of product ‘i’
with respect to biomass ‘X’.
94
Similarly, the formation of products with respect to consumption of substrate can be
written as:
𝑑𝑃𝑖
𝑑𝑡 = −𝑌𝑃𝑖𝑆
𝑑𝑆𝑑𝑡 (2.29)
where: ‘Pi’ is the concentration of the product ‘i’ and ‘Ypi/s’ is the yield of product ‘i’
with respect to substrate ‘S’.
The growth of biomass can be expressed in relation to the substrate consumption as:
𝑑𝑋𝑑𝑡 = −𝑌𝑋
𝑆
𝑑𝑆𝑑𝑡 (2.30)
where: ‘X’ is the concentration of the biomass and ‘YX/s’ is the yield of biomass with
respect to the substrate ‘S’.
On integrating Equation 2.30 from initial concentration (S0) to final substrate
concentration (S) and product (from initial concentration of 0 to final product
concentration Pi), it is possible to write the following equations:
𝑑𝑃𝑖 = −𝑌𝑃𝑖𝑑𝑆
∫ 𝑑𝑃𝑖
𝑃𝑖
0= −𝑌𝑃𝑖 ∫ 𝑑𝑆
𝑆
𝑆𝑜
(2.31)
𝑃𝑖 = −𝑌𝑃𝑖(𝑆0 − 𝑆) (2.32)
with i = H2 and PHB.
These relationships can be applied to model the kinetics of substrate consumption, PNSB
growth and products formation (H2 and PHB) in the PF process.
2.2.7 Future perspectives
Economics
There are very few studies aimed at determining the economics of photo-H2 production
(Benemann 1997; HYVOLUTION 2011). Benemann (1997) presented an economic
analysis of a conceptual two-stage process where microalgae are used to produce a
carbohydrate rich biomass cultivated in large open ponds and hydrogen will be produced
in tubular photobioreactors. The paper reported the estimated overall total hydrogen
production costs of 9.5 $/GJ.
95
An integrated process of biohydrogen combining thermophilic dark fermentation
followed by photofermentation had a biohydrogen production cost of 10 €/GJ (~13.42
$/GJ), i.e. 1.21 €/kgH2 (~1.62 $/kgH2) based on the lower heating value of H2
(HYVOLUTION, 2011). In the integrated concept, the total cost per kilogram of
biohydrogen is 56 € (~75.15 $), which is much higher than that of hydrogen from coal
(0.36 - 1.83 $/kgH2) and natural gas (2.48 - 3.17 $/kgH2) (Bartels et al., 2010;
HYVOLUTION, 2011). The standalone thermophilic dark fermentation process costs 21
€/kgH2 which is lower than the combined system, thus the PF needs improvement to lower
the per unit production cost. In their study, HYVOLUTION (2011) estimated the capital
cost of commercial scale tubular and flat panel photofermenters at 91 and 332 million €
(122.11 and 445.51 $), respectively. However, the capital cost depends on several factors
such as reactor size, material and labor cost.
The light conversion efficiencies of the PF play an important role in determining the
economics of photo-hydrogen production. In addition, the substrates and the PNSB
strains are also crucial factors. The selection of PBRs also influences the capital and
operational cost and in the end, the unit cost of the photo-hydrogen production
(HYVOLUTION 2011).
Integration with dark fermentation
PF can be applied as a post treatment stage on DFE, which mostly contains organic acids
and alcohols (Figure 2.14). The integrated DF-PF process has been demonstrated by
several studies (Rai et al. 2014; Tawfik et al. 2014; Yang et al. 2015). DF has the unique
capability to utilize a wide range of complex waste biomass that can ensure the future
supply of feestock, and combining the two processes (DF + PF) can provide the complete
conversion of organic substrate in addition to enhanced H2 yields. Typical chemical
reactions of conversion of organic acids produced in mixed type fermentation to photo-
H2 are presented in Equations 2.9 – 2.12.
Redwood et al. (2008) reviewed different possible integration strategies for coupling DF-
PF processes. In general, DF-PF systems can be integrated in three possible ways; i)
utilizing DFE produced in PF systems, ii) cultivating dark and photofermentative
microorganisms in one reactor system (Chandra et al. 2015; Liu et al. 2010) or iii)
separating the two systems by a physical barrier such as a membrane (Redwood et al.
96
2011; Liu et al. 2015). DF followed by photo-H2 production is well studied by many
researchers (Ghimire et al. 2015).
Depending on the process operating parameters such as pH, substrate loading and
substrate type, DFE generally has an acidic pH (< 6.0) and inhibiting levels of ammonia
and organic acids. Therefore, the DFE requires pre-treatment such pH adjustment,
dilution and removal of ammonia before feeding into a PF process. Ammonia
concentrations exceeding 2 - 5 mM inhibit the photo-H2 production (Lee et al. 2011;
Argun et al. 2008). Therefore, substrates with a higher C/N ratio are usually preferred for
PF. Depending on the DFE requirements, several ammonia removal strategies such as
stripping, treatment with natural zeolites and membrane processes can be applied
(Androga et al. 2012b; Redwood et al. 2012). However, most continuous dark
fermentative processes lack high ammonia levels due to incomplete conversion of
proteins or amino acids present in the substrates, making them ideal substrates for the PF
processes.
Figure 2.14 - Sequential DF-PF process
97
REFERENCES
Adessi, A., & De Philippis, R. (2014). Photobioreactor design and illumination systems for H2 production with anoxygenic photosynthetic bacteria: A review. International Journal of Hydrogen Energy, 39(7), 3127–3141.
Afsar, N., Özgür, E., Gürgan, M., Akköse, S., Yücel, M., Gündüz, U., & Eroglu, I. (2011). Hydrogen productivity of photosynthetic bacteria on dark fermenter effluent of potato steam peels hydrolysate. International Journal of Hydrogen Energy, 36(1), 432–438.
Agler, M. T., Wrenn, B. a, Zinder, S. H., & Angenent, L. T. (2011). Waste to bioproduct conversion with undefined mixed cultures: the carboxylate platform. Trends in Biotechnology, 29(2), 70–8.
Akkerman, I., Janssen, M., Rocha, J., & Wijffels, R. H. (2002). Photobiological hydrogen production: photochemical efficiency and bioreactor design. International Association of Hydrogen Energy, 27, 1195–1208.
Akman, M. C., Erguder, T. H., Gündüz, U., & Eroğlu, İ. (2015). Investigation of the effects of initial substrate and biomass concentrations and light intensity on photofermentative hydrogen gas production by Response Surface Methodology. International Journal of Hydrogen Energy, 0, 1–8.
Akroum-Amrouche, D., Abdi, N., Lounici, H., & Mameri, N. (2011). Effect of physico-chemical parameters on biohydrogen production and growth characteristics by batch culture of Rhodobacter sphaeroides CIP 60.6. Applied Energy, 88(6), 2130–2135.
Altaş, L. (2009). Inhibitory effect of heavy metals on methane-producing anaerobic granular sludge. Journal of Hazardous Materials, 162(2-3), 1551–6.
Alves, H. J., Bley Junior, C., Niklevicz, R. R., Frigo, E. P., Frigo, M. S., & Coimbra-Araújo, C. H. (2013). Overview of hydrogen production technologies from biogas and the applications in fuel cells. International Journal of Hydrogen Energy, 38(13), 5215–5225.
Alzate-Gaviria, L. M., Sebastian, P. J., Pérez-Hernández, A., & Eapen, D. (2007). Comparison of two anaerobic systems for hydrogen production from the organic fraction of municipal solid waste and synthetic wastewater. International Journal of Hydrogen Energy, 32(15), 3141–3146.
Androga, D. D., Özgür, E., Eroglu, I., Gündüz, U., & Yücel, M. (2012a). Amelioration of photofermentative hydrogen production from molasses dark fermenter effluent by zeolite-based removal of ammonium ion. International Journal of Hydrogen Energy, 37(21), 16421–16429.
Androga, D. D., Özgür, E., Eroglu, I., Gündüz, U., & Yücel, M. (2012b). Photofermentative Hydrogen Production in Outdoor Conditions. Hydrogen Energy - Challenges and Perspectives, 77–120.
Androga, D. D., Ozgur, E., Gunduz, U., Yucel, M., & Eroglu, I. (2011). Factors affecting the longterm stability of biomass and hydrogen productivity in outdoor photofermentation. International Journal of Hydrogen Energy, 36(17), 11369–11378.
98
Androga, D. D., Sevinç, P., Koku, H., Yücel, M., Gündüz, U., & Eroglu, I. (2014). Optimization of temperature and light intensity for improved photofermentative hydrogen production using Rhodobacter capsulatus DSM 1710. International Journal of Hydrogen Energy, 39(6), 2472–2480.
Antonopoulou, G., Stamatelatou, K., Venetsaneas, N., Kornaros, M., & Lyberatos, G. (2008). Biohydrogen and Methane Production from Cheese Whey in a Two-Stage Anaerobic Process. Industrial & Engineering Chemistry Research, 47(15), 5227–5233.
Argun, H., & Kargi, F. (2009). Effects of sludge pre-treatment method on bio-hydrogen production by dark fermentation of waste ground wheat. International Journal of Hydrogen Energy, 34(20), 8543–8548.
Argun, H., & Kargi, F. (2010). Photo-fermentative hydrogen gas production from dark fermentation effluent of ground wheat solution: Effects of light source and light intensity. International Journal of Hydrogen Energy, 35(4), 1595–1603.
Argun, H., Kargi, F., & Kapdan, I. (2008). Light fermentation of dark fermentation effluent for bio-hydrogen production by different Rhodobacter species at different initial volatile fatty acid (VFA) concentrations. International Journal of Hydrogen Energy, 33(24), 7405–7412.
Argun, H., Kargi, F., Kapdan, I., & Oztekin, R. (2008). Biohydrogen production by dark fermentation of wheat powder solution: Effects of C/N and C/P ratio on hydrogen yield and formation rate. International Journal of Hydrogen Energy, 33(7), 1813–1819.
Ariunbaatar, J., Panico, A., Esposito, G., Pirozzi, F., & Lens, P. N. L. (2014). Pretreatment methods to enhance anaerobic digestion of organic solid waste. Applied Energy, 123, 143–156.
Arudchelvam, Y., Perinpanayagam, M., & Nirmalakhandan, N. (2010). Predicting VFA formation by dark fermentation of particulate substrates. Bioresource Technology, 101(19), 7492–9.
Avcioglu, S. G., Ozgur, E., Eroglu, I., Yucel, M., & Gunduz, U. (2011). Biohydrogen production in an outdoor panel photobioreactor on dark fermentation effluent of molasses. International Journal of Hydrogen Energy, 36(17), 11360–11368.
Balat, H., & Kırtay, E. (2010). Hydrogen from biomass – Present scenario and future prospects. International Journal of Hydrogen Energy, 35(14), 7416–7426.
Balat, M. (2008). Potential importance of hydrogen as a future solution to environmental and transportation problems. International Journal of Hydrogen Energy, 33(15), 4013–4029.
Barbosa, M. J., Rocha, J. M., Tramper, J., & Wijffels, R. H. (2001). Acetate as a carbon source for hydrogen production by photosynthetic bacteria. Journal of Biotechnology, 85(1), 25–33.
Bartels, J. R., Pate, M. B., & Olson, N. K. (2010). An economic survey of hydrogen production from conventional and alternative energy sources. International Journal of Hydrogen Energy, 35(16), 8371–8384.
99
Basak, N., & Das, D. (2007). The Prospect of Purple Non-Sulfur (PNS) Photosynthetic Bacteria for Hydrogen Production: The Present State of the Art. World Journal of Microbiology and Biotechnology, 23(1), 31–42.
Basak, N., & Das, D. (2009). Photofermentative hydrogen production using purple non-sulfur bacteria Rhodobacter sphaeroides O.U.001 in an annular photobioreactor: A case study. Biomass and Bioenergy, 33(6-7), 911–919.
Bastidas-Oyanedel, J.-R., Mohd-Zaki, Z., Zeng, R. J., Bernet, N., Pratt, S., Steyer, J.-P., & Batstone, D. J. (2012). Gas controlled hydrogen fermentation. Bioresource Technology, 110, 503–9.
Batstone, D. J. J., Keller, J., Angelidaki, I., Kalyuzhnyi, S. V, Pavlostathis, S. G. G., Rozzi, A., … Kalyuzhni, S. V. (2002). The IWA Anaerobic Digestion Model No 1 (ADM1). Water Science and Technology: A Journal of the International Association on Water Pollution Research, 45(10), 65–73. Retrieved from
Benemann, J. R. (1997). Feasibility analysis of photobiological hydrogen production. International Association of Hydrogen Energy, 22, 979–987.
Bianchi, L., Mannelli, F., Viti, C., Adessi, A., & De Philippis, R. (2010). Hydrogen-producing purple non-sulfur bacteria isolated from the trophic lake Averno (Naples, Italy). International Journal of Hydrogen Energy, 35(22), 12216–12223.
Blumensaat, F., & Keller, J. (2005). Modelling of two-stage anaerobic digestion using the IWA Anaerobic Digestion Model No. 1 (ADM1). Water Research, 39(1), 171–83.
Boran, E., Özgür, E., Burg, J. Van Der, Yücel, M., Gündüz, U., & Eroglu, I. (2010). Biological hydrogen production by Rhodobacter capsulatus in solar tubular photo bioreactor. Journal of Cleaner Production, 18, S29–S35.
Boran, E., Ozgur, E., Yucel, M., Gunduz, U., & Eroglu, I. (2012). Biohydrogen production by Rhodobacter capsulatus Hup− mutant in pilot solar tubular photobioreactor. International Journal of Hydrogen Energy, 37, 16437–16445.
Brodeur, G., Yau, E., Badal, K., Collier, J., Ramachandran, K. B., & Ramakrishnan, S. (2011). Chemical and physicochemical pretreatment of lignocellulosic biomass: a review. Enzyme Research, 2011, 787532.
Buitrón, G., & Carvajal, C. (2010). Biohydrogen production from Tequila vinasses in an anaerobic sequencing batch reactor: effect of initial substrate concentration, temperature and hydraulic retention time. Bioresource Technology, 101(23), 9071–7.
Cai, M., Liu, J., & Wei, Y. (2004). Enhanced biohydrogen production from sewage sludge with alkaline pretreatment. Environmental Science & Technology, 38(11), 3195–202.
Callaghan, F. J., Wase, D. A. J., Thayanithy, K., & Forster, C. F. (2002). Continuous co-digestion of cattle slurry with fruit and vegetable wastes and chicken manure, 27, 71–77.
Cantrell, K. B., Ducey, T., Ro, K. S., & Hunt, P. G. (2008). Livestock waste-to-bioenergy generation opportunities. Bioresource Technology, 99(17), 7941–53.
100
Carrillo-Reyes, J., Celis, L. B., Alatriste-Mondragón, F., & Razo-Flores, E. (2012). Different start-up strategies to enhance biohydrogen production from cheese whey in UASB reactors. International Journal of Hydrogen Energy, 37(7), 5591–5601.
Carvalho, A. P., Meireles, A., Malcata, F. X., Meireles, L. a, & Malcata, F. X. (2006). Microalgal reactors: a review of enclosed system designs and performances. Biotechnology Progress, 22(6), 1490–506.
Castelló, E., García y Santos, C., Iglesias, T., Paolino, G., Wenzel, J., Borzacconi, L., & Etchebehere, C. (2009). Feasibility of biohydrogen production from cheese whey using a UASB reactor: Links between microbial community and reactor performance. International Journal of Hydrogen Energy, 34(14), 5674–5682.
Cavinato, C., Bolzonella, D., Fatone, F., Cecchi, F., & Pavan, P. (2011). Optimization of two-phase thermophilic anaerobic digestion of biowaste for hydrogen and methane production through reject water recirculation. Bioresource Technology, 102(18), 8605–11.
Cavinato, C., Giuliano, A., Bolzonella, D., Pavan, P., & Cecchi, F. (2012). Bio-hythane production from food waste by dark fermentation coupled with anaerobic digestion process: A long-term pilot scale experience. International Journal of Hydrogen Energy, 37(15), 11549–11555.
Cavinato, C., Bolzonella, D., Eusebi, A. L. and Pavan, P. (2009). Bio-hythane production by thermophilic two-phase anaerobic digestion of organic fraction of municipal solid waste: Preliminary results. AIDIC Conference Series, 9, 61–66.
Chairattanamanokorn, P., Penthamkeerati, P., Reungsang, A., Lo, Y.-C., Lu, W.-B., & Chang, J.-S. (2009). Production of biohydrogen from hydrolyzed bagasse with thermally preheated sludge. International Journal of Hydrogen Energy, 34(18), 7612–7617.
Chandra, R., Nikhil, G., & Mohan, S. (2015). Single-Stage Operation of Hybrid Dark-Photo Fermentation to Enhance Biohydrogen Production through Regulation of System Redox Condition: Evaluation with Real-Field Wastewater. International Journal of Molecular Sciences, 16(5), 9540–9556.
Chen, C., Lu, W., Wu, J., & Chang, J. (2007). Enhancing phototrophic hydrogen production of Rhodopseudomonas palustris via statistical experimental design. International Journal of Hydrogen Energy, 32(8), 940–949.
Chen, C., Yeh, K., Lo, Y., Wang, H., & Chang, J. (2010). Engineering strategies for the enhanced photo-H2 production using effluents of dark fermentation processes as substrate. International Journal of Hydrogen Energy, 35(24), 13356–13364.
Chen, C.-C., Chuang, Y.-S., Lin, C.-Y., Lay, C.-H., & Sen, B. (2012). Thermophilic dark fermentation of untreated rice straw using mixed cultures for hydrogen production. International Journal of Hydrogen Energy, 37(20), 15540–15546.
Chen, C.-Y., & Chang, J.-S. (2006). Enhancing phototropic hydrogen production by solid-carrier assisted fermentation and internal optical-fiber illumination. Process Biochemistry, 41(9), 2041–2049.
Chen, C.-Y., Liu, C.-H., Lo, Y.-C., & Chang, J.-S. (2011). Perspectives on cultivation strategies and photobioreactor designs for photo-fermentative hydrogen production. Bioresource Technology, 102(18), 8484–92.
101
Chen, C.-Y., Yang, M.-H., Yeh, K.-L., Liu, C.-H., & Chang, J.-S. (2008). Biohydrogen production using sequential two-stage dark and photo fermentation processes. International Journal of Hydrogen Energy, 33(18), 4755–4762.
Cheng, J., Ding, L., Xia, A., Lin, R., Li, Y., Zhou, J., & Cen, K. (2015). Hydrogen production using amino acids obtained by protein degradation in waste biomass by combined dark- and photo-fermentation. Bioresource Technology, 179, 13–19.
Cheng, J., Xia, A., Liu, Y., Lin, R., Zhou, J., & Cen, K. (2012). Combination of dark- and photo-fermentation to improve hydrogen production from Arthrospira platensis wet biomass with ammonium removal by zeolite. International Journal of Hydrogen Energy, 37(18), 13330–13337.
Cheng, S., & Logan, B. E. (2007). Sustainable and efficient biohydrogen production via electrohydrogenesis, 104(47), 18871–18873.
Cheng, X.-Y., & Liu, C.-Z. (2011). Hydrogen Production via Thermophilic Fermentation of Cornstalk by Clostridium thermocellum. Energy & Fuels, 25(4), 1714–1720.
Cheong, D.-Y., & Hansen, C. L. (2006). Bacterial stress enrichment enhances anaerobic hydrogen production in cattle manure sludge. Applied Microbiology and Biotechnology, 72(4), 635–43.
Cherubini, F. (2010). The biorefinery concept: Using biomass instead of oil for producing energy and chemicals. Energy Conversion and Management, 51(7), 1412–1421.
Choi, J., & Ahn, Y. (2013). Characteristics of biohydrogen fermentation from various substrates. International Journal of Hydrogen Energy, 39(7), 3152–3159.
Chong, M., Sabaratnam, V., Shirai, Y., Ali, M., & Hassan, M. A. (2009). Biohydrogen production from biomass and industrial wastes by dark fermentation. International Journal of Hydrogen Energy, 34(8), 3277–3287.
Chookaew, T., O-thong, S., & Prasertsan, P. (2015). Biohydrogen production from crude glycerol by two stage of dark and photo fermentation. International Journal of Hydrogen Energy, 40(24), 2–7.
Chookaew, T., Prasertsan, P., & Ren, Z. J. (2014). Two-stage conversion of crude glycerol to energy using dark fermentation linked with microbial fuel cell or microbial electrolysis cell. New Biotechnology, 31(2), 179–84.
Claassen, P. a. M. M., de Vrije, T., Koukios, E., van Niel, E., Eroglu, I., Modigell, M., … Niel, E. Van. (2010). Non-thermal production of pure hydrogen from biomass: HYVOLUTION. Journal of Cleaner Production, 18, S4–S8.
Cohen-Bazire, G., Sistrom, W. R., & Stanier, R. Y. (1965). Kinetic studies of pigment synthesis by non-sulfur purple bacteria. Journal of Cellular and Comparative Physiology, 49(1), 25–68.
Collet, C., Adler, N., Schwitzguebel, J.-P., & Peringer, P. (2004). Hydrogen production by Clostridium thermolacticum during continuous fermentation of lactose. International Journal of Hydrogen Energy, 29(14), 1479–1485.
102
Cui, M., & Shen, J. (2012). Effects of acid and alkaline pretreatments on the biohydrogen production from grass by anaerobic dark fermentation. International Journal of Hydrogen Energy, 37(1), 1120–1124.
Dabrock, B., Bahl, H., & Gottschalk, G. (1992). Parameters Affecting Solvent Production by Clostridium pasteurianum. Applied and Environmental Microbiology, 58(4), 1233–1239.
Das, D., & Veziroglu, T. (2008). Advances in biological hydrogen production processes. International Journal of Hydrogen Energy, 33(21), 6046–6057.
Das, D., & Veziroglu, T. N. (2001). Hydrogen production by biological processes: a survey of literature, 26, 13–28.
Dasgupta, C. N., Jose Gilbert, J., Lindblad, P., Heidorn, T., Borgvang, S. a., Skjanes, K., & Das, D. (2010). Recent trends on the development of photobiological processes and photobioreactors for the improvement of hydrogen production. International Journal of Hydrogen Energy, 35(19), 10218–10238.
Datar, R., Huang, J., Maness, P., Mohagheghi, A, Czernik, S., & Chornet, E. (2007). Hydrogen production from the fermentation of corn stover biomass pretreated with a steam-explosion process. International Journal of Hydrogen Energy, 32(8), 932–939.
De Gioannis, G., Friargiu, M., Massi, E., Muntoni, A., Polettini, A., Pomi, R., & Spiga, D. (2014). Biohydrogen production from dark fermentation of cheese whey: Influence of pH. International Journal of Hydrogen Energy, 39(36), 20930–20941.
De Gioannis, G., Muntoni, A., Polettini, A., & Pomi, R. (2013). A review of dark fermentative hydrogen production from biodegradable municipal waste fractions. Waste Management (New York, N.Y.), 33(6), 1345–61.
De Philippis, R., Ena, A., Guastini, M., Sili, C., & Vincenzini, M. (1992). Factors affecting poly-β-hydroxybutyrate accumulation in cyanobacteria and in purple non-sulfur bacteria.pdf. FEMS Microbiological Reviews, 103, 187–194.
Dipasquale, L., Adessi, A., d’Ippolito, G., Rossi, F., Fontana, A., & De Philippis, R. (2015). Introducing capnophilic lactic fermentation in a combined dark-photo fermentation process: a route to unparalleled H2 yields. Applied Microbiology and Biotechnology, 99(2), 1001–1010.
dos Reis, C. M., & Silva, E. L. (2011). Effect of upflow velocity and hydraulic retention time in anaerobic fluidized-bed reactors used for hydrogen production. Chemical Engineering Journal, 172(1), 28–36.
Eisentraut, A. (2010). Sustainable production of second-generation biofuels: potential and perspectives in major economies and developing countries. OECD/IEA. Paris Cedex 15, France. Retrieved from <http://www.iea.org/publications/freepublications/publication/second_generation_biofuels.pdf> [accessed 14.05.13].
Ekins, P., & Hughes, N. (2009). The prospects for a hydrogen economy (1): hydrogen futures. Technology Analysis & Strategic Management, 21(7), 783–803.
Elbeshbishy, E. (2011). Enhancement of Biohydrogen and Biomethane Production from Wastes Using Ultrasonication. PHD Thesis. The University of Western Ontario, London, Ontario, Canada.
103
Elefsiniotis, P., Wareham, D. G., & Smith, M. O. (2004). Use of volatile fatty acids from an acid-phase digester for denitrification. Journal of Biotechnology, 114(3), 289–97.
Elsharnouby, O., Hafez, H., Nakhla, G., & El Naggar, M. H. (2013). A critical literature review on biohydrogen production by pure cultures. International Journal of Hydrogen Energy, 38(12), 4945–4966.
Eroglu, E., Eroglu, I., Gunduz, U., Turker, L., & Yucel, M. (2006). Biological hydrogen production from olive mill wastewater with two-stage processes. International Journal of Hydrogen Energy, 31(11), 1527–1535.
Eroğlu, E., Eroğlu, I., Gündüz, U., & Yücel, M. (2008). Effect of clay pretreatment on photofermentative hydrogen production from olive mill wastewater. Bioresource Technology, 99(15), 6799–808.
Eroğlu, E., Eroğlu, İ., Gündüz, U., & Yücel, M. (2009). Comparison of physicochemical characteristics and photofermentative hydrogen production potential of wastewaters produced from different olive oil mills in Western-Anatolia, Turkey. Biomass and Bioenergy, 33(4), 706–711.
Eroglu, E., & Melis, A. (2011). Photobiological hydrogen production: Recent advances and state of the art. Bioresource Technology, 102(18), 8403–13.
Eroglu, I., Aslan, K., & Gu, U. (1999). Substrate consumption rates for hydrogen production by Rhodobacter sphaeroides in a column photobioreactor, 70, 103–113.
Eroglu, I., Tabanoglu, A., Gunduz, U., Eroglu, E., & Yucel, M. (2008). Hydrogen production by Rhodobacter sphaeroides O.U.001 in a flat plate solar bioreactor. International Journal of Hydrogen Energy, 33(2), 531–541.
Esposito, G., Frunzo, L., Giordano, A., Liotta, F., Panico, A., & Pirozzi, F. (2012). Anaerobic co-digestion of organic wastes. Reviews in Environmental Science and Bio/Technology.
Esposito, G., Frunzo, L., Panico, A., & d’Antonio, G. (2008). Mathematical modelling of disintegration-limited co-digestion of OFMSW and sewage sludge. Water Science and Technology: A Journal of the International Association on Water Pollution Research, 58(7), 1513–9.
Esposito, G., Frunzo, L., Panico, A., & Pirozzi, F. (2011a). Model calibration and validation for OFMSW and sewage sludge co-digestion reactors. Waste Management (New York, N.Y.), 31(12), 2527–35.
Esposito, G., Frunzo, L., Panico, A., & Pirozzi, F. (2011b). Modelling the effect of the OLR and OFMSW particle size on the performances of an anaerobic co-digestion reactor. Process Biochemistry, 46(2), 557–565.
Faloye, F. D., Kana, E. B. G., & Schmidt, S. (2013). Optimization of hybrid inoculum development techniques for biohydrogen production and preliminary scaleup. International Journal of Hydrogen Energy, 38(27), 11765–11773.
Fan, Y., Li, C., Lay, J.-J., Hou, H., & Zhang, G. (2004). Optimization of initial substrate and pH levels for germination of sporing hydrogen-producing anaerobes in cow dung compost. Bioresource Technology, 91(2), 189–193.
104
Fan, Y.-T., Zhang, Y.-H., Zhang, S.-F., Hou, H.-W., & Ren, B.-Z. (2006). Efficient conversion of wheat straw wastes into biohydrogen gas by cow dung compost. Bioresource Technology, 97(3), 500–5.
Fang, H. H. P., & Liu, H. (2002). Effect of pH on hydrogen production from glucose by a mixed culture. Bioresource Technology, 82(82), 87–93.
Fang, H. H. P., Zhang, T., & Liu, H. (2002). Microbial diversity of a mesophilic hydrogen-producing sludge. Applied Microbiology and Biotechnology, 58(1), 112–118. http://doi.org/10.1007/s00253-001-0865-8
Fang, H., Li, C., & Zhang, T. (2006). Acidophilic biohydrogen production from rice slurry. International Journal of Hydrogen Energy, 31(6), 683–692.
Favaro, L., Alibardi, L., Cristina, M., Casella, S., & Basaglia, M. (2013). Effects of inoculum and indigenous microflora on hydrogen production from the organic fraction of municipal solid waste. International Journal of Hydrogen Energy, 38(27), 11774–11779.
Fei, Q., Chang, H. N., Shang, L., Choi, J., Kim, N., & Kang, J. (2011). The effect of volatile fatty acids as a sole carbon source on lipid accumulation by Cryptococcus albidus for biodiesel production. Bioresource Technology, 102(3), 2695–701.
Finke, N., Vandieken, V., & Jørgensen, B. B. (2007). Acetate, lactate, propionate, and isobutyrate as electron donors for iron and sulfate reduction in Arctic marine sediments, Svalbard. FEMS Microbiology Ecology, 59(1), 10–22.
Foglia, D., Wukovits, W., Friedl, A., Vrije, T. De, & Pieternel, A. M. (2006). Fermentative Hydrogen Production: Influence of Application of Mesophilic and Thermophilic Bacteria on Mass and Energy Balances, 2, 815–820.
Fontanille, P., Kumar, V., Christophe, G., Nouaille, R., & Larroche, C. (2012). Bioconversion of volatile fatty acids into lipids by the oleaginous yeast Yarrowia lipolytica. Bioresource Technology, 114, 443–9.
Franchi, E., Tosi, C., Scolla, G., Penna, G. Della, Rodriguez, F., & Pedroni, P. M. (2005). Metabolically engineered Rhodobacter sphaeroides RV strains for improved biohydrogen photoproduction combined with disposal of food wastes. Marine Biotechnology (New York, N.Y.), 6(6), 552–65.
Gadhamshetty, V., Arudchelvam, Y., Nirmalakhandan, N., & Johnson, D. C. (2010). Modeling dark fermentation for biohydrogen production: ADM1-based model vs. Gompertz model. International Journal of Hydrogen Energy, 35(2), 479–490.
Gadhamshetty, V., Sukumaran, A., Nirmalakhandan, N., & Theinmyint, M. (2008). Photofermentation of malate for biohydrogen production— A modeling approach. International Journal of Hydrogen Energy, 33(9), 2138–2146.
Gadhe, A., Sonawane, S. S., & Varma, M. N. (2013). Optimization of conditions for hydrogen production from complex dairy wastewater by anaerobic sludge using desirability function approach. International Journal of Hydrogen Energy, 38(16), 6607–6617.
Gavala, H., Skiadas, I., & Ahring, B. (2006). Biological hydrogen production in suspended and attached growth anaerobic reactor systems. International Journal of Hydrogen Energy, 31(9), 1164–1175.
105
Gebicki, J., Modigell, M., Schumacher, M., van der Burg, J., & Roebroeck, E. (2010). Comparison of two reactor concepts for anoxygenic H2 production by Rhodobacter capsulatus. Journal of Cleaner Production, 18, 36–42.
Gebicki, J., Modigell, M., Schumacher M., Burg, J. V. D. and Roebroeck, E. (2009). Development of photobioreactors for anoxygenic production of hydrogen by purple bacteria. Chemical Engineering Transactions, 18, 363–366.
Geng, A., He, Y., Qian, C., Yan, X., & Zhou, Z. (2010). Effect of key factors on hydrogen production from cellulose in a co-culture of Clostridium thermocellum and Clostridium thermopalmarium. Bioresource Technology, 101(11), 4029–33.
Ghimire, A., Frunzo, L., Pirozzi, F., Trably, E., Escudie, R., Lens, P. N. L., & Esposito, G. (2015). A review on dark fermentative biohydrogen production from organic biomass: Process parameters and use of by-products. Applied Energy, 144, 73–95.
Ghimire, A., Frunzo, L., Pontoni, L., Lens, P. N. L., Esposito, G., & Pirozzi, F. (2015). Dark fermentation of complex waste biomass for biohydrogen production by pretreated thermophilic anaerobic digestate. Journal of Environmental Management, 152, 43–48.
Giordano, A., Cantù, C., & Spagni, A. (2011). Monitoring the biochemical hydrogen and methane potential of the two-stage dark-fermentative process. Bioresource Technology, 102(6), 4474–4479.
Gómez, X., Fernández, C., Fierro, J., Sánchez, M. E., Escapa, A., & Morán, A. (2011). Hydrogen production: two stage processes for waste degradation. Bioresource Technology, 102(18), 8621–7.
Google Scholar. (2014). Google Scholar Keywords searches and abstracts. Retrived from <https://scholar.google.com/> [Retrieved: 29.05.2014]
Gottardo, M., Cavinato, C., Bolzonella, D., & Pavan, P. (2013). Dark Fermentation Optimization by Anaerobic Digested Sludge Recirculation: Effects on Hydrogen Production, 32, 997–1002.
Guo, X. M., Trably, E., Latrille, E., Carrere, H., & Steyer, J. (2013). Predictive and explicative models of fermentative hydrogen production from solid organic waste: Role of butyrate and lactate pathways. International Journal of Hydrogen Energy, 39(14), 7476–7485.
Guo, X. M., Trably, E., Latrille, E., Carrère, H., & Steyer, J.-P. (2010). Hydrogen production from agricultural waste by dark fermentation: A review. International Journal of Hydrogen Energy, 35(19), 10660–10673.
Guwy, A. J., Dinsdale, R. M., Kim, J. R., Massanet-Nicolau, J., & Premier, G. (2011). Fermentative biohydrogen production systems integration. Bioresource Technology, 102(18), 8534–42.
Hallenbeck, P. C., & Benemann, J. R. (2002). Biological hydrogen production; fundamentals and limiting processes. International Journal of Hydrogen Energy, 27, 1185–1193.
Hallenbeck, P. C., & Ghosh, D. (2009). Advances in fermentative biohydrogen production: the way forward? Trends in Biotechnology, 27(5), 287–97.
106
Han, H., Liu, B., Yang, H., & Shen, J. (2012). Effect of carbon sources on the photobiological production of hydrogen using Rhodobacter sphaeroides RV. International Journal of Hydrogen Energy, 37(17), 12167–12174.
Han, S.-K., & Shin, H.-S. (2004). Performance of an innovative two-stage process converting food waste to hydrogen and methane. Journal of the Air & Waste Management Association (1995), 54(2), 242–9.
Harmsen, P.F.H., Huijgen, W. J.J., Bermudez Lopez, L.M. & Bakker, R.R.C. (2010). Literature Review of Physical and Chemical Pretreatment Processes for Lignocellulosic Biomass. Wageningen University & Research centre - Food & Biobased Research (WUR-FBR, NL), Energy Research Centre of the Netherlands (ECN, NL) and Abengoa Bioenergía Nuevas Tecnologías (ABNT, ES). Retrived from <http://www.ecn.nl/docs/library/report/2010/e10013.pdf> [accessed 22.10.2013].
Hawkes, F., Hussy, I., Kyazze, G., Dinsdale, R., & Hawkes, D. (2007). Continuous dark fermentative hydrogen production by mesophilic microflora: Principles and progress. International Journal of Hydrogen Energy, 32(2), 172–184.
Hema, R., & Agrawal, P. (2012). Production of Clean Fuel from Waste Biomass using combined dark and photo fermentation. IOSR Journal of Computer Engineering, 1(4), 39–47.
Hendriks, A. T. W. M., & Zeeman, G. (2009). Pretreatments to enhance the digestibility of lignocellulosic biomass. Bioresource Technology, 100(1), 10–8.
Hu, B., & Chen, S. (2007). Pretreatment of methanogenic granules for immobilized hydrogen fermentation. International Journal of Hydrogen Energy, 32(15), 3266–3273.
Hu, H., Fan, Y., & Liu, H. (2008). Hydrogen production using single-chamber membrane-free microbial electrolysis cells. Water Research, 42(15), 4172–8.
Hu, X., Ritz, T., Damjanović, A., Autenrieth, F., & Schulten, K. (2002). Photosynthetic apparatus of purple bacteria. Quarterly reviews of biophysics (Vol. 35).
Hu, Z.-H., Yu, H.-Q., & Zhu, R.-F. (2005). Influence of particle size and pH on anaerobic degradation of cellulose by ruminal microbes. International Biodeterioration & Biodegradation, 55(3), 233–238.
Hülsen, T., Batstone, D. J., & Keller, J. (2014). Phototrophic bacteria for nutrient recovery from domestic wastewater. Water Research, 50(0), 18–26.
Hustede, E., Steinbiichel, A., & Schlegel, H. G. (1993). Relationship between the photoproduction of hydrogen and the accumulation of PHB in non-sulphur purple bacteria. Applied Microbiology and Biotechnology, 39, 87–93.
HYVOLUTION. (2011). Non-thermal production of pure hydrogen-Final Activity Report. Wageningen, The Netherlands.
Imhoff, J. F., Hiraishi, A., & Suling, J. (2015). Anoxygenic Phototrophic Purple Bacteria. In Bergey’s Manual® of Systematic Bacteriology of Systematic Bacteriology (pp. 119–132). John Wiley & Sons, Ltd.
107
Imhoff, J. F., Truper, H. G., & Pfennig, N. (1984). Rearrangement of the Species and Genera of the Phototrophic Purple Nonsulfur Bacteria. International Journal of Systematic Biology, 34(3), 340–343.
Jayalakshmi, S., Joseph, K., & Sukumaran, V. (2009). Bio hydrogen generation from kitchen waste in an inclined plug flow reactor. International Journal of Hydrogen Energy, 34(21), 8854–8858.
Jeremiasse, A. W., Hamelers, H. V. M., & Buisman, C. J. N. (2010). Microbial electrolysis cell with a microbial biocathode. Bioelectrochemistry, 78(1), 39–43.
Jiang, J., Zhang, Y., Li, K., Wang, Q., Gong, C., & Li, M. (2013). Volatile fatty acids production from food waste: effects of pH, temperature, and organic loading rate. Bioresource Technology, 143, 525–30.
Jönsson, L. J., Alriksson, B., & Nilvebrant, N.-O. (2013). Bioconversion of lignocellulose: inhibitors and detoxification. Biotechnology for Biofuels, 6(1), 16.
Jung, K.-W., Kim, D.-H., Kim, S.-H., & Shin, H.-S. (2011). Bioreactor design for continuous dark fermentative hydrogen production. Bioresource Technology, 102(18), 8612–20.
Jung, M., Hye, J., Park, D., Sung, D., & Moon, J. (2010). Comprehensive study on a two-stage anaerobic digestion process for the sequential production of hydrogen and methane from cost-effective molasses. International Journal of Hydrogen Energy, 35(12), 6194–6202.
Kapdan, I. K., & Kargi, F. (2006). Bio-hydrogen production from waste materials. Enzyme and Microbial Technology, 38, 569–582.
Kapdan, I. K., Kargi, F., Oztekin, R., & Argun, H. (2009). Bio-hydrogen production from acid hydrolyzed wheat starch by photo-fermentation using different Rhodobacter sp. International Journal of Hydrogen Energy, 34(5), 2201–2207.
Karadag, D., & Puhakka, J. a. (2010). Enhancement of anaerobic hydrogen production by iron and nickel. International Journal of Hydrogen Energy, 35, 8554–8560.
Kargi, F., Eren, N. S., & Ozmihci, S. (2012a). Bio-hydrogen production from cheese whey powder (CWP) solution: Comparison of thermophilic and mesophilic dark fermentations. International Journal of Hydrogen Energy, 37(10), 8338–8342.
Kargi, F., Eren, N. S., & Ozmihci, S. (2012b). Hydrogen gas production from cheese whey powder (CWP) solution by thermophilic dark fermentation. International Journal of Hydrogen Energy, 37(3), 2260–2266.
Kars, G., & Gündüz, U. (2010). Towards a super H2 producer: Improvements in photofermentative biohydrogen production by genetic manipulations. International Journal of Hydrogen Energy, 35(13), 6646–6656.
Karthikeyan, O. P., & Visvanathan, C. (2012). Bio-energy recovery from high-solid organic substrates by dry anaerobic bio-conversion processes: a review. Reviews in Environmental Science and Bio/Technology, 12(3), 257–284.
Khanal, S., Chen. WH., Li, L. and Sung, S. (2004). Biological hydrogen production: effects of pH and intermediate products. International Journal of Hydrogen Energy, 29, 1123–1131.
108
Khatipov, E., Miyake, M., Miyake, J., & Asada, Y. (1998). Accumulation of poly-beta-hydroxybutyrate by Rhodobacter sphaeroides on various carbon and nitrogen substrates. FEMS Microbiology Letter, 162(1), 39–45.
Kim, B. H., & Gadd, G. M. (2008). Bacterial Physiology and Metabolism. Cambridge University Press.
Kim, D.-H., Kim, S.-H., Kim, K.-Y., & Shin, H.-S. (2010). Experience of a pilot-scale hydrogen-producing anaerobic sequencing batch reactor (ASBR) treating food waste. International Journal of Hydrogen Energy, 35(4), 1590–1594.
Kim, D.-H., Kim, S.-H., & Shin, H.-S. (2009). Hydrogen fermentation of food waste without inoculum addition. Enzyme and Microbial Technology, 45(3), 181–187.
Kim, J. K., Nhat, L., Chun, Y. N., & Kim, S. W. (2008). Hydrogen production conditions from food waste by dark fermentation with Clostridium beijerinckii KCTC 1785. Biotechnology and Bioprocess Engineering, 13(4), 499–504.
Kim, J. K., Oh, B. R., Chun, Y. N., & Kim, S. W. (2006). Effects of temperature and hydraulic retention time on anaerobic digestion of food waste. Journal of Bioscience and Bioengineering, 102(4), 328–32.
Kim, M.-S., Kim, D.-H., Son, H.-N., Ten, L. N., & Lee, J. K. (2011). Enhancing photo-fermentative hydrogen production by Rhodobacter sphaeroides KD131 and its PHB synthase deleted-mutant from acetate and butyrate. International Journal of Hydrogen Energy, 36(21), 13964–13971.
Kim, S.-H., Han, S.-K., & Shin, H.-S. (2006). Effect of substrate concentration on hydrogen production and 16S rDNA-based analysis of the microbial community in a continuous fermenter. Process Biochemistry, 41(1), 199–207.
Kim, S.-H., Sun-Kee, H., & Hang-Sik, S. (2004). Feasibility of biohydrogen production by anaerobic co-digestion of food waste and sewage sludge. International Journal of Hydrogen Energy, 29(15), 1607–1616.
Koku, H., Eroglu, I., Gunduz, U., Yucel, M., & Turker, L. (2002). Aspects of the metabolism of hydrogen production by Rhodobacter sphaeroides. International Journal of Hydrogen Energy, 27(11-12), 1315–1329.
Koku, H., Eroglu, I., Gunduz, U., Yucel, M., & Turker, L. (2003). Kinetics of biological hydrogen production by the photosynthetic bacterium Rhodobacter sphaeroides O.U. 001. International Journal of Hydrogen Energy, 28(4), 381–388.
Kondo, T., Arakawa, M., Hirai, T., Wakayama, T., Hara, M., & Miyake, J. (2002). Enhancement of hydrogen production by a photosynthetic bacterium mutant with reduced pigment. Journal of Bioscience and Bioengineering, 93(2), 145–150.
Kongjan, P., & Angelidaki, I. (2010). Extreme thermophilic biohydrogen production from wheat straw hydrolysate using mixed culture fermentation: Effect of reactor configuration. Bioresource Technology, 101(20), 7789–7796.
Kotay, S. M., & Das, D. (2008). Biohydrogen as a renewable energy resource -Prospects and potentials. International Journal of Hydrogen Energy, 33, 258–263.
Kothari, R., Singh, D. P. P., Tyagi, V. V. V., & Tyagi, S. K. K. (2012). Fermentative hydrogen production – An alternative clean energy source. Renewable and Sustainable Energy Reviews, 16(4), 2337–2346.
109
Kotsopoulos, T. a., Fotidis, I. a., Tsolakis, N., & Martzopoulos, G. G. (2009). Biohydrogen production from pig slurry in a CSTR reactor system with mixed cultures under hyper-thermophilic temperature (70 °C). Biomass and Bioenergy, 33(9), 1168–1174.
Kumar, N., & Das, D. (2000). Enhancement of hydrogen production by Enterobacter cloacae IIT-BT 08. Process Biochemistry, 35(6), 589–593.
Kvesitadze, G., Sadunishvili, T., Dudauri, T., Zakariashvili, N., Partskhaladze, G., Ugrekhelidze, V., … Jobava, M. (2011). Two-stage anaerobic process for bio-hydrogen and bio-methane combined production from biodegradable solid wastes. Energy, 37(1), 94–102.
Lalaurette, E., Thammannagowda, S., Mohagheghi, A., Maness, P.-C., & Logan, B. E. (2009). Hydrogen production from cellulose in a two-stage process combining fermentation and electrohydrogenesis. International Journal of Hydrogen Energy, 34(15), 6201–6210.
Lee, C. M., Tsai, C., Yang, C., Lee, C. M., Tsai, C., & Yang, C. (2010). Photohydrogen production from thermophilic aerobic digestion effluent and distillery wastewater by photosynthetic bacterium Rhodopseudomonas palustris WP 3-5, In conference procedings: 18th World Hydrogen Energy Conference 2010 - WHEC 2010. Thomas Grube (Eds.). 33-35.
Lee, C.-M., Hung, G.-J., & Yang, C.-F. (2011). Hydrogen production by Rhodopseudomonas palustris WP 3-5 in a serial photobioreactor fed with hydrogen fermentation effluent. Bioresource Technology, 102(18), 8350–6.
Lee, D.-J., Show, K.-Y., & Su, A. (2011). Dark fermentation on biohydrogen production: Pure culture. Bioresource Technology, 102(18), 8393–402.
Lee, K.-S., Tseng, T.-S., Liu, Y.-W., & Hsiao, Y.-D. (2012). Enhancing the performance of dark fermentative hydrogen production using a reduced pressure fermentation strategy. International Journal of Hydrogen Energy, 37(20), 15556–15562.
Lee, M.-J., Song, J.-H., & Hwang, S.-J. (2009). Effects of acid pre-treatment on bio-hydrogen production and microbial communities during dark fermentation. Bioresource Technology, 100(3), 1491–3.
Lee, Y. J., Miyahara, T., & Noike, T. (2002). Effect of pH on microbial hydrogen fermentation. Journal of Chemical Technology & Biotechnology, 77(6), 694–698. http://doi.org/10.1002/jctb.623
Lee, Y.-W., & Chung, J. (2010). Bioproduction of hydrogen from food waste by pilot-scale combined hydrogen/methane fermentation. International Journal of Hydrogen Energy, 35(21), 11746–11755.
Lee, Z.-K., Li, S.-L., Kuo, P.-C., Chen, I.-C., Tien, Y.-M., Huang, Y.-J., … Cheng, S.-S. (2010). Thermophilic bio-energy process study on hydrogen fermentation with vegetable kitchen waste. International Journal of Hydrogen Energy, 35(24), 13458–13466.
Lee, Z.-K., Li, S.-L., Lin, J.-S., Wang, Y.-H., Kuo, P.-C., & Cheng, S.-S. (2008). Effect of pH in fermentation of vegetable kitchen wastes on hydrogen production under a thermophilic condition. International Journal of Hydrogen Energy, 33(19), 5234–5241.
110
Li, C., & Fang, H. H. P. (2007a). Fermentative hydrogen production from wastewater and solid wastes by mixed Cultures. Critical Reviews in Environmental Science and Technology, 37(1), 1–39.
Li, C., & Fang, H. H. P. (2007b). Inhibition of heavy metals on fermentative hydrogen production by granular sludge. Chemosphere, 67(4), 668–73.
Li, R. Y., & Fang, H. H. P. (2009). Heterotrophic Photo Fermentative Hydrogen Production. Critical Reviews in Environmental Science and Technology, 39(12), 1081–1108.
Li, X., Wang, Y., Zhang, S., Chu, J., Zhang, M., Huang, M., & Zhuang, Y. (2011). Effects of light/dark cycle, mixing pattern and partial pressure of H2 on biohydrogen production by Rhodobacter sphaeroides ZX-5. Bioresource Technology, 102(2), 1142–8.
Li, X.-H., Liang, D.-W., Bai, Y.-X., Fan, Y.-T., & Hou, H.-W. (2014). Enhanced H2 production from corn stalk by integrating dark fermentation and single chamber microbial electrolysis cells with double anode arrangement. International Journal of Hydrogen Energy, 39(17), 8977–8982.
Lim, S.-J., Choi, D. W., Lee, W. G., Kwon, S., & Chang, H. N. (2000). Volatile fatty acids production from food wastes and its application to biological nutrient removal. Bioprocess Engineering, 22(6), 543–545.
Lin, C., & Lay, C. (2005). A nutrient formulation for fermentative hydrogen production using anaerobic sewage sludge microflora. International Journal of Hydrogen Energy, 30(3), 285–292.
Lin, C. Y., & Lay, C. H. (2004). Carbon/nitrogen-ratio effect on fermentative hydrogen production by mixed microflora. International Journal of Hydrogen Energy, 29(1), 41–45.
Lin, C.-Y., & Shei, S.-H. (2008). Heavy metal effects on fermentative hydrogen production using natural mixed microflora. International Journal of Hydrogen Energy, 33(2), 587–593.
Lin, C.-Y., Wu, S.-Y., Lin, P.-J., Chang, J.-S., Hung, C.-H., Lee, K.-S., … Lin, Y.-C. (2011). A pilot-scale high-rate biohydrogen production system with mixed microflora. International Journal of Hydrogen Energy, 36(14), 8758–8764.
Lin, Y., Wu, S., & Wang, D. (2012). Hydrogen-methane production from pulp & paper sludge and food waste by mesophilic and thermophilic anaerobic co-digestion. International Journal of Hydrogen Energy, 38(35), 15055–15062.
Liu, B.-F., Ren, N.-Q., Tang, J., Ding, J., Liu, W.-Z., Xu, J.-F., … Xie, G.-J. (2010). Bio-hydrogen production by mixed culture of photo- and dark-fermentation bacteria. International Journal of Hydrogen Energy, 35(7), 2858–2862.
Liu, B.-F., Xie, G.-J., Ding, J., & Ren, N.-Q. (2011). Optimization of Photo-Hydrogen Production by Immobilized Rhodopseudomonas Faecalis RLD-53. Natural Resources, 02(01), 1–7.
Liu, B.-F., Xie, G.-J., Wang, R.-Q., Xing, D.-F., Ding, J., Zhou, X., … Ren, N.-Q. (2015). Simultaneous hydrogen and ethanol production from cascade utilization of mono-substrate in integrated dark and photo-fermentative reactor. Biotechnology for Biofuels, 8(1).
111
Liu, C., Chang, C., Liao, Q., & Zhu, X. (2013). Biohydrogen production by a novel integration of dark fermentation and mixotrophic microalgae cultivation. International Journal of Hydrogen Energy, 38(25), 2–9.
Liu, D., Liu, D., Zeng, R. J., & Angelidaki, I. (2006). Hydrogen and methane production from household solid waste in the two-stage fermentation process. Water Research, 40(11), 2230–6.
Liu, D., Zeng, R., & Angelidaki, I. (2008). Enrichment and adaptation of extreme-thermophilic (70°C) hydrogen producing bacteria to organic household solid waste by repeated batch cultivation. International Journal of Hydrogen Energy, 33(22), 6492–6497.
Liu, D., Zeng, R. J., & Angelidaki, I. (2008). Effects of pH and hydraulic retention time on hydrogen production versus methanogenesis during anaerobic fermentation of organic household solid waste under extreme-thermophilic temperature (70 degrees C). Biotechnology and Bioengineering, 100(6), 1108–14.
Liu, H., Grot, S., & Logan, B. E. (2005). Electrochemically assisted microbial production of hydrogen from acetate. Environmental Science & Technology, 39(11), 4317–20.
Liu, W., Huang, S., Zhou, A., Zhou, G., Ren, N., Wang, A., & Zhuang, G. (2012). Hydrogen generation in microbial electrolysis cell feeding with fermentation liquid of waste activated sludge. International Journal of Hydrogen Energy, 37(18), 13859–13864.
Liu, Z., Zhang, C., Lu, Y., Wu, X., Wang, L. L., Han, B., & Xing, X.-H. (2013). States and challenges for high-value biohythane production from waste biomass by dark fermentation technology. Bioresource Technology, 135, 292–303.
Ljunggren, M., & Zacchi, G. (2009). Techno-economic evaluation of a two-step biological process for hydrogen production. Biotechnology Progress, 26(2), 496–504.
Lo, Y.-C., Chen, C.-Y., Lee, C.-M., & Chang, J.-S. (2010). Sequential dark–photo fermentation and autotrophic microalgal growth for high-yield and CO2-free biohydrogen production. International Journal of Hydrogen Energy, 35(20), 10944–10953.
Logan, B. E., Call, D., Cheng, S., Hamelers, H. V. M., Sleutels, T. J. A., Jeremiasse, A. W., & Rozendal, R. A. (2008). Microbial Electrolysis Cells for High Yield Hydrogen Gas Production from Organic Matter. Environmental Science & Technology, 42(23).
Lü, F., Ji, J., Shao, L., & He, P. (2013). Bacterial bioaugmentation for improving methane and hydrogen production from microalgae. Biotechnology for Biofuels, 6(1), 92.
Lu, L., Ren, N., Xing, D., & Logan, B. E. (2009). Hydrogen production with effluent from an ethanol-H2-coproducing fermentation reactor using a single-chamber microbial electrolysis cell. Biosensors & Bioelectronics, 24(10), 3055–60.
Luo, G., Karakashev, D., Xie, L., Zhou, Q., & Angelidaki, I. (2011). Long-term effect of inoculum pretreatment on fermentative hydrogen production by repeated batch cultivations: homoacetogenesis and methanogenesis as competitors to hydrogen production. Biotechnology and Bioengineering, 108(8), 1816–27.
112
Luo, G., Xie, L., Zou, Z., Wang, W., & Zhou, Q. (2010). Evaluation of pretreatment methods on mixed inoculum for both batch and continuous thermophilic biohydrogen production from cassava stillage. Bioresource Technology, 101(3), 959–64.
Luo, G., Xie, L., Zou, Z., Zhou, Q., & Wang, J.-Y. (2010). Fermentative hydrogen production from cassava stillage by mixed anaerobic microflora: Effects of temperature and pH. Applied Energy, 87(12), 3710–3717.
Mandal, B., Nath, K., & Das, D. (2006). Improvement of biohydrogen production under decreased partial pressure of H2 by Enterobacter cloacae. Biotechnology Letters, 28(11), 831–5.
Marbán, G., & Valdés-Solís, T. (2007). Towards the hydrogen economy? International Journal of Hydrogen Energy, 32(12), 1625–1637.
Mars, A. E., Veuskens, T., Budde, M. a. W., van Doeveren, P. F. N. M., Lips, S. J., Bakker, R. R., … Claassen, P. a. M. (2010). Biohydrogen production from untreated and hydrolyzed potato steam peels by the extreme thermophiles Caldicellulosiruptor saccharolyticus and Thermotoga neapolitana. International Journal of Hydrogen Energy, 35(15), 7730–7737.
McEwan, A. G. (1994). Photosynthetic electron transport and anaerobic metabolism in purple non-sulfur phototrophic bacteria. Antonie van Leeuwenhoek, 66(1-3), 151–64.
Menon, V., & Rao, M. (2012). Trends in bioconversion of lignocellulose: Biofuels, platform chemicals & biorefinery concept. Progress in Energy and Combustion Science, 38(4), 522–550.
Mohammadi, P., Ibrahim, S., Mohamad Annuar, M. S., & Law, S. (2011). Effects of different pretreatment methods on anaerobic mixed microflora for hydrogen production and COD reduction from palm oil mill effluent. Journal of Cleaner Production, 19(14), 1654–1658.
Monlau, F., Aemig, Q., Trably, E., Hamelin, J., Steyer, J.-P., & Carrere, H. (2013). Specific inhibition of biohydrogen-producing Clostridium sp. after dilute-acid pretreatment of sunflower stalks. International Journal of Hydrogen Energy, 38(28), 12273–12282.
Monlau, F., Barakat, A., Trably, E., Dumas, C., Steyer, J.-P., & Carrère, H. (2013). Lignocellulosic materials into biohydrogen and biomethane: Impact of structural Features and pretreatment. Critical Reviews in Environmental Science and Technology, 43(3), 260–322.
Monlau, F., Sambusiti, C., Barakat, A., Guo, X. M., Latrille, E., Trably, E., … Carrere, H. (2012). Predictive models of biohydrogen and biomethane production based on the compositional and structural features of lignocellulosic materials. Environmental Science & Technology, 46(21), 12217–25.
Monlau, F., Trably, E., Barakat, A., Hamelin, J., Steyer, J.-P., & Carrere, H. (2013). Two-stage alkaline-enzymatic pretreatments to enhance biohydrogen production from sunflower stalks. Environmental Science & Technology, 47(21), 12591–9.
Montiel-Corona, V., Revah, S., & Morales, M. (2015). Hydrogen production by an enriched photoheterotrophic culture using dark fermentation effluent as substrate: Effect of flushing method, bicarbonate addition, and outdoor–indoor conditions. International Journal of Hydrogen Energy, 40(30), 9096–9105.
113
Moreno, R., Escapa, A., Cara, J., Carracedo, B., & Gómez, X. (2015). A two-stage process for hydrogen production from cheese whey: Integration of dark fermentation and biocatalyzed electrolysis. International Journal of Hydrogen Energy, 40(1), 1–8.
Motte, J.-C., Escudié, R., Bernet, N., Delgenes, J.-P. J.-P., Steyer, J.-P. J.-P., & Dumas, C. (2013). Dynamic effect of total solid content, low substrate/inoculum ratio and particle size on solid-state anaerobic digestion. Bioresource Technology, 144, 141–8.
Motte, J.-C., Escudié, R., Hamelin, J., Steyer, J.-P., Bernet, N., Delgenes, J.-P., & Dumas, C. (2014). Substrate milling pretreatment as a key parameter for Solid-State Anaerobic Digestion optimization. Bioresource Technology, 173C, 185–192.
Motte, J.-C., Trably, E., Escudié, R., Hamelin, J., Steyer, J.-P., Bernet, N., … Dumas, C. (2013). Total solids content: a key parameter of metabolic pathways in dry anaerobic digestion. Biotechnology for Biofuels, 6(1), 164.
Motte, J.-C., Trably, E., Hamelin, J., Escudié, R., Bonnafous, A., Steyer, J.-P., … Dumas, C. (2014). Total solid content drives hydrogen production through microbial selection during thermophilic fermentation. Bioresource Technology, 166, 610–5.
Mtui, G. Y. S. (2009). Recent advances in pretreatment of lignocellulosic wastes and production of value added products. African Journal of Biotechnology, 8(8), 1398–1415.
Mu, Y., Wang, G., & Yu, H.-Q. (2006). Kinetic modeling of batch hydrogen production process by mixed anaerobic cultures. Bioresource Technology, 97(11), 1302–7.
Mussoline, W., Giovanni, E., Giordano, A., & Lens, P. (2012). The Anaerobic Digestion of Rice Straw- A Review. Critical Reviews in Environmental Science and Technology, 43(9), 895–915.
Nasr, M., Tawfik, A., Ookawara, S., Suzuki, M., Kumari, S., & Bux, F. (2014). Continuous biohydrogen production from starch wastewater via sequential dark-photo fermentation with emphasize on maghemite nanoparticles. Journal of Industrial and Engineering Chemistry.
Nath, K., & Das, D. (2004). Improvement of fermentative hydrogen production: various approaches. Applied Microbiology and Biotechnology, 65(5), 520–9.
Nath, K., & Das, D. (2009). Effect of light intensity and initial pH during hydrogen production by an integrated dark and photofermentation process. International Journal of Hydrogen Energy, 34(17), 7497–7501. http://doi.org/10.1016/j.ijhydene.2008.11.065
Nath, K., Kumar, A., & Das, D. (2005). Hydrogen production by Rhodobacter sphaeroides strain O.U.001 using spent media of Enterobacter cloacae strain DM11. Applied Microbiology and Biotechnology, 68(4), 533–41.
Nissilä, M. E., Tähti, H. P., Rintala, J. a., & Puhakka, J. a. (2011). Thermophilic hydrogen production from cellulose with rumen fluid enrichment cultures: Effects of different heat treatments. Bioresource Technology, 102(6), 1482–1490.
Ntaikou, I., Antonopoulou, G., & Lyberatos, G. (2010). Biohydrogen Production from Biomass and Wastes via Dark Fermentation: A Review. Waste and Biomass Valorization, 1(1), 21–39.
114
Ntaikou, I., Kourmentza, C., Koutrouli, E. C., Stamatelatou, K., Zampraka, A., Kornaros, M., & Lyberatos, G. (2009). Exploitation of olive oil mill wastewater for combined biohydrogen and biopolymers production. Bioresource Technology, 100(15), 3724–30.
O-Thong, S., Prasertsan, P., & Birkeland, N.-K. (2009). Evaluation of methods for preparing hydrogen-producing seed inocula under thermophilic condition by process performance and microbial community analysis. Bioresource Technology, 100(2), 909–18. http://doi.org/10.1016/j.biortech.2008.07.036
O-Thong, S., Prasertsan, P., Intrasungkha, N., Dhamwichukorn, S., & Birkeland, N.-K. (2007). Improvement of biohydrogen production and treatment efficiency on palm oil mill effluent with nutrient supplementation at thermophilic condition using an anaerobic sequencing batch reactor. Enzyme and Microbial Technology, 41(5), 583–590.
O-Thong, S., Prasertsan, P., Intrasungkha, N., Dhamwichukorn, S., & Birkeland, N.-K. (2008). Optimization of simultaneous thermophilic fermentative hydrogen production and COD reduction from palm oil mill effluent by Thermoanaerobacterium-rich sludge. International Journal of Hydrogen Energy, 33(4), 1221–1231.
Ochs, D., Wukovits, W., & Ahrer, W. (2010). Life cycle inventory analysis of biological hydrogen production by thermophilic and photo fermentation of potato steam peels (PSP). Journal of Cleaner Production, 18, 88–94.
Oh, S.-E., Iyer, P., Bruns, M. A., & Logan, B. E. (2004). Biological hydrogen production using a membrane bioreactor. Biotechnology and Bioengineering, 87(1), 119–27.
Oh, Y.-K., Kim, S. H., Kim, M.-S., & Park, S. (2004). Thermophilic biohydrogen production from glucose with trickling biofilter. Biotechnology and Bioengineering, 88(6), 690–8.
Ozkan, L., Erguder, T. H., & Demirer, G. N. (2011). Effects of pretreatment methods on solubilization of beet-pulp and bio-hydrogen production yield. International Journal of Hydrogen Energy, 36(1), 382–389.
Ozmihci, S., & Kargi, F. (2010). Bio-hydrogen production by photo-fermentation of dark fermentation effluent with intermittent feeding and effluent removal. International Journal of Hydrogen Energy, 35(13), 6674–6680.
Ozturk, Y., Yucel, M., Daldal, F., Mandaci, S., Gunduz, U., Turker, L., & Eroglu, I. (2006). Hydrogen production by using Rhodobacter capsulatus mutants with genetically modified electron transfer chains. International Journal of Hydrogen Energy, 31(11), 1545–1552.
Pakarinen, O., Kaparaju, P., & Rintala, J. (2011). The effect of organic loading rate and retention time on hydrogen production from a methanogenic CSTR. Bioresource Technology, 102(19), 8952–7.
Palmqvist, E., & Hahn-Hägerdal, B. (2000). Fermentation of lignocellulosic hydrolysates. II: inhibitors and mechanisms of inhibition. Bioresource Technology, 74(1), 25–33.
115
Pan, C., Zhang, S., Fan, Y., & Hou, H. (2010). Bioconversion of corncob to hydrogen using anaerobic mixed microflora. International Journal of Hydrogen Energy, 35(7), 2663–2669.
Pan, C.-M., Ma, H.-C., Fan, Y.-T., & Hou, H.-W. (2011). Bioaugmented cellulosic hydrogen production from cornstalk by integrating dilute acid-enzyme hydrolysis and dark fermentation. International Journal of Hydrogen Energy, 36(8), 4852–4862.
Pan, J., Zhang, R., Elmashad, H., Sun, H., & Ying, Y. (2008). Effect of food to microorganism ratio on biohydrogen production from food waste via anaerobic fermentation. International Journal of Hydrogen Energy, 33(23), 6968–6975.
Panagiotopoulos, I. A., Bakker, R. R., Budde, M. A. W., Vrije, T. De, Claassen, P. A. M., & Koukios, E. G. (2009). Fermentative hydrogen production from pretreated biomass : A comparative study. Bioresource Technology, 100(2009), 6331–6338.
Panagiotopoulos, I., Bakker, R., de Vrije, T., Van Niel, E., Koukios, E., & Claassen, P. (2011). Exploring Critical Factors for Fermentative Hydrogen Production from Various Types of Lignocellulosic Biomass. Journal of the Japan Institute of Energy, 90(4), 363–368.
Panagiotopoulos, I., Pasias, S., Bakker, R. R., de Vrije, T., Papayannakos, N., Claassen, P. a M., & Koukios, E. G. (2013). Biodiesel and biohydrogen production from cotton-seed cake in a biorefinery concept. Bioresource Technology, 136, 78–86.
Parawira, W., & Tekere, M. (2011). Biotechnological strategies to overcome inhibitors in lignocellulose hydrolysates for ethanol production: review. Critical Reviews in Biotechnology, 31(1), 20–31.
Pasupuleti, S. B., Sarkar, O., & Venkata Mohan, S. (2014). Upscaling of biohydrogen production process in semi-pilot scale biofilm reactor: Evaluation with food waste at variable organic loads. International Journal of Hydrogen Energy, 39(14), 7587–7596.
Peiris, B. R. H., Rathnashri, P. G., Johansen, J. E., Kuhn, A. and, & Bakke, R. (2006). ADM1 simulations of hydrogen production. Water Science and Technology, 53(8), 129–137.
Perera, K. R. J., Ketheesan, B., Gadhamshetty, V., & Nirmalakhandan, N. (2010). Fermentative biohydrogen production: Evaluation of net energy gain. International Journal of Hydrogen Energy, 35(22), 12224–12233.
Posten, C. (2009). Design principles of photo-bioreactors for cultivation of microalgae. Engineering in Life Sciences, 9(3), 165–177.
Quéméneur, M., Hamelin, J., Barakat, A., Steyer, J.-P., Carrère, H., & Trably, E. (2012). Inhibition of fermentative hydrogen production by lignocellulose-derived compounds in mixed cultures. International Journal of Hydrogen Energy, 37(4), 3150–3159.
Quéméneur, M., Hamelin, J., Latrille, E., Steyer, J.-P., & Trably, E. (2011). Functional versus phylogenetic fingerprint analyses for monitoring hydrogen-producing bacterial populations in dark fermentation cultures. International Journal of Hydrogen Energy, 36(6), 3870–3879.
116
Rafrafi, Y., Trably, E., Hamelin, J., Latrille, E., Meynial-Salles, I., Benomar, S., Steyer, J.-P. (2013). Sub-dominant bacteria as keystone species in microbial communities producing bio-hydrogen. International Journal of Hydrogen Energy, 33(0), 1–11.
Rai, P. K., Asthana, R. K., & Singh, S. P. (2014). Optimization of photo-hydrogen production based on cheese whey spent medium. International Journal of Hydrogen Energy, 39(14), 7597–7603.
Rai, P. K., Singh, S. P., & Asthana, R. K. (2014). Biohydrogen production from sugarcane bagasse by integrating dark- and photo-fermentation. Bioresource Technology, 152, 140–146.
Redwood, M. D., Dhillon, R., Orozco, R. L., Zhang, X., Binks, D. J., Dickinson, M., & Macaskie, L. E. (2012). Enhanced photosynthetic output via dichroic beam-sharing. Biotechnology Letters, 34(12), 2229–34.
Redwood, M. D., Orozco, R. L., Majewski, A. J., & Macaskie, L. E. (2012). An integrated biohydrogen refinery: Synergy of photofermentation, extractive fermentation and hydrothermal hydrolysis of food wastes. Bioresource Technology, 119, 384–92.
Redwood, M. D., Orozco, R. L., Majewski, A., & Macaskie, L. E. (2011). Biohydrogen production by extractive fermentation and photofermentation, 2–7.
Redwood, M. D., Paterson-Beedle, M., & Macaskie, L. E. (2008). Integrating dark and light bio-hydrogen production strategies: towards the hydrogen economy. Reviews in Environmental Science and Bio/Technology, 8(2), 149–185.
Redwood, M., & Macaskie, L. (2006). A two-stage, two-organism process for biohydrogen from glucose. International Journal of Hydrogen Energy, 31(11), 1514–1521.
Ren, N., Guo, W., Liu, B., Cao, G., & Ding, J. (2011). Biological hydrogen production by dark fermentation: challenges and prospects towards scaled-up production. Current Opinion in Biotechnology, 22(3), 365–70.
Ren, N., Li, J., Li, B., Wang, Y., & Liu, S. (2006). Biohydrogen production from molasses by anaerobic fermentation with a pilot-scale bioreactor system. International Journal of Hydrogen Energy, 31(15), 2147–2157.
Ren, N.-Q., Liu, B.-F., Ding, J., & Xie, G.-J. (2009). Hydrogen production with R. faecalis RLD-53 isolated from freshwater pond sludge. Bioresource Technology, 100(1), 484–7.
Robledo-Narváez, P. N., Muñoz-Páez, K. M., Poggi-Varaldo, H. M., Ríos-Leal, E., Calva-Calva, G., Ortega-Clemente, L. A., … Salazar-Montoya, J. A. (2013). The influence of total solids content and initial pH on batch biohydrogen production by solid substrate fermentation of agroindustrial wastes. Journal of Environmental Management, 128, 126–37.
Ruggeri, B., Tommasi, T., & Sassi, G. (2010). Energy balance of dark anaerobic fermentation as a tool for sustainability analysis. International Journal of Hydrogen Energy, 35(19), 10202–10211.
Rupprecht, J., Hankamer, B., Mussgnug, J. H., Ananyev, G., Dismukes, C., & Kruse, O. (2006). Perspectives and advances of biological H2 production in microorganisms. Applied Microbiology and Biotechnology, 72(3), 442–9.
117
Salerno, M. B., Park, W., Zuo, Y., & Logan, B. E. (2006). Inhibition of biohydrogen production by ammonia. Water Research, 40(6), 1167–72.
Saratale, G. D., Chen, S., Lo, Y., Saratale, R. G., & Chang, J. (2008). Outlook of biohydrogen production from lignocellulosic feedstock using dark fermentation – a review, 67(November), 962–979.
Sargsyan, H., Gabrielyan, L., Hakobyan, L., & Trchounian, A. (2015). Light–dark duration alternation effects on Rhodobacter sphaeroides growth, membrane properties and bio-hydrogen production in batch culture. International Journal of Hydrogen Energy, 40(11), 4084–4091.
Saritha, M., Arora, A., & Lata. (2012). Biological pretreatment of lignocellulosic substrates for enhanced delignification and enzymatic digestibility. Indian Journal of Microbiology, 52(2), 122–30.
Sasikala, K., Ramana, C. V., & Roa, P. R. (1991). Environmental regulation for optimal biomass yield and photoreduction of hydrogen by Rhodobacter sphaeroides O.U.001.pdf. International Journal of Hydrogen Energy, 16(9), 597–601.
Schievano, A., Tenca, A., Lonati, S., Manzini, E., & Adani, F. (2014). Can two-stage instead of one-stage anaerobic digestion really increase energy recovery from biomass? Applied Energy, 124, 335–342.
Schmidt, K. (1971). Carotenoids of purple nonsulfur bacteria. Archives of Microbiology, 77(3), 231–238.
Scopus. (2014). Keywords searches and abstracts. Retrieved from <http://scopus.com/> [19.12.2014]
Sevinç, P., Gündüz, U., Eroglu, I., & Yücel, M. (2012). Kinetic analysis of photosynthetic growth, hydrogen production and dual substrate utilization by Rhodobacter capsulatus. International Journal of Hydrogen Energy, 37(21), 16430–16436.
Shin, H.-S., Youn, J.-H., & Kim, S.-H. (2004). Hydrogen production from food waste in anaerobic mesophilic and thermophilic acidogenesis. International Journal of Hydrogen Energy, 29(13), 1355–1363.
Show, K., Lee, D., & Chang, J. (2011). Bioreactor and process design for biohydrogen production. Bioresource Technology, 102(18), 8524–8533.
Show, K. Y., Lee, D. J., Tay, J. H., Lin, C. Y., & Chang, J. S. (2012). Biohydrogen production: Current perspectives and the way forward. International Journal of Hydrogen Energy, 37(20), 15616–15631.
Show, K., Zhang, Z., Tay, J., Tee, D., Lee, D., Ren, N., & Wang, A. (2010). Critical assessment of anaerobic processes for continuous biohydrogen production from organic wastewater. International Journal of Hydrogen Energy, 35(24), 13350–13355.
Show, K., Zhang, Z., Tay, J., Teeliang, D., Lee, D., & Jiang, W. (2007). Production of hydrogen in a granular sludge-based anaerobic continuous stirred tank reactor. International Journal of Hydrogen Energy, 32(18), 4744–4753.
Song, Z.-X., Wang, Z.-Y., Wu, L.-Y., Fan, Y.-T., & Hou, H.-W. (2012). Effect of microwave irradiation pretreatment of cow dung compost on bio-hydrogen process
118
from corn stalk by dark fermentation. International Journal of Hydrogen Energy, 37(8), 6554–6561.
Sørensen, J., Christensen, D., Srensen, J. A. N., & Jrgensen, B. O. B. (1981). Volatile fatty acids and hydrogen as substrates for sulfate-reducing bacteria in anaerobic marine sediment. Applied and Environmental Microbiology, 42(1), 6–11.
Srikanth, S., Venkata Mohan, S., Prathima Devi, M., Peri, D., & Sarma, P. N. (2009). Acetate and butyrate as substrates for hydrogen production through photo-fermentation: Process optimization and combined performance evaluation. International Journal of Hydrogen Energy, 34(17), 7513–7522.
Su, H., Cheng, J., Zhou, J., Song, W., & Cen, K. (2009a). Combination of dark- and photo-fermentation to enhance hydrogen production and energy conversion efficiency. International Journal of Hydrogen Energy, 34(4), 1780–1786.
Su, H., Cheng, J., Zhou, J., Song, W., & Cen, K. (2009b). Improving hydrogen production from cassava starch by combination of dark and photo fermentation. International Journal of Hydrogen Energy, 34(4), 1780–1786.
Su, H., Cheng, J., Zhou, J., Song, W., & Cen, K. (2010). Hydrogen production from water hyacinth through dark- and photo- fermentation. International Journal of Hydrogen Energy, 35(17), 8929–8937.
Suwansaard, M., Choorit, W., Zeilstra-Ryalls, J. H., & Prasertsan, P. (2009). Isolation of anoxygenic photosynthetic bacteria from Songkhla Lake for use in a two-staged biohydrogen production process from palm oil mill effluent. International Journal of Hydrogen Energy, 34(17), 7523–7529.
Tabatabaei, M., Zakaria, M. R., Rahim, R. A., Wright, A. G., Shirai, Y., Abdullah, N., … Hassan, M. A. (2009). PCR-based DGGE and FISH analysis of methanogens in an anaerobic closed digester tank for treating palm oil mill effluent. Electronic Journal of Biotechnology, 12(3).
Taherzadeh, M. J., & Karimi, K. (2008). Pretreatment of lignocellulosic wastes to improve ethanol and biogas production: a review. International journal of molecular sciences, 9, 1621-1651.
Takabatake, H., Suzuki, K., Ko, I. B., & Noike, T. (2004). Characteristics of anaerobic ammonia removal by a mixed culture of hydrogen producing photosynthetic bacteria. Bioresource Technology, 95(2), 151–158.
Tang, G.-L., Huang, J., Sun, Z.-J., Tang, Q.-Q., Yan, C.-H., & Liu, G.-Q. (2008). Biohydrogen production from cattle wastewater by enriched anaerobic mixed consortia: influence of fermentation temperature and pH. Journal of Bioscience and Bioengineering, 106(1), 80–7.
Tao, Y., Chen, Y., Wu, Y., He, Y., & Zhou, Z. (2007). High hydrogen yield from a two-step process of dark- and photo-fermentation of sucrose, 32, 200–206.
Tao, Y., Yangling, H., Wu, Y., Liu, F., Li, X., Zong, W., & Zhou, Z. (2008). Characteristics of a new photosynthetic bacterial strain for hydrogen production and its application in wastewater treatment. International Journal of Hydrogen Energy, 33(3), 963–973.
Tawfik, A., El-Bery, H., Kumari, S., & Bux, F. (2014). Use of mixed culture bacteria for photofermentive hydrogen of dark fermentation effluent. Bioresource
Tawfik, A., & El-Qelish, M. (2012). Continuous hydrogen production from co-digestion of municipal food waste and kitchen wastewater in mesophilic anaerobic baffled reactor. Bioresource Technology, 114, 270–4.
Teli, A., Ficara, E., & Malpei, F. (2014). Bio-Hydrogen Production from Cheese Whey by Dark Fermentation. Chemical Engineering Transactions, 37, 613–618.
Tenca, A., Schievano, A., Perazzolo, F., Adani, F., & Oberti, R. (2011). Biohydrogen from thermophilic co-fermentation of swine manure with fruit and vegetable waste: maximizing stable production without pH control. Bioresource Technology, 102(18), 8582–8.
Tommasi, T., Ruggeri, B., & Sanfilippo, S. (2012). Energy valorisation of residues of dark anaerobic production of Hydrogen. Journal of Cleaner Production, 34, 91–97.
Tredici, M. R., & Zittelli, G. C. (1998). Efficiency of Sunlight Utilization: Tubular Versus Flat Photobioreactors. Biotechnology and bioenegineering, 57 (2), 187 – 197.
Tuna, E., Kargi, F., & Argun, H. (2009). Hydrogen gas production by electrohydrolysis of volatile fatty acid (VFA) containing dark fermentation effluent. International Journal of Hydrogen Energy, 34(1), 262–269.
Turon, V., Baroukh, C., Trably, E., Latrille, E., Fouilland, E., & Steyer, J.-P. (2015). Use of fermentative metabolites for heterotrophic microalgae growth: Yields and kinetics. Bioresource Technology, 175, 342–349.
Ugwu, C. U., Aoyagi, H., & Uchiyama, H. (2008). Photobioreactors for mass cultivation of algae. Bioresource Technology, 99(10), 4021–8.
Ugwu, C. U., Ogbonna, J. C., & Tanaka, H. (2003). Design of static mixers for inclined tubular photobioreactors. Journal of Applied Phycology, 15(2/3), 217–223.
Uyar, B., Eroglu, I., Yucel, M., Gunduz, U., & Turker, L. (2007). Effect of light intensity, wavelength and illumination protocol on hydrogen production in photobioreactors. International Journal of Hydrogen Energy, 32(18), 4670–4677.
Uyar, B., Gürgan, M., Özgür, E., Gündüz, U., Yücel, M., & Eroglu, I. (2015). Hydrogen production by hup− mutant and wild-type strains of Rhodobacter capsulatus from dark fermentation effluent of sugar beet thick juice in batch and continuous photobioreactors. Bioprocess and Biosystems Engineering.
Uyar, B., Schumacher, M., Gebicki, J., & Modigell, M. (2009). Photoproduction of hydrogen by Rhodobacter capsulatus from thermophilic fermentation effluent. Bioprocess and Biosystems Engineering, 32(5), 603–6.
Valdez-Vazquez, I., & Poggi-Varaldo, H. M. (2009). Alkalinity and high total solids affecting H2 production from organic solid waste by anaerobic consortia. International Journal of Hydrogen Energy, 34(9), 3639–3646.
Valdez-vazquez, I., Riosleal, E., Esparzagarcia, F., Cecchi, F., & Poggivaraldo, H. (2005). Semi-continuous solid substrate anaerobic reactors for H2 production from organic waste: Mesophilic versus thermophilic regime. International Journal of Hydrogen Energy, 30(13-14), 1383–1391.
120
Van Ginkel, S., & Logan, B. E. (2005). Inhibition of biohydrogen production by undissociated acetic and butyric acids. Environmental Science & Technology, 39(23), 9351–6.
Varrone, C., Rosa, S., Fiocchetti, F., Giussani, B., Izzo, G., Massini, G., … Wang, A. (2012). Enrichment of activated sludge for enhanced hydrogen production from crude glycerol. International Journal of Hydrogen Energy, 38(3), 1319–1331.
Venetsaneas, N., Antonopoulou, G., Stamatelatou, K., Kornaros, M., & Lyberatos, G. (2009). Using cheese whey for hydrogen and methane generation in a two-stage continuous process with alternative pH controlling approaches. Bioresource Technology, 100(15), 3713–7.
Venil, C. K., Zakaria, Z. A., & Ahmad, W. A. (2013). Bacterial pigments and their applications. Process Biochemistry, 48(7), 1065–1079.
Venkata Mohan, S., Lalit Babu, V., & Sarma, P. N. (2008). Effect of various pretreatment methods on anaerobic mixed microflora to enhance biohydrogen production utilizing dairy wastewater as substrate. Bioresource Technology, 99(1), 59–67.
Venkata Mohan, S., Srikanth, S., Dinakar, P., & Sarma, P. N. (2008). Photo-biological hydrogen production by the adopted mixed culture: Data enveloping analysis. International Journal of Hydrogen Energy, 33(2), 559–569.
Venkata Subhash, G., & Venkata Mohan, S. (2014). Deoiled algal cake as feedstock for dark fermentative biohydrogen production: An integrated biorefinery approach. International Journal of Hydrogen Energy, 39(18), 9573–9579.
Waligórska, M., Seifert, K., Górecki, K., Moritz, M., & Laniecki, M. (2009). Kinetic model of hydrogen generation by Rhodobacter sphaeroides in the presence of NH4+ ions. Journal of Applied Microbiology, 107(4), 1308–18.
Wang, A., Sun, D., Cao, G., Wang, H., Ren, N., Wu, W.-M., & Logan, B. E. (2011). Integrated hydrogen production process from cellulose by combining dark fermentation, microbial fuel cells, and a microbial electrolysis cell. Bioresource Technology, 102(5), 4137–43.
Wang, C. C., Chang, C., Chu, C. P., Lee, D. J., Chang, B.-V., & Liao, C. S. (2003). Producing hydrogen from wastewater sludge by Clostridium bifermentans. Journal of Biotechnology, 102(1), 83–92.
Wang, J., & Wan, W. (2008). Comparison of different pretreatment methods for enriching hydrogen-producing bacteria from digested sludge. International Journal of Hydrogen Energy, 33(12), 2934–2941.
Wang, J., & Wan, W. (2009). Factors influencing fermentative hydrogen production: A review. International Journal of Hydrogen Energy, 34(1), 799–811.
Wang, J., & Wan, W. (2009). Kinetic models for fermentative hydrogen production: A review. International Journal of Hydrogen Energy, 34(8), 3313–3323.
Wang, J., & Wan, W. (2011). Combined effects of temperature and pH on biohydrogen production by anaerobic digested sludge. Biomass and Bioenergy, 35(9), 3896–3901.
121
Wang, R., Cui, C., Jin, Y., Liu, B., Xing, D., Xie, G., & Ren, N. (2014). Photo-fermentative hydrogen production from mixed substrate by mixed bacteria. International Journal of Hydrogen Energy, 39(25), 1–5.
Wang, X., & Zhao, Y. (2009). A bench scale study of fermentative hydrogen and methane production from food waste in integrated two-stage process. International Journal of Hydrogen Energy, 34(1), 245–254.
Wang, Y.-Y., Ai, P., Hu, C.-X., & Zhang, Y.-L. (2011). Effects of various pretreatment methods of anaerobic mixed microflora on biohydrogen production and the fermentation pathway of glucose. International Journal of Hydrogen Energy, 36(1), 390–396.
Weiland, P. (2006). Biomass Digestion in Agriculture: A Successful Pathway for the Energy Production and Waste Treatment in Germany. Engineering in Life Sciences, 6(3), 302–309.
Wieczorek, N., Kucuker, M. A., & Kuchta, K. (2014). Fermentative hydrogen and methane production from microalgal biomass (Chlorella vulgaris) in a two-stage combined process. Applied Energy, 132, 108–117.
Wong, Y. M., Wu, T. Y., & Juan, J. C. (2014). A review of sustainable hydrogen production using seed sludge via dark fermentation. Renewable and Sustainable Energy Reviews, 34, 471–482.
Wu, S. C., Liou, S. Z., & Lee, C. M. (2012). Correlation between bio-hydrogen production and polyhydroxybutyrate (PHB) synthesis by Rhodopseudomonas palustris WP3-5. Bioresource Technology, 113, 44–50.
Wu, X., Zhu, J., Dong, C., Miller, C., Li, Y., Wang, L., & Yao, W. (2009). Continuous biohydrogen production from liquid swine manure supplemented with glucose using an anaerobic sequencing batch reactor. International Journal of Hydrogen Energy, 34(16), 6636–6645.
Xia, A., Cheng, J., Ding, L., Lin, R., Song, W., Zhou, J., & Cen, K. (2014). Enhancement of energy production efficiency from mixed biomass of Chlorella pyrenoidosa and cassava starch through combined hydrogen fermentation and methanogenesis. Applied Energy, 120, 23–30.
Xia, A., Cheng, J., Lin, R., Lu, H., Zhou, J., & Cen, K. (2013). Comparison in dark hydrogen fermentation followed by photo hydrogen fermentation and methanogenesis between protein and carbohydrate compositions in Nannochloropsis oceanica biomass. Bioresource Technology, 138, 204–13.
Xing, Y., Li, Z., Fan, Y., & Hou, H. (2010). Biohydrogen production from dairy manures with acidification pretreatment by anaerobic fermentation. Environmental Science and Pollution Research International, 17(2), 392–9. http://doi.org/10.1007/s11356-009-0187-4
Yang, H., Shi, B., Ma, H., & Guo, L. (2015). Enhanced hydrogen production from cornstalk by dark- and photo-fermentation with diluted alkali-cellulase two-step hydrolysis. International Journal of Hydrogen Energy, 40(36), 1–8. http://doi.org/10.1016/j.ijhydene.2015.07.062
122
Yanling, Y., Zhenmei, L. V, Hang, M. I. N., & Jun, C. (2008). Dynamic changes of microbial community diversity in a photohydrogen producing reactor monitored by PCR-DGGE. Journal of Environmental Science, 20, 1118–1125.
Yiǧit, D. Ö., Gündüz, U., Türker, L., Yücel, M. & Eroǧlu, I. (1999). Identification of by-products in hydrogen producing bacteria; Rhodobacter sphaeroides O.U. 001 grown in the waste water of a sugar refinery. Journal of Biotechnology, 70, 125–131.
Yin, D., Liu, W., Zhai, N., Yang, G., Wang, X., Feng, Y., & Ren, G. (2014). Anaerobic digestion of pig and dairy manure under photo-dark fermentation condition. Bioresource Technology, 166, 373–80.
Yuan, X., Shi, X., Zhang, P., Wei, Y., Guo, R., & Wang, L. (2011). Anaerobic biohydrogen production from wheat stalk by mixed microflora: Kinetic model and particle size influence. Bioresource Technology, 102(19), 9007–9012.
Zahedi, S., Sales, D., Romero, L. I., & Solera, R. (2014). Dark fermentation from real solid waste. Evolution of microbial community. Bioresource Technology, 151, 221–226.
Zhang, D., Dechatiwongse, P., del Rio-Chanona, E. a., Maitland, G. C., Hellgardt, K., & Vassiliadis, V. S. (2015). Modelling of light and temperature influences on cyanobacterial growth and biohydrogen production. Algal Research, 9, 263–274.
Zhang, M.-L., Fan, Y.-T., Xing, Y., Pan, C.-M., Zhang, G.-S., & Lay, J.-J. (2007). Enhanced biohydrogen production from cornstalk wastes with acidification pretreatment by mixed anaerobic cultures. Biomass and Bioenergy, 31(4), 250–254.
Zhang, Z., Show, K., Tay, J., Liang, D., & Lee, D. (2008). Biohydrogen production with anaerobic fluidized bed reactors—A comparison of biofilm-based and granule-based systems. International Journal of Hydrogen Energy, 33(5), 1559–1564.
Zhang, Z., Wang, Y., Hu, J., Wu, Q., & Zhang, Q. (2015). Influence of mixing method and hydraulic retention time on hydrogen production through photo-fermentation with mixed strains. International Journal of Hydrogen Energy, 40(20), 6521–6529.
Zheng, Y., Zhao, J., Xu, F., & Li, Y. (2014). Pretreatment of lignocellulosic biomass for enhanced biogas production. Progress in Energy and Combustion Science, 42, 35–53.
Zhu, H., & Beland, M. (2006). Evaluation of alternative methods of preparing hydrogen producing seeds from digested wastewater sludge. International Journal of Hydrogen Energy, 31(14), 1980–1988.
Zhu, H., Fang, H., Zhang, T., & Beaudette, L. (2007). Effect of ferrous ion on photo heterotrophic hydrogen production by Rhodobacter sphaeroides. International Journal of Hydrogen Energy, 32(17), 4112–4118.
Zhu, H., Suzuki, T., Tsygankov, A. a, Asada, Y., & Miyake, J. (1999). Hydrogen production from tofu wastewater by Rhodobacter sphaeroides immobilized in agar gels. International Journal of Hydrogen Energy, 24(4), 305–310.
Zhu, H., Wakayama, T., Suzuki, T., Asada, Y., & Miyake, J. (1999). Entrapment of Rhodobacter sphaeroides RV in cationic polymer/agar gels for hydrogen production in the presence of NH4
+. Journal of Bioscience and Bioengineering, 88(5), 507–12.
123
Zhu, S., Wu, Y., Yu, Z., Liao, J., & Zhang, Y. (2005). Pretreatment by microwave/alkali of rice straw and its enzymic hydrolysis. Process Biochemistry, 40(9), 3082–3086.
124
CHAPTER 3
OPERATIONAL STRATEGIES TO IMPROVE DARK FERMENTATIVE H2 PRODUCTION USING COMPLEX WASTE BIOMASS
The section 3.1 has been published as Ghimire, A., Frunzo, L., Salzano, E., Panico, A.,
Lens, P.N.L., Pirozzi, F., Esposito, G. (2015). Biomass enrichment and scale-up
implications for dark fermentation hydrogen production with mixed cultures. Chem.
Eng. Trans. 43, 2015, 391–396.
The section 3.2 has been published as Ghimire, A., Sposito, F., Frunzo, L., Pirozzi, F.,
Escudie, R., Trably, E., Lens, P.N.L., Esposito, G. (2015). Effects of operational
parameters on dark fermentative hydrogen production from biodegradable complex
waste biomass. Waste management (In press)
125
3.1 Evaluation of methods for obtaining H2 producing seed inoculum for dark
fermentation
This section summarises the results of the study performed on the enrichment of microbial
communities for enhancing hydrogen production in dark fermentation (DF) using mixed
culture, which considerably affect the overall performance. This work evaluates the
following pre-treatment methods: acid treatment, heat shock (at 95 °C and 105 °C) and
load shock pre-treatment, keeping into account scaling-up of DF systems. Further insights
are also provided on the safety aspects concerning the production and storage of H2, and
on the importance of operational costs and feasibility of the pre-treatment methods.
3.1.2 Introduction
The progressive running down of fossil fuel reserves coupled with the need of reducing
the greenhouse gas (GHG) emissions in the atmosphere has made the development of
new, renewable and environmental friendly energy sources very crucial. Hydrogen (H2)
biologically produced from organic wastes seems to be really promising, due to its
efficient hydrogen to power conversion coefficient (3.0 kWh/Nm3), high energy density
(142 MJ/kg) and harmless combustion by-products (Cardoso et al., 2014). To this aim,
either photo fermentation (PF) or dark fermentation (DF) processes have been
successfully used to biologically produce H2 from organic sources. However, DF is
usually preferred to PF due to lower operational costs and process conditions at ambient
temperature and pressure (Das and Veziroglu, 2008).
The biological conversion of organic sources into H2 is obtained by using biomasses
either consisting of pure cultures or composed of mixed cultures. Mixed systems are
generally less performing in terms of H2 yields, but are easier and less expensive to handle
as they do not require any asepsis procedure and can be fed with several different
substrates, as reported in previous studies (Valdez-vazquez et al., 2004). Here it is worth
noting that mixed bacteria communities with the ability of producing H2 are intrinsically
present in soils, sediments, sludge from wastewater treatment plants, compost, cow
dungs, municipal organic solid wastes (Wong et al., 2014). Hence, these communities can
be enriched by appropriate pre-treatment methods, although higher H2 production rate
can be only obtained if H2 consuming organisms such as methanogens and
homoacetogens are inhibited (Wang and Wan, 2009).
126
The most commonly and successfully used biomass pre-treatment methods include heat
(Wang and Wan, 2008), acid (Wang and Wan, 2008), base (Zhu and Beland, 2006), and
load shock (Luo et al,. 2010) as well as aeration (Giordano et al., 2014). These methods
are based on the observation that when the biomass experiences hostile environmental
conditions, H2 producers survive due to their ability in forming spores (e.g. Clostridium)
that protect them from the adverse conditions, hence returning to be effective again when
the environmental conditions turn to be favourable as the spores germinate (Li and Fang,
2007). Besides, the H2 consumers may not survive unless with same capacity.
The effectiveness of these pre-treatments on H2 production depends on nature of biomass,
which in turn can cause the occurrence of inconsistency in results from lab scale
experiments (Wang and Wan, 2009). Therefore a deeper knowledge of the effects that
pre-treatment methods have on H2 production from DF is necessary before operating the
scaling up of these methods as well as, being H2 highly flammable and explosive, safety
aspects in large-scale reactors are also a primary concern.
The aim of this paper is to evaluate the effectiveness of the following pre-treatment
methods (i) acid shock treatment, (ii) heat shock treatment and (iii) load shock pre-
treatment on H2 production through bio-H2 potential DF batch (BHP) tests. The
evaluation has been done by analysing the following parameters from the BHP tests: (i)
cumulative H2 production; (ii) H2 production rate; (iii) length of the lag phase; and (iv)
production of process intermediates. Furthermore, this study also deals with the safety
aspects concerning the production and storage of H2 (USEPA, 2011) and highlights the
relevance of operational cost, feasibility and complexity of the pre-treatment methods in
scaled up systems.
3.1.3 Materials and methods
Biomass used to perform the BHP tests was collected from the anaerobic digester treating
dairy waste produced by the factory "La Perla del Mediterraneo" located in Capaccio
(Salerno, Italy). The total solids (TS) and volatile solids (VS) content of biomass were
2.79 ± 0.05 % (w/w on wet mass) and 67.2 ± 0.4 % (w/w on dry mass). The sludge was
stored at 4 °C before being used. The BHP tests were fed with glucose.
All BHP tests were carried out in 1,000 mL transparent borosilicate glass bottles GL 45
(Schott Duran, Germany) used as DF batch reactors and placed in a water bath maintained
127
at 34 ± 1 °C by a thermostat (ALEAS AL 2201, 150 W). In the batch reactors, airtight
conditions were provided with caps sealed with silicon. Each bottle was equipped to
sample the internal mixture and spill out the gas. BHP tests were carried out in duplicates
at the initial pH of 7.
Heat shock treatments were carried out by heating the biomass at 105 °C for 4 h (HST-
105°C) and at 95 °C for 45 min (HST-95°C); acid shock treatment (AST) was performed
by adjusting the pH of the biomass at pH 3 using 1 M HCl for 24 h and then turning pH
back at 7 using 1 M NaOH; load shock (LST) treatment was carried out by feeding the
batch reactors with 85 g COD/L of glucose followed by acidification process for 4 days
and finally extracting the supernatant after a settlement process and replacing the
extracted liquid volume with distilled water. A substrate to biomass ratio of 0.85 g COD
glucose/g VS biomass was maintained in all BHP tests. Once the cumulative H2
production in the reactors reached a stable value (Load I), the reactors were furthermore
fed with 4.5 g of glucose (Load II).
The volume of gas produced from each BHP tests was measured on daily basis by acid
solution (1.5 % HCl) displacement method. The biogas volumes were corrected for
moisture at 0°C and 1 atm (NmL) and reported as the daily average. H2, CO2 and CH4
content in gas were measured with Varian Star 3400 gas chromatograph equipped with
ShinCarbon ST 80/100 column provided with a thermal conductivity detector and argon
as carrier gas. Samples of the digesting mixture collected from each reactor to measure
the volatile fatty acids (VFAs) content and their composition were preliminarily extracted
at 80⁰C according to the head space-solid phase micro-extraction technique (HS-SPME)
(Abalos et al., 2000) and subsequently analysed with gas chromatograph equipped with
mass spectrometry provided with helium as carrier gas. The pH was measured with a pH
meter (WTW, inolab, pH level 2). The TS and VS content of biomass and organic wastes
were determined according to Standard Methods (APHA, 2005).
The modified Gompertz relationship (equation 3.1) was used to model the H2 production
from BHP tests (Wang and Wan, 2008). The equation contains 3 parameters: i)
cumulative H2 production potential Ho (mL), ii) H2 production rate R (mL/h), iii) lag time
λ (h). Ho, R and λ were estimated from BHP test by using the Curve Fitting Toolbox in
MATLAB®.
128
H(t) = Ho · exp {−exp [R.eHo
] (λ − t) + 1} (3.1)
Where t is the time.
3.1.4 Results and discussions
The results from BHP tests are shown in Figures 3.1 and 3.2 and Tables 3.1 and 3.2. In Figure 3.1, the effects of different biomass pre-treatment methods are represented by plotting the average cumulative H2 production, whereas in Tables 3.1 and 3.2, the same effects are evaluated comparing the specific H2 production and the parameters calibrated by using equation 3.1.
Figure 3.1 - Average Cumulative H2 Production in BHP tests
From Figure 3.1 and data in Tables 3.1 and 3.2, it can be noted that LST gave better H2
production performance with highest specific H2 production (143.5 ± 13.2 NmL/g
glucose), H2 production rate (9.4 NmL/h) and a lag phase slightly longer (0.53 h) than
HST-95°C, while AST showed the lowest lag time (13.57 h). AST also gave good
cumulative H2 production (373.1 NmL) whereas BHP in the tests with HSTs was low.
From the analysis of methane content in biogas, it can be concluded that there were
negligible methanogenic activities in the tests with LST, HST-105°C and AST whereas
the BHP tests with HST-95°C was unable to completely inhibit the methanogenic
microorganisms, which could explains the lower H2 production.
0100200300400500600700800900
0 5 10 15 20 25 30
Cum
ulat
ive
H2
Prod
uctio
n (m
L)
Time (Days)LST HST-105 ⁰C HST-95 ⁰C AST
Load II: LST Load II: HST and ASTLoad I
129
Table 3.1 - Effects of biomass pre-treatment methods on biohydrogen production performance
during Load I
Pre-treatment method
Modified Gompertz modela Ho (Nml) R (Nml/h) O (h) R2
LST 657.8 9.40 69.94 0.9980
HST-105 ⁰C 341.6 1.28 138.98 0.9880
HST-95 ⁰C 238.9 2.44 69.41 0.9910 AST 373.1 1.52 13.57 0.9953 aThe parameters were determined based on average cumulative daily H2 production during Load I
After the batch reactors were fed with a second load of glucose (Load II), the H2 yield
decreased in the BHP tests with LST, HST-105⁰C and AST whereas it increased in tests
with HST-95C (Figure 3.1). In Table 3.2 the specific H2 production obtained from the
first (Load I) and the second (Load II) feeding operation as well as the respective pH
values at the beginning and at the end of the BHP tests are compared. Figure 3.2 shows
the major fermentative products accumulated at the end of the BHP tests. The production
of intermediates (VFAs) and pH values were monitored in order to evaluate the
performance of DF process. A possible reason for the lower H2 yield than expected when
a LST was performed could actually be explained with the occurrence of the inhibiting
effect due to the high butyric acid accumulation in the reactor, as indicated in the study
published by Van Ginkel and Logan (2005), whereas a low pH (3.7±0.44) could be the
cause of the lower H2 production in AST during Load II.
Table 3.2 - Comparison between Load I and Load II feeding operations
Table 3.9 - Effects of inoculum source on H2 production performance measured by the modified Gompertz model and characteristics of accumulated end products in DF of OMWW
Inoculum type
Parameters derived from modified Gompertz model Characteristics of digestate at the end of DF
aN L H2/kg total organic carbon; bMWWS: Municipal wastewater plant sludge; cPMS: Paper Mill Sludge; dCDS: Cow Dung Compost; emL H2/g TS
153
Effect of alkaline substrate pre-treatment on H2 yield
The alkaline pre-treatment method applied in this study aimed at improving hydrolysis
and solubilization of the organic matter that limit the dark fermentative substrate
conversion (Monlau et al., 2015, 2013b). However, the level of effectiveness of the
different pre-treatment methods depends on the nature of the substrate (Ariunbaatar et al.,
2014; Carlsson et al., 2012). In the study of Monlau et al. (2013c), H2 yields from
sunflower stalks increased from 2.3 (± 0.9) to 4.4 (± 2.6) mL H2/g VS, while in our study
an increase from 0.3 (± 0.1) to 6.6 (± 0.1) from mL H2/g VS from rice straw as the
substrate was achieved under similar conditions of thermo-alkaline pre-treatment (Figure
3.5 and Table 3.8). Meanwhile, H2 yields further increased to 15.7 (± 1.0) mL H2/g VS
when 8 % w/w NaOH was applied (Figure 3.5). This H2 yield is lower than the value
reported by Chen et al. (2012) with untreated rice straw, i.e. 24.8 mL/g TS at a substrate
concentration of 90 g TS/L, whereas, it is 2.2 fold higher when the substrate concentration
was 30 g TS/L (i.e. 7.1 mL H2/g TS). This disagreement might be due to physico-chemical
properties of the lignocellulosic substrates, such as particle sizes, soluble carbohydrates
content and/or substrate concentration (Monlau et al., 2013a). Chen et al. (2012) reported
an increasing trend of H2 yields, when the particle size of rice straw decreased from 10
mm to < 0.297 mm. In their study, a maximum H2 yield was obtained with a particle size
of < 0.297 mm (6.4 mL H2/g TS) at a substrate concentration of 30 g TS/L.
The effects of the chemical agents applied (NaOH) and or by-products formed (furfural,
phenols) during the pre-treatment process and the response on the dark fermentative
microbial community should be taken into consideration while selecting appropriate pre-
treatment method. Kim et al. (2009) reported a decrease in H2 yields when the Na+
concentration in a continuous DF reactor gradually increased from 0.27 to 21.00 g Na+/L
while the acclimatized fermentative community maintained their activity up to 6.00 g
Na+/L. Nonetheless, in this study, the H2 yields increased when 8 % w/w NaOH was
applied compared to 4 % w/w NaOH (Figure 3.5). Moreover, under similar pre-treatment
conditions, 12 % w/w NaOH (i.e. 5.40 g Na+/L) might either enhance the H2 yields or
exert effect on fermentative microbial community, depending on the inocula type and
adaptation to Na+ concentration. However, the application of pre-treatment methods
should be based on the substrate type (biodegradability or bioavailability of easily
fermentable carbohydrates), their practicability and economy viability.
154
Effect of inocula on H2 yield
The application of two different inoculum types for the DF of OMWW showed
differences in response of ADS and WAS in terms of dark fermentative conversion to H2
and other metabolites (Figure 3.6 and Table 3.9). Comparatively, WAS exhibited better
performances in terms of H2 production as shown by the H2 production yields and kinetics
in Table 6. The difference in H2 yields might be a result of the effect of polyphenolic
substances present in OMWW (total phenols in Table 3.4) on the fermentative
communities present in ADS and WAS (Hamdi, 1992; Ntaikou et al., 2009). Ntaikou et
al. (2009) used diluted OMWW to avoid growth inhibition, whereas, Hamdi (1992)
observed an inhibition mainly on methanogens. Nonetheless, the difference in response
of the two inocula could be also due to the difference in heat shock treatment time applied
during the HST. ADS required a longer HST time to inhibit the activity of methanogens
(Ghimire et al., 2015b) compared to WAS which has an aerobic origin. Therefore, the
treatment time could have impacted the microbial communities that could contribute to
fermentative H2 production.
The use of WAS as better inoculum is supported by the studies of Chen et al. (2012) and
Kim et al. (2011). Chen et al. (2012) achieved higher H2 yields with a sludge originated
from a municipal wastewater treatment plant when compared with other inoculum
sources like cow dung, compost and paper mill sludge. The group attributed higher H2
yields to the presence of a potential hydrolytic and fermentative bacterial microbial
community. Kim et al. (2011) hypothesized that such increase in H2 yields from sewage
sludge addition was due to the presence of iron (Fe), calcium (Ca) and phosphorous (P)
at much higher concentrations (no information on speciation was given). Further research
on the nutrient and trace metal content in inocula and how these affect the DF rates is thus
required.
The selection and application of various optimum operational parameters depends highly
on the type of substrate, i.e. mainly its biodegradability. However, the improvement of
dark fermentative H2 production should bear the cost of application of different optimal
operational parameters in terms of net energy and economy gain. It should be taken into
consideration that DF of waste biomass is not a complete conversion of organic waste,
i.e. organic acids and alcohols accumulate in the effluent, for which a subsequent
treatment needs to be provided. Valorization of these by-products can support the costs
155
associated with the optimization of the DF process. Several studies have suggested the
integration of DF with processes such as photofermentation (H2), bioelectrochemical
systems (H2) and anaerobic digestion (CH4) for further energy recovery and production
of platform molecules of economic interest, such as biopolymers (Bastidas-Oyanedel et
al., 2015; ElMekawy et al., 2014; Ghimire et al., 2015c; Xia et al., 2013)
3.2.5 Conclusion
This study aimed to investigate the optimal operational parameters in the thermophilic
DF of three types of complex waste biomass with varying biodegradability, i.e. food
waste, rice straw and OMWW. The DF applied to food waste was favored in the acidic
pH range (4.5 - 5.0), though an appropriate substrate concentration must be considered
while selecting an acidic pH range. F/M ratios of 0.5 and 1.0 at an initial pH of 5.0 gave,
respectively, 1.8 and 1.4 folds higher H2 yields than at initial pH 6.5. Likewise, F/M ratios
and pH can be optimized to achieve higher substrate utilization and H2 yields. During the
tests, higher B/A ratios (mM:mM) were associated with higher H2 yields, a B/A ratio
equivalent to 1.5 was related to the optimal H2 yield. Similarly, pre-treatment of rice straw
with 4% NaOH and 8% NaOH at 55 °C for 24 hours increased the H2 yield by 26 and 57
fold, respectively. Furthermore, WAS showed adaptability to OMWW containing
phenols and gave a nearly 2 fold higher H2 yield when compared to ADS. In conclusion,
the selection and application of the optimal operational parameters for the optimization
of H2 production rely mainly on the substrate biodegradability. Therefore, these
parameters should be optimized for each particular type of substrate prior to application
in scaled-up DF systems.
156
Figure S1. Cumulative H2 production at different initial pH values using food waste at a F/M ratio 0.5 and ADS as inoculum (dotted lines represents the results from a modified Gompertz model)
0
20
40
60
80
100
120
140
0 5 10 15 20 25
Cum
ulat
ive H
2Pr
oduc
tion
(mL)
Time (Days)
pH 4.5
pH 5.0
pH 5.5
pH 6.0
pH 6.5
pH 7.0
157
REFERENCES
Abalos, M., Bayon, J. M., & Pawliszyn, J. (2000). Development of a headspace solid-phase microextraction procedure for the determination of free volatile fatty acids in waste waters. Journal of Chromatography. A, 873(1), 107–15.
Abreu, A. A. A., Danko, A. S. S., Costa, J. C. C., Ferreira, E. C. C., & Alves, M. M. M. (2009). Inoculum type response to different pHs on biohydrogen production from l-arabinose, a component of hemicellulosic biopolymers. International Journal of Hydrogen Energy, 34(4), 1744–1751.
Alibardi, L., & Cossu, R. (2016). Effects of carbohydrate, protein and lipid content of organic waste on hydrogen production and fermentation products. Waste Management, 47(Part A), 69–77.
American Public Health Association (APHA). (2005). Standard Methods for the Examination of Water and Wastewater (21st ed.). Washington DC: American Public Health Association Water Works Association, American Water Environment Federation.
Ariunbaatar, J., Panico, A., Esposito, G., Pirozzi, F., & Lens, P. N. L. (2014). Pretreatment methods to enhance anaerobic digestion of organic solid waste. Applied Energy, 123, 143–156.
Bastidas-Oyanedel, J.-R., Bonk, F., Thomsen, M. H., & Schmidt, J. E. (2015). Dark fermentation biorefinery in the present and future (bio)chemical industry. Reviews in Environmental Science and Bio/Technology, 14(3), 473–498.
Bellucci, M., Botticella, G., Francavilla, M., & Beneduce, L. (2015). Inoculum pre-treatment affects the fermentative activity of hydrogen-producing communities in the presence of 5-hydroxymethylfurfural. Applied Microbiology and Biotechnology, 89–91.
Bligh, E. G., & Dyer, W. J. (1959). A rapid method of total lipid extraction and purification. Canadian Journal of Biochemistry and Physiology, 37(8), 911–917.
Cammarota, F., Benedetto, a Di, Sarli, V. Di, Salzano, E., & Russo, G. (2009). Journal of Loss Prevention in the Process Industries Combined effects of initial pressure and turbulence on explosions of hydrogen-enriched methane / air mixtures. Journal of Loss Prevention in the Process Industries, 22(5), 607–613.
Cappai, G., De Gioannis, G., Friargiu, M., Massi, E., Muntoni, A., Polettini, A., & Spiga, D. (2014). An experimental study on fermentative H2 production from food waste as affected by pH. Waste Management, 34(8), 1510–1519.
Cardoso, V., Romão, B. B., Silva, F. T. M., Santos, J. G., Batista, F. R. X., & Ferreira, J. S. (2014). Hydrogen Production by Dark Fermentation. Chemical Engineering Transactions, 38, 481–486.
Carlsson, M., Lagerkvist, A., & Morgan-Sagastume, F. (2012). The effects of substrate pre-treatment on anaerobic digestion systems: a review. Waste Management (New York, N.Y.), 32(9), 1634–50.
Chen, C.-C., Chuang, Y.-S., Lin, C.-Y., Lay, C.-H., & Sen, B. (2012). Thermophilic dark fermentation of untreated rice straw using mixed cultures for hydrogen production. International Journal of Hydrogen Energy, 37(20), 15540–15546.
158
Das, D., & Veziroglu, T. (2008). Advances in biological hydrogen production processes. International Journal of Hydrogen Energy, 33(21), 6046–6057.
De Gioannis, G., Friargiu, M., Massi, E., Muntoni, A., Polettini, A., Pomi, R., & Spiga, D. (2014). Biohydrogen production from dark fermentation of cheese whey: Influence of pH. International Journal of Hydrogen Energy, 39(36), 20930–20941.
De Gioannis, G., Muntoni, a, Polettini, a, & Pomi, R. (2013). A review of dark fermentative hydrogen production from biodegradable municipal waste fractions. Waste Management (New York, N.Y.), 33(6), 1345–61.
Di Benedetto, A., Di Sarli, V., Salzano, E., Cammarota, F., & Russo, G. (2009). Explosion behavior of CH4/O2/N2/CO2 and H2/O2/N2/CO2 mixtures. International Journal of Hydrogen Energy, 34(16), 6970–6978.
ElMekawy, A., Srikanth, S., Vanbroekhoven, K., De Wever, H., & Pant, D. (2014). Bioelectro-catalytic valorization of dark fermentation effluents by acetate oxidizing bacteria in bioelectrochemical system (BES). Journal of Power Sources, 262, 183–191.
Fang, H. H. P., & Liu, H. (2002). Effect of pH on hydrogen production from glucose by a mixed culture. Bioresource Technology, 82(82), 87–93.
Ferchichi, M., Crabbe, E., Gil, G.-H., Hintz, W., & Almadidy, A. (2005). Influence of initial pH on hydrogen production from cheese whey. Journal of Biotechnology, 120(4), 402–9.
Fernandes, T. V, Bos, G. J. K., Zeeman, G., Sanders, J. P. M., & van Lier, J. B. (2009). Effects of thermo-chemical pre-treatment on anaerobic biodegradability and hydrolysis of lignocellulosic biomass. Bioresource Technology, 100(9), 2575–9.
Gadhamshetty, V., Arudchelvam, Y., Nirmalakhandan, N., & Johnson, D. C. (2010). Modeling dark fermentation for biohydrogen production: ADM1-based model vs. Gompertz model. International Journal of Hydrogen Energy, 35(2), 479–490.
Ghimire, A., Frunzo, L., Pirozzi, F., Trably, E., Escudie, R., Lens, P. N. L., & Esposito, G. (2015a). A review on dark fermentative biohydrogen production from organic biomass: Process parameters and use of by-products. Applied Energy, 144, 73–95.
Ghimire, A., Frunzo, L., Salzano, E., Panico, A., Lens, P. N. L., & Pirozzi, F. (2015b). Biomass Enrichment and Scale-up Implications for Dark Fermentation Hydrogen Production with Mixed Cultures. Chemical Engineering Transactions, 43, 391–396.
Ghimire, A., Valentino, S., Frunzo, L., Trably, E., Escudié, R., Pirozzi, F., Lens, P..L. Esposito, G. (2015c). Biohydrogen production from food waste by coupling semi-continuous dark-photofermentation and residue post-treatment to anaerobic digestion: A synergy for energy recovery. International Journal of Hydrogen Energy, 40(46), 16045–16055.
Ginkel, S. V, Sung, S., & Lay, J. J. (2001). Biohydrogen production as a function of pH and substrate concentration. Environmental Science & Technology, 35(24), 4726–30. Retrieved from
Giordano, A., Sarli, V., Lavagnolo, M. C., & Spagni, A. (2014). Evaluation of aeration pretreatment to prepare an inoculum for the two-stage hydrogen and methane production process. Bioresource Technology, 166, 211–8.
159
Guo, X. M., Trably, E., Latrille, E., Carrere, H., & Steyer, J. (2013). Predictive and explicative models of fermentative hydrogen production from solid organic waste: Role of butyrate and lactate pathways. International Journal of Hydrogen Energy, 39(14), 7476–7485.
Guo, X. M., Trably, E., Latrille, E., Carrère, H., & Steyer, J.-P. (2010). Hydrogen production from agricultural waste by dark fermentation: A review. International Journal of Hydrogen Energy, 35(19), 10660–10673.
Hallenbeck, P. C., Ghosh, D., Skonieczny, M. T., & Yargeau, V. (2009). Microbiological and engineering aspects of biohydrogen production. Indian Journal of Microbiology, 49(1), 48–59.
Hamdi, M. (1992). Toxicity and biodegradability of olive mill wastewaters in batch anaerobic digestion. Applied Biochemistry and Biotechnology, 37(2), 155–163.
Hawkes, F., Hussy, I., Kyazze, G., Dinsdale, R., & Hawkes, D. (2007). Continuous dark fermentative hydrogen production by mesophilic microflora: Principles and progress. International Journal of Hydrogen Energy, 32(2), 172–184.
Kapdan, I. K., & Kargi, F. (2006). Bio-hydrogen production from waste materials. Enzyme and Microbial Technology, 38, 569–582.
Khanal, S., Chen. WH., Li, L. and Sung, S. (2004). Biological hydrogen production: effects of pH and intermediate products. International Journal of Hydrogen Energy, 29, 1123–1131.
Kim, D.-H. H., Kim, S.-H. H., Kim, H.-W. W., Kim, M.-S. S., & Shin, H.-S. S. (2011). Sewage sludge addition to food waste synergistically enhances hydrogen fermentation performance. Bioresource Technology, 102(18), 8501–8506.
Kim, D.-H., Kim, S.-H., Jung, K.-W., Kim, M.-S., & Shin, H.-S. (2011). Effect of initial pH independent of operational pH on hydrogen fermentation of food waste. Bioresource Technology, 102(18), 8646–52.
Kim, D.-H., Kim, S.-H., & Shin, H.-S. (2009). Sodium inhibition of fermentative hydrogen production. International Journal of Hydrogen Energy, 34(8), 3295–3304.
Kim, S.-H., Han, S.-K., & Shin, H.-S. (2006). Effect of substrate concentration on hydrogen production and 16S rDNA-based analysis of the microbial community in a continuous fermenter. Process Biochemistry, 41(1), 199–207.
Lee, Z.-K., Li, S.-L., Lin, J.-S., Wang, Y.-H., Kuo, P.-C., & Cheng, S.-S. (2008). Effect of pH in fermentation of vegetable kitchen wastes on hydrogen production under a thermophilic condition. International Journal of Hydrogen Energy, 33(19), 5234–5241.
Li, C., & Fang, H. H. P. (2007). Fermentative hydrogen production from wastewater and solid wastes by mixed Cultures. Critical Reviews in Environmental Science and Technology, 37(1), 1–39.
Luo, G., Xie, L., Zou, Z., Wang, W., & Zhou, Q. (2010). Evaluation of pretreatment methods on mixed inoculum for both batch and continuous thermophilic biohydrogen production from cassava stillage. Bioresource Technology, 101(3), 959–64.
Monlau, F., Barakat, A., Trably, E., Dumas, C., Steyer, J.-P., & Carrère, H. (2013). Lignocellulosic Materials Into Biohydrogen and Biomethane: Impact of Structural
160
Features and Pretreatment. Critical Reviews in Environmental Science and Technology, 43(3), 260–322.
Monlau, F., Kaparaju, P., Trably, E., Steyer, J. P., & Carrere, H. (2015). Alkaline pretreatment to enhance one-stage CH4 and two-stage H2/CH4 production from sunflower stalks: Mass, energy and economical balances. Chemical Engineering Journal, 260, 377–385.
Monlau, F., Sambusiti, C., Barakat, A., Guo, X. M., Latrille, E., Trably, E., … Carrere, H. (2012). Predictive models of biohydrogen and biomethane production based on the compositional and structural features of lignocellulosic materials. Environmental Science & Technology, 46(21), 12217–25.
Monlau, F., Trably, E., Barakat, A., Hamelin, J., Steyer, J.-P., & Carrere, H. (2013). Two-stage alkaline-enzymatic pretreatments to enhance biohydrogen production from sunflower stalks. Environmental Science & Technology, 47(21), 12591–9.
Monlau, F., Trably, E., Barakat, A., & Steyer, J. (2013). Two-Stage alkaline − Enzymatic Pretreatments To Enhance Biohydrogen Production from Sun flower Stalks. Environmental Science and Technology, 47, 12591-12599
Noguerol-Arias, J., Rodríguez-Abalde, A., Romero-Merino, E., & Flotats, X. (2012). Determination of chemical oxygen demand in heterogeneous solid or semisolid samples using a novel method combining solid dilutions as a preparation step followed by optimized closed reflux and colorimetric measurement. Analytical Chemistry, 84(13), 5548–55.
Ntaikou, I., Antonopoulou, G., & Lyberatos, G. (2010). Biohydrogen Production from Biomass and Wastes via Dark Fermentation: A Review. Waste and Biomass Valorization, 1(1), 21–39.
Ntaikou, I., Kourmentza, C., Koutrouli, E. C., Stamatelatou, K., Zampraka, a, Kornaros, M., & Lyberatos, G. (2009). Exploitation of olive oil mill wastewater for combined biohydrogen and biopolymers production. Bioresource Technology, 100(15), 3724–30.
Pakarinen, O., Lehtomäki, A., & Rintala, J. (2008). Batch dark fermentative hydrogen production from grass silage: The effect of inoculum, pH, temperature and VS ratio. International Journal of Hydrogen Energy, 33(2), 594–601.
Pan, C., Zhang, S., Fan, Y., & Hou, H. (2010). Bioconversion of corncob to hydrogen using anaerobic mixed microflora. International Journal of Hydrogen Energy, 35(7), 2663–2669.
Pan, J., Zhang, R., Elmashad, H., Sun, H., & Ying, Y. (2008). Effect of food to microorganism ratio on biohydrogen production from food waste via anaerobic fermentation. International Journal of Hydrogen Energy, 33(23), 6968–6975.
Paraskeva, P., & Diamadopoulos, E. (2006). Technologies for olive mill wastewater ( OMW ) treatment : a review. Journal of Chemical Technology and Biotechnology, 81(December 2005), 1475–1485.
Salzano, E., Cammarota, F., Di Benedetto, A., & Di Sarli, V. (2012). Explosion behavior of hydrogen-methane/air mixtures. Journal of Loss Prevention in the Process Industries, 25(3), 443–447.
161
Sambusiti, C., Monlau, F., Ficara, E., Carrère, H., & Malpei, F. (2013). A comparison of different pre-treatments to increase methane production from two agricultural substrates. Applied Energy, 104, 62–70.
Sarma, S. J., Pachapur, V., Brar, S. K., Le Bihan, Y., & Buelna, G. (2015). Hydrogen biorefinery: Potential utilization of the liquid waste from fermentative hydrogen production. Renewable and Sustainable Energy Reviews, 50, 942–951.
Shin, H.-S., Youn, J.-H., & Kim, S.-H. (2004). Hydrogen production from food waste in anaerobic mesophilic and thermophilic acidogenesis. International Journal of Hydrogen Energy, 29(13), 1355–1363.
Show, K. Y., Lee, D. J., Tay, J. H., Lin, C. Y., & Chang, J. S. (2012). Biohydrogen production: Current perspectives and the way forward. International Journal of Hydrogen Energy, 37(20), 15616–15631.
United States Environmental Protection Agency (USEPA). (2011). Common Safety Practices for On-Farm Anaerobic Digestion Systems. Retrieved from <http://www.epa.gov/agstar/documents/safety_practices.pdf > [accessed 02.11.2014]
Urbaniec, K., & Bakker, R. R. (2015). Biomass residues as raw material for dark hydrogen fermentation – A review. International Journal of Hydrogen Energy, 40(9), 3648–3658.
Valdez-vazquez, I., Rios-Leal, E., Esparza-Garcia, F., Cecchi, F., Pavan, P., & Poggi-Varaldo, H. M. (2004). A review on hydrogen production with anaerobic mixed cultures. Chemical Engineering Transactions, 4, 123–130.
Valdez-vazquez, I., Riosleal, E., Esparzagarcia, F., Cecchi, F., & Poggivaraldo, H. (2005). Semi-continuous solid substrate anaerobic reactors for H2 production from organic waste: Mesophilic versus thermophilic regime. International Journal of Hydrogen Energy, 30(13-14), 1383–1391.
VALORGAS. (2010). Compositional analysis of food waste from study sites in geographically distinct regions of Europe-Valorisation of food waste to biogas. Retrieved from <http://www.valorgas.soton.ac.uk/Deliverables/VALORGAS_241334_D2-1_rev[1]_130106.pdf> [accessed 12.01.2013].
Van Ginkel, S., & Logan, B. E. (2005). Inhibition of biohydrogen production by undissociated acetic and butyric acids. Environmental Science & Technology, 39(23), 9351–6.
Wang, J., & Wan, W. (2008). Comparison of different pretreatment methods for enriching hydrogen-producing bacteria from digested sludge. International Journal of Hydrogen Energy, 33(12), 2934–2941.
Wang, J., & Wan, W. (2009). Factors influencing fermentative hydrogen production: A review. International Journal of Hydrogen Energy, 34(1), 799–811.
Wang, J., & Wan, W. (2009). Kinetic models for fermentative hydrogen production : A review. International Journal of Hydrogen Energy, 34(8), 3313–3323.
Wong, Y. M., Wu, T. Y., & Juan, J. C. (2014). A review of sustainable hydrogen production using seed sludge via dark fermentation. Renewable and Sustainable Energy Reviews, 34, 471–482.
162
Xia, A., Cheng, J., Ding, L., Lin, R., Huang, R., Zhou, J., & Cen, K. (2013). Improvement of the energy conversion efficiency of Chlorella pyrenoidosa biomass by a three-stage process comprising dark fermentation, photofermentation, and methanogenesis. Bioresource Technology, 146, 436–43.
Zhu, H., & Beland, M. (2006). Evaluation of alternative methods of preparing hydrogen producing seeds from digested wastewater sludge. International Journal of Hydrogen Energy, 31(14), 1980–1988.
163
CHAPTER 4
LONG-TERM OPERATION OF HYDROGEN-PRODUCING CONTINUOUS REACTORS
A part of section 4.1 of this chapter has been published as Ghimire, A., Valentino, S.,
Frunzo, L., Trably, E., Escudié, R., Pirozzi, F., Lens, P.N.L., Esposito, G. (2015).
Biohydrogen production from food waste by coupling semi-continuous dark-
photofermentation and residue post-treatment to anaerobic digestion: A synergy for
energy recovery. International Journal of Hydrogen Energy, 40 (46): 16045–16055.
The section 4.2 of this chapter will be submitted as Ghimire, A., Frunzo, L., Pirozzi, F.,
Lens, P.N.L., Esposito, G., Continuous biohydrogen production from thermophilic dark
fermentation of cheese whey using: use of buffalo manure for pH control and biohydrogen
production stability.
164
4.1 Continuous H2 production from food waste at low organic loading rates
This section presents the results of the study conducted to demonstrate the long-term
continuous H2 production from dark fermentation food waste conducted in a semi-
continuous reactor operated at low organic loading rates (OLRs). The dark fermentation
(DF) process was carried out at thermophilic temperature (55±1 ⁰C) in a reactor of 2 L
with a working volume of 1.5 L, for a period of 250 days. The effect of different OLRs
and hydraulic retention time (HRT) ranging from 1 to 2.5 VS/L/d and 12 to 4 days,
respectively, were assessed on the quantity and the quality of biohydrogen–rich biogas
production. A maximum H2 yield of 139.70±54 NmL H2/g VS was observed with an OLR
of 2.5 gVS/L∙d and at 4 days HRT. Soluble metabolic end-products were monitored
during this period and it was shown that the butyric acid pathway was mainly responsible
of the H2 production. A transitory accumulation of lactic and/or propionic acids was
observed when the OLR (increment) or the HRT (decrement) was changed, causing a
decrease in H2 production. Monitoring of soluble metabolites provided a reasonable
indication of DF process performances.
4.1.1 Introduction
Over the past few decades, anaerobic digestion has gained a lot of interest since it
constitutes a promising technology for producing an energy-rich biogas from renewable
waste and biomass resources such as wastewaters, municipal organic waste, agricultural
residues, etc. The inherent characteristics of biohydrogen (H2) such as higher energy
content (143 GJ per ton), energy and water as the only by-products generated from its
combustion and the ability to be produced biologically, makes H2 as a very interesting
alternative of future sustainable biofuels (Kotay and Das, 2008). In particular, dark
fermentation (DF) systems have the potential to be one of the prominent technologies for
H2 production from renewable waste biomasses (Ghimire et al., 2015a; Urbaniec and
Bakker, 2015).
Low cost renewable waste biomasses such as agricultural residues, organic fraction of
municipal waste (OFMSW), agro-industrial wastes, etc. might give a competitive
economic advantage for the future supply of sustainable feedstock, aiming at the
industrial development of DF systems with biological treatment of waste as added benefit
(Chong et al., 2009; De Gioannis et al., 2013; Kapdan and Kargi, 2006; Ntaikou et al.,
165
2010; Wong et al., 2014). In contrast, the use of simpler feedstock sources such as pure
carbohydrates (e.g. sucrose and glucose), although it presents higher H2 conversion rates,
could make DF processes less economically competitive (Ren et al., 2011).
OFMSW which is mainly composed of food waste is receiving lot of attention because
of its high biodegradability and its potential to be utilized for the production of biofuels
and other platform chemicals (Uçkun Kiran et al., 2015). Every year, about 1.3 billion
tons per year of food get wasted, which is approximately one-third of the food produced
for human consumption (Gustavsson Jenny, Cederbery Christel, Sonesson Ulf, Van van
Otterdijk Robert, 2011). Food wastes are generated from the agricultural production, to
industrial manufacturing processes and final consumption in households. In the European
Union, the total annual production of food waste is estimated at 89.3 Mt, comprising 37.7
Mt generated from household consumption alone (European Commission, 2010). The
food waste content in volatile solids ranges from 21 to 27% which shows the high content
of organic carbon which can be valorized, and in particular for H2 production by DF
(VALORGAS, 2010). During the past few years, several researches have shown the high
potential of food waste to be used as a feedstock in DF processes for H2 production
(Cavinato et al., 2012; Elbeshbishy et al., 2012; Faloye et al., 2013; Han and Shin, 2004;
Han, SK. and Shin, 2004; Shin and Youn, 2005; Sreela-or et al., 2011; Valdez-vazquez
et al., 2005; Xiao et al., 2013).
With the advantage of a steady operation, continuous DF processes are preferred and
scaling-up is more viable in comparison to batch processes which involves regular
downtime periods of maintenance (Hawkes et al., 2007). However, stable operation of
continuous DF of food waste is mostly influenced by the bioreactor operating parameters
such as the pH, temperature, organic loading rate (OLR) and hydraulic retention time
(HRT) (Davila-Vazquez et al., 2007; De Gioannis et al., 2013; Guo et al., 2010; Ntaikou
et al., 2010; Wang and Wan, 2009). These factors also influence the microbial
communities and thus the biochemical pathways that can affect the total H2 yields in
mixed cultures (Li and Fang, 2007).
Hydrogen production rates and total H2 yield are mainly a function of substrate types and
OLRs applied (Ghimire et al., 2015a). A varying range of optimal OLR values has been
reported for FW for H2 conversion carried out in thermophilic DF processes (Ghimire et
al., 2015a). Shin et al. (Shin and Youn, 2005) found an optimal hydrogen yield of 126.25
166
L H2/kg VS at an OLR of 8 kg VS/m3/d while the H2 production decreased when the OLR
was increased to 10 kg VS/m3.d. The authors reported 8 kg VS/m3.d, 5 days and pH of
5.5, respectively, as optimal OLR, HRT and culture pH. In a study coupling DF and AD,
Cavinato et al. (Cavinato et al., 2012) reported 66.7 L H2/kg VS added at an optimum
OLR of 16.3 VS/m3.d, a HRT of 3.3 days and for a pH maintained in the range of 5-6
through the recirculation of AD effluent. Generally, HRTs in a range of 2-6 days have
been reported as optimum for DF of organic FW in a CSTR process (Ghimire et al.,
2015a). This range of HRTs is similar to the first stage of two-stage AD process
(Aslanzadeh et al., 2014).
Unlike OLR, the HRT is also a function of the substrate types and bioreactor operation
parameters. It is well understood that DF processes generate acidic microbial metabolites.
Therefore, high OLRs are often responsible for a decrease in pH due to the accumulation
of volatile fatty acids (VFAs) present in the DF effluent (DFE). Thus, most of the DF
systems require the addition of external alkalinity sources such as alkaline chemicals
(NaOH or KOH) or buffering agents (bicarbonate or phosphate buffers) (Shin and Youn,
2005). Meanwhile, few studies have reported the use of recycle water from AD as a
solution to reduce the use of external alkaline chemicals (Gottardo et al., 2013; Jung et
al., 2013). Moreover, there are additional concerns regarding the decrease in H2 yields
due to hydrogen consuming activities of methanogens or propionic producing bacteria
(Jung et al., 2013).
Moreover, thermophilic temperature is mainly favored in DF of food waste since higher
H2 yields are usually observed (Shin et al., 2004; Valdez-vazquez et al., 2005). Moreover,
a thermophilic process seems to be more economically interesting owing to its higher
yield and less requirement of feedstock in comparison to mesophilic dark fermentation
processes (Foglia et al., 2006). Foglia et al. (2006) reported better economic performances
of thermophilic DF in comparison to mesophilic operation when the process was operated
to convert sugars into hydrogen, CO2 and organic acids that were further used in a second
photofermentation process.
Most of the past studies on continuous and/ or semi-continuous dark fermentative H2
production were carried out at controlled culture pH with chemical buffering agents such
as K2HPO4, NaHCO3, Na2HPO4 (Carrillo-Reyes et al., 2012; Valdez-vazquez et al.,
2005). Likewise, even in a recent pilot scale application of DF has shown the dependency
167
on buffering agents for stable H2 production (Elsamadony and Tawfik, 2015). The high
amount of chemical buffering agents needed to maintain the operable acidogenic pH
(higher than 4.5 – 5.5), which might effect the operational cost of DF bioreactors.
Moreover, the effect of use of high concentrations of buffering agents on downstream
processes like anaerobic digestion, photofermentation, bioelectrochemical systems is
uncertain.
The current study aims at investigating thermophilic DF of food waste for continuous H2
production at varying low OLR and HRT. The study also considers the recycling of DF
effluents to investigate its effect on the performance of bioreactors, which has never been
reported in past studies, to knowledge of authors. Moreover, a major aim is to demonstrate
a long-term feasibility of continuous H2 production at varying operational conditions of
the bioreactor. The performances of the DF reactor were evaluated by daily monitoring
of H2 and metabolites production rates.
4.1.2 Materials and methods
Preparation of feedstock
An average mix waste composition as found in European countries was prepared at the
laboratory paccording to (VALORGAS, 2010). The waste mixture composed of (in % by
weight); fruit and vegetables: 72%, cooked pasta and rice: 10%, bread and bakery: 5%,
dairy products (cheese): 2%, meat and fish: 8% and snacks (biscuits): 3%. The food waste
ingredients were freshly brought from municipal markets in Naples (Italy), shredded with
a blender and immediately stored at -20 ⁰C to avoid acidification. The food waste had a
pH of 4.37 ± 0.01 and the characteristics are presented in Table 4.1.
Table 4.1 - Characteristics of food waste
Characteristics g/kg Food waste
Chemical Oxygen Demand (COD) 347.6±47.4
Carbohydrate content 105.80±0.7
TKN 6.4±0.18
Lipids 17.50±1.19
Total solids (%) 23.79±0.44%
Volatile solids (%) 22.8±0.42%
168
Experimental setup and operational conditions
An anaerobic digested sludge was collected from an anaerobic digestion plant of the farm
"La Perla del Mediterraneo" (Campania, Italy). The sludge was used as start-up seed
inoculum, after a thermal pretreatment at 105 ⁰C for 4 hours to enrich the spore forming
clostridium and inhibit the methanogens. The total solids (TS) and volatile solids (VS),
ammonia content of the inoculum were 29.54±0.22 gTS/L, 18.36±0.14 gVS/L and
283.47±10.8 NH+4/L respectively. The pH of the inoculum was 8.3±0.1 and the total
alkalinity was 1437.20±14.27 mg CaCO3/L.
A semi-continuous stirred 2 L serum bottle (Simax, Czech Republic) with 1500 ml
working volume and remaining headspace was setup in the laboratory (Figure 4.1). The
reactor was fed with food waste and the effluent was manually extracted on a daily basis.
The varying operational conditions investigated during the experimental period are
presented in the Table 4.2. Effluent and biogas samples from the reactor were daily
analyzed for determining the metabolic intermediates, i.e. VFAs, and the gas composition
(H2 and CO2). The total volume of gas was measured by volumetric water displacement.
The biogas was passed through acidic water (1.5 % HCl) and the volume of water
displaced measured the volume of total biogas. Considering this volume and the gas
composition analyzed, the volume of H2 produced was calculated.
Table 4.2 - Experimental design used for the operation of semi-continuous reactor
Experimental periods I II III IV V VI VII VIII
OLR (g VS/L∙d) 1.0 1.0 1.5 2.0 2.0 2.5 2.5 2.5
HRT (d) 12.0 6.0 6.0 6.0 4.0 4.0 8 4
Concentration (g VS/L) 12 6 9 12 8 10 20 10
169
Figure 4.1 - Schematic description of semi-continuous reactors setup for H2 production
1-Magnetic Stirrer; 2-Thermophilic water circulation bath maintained at 55 ± 2 C; 3-2 L Serum
bottle as CSTR reactor; 4-VFA sampling and substrates feeding ports; 5-Gas delivery pipe; 6-1
L serum bottle with 1.5% HCl; 7-Graduated cylinder or bottle for collecting displace acidic
water from (6)
Analytical methods
Hydrogen was quantified with a Varian Star 3400 gas chromatograph equipped with
ShinCarbon ST 80/100 column and a thermal conductivity detector. Argon was used as
carrier gas with a front and rear end pressure of 20 psi. The duration of analysis was 14
minutes. The fermentation products (lactic, acetic, propionic and butyric acids) were
quantified by High Pressure Liquid Chromatography (HPLC) (Dionex LC 25
Chromatography Oven) equipped with Synergi 4u Hydro RP 80A (size 250×4.60mm)
column and UV detector (Dionex AD25 Absorbance Detector). Gradient elution
consisted of 20% methanol, 10% acetonitrile in 5 mM H2SO4 pumped at a rate of 0.9
ml/min, using Dionex GP 50 Gradient pump. The elution time was 18.5 minutes. COD
of food waste was measured according to a method described elsewhere (Noguerol-Arias
et al., 2012). The carbohydrate content was determined according to the Dubois method
(DuBois, M., Gilles, K., Hamilton, J., Rebers, P., & Smith, 1956). Total lipids was
measured following a Bligh and Dyer chloroform/methanol total lipid extraction method
(Bligh and Dyer, 1959). The TS, VS of seed sludge and TKN were determined according
to the Standard Methods (APHA, 2005).
Water out
Water in
(3)(2)
(6)
(7)
(1)
(4)(5)
170
Data analysis
Hydrogen production rates (HPR) were expressed in L H2/m3/d while the H2 yields (HY)
were determined considering the total daily organic load fed to the reactor and expressed
as L H2 /kg VS added. Average and deviations for daily production were determined
during the steady state reached after 3 - 4 days operation. The H2 Production Stability
Index (HPSI) was evaluated by considering the ratio of standard deviation and average
HPR as reported by Tenca et al. (2011):
(4.1)
A HPSI index closer to 1 represents a stable hydrogen production.
FactoMineR, an extension on R software, was used for multivariate analysis of
metabolites distribution from the different experimental periods in relation to the
hydrogen yields and co-relation circles of the major metabolites are generated.
4.1.3 Results and discussion
Effect of operational parameters on quality and quantity of H2
The HPR, HY, H2 content in gas produced and HPSI during the eight experimental
conditions (Table 4.2) are summarized in Table 4.3. Figure 4.1 shows HPR and pH trends
during the experimental period. The reactor was operated for 253 days to demonstrate the
long-term operation feasibility operation continuous H2 production in a semi-continuous
thermophilic DF reactor. The effect of varying operational conditions of OLR and HRT
was investigated. The culture pH was experiment aimed at reducing the amount of
chemical buffering agents that are used to maintain an acid pH. Initial pH of the influent
was 7 and the pH was not regulated and adjusted itself according to the fermentative
activity with the aim at reducing the dependency on chemical buffering agents.
HPR trends showed the increases in H2 yield with the increase in OLR, the change in HY
was not significant (Table 4.3 and Figure 4.2 a). The range of HRT (12 - 4 d) studied does
not show a significant effect on HY, as seen from the comparison of HYs during the
experimental period IV and V (Table 4.3). PCA analysis, presented in Figure 4.3 (a-b)
showed that range of OLR studied (1 - 2.5 gVS/L/d) has more effects on HY than the
HRT (12 - 4 d).
HPSI =1 S.D.(HPR)Avg.HPR
171
The effect of maintaining the culture at pH 5.5 exhibited only insignificant increase in
HY, nevertheless, H2 production was stable during the experimental period (period IV,
shown by the shaded region in Figure 4.2 b), also shown by HPSI of 0.86. During the
period, the percentage of H2 in the gas averaged between 59.4 ± 6% while CO2 averaged
39.1 ± 6%. The H2 production performances during experimental period V were nearly
comparable to period IV. Furthermore, when the OLR was changed to 2.5 g VS/L/d in
period VI, the HPSI decreased to 0.63, evident by the unstable HPR (Figure 4.2 (a) and
Table 4.3). During period VII, when HRT was increased from 4 days to 8 days, the H2
production decreased and ceased (Figure 4.2 (a)), this might be attributed to the change
in H2 producing microbial community. However, the when HRT was changed back to 4
d in period VIII, the H2 production started again.
Moreover, at the end of experimental period VIII (shaded region in Figure 4.1 a), the DF
residues after settling for half an hour and removing the supernatant was recycled back
into the reactor along with the feed. The recycling the DF residues has insignificant affect
on HPR and HY. This gives supports the fact that H2 production is mainly function of
soluble fraction of carbohydrates present in the substrates Guo et al. (2013) and Monlau
et al. (2012). Thus, this fraction of DF residues demands further treatment through
anaerobic digestion. The H2 productions during the period V was compared with the
previous studies conducted with similar feedstock (Table 4.4), showed that the results
obtained from this study is comparable. Therefore, even at the low OLR 2 - 2.5, the HY
is comparable to that of the past studies. Additionally, the optimal operating conditions
of OLR (2 - 2.5 g VS/L/d) and HRT (4 – 6 d), gives this DF system a potential flexibility
to integrate with anaerobic digestion with two stage conversion to H2 and CH4
respectively (Aslanzadeh et al., 2014).
172
Table 4.3 - H2 production rate, yields and production stability from FW by mixed anaerobic
cultures
Exp. Period HPR (N L/L/d)
HY (N L/kg VSadded) H2 in biogas (%) HPSI
I 116.9±40.1 116.9±40.1 52.8%±1% 0.66 II 54.1±41.3 54.1±41.3 31.2%±1% 0.24 III 109.5±32.8 73.0±21.9 43.8%±20% 0.70 IV 210.2±29.8 105.1±14.9 59.4%±6% 0.86 V 208.0±34.8 104.0±17.4 57.2%±6% 0.83 VI 303.6±111.4 121.4±44.5 55.8%±10% 0.63 VII 133.2±112.1 53.3±44.8 46.1%±28% 0.16 VIII 408.8±97.6 163.5±39.0 59.4%±40% 0.76
(the shaded region in Figure 4.2 (a) represents the experimental period when the DF residues
were recycled back to the reactor and 1 (b) represents the period when pH was adjusted at pH
5.5)
0100200300400500600700
0 50 100 150 200 250
HPR
(Nm
LH2/L
/d) (a) (I) (II) (III) (IV) (VI) (VIII)(VII)(V)
Days
3.5
4.5
5.5
6.5
7.5
8.5
0 50 100 150 200 250
pH
Days
(b)
173
Figure 4.3 - Correlation circle of pH, HRT, OLR, HPR and HY formed by the first three
principle components dim1, Dim 2 and Dim 3 representing 53.25, 23.26 and 15.15 % of the
total variance, respectively (a) Projections according to the first two factors (Dim 1 and Dim 2).
(b) Projects according to the first and third factors (Dim 1 and Dim 3)
Table 4.4 - Comparison of H2 production from food waste by mixed cultures
Substrate type
Reactor type
Temp. (°C) pH
OLR (g VS/L·d)
Maximum assessed H2 yield (Nml H2/g VSadded)
H2 in biogas (%)
Reference
FW Batch 55 4.5 (initial) 6 46.3 23 (Shin et
al., 2004)
Vegetable kitchen waste
Intermittent-CSTR 55 6.0 28a 38.1b 40 (Lee et al.,
2010)
FW and sewage sludge
Batch 35 5.0-6.0 - 122.9c - (Kim et al., 2004)
OFMSW (FW+paper)
Semi-continuous CSTR
55 6.4 11d 360 58 (Valdez-vazquez et al., 2005)
OFMSW Packed bed reactor 38±2 5.6±0.2 16e 99 47
(Alzate-Gaviria et al., 2007)
FW Semi-continuous CSTR
55 4.5-5 2.5 104.0±17.4 57±6% This study
agCOD/L·d, b mL H2/g COD, c mL H2/g carbohydrate COD, dg VS/kg wet mass reactor·d, eg VS/kg·d, FW=Food waste, OFMSW= Organic fraction of municipal solid waste
-1.0 -0.5 0.0 0.5 1.0
-1.0
-0.5
0.0
0.5
1.0
Variables factor map (PCA)
Dim 1 (53.25%)
Dim
2 (2
3.26
%)
pH
OLR
HRT
HPR
HY
-1.0 -0.5 0.0 0.5 1.0
-1.0
-0.5
0.0
0.5
1.0
Variables factor map (PCA)
Dim 1 (53.25%)
Dim
3 (1
5.15
%)
pH
OLR
HRT
HPR
HY
(a) (b)
174
Effects on production of overall metabolic products
The concentration of major by-products, i.e. lactate, acetate, propionate, butyrate and
ethanol monitored during the fermentation period of 253 days are summarized in Table
5. These metabolites are generally present in the DF of complex substrate using mixed
cultures (Guo et al., 2013). PCA was done to understand the relationship between the
OLR, by-products and H2 production (Figure 4.3). It can be seen that H2 production is
more correlated with the butyrate as explained by variable Dim 2. However, the presence
of other metabolites does not show a clear relationship to H2 evolution, while their
proximity can suggest that these metabolites can be expected under the DF of complex
substrate by mixed consortia. The accumulation of lactate or propionate does not
represent the H2 favorable pathways, which can clarify the lower production of H2 during
the period VII, whereas, the production of butyric in a mixed fermentation pathway
indicates higher H2 yields. The presences of these metabolites for H2 favorable and
unfavorable pathways are further supported by the biochemical reactions shown in the
equations 2-9 (Table 4.6).
Although the presence of ethanol and acetate might indicate H2 production pathways (eqn.
2 and 4). However, from the PCA, they do not show clear relation with the evolution of
H2. Moreover, there might be a biochemical pathways that could favors the production of
propionate and acetate which are catalyzed by propionic acid bacteria, shown in equation
7 (Tyree et al., 1991). This fact can be supported by an increase in production of acetic
and propionic acid (8.3 ± 3.4 and 23.7 ± 12.6 mM) during the experimental period VII,
when HRT increased from 4 days to 8 days. Likewise, no clear co-relation was found
between HY and butyric to acetic acid (B/A) ratio as suggested by Hawkes et al. (2007)
(data not presented here) (equation 5). Therefore, the presence of acetate might not always
give an indication of H2 production. It can be seen from the results presented in Table 4.5
that the sudden change in OLR or/and HRT could change the metabolic pathways to
lactate and propionate production. However, the pathways can be reversible, when the
HRT was changed back to 4 days from 8 days the reactor stated to H2 production. The
monitoring of soluble metabolites can aids in an operational management of the DF
bioreactors.
175
Table 4.5 - Characteristics of influent and effluents DF of FW during different experimental
periods
Exp. Period pH_IN pH_OUT Lactate
(mM) Ethanol (mM)
Acetate (mM)
Propionate (mM)
Butyrate (mM)
I 7.00 4.7±0.3 0.1±0.2 4.8±0.2 13.1±3.6 3.8±2.2 10.4±2.8 II 7.00 4.5±0.1 0.6±1.4 5.4±3.5 3.2±2.0 3.4±2.3 6.2±4.2 III 7.00 4.5±0.2 4.0±9.1 8.7±2.7 4.9±0.6 6.0±2.2 11.0±1.6 IV 7.00 4.9±0.4 0.0±0.0 17.2±8.6 8.5±1.8 9.6±2.9 12.0±2.9 V 7.00 4.7±0.2 0.0±0.0 17.1±6.6 6.7±1.9 5.7±2.1 9.9±3.2 VI 7.00 4.4±0.1 0.5±0.9 9.4±5.3 5.7±2.8 5.9±2.7 11.1±7.5 VII 7.00 4.50±0.1 3.9±1.8 10.6±1.8 8.3±3.4 23.7±12.6 14.9±5.8 VIII 7.00 4.47±0.9 0.2±0.2 6.1±2.2 9.0±6.5 8.8±7.7 16.4±10.5
Table 4.6 - Reaction stoichiometry in dark fermentation of glucose
Possible H2 producing pathways Metabolic pathways ΔG’0
other uses (8.4%) (Eurostat, 2013). Cheese manufacturing industries generate liquid
waste by-products, mainly cheese whey (CHW) (Carvalho et al., 2013; Venetsaneas et
al., 2009). Simultaneously, livestock activities also produce large quantities of solid
animal manure waste, fodder waste (which generally contains a lignocellulosic fraction)
and wastewater which includes urine and feces which can pose threats to the atmospheric
and aquatic environment due to pathogens and high nitrogen (ammoniacal nitrogen)
contents (Cantrell et al., 2008). DF of waste biomass can be one of the very promising
178
technologies, which can provide environmental credentials from recovery of renewable
energy in the form of biohydrogen (H2), as well as organic waste treatment.
Generally, the waste biomass rich in carbohydrates is considered to be most suited for DF
processes (Azwar et al., 2014; Ghimire et al., 2015a; Guo et al., 2010; Monlau et al.,
2013; Yasin et al., 2013). CHW can be very suitable feedstock for DF processes as it is
characterized by high organic loads, comprising mainly soluble form of carbohydrates
(lactose), protein and lipids (Marone et al., 2014; Moreno et al., 2015; Teli et al., 2014).
Although animal manure is not considered as suitable substrate for DF processes, it can
be used as co-substrate. It has been suggested in previous studies that animal manure can
provide macro and micronutrients such as NH3, P, K and trace metals required for
bacterial growth as well as it can act as buffering agent to maintain the alkalinity (Lateef
et al., 2012; Marone et al., 2014; Perera and Nirmalakhandan, 2011). In anaerobic
digestion processes for methane production, the production of acidity from VFAs
generation is balanced by production of alkalinity from ammonia and bicarbonate
(Michael H, 2003; Redzwan and Banks, 2010). However, DF processes are not stable due
to continuous production of VFAs, lowering the process pH.
Culture pH plays an important role in the biochemical pathways and H2 yields. Depending
on the type of substrates, often an acidic range (5.0-6.0) favors H2 production while a
very low pH can inhibit the hydrogen production (Ghimire et al., 2015a; Khanal et al.,
2003). DF processes require nutrient supplements and adequate pH buffering agents to
maintain optimal DF conditions, which can inevitably impede the economic sustainability
of the DF process in scaled-up applications (Gottardo et al., 2013; Tenca et al., 2011).
Choi and Ahn (2013) have suggested the use of substrates with a high pH to replace
chemical buffers. There have been very few studies carried out using animal manure as a
buffering agent and nutrient amendment in order to get higher H2 yields (Marone et al.,
2014; Tenca et al., 2011; Wu et al., 2009). In particular, reports on the effect of animal
manure addition on long-term continuous H2 production is very scarce (Tenca et al.,
2011).
The aim of this work is to study the use of buffalo manure (BM) as a co-substrate for
continuous H2 production using CHW as a main substrate in thermophilic DF process.
The study also aims at maximizing the H2 yields along with optimal process stability. In
addition to quantity and quality of daily H2 productions, major soluble metabolites,
179
culture pH, total alkalinity, and the ammonium (NH4+-N) concentrations were monitored
to assess the process performances.
4.2.2 Materials and methods
Start-up, inoculum and feedstock
The heat shocked anaerobic digested sludge collected from an anaerobic digestion plant
described elsewhere (Ghimire et al., 2015b) was used as start-up inoculum. The total
solids (TS), volatile solids (VS) and ammonia (NH+4-N) content of the inoculum are
29.54±0.22 gTS/L, 18.36±0.14 gVS/L and 283.47±10.8 gNH+4/L, respectively. The pH
of the inoculum was 8.3±0.1 and the total alkalinity was 1437.20±14.27 mg CaCO3/L.
The CHW and BM collected from the cheese factory and buffalo farm in Salerno, Italy,
were stored at <4 ⁰C for further use in the experiments. The waste composition used in
the study is presented in Table 4.7.
Table 4.7 - Characteristics of cheese whey and buffalo manure
Characteristics Cheese whey Buffalo manure
pH 4.88±0.01 8.05±0.01
Total solids (%) 6.06±0.03% 5.67±0.04%
Volatile solids (g/L) 50.54±0.22 42.17±1.35
Total COD (g/L) 67.02±6 ND
Soluble sugars (g/L) 12.88±0.34 ND
TKN (g/L) 0.86±0 1.99±0.1
Lactic acid (g/L) 2.52±0.172 ND
Alkalinity (g/L) 0.5±0 4.37±1
ND- Not Determined
Semi-continuous reactor and operating conditions
A continuously stirred tank reactor of 1500 ml working volume and 700 ml headspace
was setup with continuous biogas measurement (Figure 4.1). The reactor was fed with
CHW and the effluent extracted manually on daily basis. The produced total volume of
gas was measured with volumetric displacement method passing through acidic water
(1.5 % HCl) and the volume of H2 was confirmed by the analysis of gas composition.
Based on the different feeding strategy of BM and operational conditions of the reactor,
180
the operation periods were divided into seven experimental periods as shown in Table
4.8.
Table 4.8 - Operational conditions and buffalo manure feeding strategies during different
experiments runs
Experimental Periods
CHW:BM
(gVS/gVS)
Total OLR
(gVS/L/d)
OLR of CHW
(gVS/L/d)
HRT
(d)
I 0 0.7 0.7 12.0
II 0 2.1 2.1 12.0
III 1 4.2 2.1 12.0
IV 4 2.6 2.1 12.0
V 4 2.6 2.1 8.0
VI 2 3.2 2.1 8.0
VII 4 2.6 2.1 8.0
Analytical methods
The biogas composition was quantified by Varian Star 3400 gas chromatograph equipped
with ShinCarbon ST 80/100 column and a thermal conductivity detector. The duration of
analysis was 14 minutes. Argon was used as carrier gas with front and rear end pressure
of 20 psi. The major fermentation products (lactic, acetic, propionic and butyric acids)
were quantified by High Pressure Liquid Chromatography (HPLC) (Dionex LC 25
Chromatography Oven) equipped with Synergi 4u Hydro RP 80A (size 250×4.60mm)
column and UV detector (Dionex AD25 Absorbance Detector), as described elsewhere
(Ghimire et al., 2015b). Ethanol was also quantified by HPLC (Aminex HPX-87H
column (300 mm on 7,8 mm, Bio-rad), as described elsewhere (Ghimire et al., 2015b).
COD was determined according to a method described elsewhere (Noguerol-Arias et al.,
2012). The carbohydrates were determined by Dubois method (DuBois et al., 1956) and
total lipids were measured by Bligh and Dyer chloroform/methanol total lipid extraction
method (Bligh and Dyer, 1959). TS, VS of seed sludge and TKN were determined
according to Standard Methods (APHA, 2005).
Data analysis
Biohydrogen production rates (HPR) were expressed in mL H2/L/d while the H2 yields
(HY) were determined considering the total daily CHW and BM fed to reactor and
expressed as mL H2 /g VS added. Average values and corresponding standard deviations
181
were calculated after allowing the 3 - 4 days of time to achieve the steady state. The H2
Production Stability Index (HPSI) was evaluated by considering the ratio of standard
deviation and average HPR, reported previously by Tenca et al. (2011) given in equation
4.1. Principal Component Analysis (PCA) analysis was carried in statistical analysis was
carried in FactomineR extension R Commander (Version 2.1-7 OS X) included in R
software (Version 3.1.1 OS X).
4.2.3 Results and discussion
Effect of CHW:BM ratio on HY, HPR and HPSI
The HY, HPR and HPSI during seven experimental periods of 110 days are summarized
in Table 4.9 and Figure 4.5. The addition of buffalo manure improved the H2 production
stability to 0.66 and 0.71 during the experimental periods III and IV, respectively. The
HY during the start-up of the reactor, i.e. periods I and II increased for some days,
however the production of H2 was not sustained due to pH depletion as a result of VFA
accumulation. The HY decreased at the end of the period IV, even though the pH was
stable around 4.8 ± 0.1. This might be attributed due to the increase in total metabolites
concentration in the reactor. One of the best strategies to avoid VFA accumulation is
facilitating its removal from the reactor by decreasing the HRT without washing out of
the microbial biomass.
During the experimental period V, the H2 production decreased further when the HRT of
the reactor was decreased from 12 to 8 days. This might be due to washing out of the
biomass which was evident by the decreased in fermentative acitivities seen from lower
yields in other metabolic by-products (Table 4.10). Moreover, another reason for low HY
can be the sudden decrease in the culture pH. Consequently, BM fraction in the feed was
increased (Table 4.8) as a strategy to increase alkalinity in the reactor. The H2 production
increased for a while, however it did not lasted longer. This might be due to proliferation
of H2 consumers such as methanogens present in the BM (Cheong and Hansen, 2006; Wu
et al., 2009). As a control strategy CHW:BM ratio was increased again, decreasing the
BM in the influent feed. This eventually increased the H2 production (Figure 4.5).
182
Table 4.9 - H2 production performance during the dark fermentation at different CHW:BM ratio
Exp. Periods CHW:BM (gVS/gVS) HY HPR HPSI H2 % CO2 %
I 0 123.8±85.1 73.8±45.7 0.38 37.04±7.0% 40.13±10.4%
II 0 95.3±64.1 134.9±90.7 0.33 46.69±7.1% 40.37±9.6%
III 1 139.8±47.8 197.8±67.7 0.66 51.85±9.0% 44.43±6.7%
IV 4 152.2±43.9 215.4±62.1 0.71 58.01±4.8% 39.13±4.6%
V 4 51.8±29.3 73.4±41.4 0.44 38.47±12.6% 27.80±4.7%
VI 2 76.2±76.1 183.0±107.7 0.41 38.38±21.2% 37.32±12.0%
VII 4 131.7±44.6 186.3±63.7 0.66 51.10±6.3% 46.34±6.4%
Table 4.10 - Characteristics of effluents from the DF of CHW with BM as co-substrate during different experimental periods
Exp. Periods
Ammonia (mg NH4
+-N/L)
Total Alkalinity (mg CaCO3/L)
pH_OUT Lactate (mM/gVS)
Ethanol (mM/g VS)
Acetate (mM/gVS)
Propionate (mM/gVS)
Butyrate (mM/gVS)
Hydrogen (mM/gVS)
I 157.9±0.0 1019.3±145.0 5.6±0.3 0.00±0.0 17.27±4.2 21.19±11.6 3.43±2.9 14.80±7.3 7.44±4.5
II 71.8±0.0 337.4±82.9 4.6±0.1 1.42±0.7 2.60±0.1 9.60±11.1 4.09±6.5 8.99±2.7 4.60±3.1
III 389.3±59.2 1327.6±388.2 5.0±0.2 0.69±0.8 5.74±1.9 2.61±1.3 0.31±0.2 7.51±2.4 3.38±1.1
IV 179.4±34.0 1184.4±373.6 4.8±0.1 0.29±0.5 10.45±3.3 4.18±2.1 0.51±0.4 14.12±6 5.88±1.7
V 111.2±3.6 394.5±127.0 4.5±0.1 2.99±1.5 13.70±0.0 2.20±0.9 0.17±0.2 9.64±3.9 2.00±1.1
VI 86.1±35.9 878.6±265.8 5.2±0.1 1.18±1.2 8.48±0.8 2.10±1.7 0.10±0.1 6.69±3.7 2.46±2.4
VII 81.2±8.2 619.7±152.8 4.8±0.1 1.41±1.4 12.27±1.7 3.28±1.4 0.22±0.2 10.72±3.7 5.09±1.7
183
Figure 4.5 - Daily H2 yields during the different buffalo manure feeding strategies in semi-
continuous DF reactor using CHW as main substrate and BM as co-substrate
Effect of BM addition on pH, alkalinity and ammonia concentration
The trends of alkalinity, ammonia and pH during the different BM feeding strategies are
presented in Figure 4.6. The production of organic acids that followed the DF are
responsible for decreases in the culture pH. The culture pH has profound impact on the
selection and growth of fermentative microbial communities and thus their metabolic
pathways (H2 production). Therefore, it is necessary to maintain the culture pH in the DF
process below the inhibitory levels of 4.5, which favours solventogenesis. Figure 4.6 (a)
and (b) show alkalinity, ammonia and pH trends, repectively, during different BM feeding
strategies (CHW:BM ratios). Addition of BM to the reactor resulted in an increased in
alkalinity, which stabilized the culture pH during the process around 4.8 to 5. Similarly,
Figure 4.7 (b) tried to establish the relationship between the Total alkalinity (Tak) to Total
acids (Tac) ratio and HPSI. The higher HPSI was obtained when the Tak/Tac ratio is
between 3 – 4. This suggests requirement of constant alkalinity source to maintain a stable
culture pH and H2 production during the DF process.
0.0
0.5
1.0
1.5
2.0
2.5
3.0
3.5
4.0
4.5
5.0
0
50
100
150
200
250
300
350
400
0 20 40 60 80 100
OL
R, C
HW
:BM
(g
TV
S/L
.day
, g V
S/g
VS)
Dai
ly H
2 Y
ield
(Nm
L/g
VS/
d)
Days
HY (mL/g TVS) Total OLR (BM+CHW) g TVS/L·day CHW:BM (gVS:gVS)
IVI II III V VI VII
184
Figure 4.6 - CHW:BM ratio, total alkalinity (as mg CaCO3/L), and ammonium concentration
(as NH4+N/L) (A) and pH trends (B), during the different buffalo manure feeding strategies in a
semi-continuous DF reactor
Figure 4.7 - Total/Alkalinity ratio and HPSI during the different operational strategies
0.0
1.0
2.0
3.0
4.0
5.0
6.0
7.0
0
200
400
600
800
1000
1200
1400
1600
1800
2000
0 20 40 60 80 100
CH
W:B
M (g
VS:
gVS)
Am
mon
ia-N
itrog
en a
nd T
otal
Alk
alin
ity(m
g /L
)
Days
Ammonia-Nitrogen Total Alkalinity CHW:BM (gVS:gVS)
A
I VIIVIIVIIIII V
4.0
4.5
5.0
5.5
6.0
6.5
7.0
0 20 40 60 80 100
pH
Days
BI VIIVIIVIIIII V
0.00.10.20.30.40.50.60.70.8
0.02.04.06.08.0
10.012.014.0
I II III IV V VI VII
HPS
I
TAc /
TAk
Total Acids (Tac)/ Total Alkalinity (Tak) HPSI
185
The limitation in the use of animal manure might be a need for physical or chemical
treatment for inhibiting methanogenic activities which consume H2 (Cheong and Hansen,
2006; Wu et al., 2009). However, this study did not consider any pre-treatment for BM
before feeding. Moreover, another, limitation in the use of BM could be an inhibition of
the H2 production due to higher ammonia content in BM. The animal manure such as
swine, poultry and dairy manure have a low C/N ratio (C/N ratio of swine manure: 12.8)
(Yin et al., 2014) and higher levels of ammoniacal nitrogen (cattle slurry: 1040 -1925
mg/l and chicken manure 7000 - 12,800 mg/L) (Callaghan et al., 2002) that might cause
inhibition of microbial community. Cavinato et al. (2012) reported the decrease in H2
production at total ammoniacal nitrogen concentration higher than 2 g N/L. However,
ammonia levels in our study were lower than the inhibitory levels reported in literature.
Metabolites production
Major metabolites such as lactate, acetate, propionate, butyrate and ethanol, produced
during the different experimental periods are summarized in Table 4.10. With the
different concentrations of organic acids and alcohols present in the dark fermentation
effluent, H2 production can be related to more than one biochemical pathways presented
in Table 4.6. The principal component analysis of co-relation circles presented in Figure
4.8 suggests that the H2 production was mainly due to the butyrate and acetate pathways
which are well co-related with the HY. Unsurprisingly, other metabolites such as
propionate, lactate or ethanol, which normally do not represent H2 favorable pathways,
were not well correlated.
186
Figure 4.8 - Correlation circle of six metabolites formed by the first two principle components
dim1 and Dim 2 representing 26.56 and 23.65 % of the total variance, respectively.
4.2.4 Conclusion
DF of acidic wastewater could be challenging due to decrease in pH by the consequent
production of organic acids during the DF process without source of alkalinity. A long-
term continuous production of H2 has been demonstrated in this work using CHW and
BM. HY of 131.8±38.0 mL H2/g VS was obtained with HPSI of 0.71 when the CHW to
BM ratio was 3.4 g VS/gVS. However, use of BM characterized by higher alkalinity could
be applied as co-substrate for maintenance of operable pH during the DF process around
4.8 – 5. Therefore, addition of BM can aid in the stability of the continuous dark
fermentative H2 production and remove the dependency on chemical-buffering agents.
Furthermore, BM can provide the source of nutrients (nitrogen) during the DF of
carbohydrate rich substrates like CHW. Hence, a co-fermentation of CHW with BM could
give economic sustainability in scaled-up applications of DF processes that use locally
available feedstock sources.
-1.0 -0.5 0.0 0.5 1.0
-1.0
-0.5
0.0
0.5
1.0
Variables factor map (PCA)
Dim 1 (26.56%)
Dim
2 (2
3.65
%) Lactate
Ethanol
Acetate.
Propionate
Butyrate
Hydrogen.
187
REFERENCES
Alzate-Gaviria, L. M., Sebastian, P. J., Pérez-Hernández, A., & Eapen, D. (2007). Comparison of two anaerobic systems for hydrogen production from the organic fraction of municipal solid waste and synthetic wastewater. International Journal of Hydrogen Energy, 32(15), 3141–3146.
APHA. (2005). Standard Methods for the Examination of Water and Wastewater (20th ed., Vol. Standard M). Washington DC: American Public Health Association Water Works Association, American Water Environment Federation.
Aslanzadeh, S., Rajendran, K., & Taherzadeh, M. J. (2014). A comparative study between single- and two-stage anaerobic digestion processes: Effects of organic loading rate and hydraulic retention time. International Biodeterioration & Biodegradation, 95, 1–8.
Azwar, M. Y., Hussain, M. a., & Abdul-Wahab, a. K. (2014). Development of biohydrogen production by photobiological, fermentation and electrochemical processes: A review. Renewable and Sustainable Energy Reviews, 31, 158–173.
Bligh, E. G., & Dyer, W. J. (1959). A rapid method of total lipid extraction and purification. Canadian Journal of Biochemistry and Physiology, 37(8), 911–917.
Callaghan, F. J., Wase, D. A. J., Thayanithy, K., & Forster, C. F. (2002). Continuous co-digestion of cattle slurry with fruit and vegetable wastes and chicken manure, 27, 71–77.
Cantrell, K. B., Ducey, T., Ro, K. S., & Hunt, P. G. (2008). Livestock waste-to-bioenergy generation opportunities. Bioresource Technology, 99(17), 7941–53.
Carrillo-Reyes, J., Celis, L. B., Alatriste-Mondragón, F., & Razo-Flores, E. (2012). Different start-up strategies to enhance biohydrogen production from cheese whey in UASB reactors. International Journal of Hydrogen Energy, 37(7), 5591–5601.
Carvalho, F., Prazeres, A. R., & Rivas, J. (2013). Cheese whey wastewater: Characterization and treatment. Science of the Total Environment, 445-446, 385–396.
Cavinato, C., Giuliano, A., Bolzonella, D., Pavan, P., & Cecchi, F. (2012). Bio-hythane production from food waste by dark fermentation coupled with anaerobic digestion process: A long-term pilot scale experience. International Journal of Hydrogen Energy, 37(15), 11549–11555.
Cheong, D.-Y., & Hansen, C. L. (2006). Bacterial stress enrichment enhances anaerobic hydrogen production in cattle manure sludge. Applied Microbiology and Biotechnology, 72(4), 635–43.
Choi, J., & Ahn, Y. (2013). Characteristics of biohydrogen fermentation from various substrates. International Journal of Hydrogen Energy, 39(7), 3152–3159.
Chong, M., Sabaratnam, V., Shirai, Y., Ali, M., & Hassan, M. A. (2009). Biohydrogen production from biomass and industrial wastes by dark fermentation. International Journal of Hydrogen Energy, 34(8), 3277–3287.
Davila-Vazquez, G., Arriaga, S., Alatriste-Mondragón, F., León-Rodríguez, A., Rosales-Colunga, L. M., & Razo-Flores, E. (2007). Fermentative biohydrogen production:
188
trends and perspectives. Reviews in Environmental Science and Bio/Technology, 7(1), 27–45.
De Gioannis, G., Friargiu, M., Massi, E., Muntoni, A., Polettini, A., Pomi, R., & Spiga, D. (2014). Biohydrogen production from dark fermentation of cheese whey: Influence of pH. International Journal of Hydrogen Energy, 39(36), 20930–20941.
De Gioannis, G., Muntoni, a, Polettini, a, & Pomi, R. (2013). A review of dark fermentative hydrogen production from biodegradable municipal waste fractions. Waste Management (New York, N.Y.), 33(6), 1345–61.
DuBois, M., Gilles, K., Hamilton, J., Rebers, P., & Smith, F. (1956). Colorimetric method for determination of sugars and related substances. Analytical Chemistry, 28(3), 350–356.
Elbeshbishy, E., Hafez, H., & Nakhla, G. (2012). Viability of ultrasonication of food waste for hydrogen production. International Journal of Hydrogen Energy, 37(3), 2960–2964.
Elsamadony, M., & Tawfik, A. (2015). Potential of biohydrogen production from organic fraction of municipal solid waste (OFMSW) using pilot-scale dry anaerobic reactor. Bioresource Technology, 196, 9–16.
European Commission, D. E.-D. C. (2010). Prepatory study on food waste across EU 27-Final Report. European Commision. Retrieved from <http://ec.europa.eu/environment/eussd/pdf/bio_foodwaste_report.pdf> [accessed 10.07.14]
Eurostat. (2013). Agricultural products - Statistics Explained. Retrieved February 20, 2015, from <http://ec.europa.eu/eurostat/statistics-explained/index.php/Agricultural_products> [accessed 02.02.2015].
Faloye, F. D., Kana, E. B. G., & Schmidt, S. (2013). Optimization of hybrid inoculum development techniques for biohydrogen production and preliminary scaleup. International Journal of Hydrogen Energy, 38(27), 11765–11773.
Foglia, D., Wukovits, W., Friedl, A., Vrije, T. De, & Pieternel, A. M. (2006). Fermentative Hydrogen Production : Influence of Application of Mesophilic and Thermophilic Bacteria on Mass and Energy Balances, 2, 815–820.
Ghimire, A., Frunzo, L., Pirozzi, F., Trably, E., Escudie, R., Lens, P. N. L., & Esposito, G. (2015a). A review on dark fermentative biohydrogen production from organic biomass: Process parameters and use of by-products. Applied Energy, 144, 73–95.
Ghimire, A., Frunzo, L., Pontoni, L., Lens, P. N. L., Esposito, G., & Pirozzi, F. (2015b). Dark fermentation of complex waste biomass for biohydrogen production by pretreated thermophilic anaerobic digestate. Journal of Environmental Management, 152, 43–48.
Gottardo, M., Cavinato, C., Bolzonella, D., & Pavan, P. (2013). Dark Fermentation Optimization by Anaerobic Digested Sludge Recirculation: Effects on Hydrogen Production, 32, 997–1002.
Guo, X. M., Trably, E., Latrille, E., Carrere, H., & Steyer, J. (2013). Predictive and explicative models of fermentative hydrogen production from solid organic waste: Role of butyrate and lactate pathways. International Journal of Hydrogen Energy, 39(14), 1–10.
189
Guo, X. M., Trably, E., Latrille, E., Carrère, H., & Steyer, J.-P. (2010). Hydrogen production from agricultural waste by dark fermentation: A review. International Journal of Hydrogen Energy, 35(19), 10660–10673.
Gustavsson Jenny, Cederbery Christel, Sonesson Ulf, Van van Otterdijk Robert, M. A. (2011). Global food losses and food waste-Extent, causes and prevention. Rome. Retrieved from <http://www.fao.org/docrep/014/mb060e/mb060e.pdf> [accessed 04.04.2014]]
Han, S.-K., & Shin, H.-S. (2004). Performance of an innovative two-stage process converting food waste to hydrogen and methane. Journal of the Air & Waste Management Association (1995), 54(2), 242–9. Retrieved from
Han, SK. and Shin, H. (2004). Biohydrogen production by anaerobic fermentation of food waste. International Journal of Hydrogen Energy, 29(6), 569–577.
Hawkes, F., Hussy, I., Kyazze, G., Dinsdale, R., & Hawkes, D. (2007). Continuous dark fermentative hydrogen production by mesophilic microflora: Principles and progress. International Journal of Hydrogen Energy, 32(2), 172–184.
Jung, K. W., Moon, C., Cho, S. K., Kim, S. H., Shin, H. S., & Kim, D. H. (2013). Conversion of organic solid waste to hydrogen and methane by two-stage fermentation system with reuse of methane fermenter effluent as diluting water in hydrogen fermentation. Bioresource Technology, 139, 120–127.
Kapdan, I. K., & Kargi, F. (2006). Bio-hydrogen production from waste materials. Enzyme and Microbial Technology, 38, 569–582.
Khanal, S., Chen. WH., Li, L. and Sung, S. (2004). Biological hydrogen production: effects of pH and intermediate products. International Journal of Hydrogen Energy, 29, 1123–1131.
Kim, S.-H., Han, S.-K., & Shin, H.-S. (2006). Effect of substrate concentration on hydrogen production and 16S rDNA-based analysis of the microbial community in a continuous fermenter. Process Biochemistry, 41(1), 199–207.
Kim, S.-H., Sun-Kee, H., & Hang-Sik, S. (2004). Feasibility of biohydrogen production by anaerobic co-digestion of food waste and sewage sludge. International Journal of Hydrogen Energy, 29(15), 1607–1616.
Kotay, S. M., & Das, D. (2008). Biohydrogen as a renewable energy resource -Prospects and potentials. International Journal of Hydrogen Energy, 33, 258–263.
Lateef, S. a., Beneragama, N., Yamashiro, T., Iwasaki, M., Ying, C., & Umetsu, K. (2012). Biohydrogen production from co-digestion of cow manure and waste milk under thermophilic temperature. Bioresource Technology, 110, 251–257.
Lee, Z.-K., Li, S.-L., Kuo, P.-C., Chen, I.-C., Tien, Y.-M., Huang, Y.-J., … Cheng, S.-S. (2010). Thermophilic bio-energy process study on hydrogen fermentation with vegetable kitchen waste. International Journal of Hydrogen Energy, 35(24), 13458–13466.
Li, C., & Fang, H. H. P. (2007). Fermentative hydrogen production from wastewater and solid wastes by mixed Cultures. Critical Reviews in Environmental Science and Technology, 37(1), 1–39.
190
Marone, A., Varrone, C., Fiocchetti, F., Giussani, B., Izzo, G., Mentuccia, L., … Signorini, A. (2014). Optimization of substrate composition for biohydrogen production from buffalo slurry co-fermented with cheese whey and crude glycerol, using microbial mixed culture. International Journal of Hydrogen Energy, 40(1), 209–218.
Michael H, G. (2003). The microbiology of anaerobic digesters. Somerset, NJ, USA: Wiley-Interscience.
Monlau, F., Barakat, A., Trably, E., Dumas, C., Steyer, J.-P., & Carrère, H. (2013). Lignocellulosic Materials Into Biohydrogen and Biomethane: Impact of Structural Features and Pretreatment. Critical Reviews in Environmental Science and Technology, 43(3), 260–322. Retrieved from
Monlau, F., Sambusiti, C., Barakat, A., Guo, X. M., Latrille, E., Trably, E., … Carrere, H. (2012). Predictive models of biohydrogen and biomethane production based on the compositional and structural features of lignocellulosic materials. Environmental Science & Technology, 46(21), 12217–25.
Moreno, R., Escapa, A., Cara, J., Carracedo, B., & Gómez, X. (2015). A two-stage process for hydrogen production from cheese whey: Integration of dark fermentation and biocatalyzed electrolysis. International Journal of Hydrogen Energy, 40(1), 1–8.
Noguerol-Arias, J., Rodríguez-Abalde, A., Romero-Merino, E., & Flotats, X. (2012). Determination of chemical oxygen demand in heterogeneous solid or semisolid samples using a novel method combining solid dilutions as a preparation step followed by optimized closed reflux and colorimetric measurement. Analytical Chemistry, 84(13), 5548–55.
Ntaikou, I., Antonopoulou, G., & Lyberatos, G. (2010). Biohydrogen Production from Biomass and Wastes via Dark Fermentation: A Review. Waste and Biomass Valorization, 1(1), 21–39.
Perera, K. R. J., & Nirmalakhandan, N. (2011). Evaluation of dairy cattle manure as a supplement to improve net energy gain in fermentative hydrogen production from sucrose. Bioresource Technology, 102(18), 8688–8695.
Redzwan, G., & Banks, C. J. (2010). Supplementation of ammonium bicarbonates for the treatment of fruit cordial wastewater by anaerobic digestion process. Anaerobe, 16(1), 34–37.
Ren, N., Guo, W., Liu, B., Cao, G., & Ding, J. (2011). Biological hydrogen production by dark fermentation: challenges and prospects towards scaled-up production. Current Opinion in Biotechnology, 22(3), 365–70.
Shin, H., JH., Y., & SH., and K. (2004). Hydrogen production from food waste in anaerobic mesophilic and thermophilic acidogenesis. International Journal of Hydrogen Energy, 29(13), 1355–1363.
Shin, H.-S., & Youn, J.-H. (2005). Conversion of food waste into hydrogen by thermophilic acidogenesis. Biodegradation, 16(1), 33–44.
Sreela-or, C., Imai, T., Plangklang, P., & Reungsang, A. (2011). Optimization of key factors affecting hydrogen production from food waste by anaerobic mixed cultures. International Journal of Hydrogen Energy, 36(21), 14120–14133.
191
Teli, A., Ficara, E., & Malpei, F. (2014). Bio-Hydrogen Production from Cheese Whey by Dark Fermentation. Chemical Engineering Transactions, 37, 613–618.
Tenca, A., Schievano, A., Perazzolo, F., Adani, F., & Oberti, R. (2011). Biohydrogen from thermophilic co-fermentation of swine manure with fruit and vegetable waste: maximizing stable production without pH control. Bioresource Technology, 102(18), 8582–8.
Thauer, R. K., Jungermann, K., Decker, K., & Pi, P. P. H.--. (1977). Energy conservation in chemotrophic anaerobic bacteria. Bacteriological Reviews, 41(3), 809.
Tyree, R. W., Clausen, E. C., & Gaddy, J. L. (1991). The production of propionic acid from sugars by fermentation through lactic acid as an intermediate. Journal of Chemical Technology & Biotechnology, 50, 157–166.
Uçkun Kiran, E., Trzcinski, A. P., Ng, W. J., & Liu, Y. (2015). Bioconversion of food waste to energy: A review. Fuel, 134, 389–399.
Urbaniec, K., & Bakker, R. R. (2015). Biomass residues as raw material for dark hydrogen fermentation – A review. International Journal of Hydrogen Energy, 40(9), 3648–3658.
Valdez-vazquez, I., Riosleal, E., Esparzagarcia, F., Cecchi, F., & Poggivaraldo, H. (2005). Semi-continuous solid substrate anaerobic reactors for H2 production from organic waste: Mesophilic versus thermophilic regime. International Journal of Hydrogen Energy, 30(13-14), 1383–1391.
VALORGAS. (2010). Compositional analysis of food waste from study sites in geographically distinct regions of Europe-Valorisation of food waste to biogas. Retrieved from <http://www.valorgas.soton.ac.uk/Deliverables/VALORGAS_241334_D2-1_rev[1]_130106.pdf> [accessed 12.01.2013].
Venetsaneas, N., Antonopoulou, G., Stamatelatou, K., Kornaros, M., & Lyberatos, G. (2009). Using cheese whey for hydrogen and methane generation in a two-stage continuous process with alternative pH controlling approaches. Bioresource Technology, 100(15), 3713–7.
Wang, J., & Wan, W. (2009). Factors influencing fermentative hydrogen production: A review. International Journal of Hydrogen Energy, 34(1), 799–811.
Wong, Y. M., Wu, T. Y., & Juan, J. C. (2014). A review of sustainable hydrogen production using seed sludge via dark fermentation. Renewable and Sustainable Energy Reviews, 34, 471–482. 8
Wu, X., Zhu, J., Dong, C., Miller, C., Li, Y., Wang, L., & Yao, W. (2009). Continuous biohydrogen production from liquid swine manure supplemented with glucose using an anaerobic sequencing batch reactor. International Journal of Hydrogen Energy, 34(16), 6636–6645.
Xiao, L., Deng, Z., Fung, K. Y., & Ng, K. M. (2013). Biohydrogen generation from anaerobic digestion of food waste. International Journal of Hydrogen Energy, 38(32), 13907–13913.
Yasin, N. H. M., Mumtaz, T., Hassan, M. A., & Abd Rahman, N. (2013). Food waste and food processing waste for biohydrogen production: a review. Journal of Environmental Management, 130(June 2011), 375–85.
192
Yin, D., Liu, W., Zhai, N., Yang, G., Wang, X., Feng, Y., & Ren, G. (2014). Anaerobic digestion of pig and dairy manure under photo-dark fermentation condition. Bioresource Technology, 166, 373–80.
193
CHAPTER 5
INTEGRATION OF DARK FERMENTATION IN A BIOREFINERY CONCEPT
A part of section 5.1 of this chapter has been has been published as Ghimire, A.,
Valentino, S., Frunzo, L., Trably, E., Escudié, R., Pirozzi, F., Lens, P.N.L., Esposito, G.
(2015). Biohydrogen production from food waste by coupling semi-continuous dark-
photofermentation and residue post-treatment to anaerobic digestion: A synergy for
energy recovery. International Journal of Hydrogen Energy, 40(46) 16045–1605.
A section 5.2 of this chapter has been published as Ghimire, A., Valentino, S., Frunzo, L.,
Pirozzi, F., Lens, P.N.L., Esposito, G. (2016). Valorization of by-products from
thermophilic dark fermentation of food waste via concomitant production of biohydrogen
and polyhydroxybutyrate using adapted Rhodobacter sphaeroides and mixed
photofermentative culture. Bioresource Technology (In press).
A section 5.3 of this chapter will be submitted as as Ghimire, A., Frunzo, L., Pirozzi, F.,
Trably, E., Lens, P.N.L., Esposito, G., Cazier, E.A., Escudie, R., Solid State Dark
Fermentation for waste biomass valorization by production of biohydrogen and platform
molecules: Effect of total solids contents and hydrogen partial pressure on substrate
conversion.
194
5.1 Integration of dark-photo fermentation and anaerobic digestion for enhanced
energy yields
This sections presents the results of the study aimed at maximizing the energy yields from
food waste in a three-step conversion scheme coupling dark fermentation (DF),
photofermentation (PF) and anaerobic digestion (AD). The DF effluents mainly contained
volatile fatty acids (VFAs) and alcohols as metabolites and un-hydrolyzed solid residues.
The supernatant, after separation, was used to recover H2 in a PF using Rhodobacter
sphaeroides. The solid residual fraction along with PF effluent was converted into
methane by anaerobic digestion.
5.1.1 Introduction
The inherent characteristics of hydrogen (H2), such as higher energy content (142 MJ per
kg), energy and water as the only by-products generated from its combustion, application
in fuel cells for electricity generation and the ability to be produced biologically, makes
H2 a very interesting alternative future sustainable energy carrier (Kotay and Das, 2008).
Among several biological technologies proposed for H2 production, dark fermentation
(DF) is emerging as one of the prominent options, shown by the increasing research
interests in this technology (Ghimire et al., 2015a). The advantages such as the flexibility
to operate under different conditions of temperature and pressure, higher production rates,
possibility to use renewable waste biomass as feedstock and the treatment capability make
the DF process attractive. Waste biomass such as agricultural residues, the organic
fraction of municipal solid waste (OFMSW) and agro-industrial wastes are economically
competitive when considering a supply of sustainable feedstock, aiming at the industrial
development of DF systems for biological treatment of waste (Chong et al., 2009; De
Gioannis et al., 2013; Ntaikou et al., 2010).
It has been well documented that dark fermentative H2 production is generally due to the
conversion of the initial soluble fraction of carbohydrates present in the complex organic
biomass, that will lead to accumulation of volatile fatty acids (VFAs) and alcohols in
DFEs (Guo et al., 2013; Monlau et al., 2012). Some recent studies have shown the
potential of these DFEs to be utilized in PF processes for H2 production (Chookaew et
al., 2015; Rai et al., 2014). Combining DF with PF, Su et al. (Su et al., 2010) achieved an
increase in H2 yield from 76.7 to 596.1 L H2/kg VS from water hyacinth. Meanwhile, Rai
et al. (Rai et al., 2014) achieved 43% higher volumetric H2 yields from acid hydrolyzed
195
sugarcane bagasse in two step DF-PF systems. However, during the conversion of
complex organic biomass like FW, a part of the unhydrolyzed solid residues will remain
that can be further valorized in AD systems producing methane (CH4) in a three steps
conversion scheme (Figure 5.1). Xia et al. (Xia et al., 2013a, 2013b) reported that a three-
step conversion of algal biomass combining DF-PF-AD can achieve 1.7 and 1.3 times
higher energy yields in comparison to a two-stage DF-AD and an one stage AD process,
respectively.
Figure 5.1 - Schematic of the three-stage conversion of FW to hydrogen and methane.
High OLRs are often responsible for a decrease in culture pH due to the accumulation of
VFAs present in DFE. Thus, most of the continuous DF systems utilizing acidic substrates
such as food waste require constant addition of external alkalinity sources such as alkaline
chemicals (NaOH or KOH) or buffering agents (bicarbonate or phosphate buffers)
(Elsamadony and Tawfik, 2015; Shin and Youn, 2005; Valdez-vazquez et al., 2005). A
long-term study of continuous H2 production at varying operating conditions of OLR and
HRT to establish a long-term operability for continuous H2 production in relation with
the production of metabolites could provide further insights for the development of
scaled-up DF systems. Similarly, a three-step conversion process (DF, PF and AD) might
contribute to an increase in overall energy yield and could provide the biological
treatment to the by-products generated from DF systems.
This study aims to demonstrate the long-term operational feasibility of continuous H2
production from FW using a semi-continuous thermophilic DF reactor at various low
OLRs and HRTs without pH control. The experiment also aimed at reducing the
Dark fermentation
Biomethanation
Photofermentation
Separation (Settling & Centrifuge)
Supernatant
Spent Residues
Photofermentation Effluent
H2
H2
CH4
Food waste
196
dependency on chemical buffering agents that are used to maintain the culture pH at
working conditions. H2 production through different possible biochemical pathways was
discussed in relation to major metabolites present in DFEs, obtained during the varying
experimental conditions. The potential of coupling DF with photofermentative H2
production was investigated in batch PF experiments by using the liquid fraction of the
DFE after physical separation. Further, the waste streams generated from the coupling of
DF-PF were utilized in AD to maximize the energy yields and provide integrated waste
treatment solutions.
5.1.2 Materials and methods
Preparation of feedstock
An average composition of waste, as found in European countries, was prepared as cited
elsewhere (VALORGAS, 2010). The waste mixture was prepared at the laboratory and
was composed of (in % by weight): fruit and vegetables 72%, cooked pasta and rice 10%,
bread and bakery 5%, dairy products (cheese) 2%, meat and fish 8% and snacks (biscuits)
3%. The FW ingredients were freshly bought at municipal markets in Naples (Italy),
shredded with a blender and immediately stored at -20 ⁰C to avoid acidification. The FW
characteristics were (in g/kg FW): chemical oxygen demand (COD), 347.6 ± 47.4;
(as PO43-), 35.8 and total Fe 0.045. Ten mL of the culture (1.52 g TSS/L) that represents
2.5 % V/V of the reactor working volume was used as inoculum in the PF experiments
with DFE (Table 5.1).
Transparent 500 mL borosilicate serum glass bottles (Simax, Czech Republic) with 400
mL working volume were used as photofermentative batch reactor. The batch reactors
were maintained at room temperature (24 ± 2 °C, April-May) under a luminance of about
4000 Lux and positioned on the top of the stirrers. Caps of the reactors presented two
separate ports for biogas and culture medium sampling. The bottles were sealed with
silica and flushed with argon to ensure anaerobic conditions and eliminate the nitrogen
gas (N2) from the headspace since N2 can inhibit the activity of the nitrogenase enzyme
responsible for photofermentative H2 production (Koku et al., 2002). The H2 production
was quantified as in DF process.
AD of residues from DF-PF process
A batch test was carried out in 1 liter transparent borosilicate serum glass bottles (Simax,
Czech Republic) and was maintained at 34 ± 1°C in a water bath. The working volume
of the reactor was 600 mL with an initial S/X ratio of 0.5 with a substrate concentration
of 4.5 g VS/L. A low S/X ratio 0.5 was selected to assess the biomethane potential of the
feed used. Based on the substrate type, a range of S/X ratio 0.5 - 2.3 gVS substrate/gVS
inoculum is suggested to prevent the acidification of the AD reactor (Esposito et al.,
2012). The source of inoculum used in the tests was the same as the start up inoculum
used in the semi-continuous DF reactor. The characteristics of the inoculum were (in g/L):
TS, 23.71 ± 0.17; VS, 14.55 ± 0.11; ammonium (NH4+-N), 0.46 ± 0.02; and had a pH 8.2
± 0.1. The tests were carried out in duplicates.
199
Analytical methods
Hydrogen was quantified with a Varian Star 3400 gas chromatograph equipped with a
ShinCarbon ST 80/100 column and a thermal conductivity detector. Argon was used as
the carrier gas with a front and rear end pressure of 20 psi. The duration of analysis was
14 minutes. The fermentation products (lactic, acetic, propionic and butyric acids) were
quantified by High Pressure Liquid Chromatography (HPLC) (Dionex LC 25
Chromatography Oven) equipped with a Synergi 4u Hydro RP 80A (size 250×4.60mm)
column and UV detector (Dionex AD25 Absorbance Detector). The gradient elution
consisted of 20% methanol and 10% acetonitrile in 5 mM H2SO4 pumped at a rate of 0.9
mL/min, using a Dionex GP 50 Gradient pump. The elution time was 18.5 minutes.
Ethanol was quantified by HPLC (Aminex HPX-87H column (300 mm on 7,8 mm, Bio-
rad) using 5 mM H2SO4 as an eluent. The COD of the FW was measured as described
elsewhere (Noguerol-Arias et al., 2012). The carbohydrate content was determined
according to the Dubois method (DuBois, M., Gilles, K., Hamilton, J., Rebers, P., &
Smith, 1956). Total lipids were measured following a Bligh and Dyer
chloroform/methanol total lipid extraction method (Bligh and Dyer, 1959). The light
intensity was measured with a light meter (Lutron-LX-107). The TS and VS of the seed
sludge and TKN were determined according to the Standard Methods (APHA, 2005).
Data analysis
Hydrogen production rates (HPR) were expressed in L H2/m3/d while the H2 yields (HY)
were determined considering the total daily organic load fed to the reactor and expressed
as L H2 /kg VS added. Average and deviations for daily production were determined
during the steady state reached after 3-4 days of operation. The H2 Production Stability
Index (HPSI) was evaluated by considering the ratio of standard deviation and average
HPR as reported by Tenca et al. (Tenca et al., 2011):
(5.1)
A HPSI index closer to 1 represents a stable hydrogen production.
FactoMineR, an extension on R software, was used for multivariate analysis of the
metabolite distribution from the different experimental periods in relation to the hydrogen
yields and co-relation circles of the major metabolites were generated.
HPSI =1 S.D.(HPR)Avg.HPR
200
5.1.3 Results and discussion
Effect of operational parameters on H2 production rate and yield
The results in terms of H2 yields (HY), hydrogen production rates (HPR) and H2
Production Stability Index (HPSI) during the different OLRs and HRTs investigated in
the six operation periods (Table 5.2) are summarized in Table 5.3. Figure 5.2 shows the
HPR (a) and pH trends (b), over the operation period of 193 days. The results show an
increase in HPR when OLRs were increased. During the operating periods II, III and IV
at a constant HRT of 6 days, the HPR increased from 54.1 ± 41, to 109.5 ± 33 and 210.2
± 30 N L/m3/d, when the OLR was increased from 1 to 1.5 and 2 g VS/m3/d, respectively
(Tables 2 and 3). Meanwhile, the overall HY increased from 54.1 ± 41.3 N L/kg VSadded
to 105.1 ± 14.9 N L H2/kg VSadded. During the experimental period IV, the H2 production
had a comparatively better stability as shown by a HPSI of 0.86. However, no significant
effect was observed on the total HY and HPR when the HRT changed to 4 days during
operational period V (Table 5.3). When the OLR was changed from 2 to 2.5 kg VS/m3/d
during period VI, both HY and HPR increased. However, the H2 production was not
stable, supported by a lower value of HPSI of 0.63. This instability could be explained by
the accumulation of acids and a subsequent decrease in pH to 4.4 ± 0.1, which might have
affected the microbial community.
During a short operation period (at the end of period IV), the culture pH inside the reactor
was regulated manually to an initial culture pH 5.5 with 1 M NaOH, during feeding, with
the objective to assess the influence of pH on the H2 production performance (Figure 5.2
b). However, pH regulation did not show any effect on the HPR (Figure 5.2 a).
Nevertheless, the increased HPSI (Table 5.3) showed that H2 production was stable
during that period in comparison to the experimental period when the culture pH was
uncontrolled. The percentage of H2 and CO2 in the gas averaged 59 ± 6% and 39 ± 6%,
respectively, when the H2 production stabilized. However, the H2 production
performances in experimental period IV (HPR: 210.2 ± 29.8 N L/ m3/d and HY: 105.1 ±
14.9 N L/kg VSadded at a HRT of 6 days and OLR 2 kg VS/m3/d) were comparable to
experimental period V (HPR: 208.0 ± 34.8 N L/m3/d and HY: 104.0 ± 17.4 N L/kg VSadded
at a HRT of 4 days and OLR of 2 g VS/L/m3/d). Thus, the operational conditions of period
V were considered as ideal for the DF of FW in thermophilic semi-continuous reactors,
201
as a lower HRT are generally more economically efficient in terms of bioreactor design
and operation.
Table 5.3 - H2 production rate, yields and production stability from FW by mixed anaerobic
cultures
Exp. Period HPR (N L/m3/d)
HY (N L/kg VSadded)
H2 in biogas (%) HPSI
I 116.9±40.1 116.9±40.1 52.8%±1% 0.66 II 54.1±41.3 54.1±41.3 31.2%±1% 0.24 III 109.5±32.8 73.0±21.9 43.8%±20% 0.70 IV 210.2±29.8 105.1±14.9 59.4%±6% 0.86 V 208.0±34.8 104.0±17.4 57.2%±6% 0.83 VI 303.6±111.4 121.4±44.5 55.8%±10% 0.63
Figure 5.2 - HPR (L H2/m3/d) (a) and pH trends in semi-continuous thermophilic reactor (b);
shaded region represents the experimental period when the culture pH inside the reactor was
adjusted daily to pH 5.5 during the feeding operation.
A comparison of previous studies on dark fermentative H2 production from FW with the
results from this study (Table 4.4) suggests that comparable results in terms of H2
production can be achieved even at low OLRs and without pH control. Nonetheless, the
characteristics of FW can also affect the overall HY as H2 production is mainly function
of the soluble fraction of carbohydrates present in the substrate (Guo et al., 2013). The
OLRs reported in the past studies were higher than in this study, and thus a source of
0
200
400
600
800
0 20 40 60 80 100 120 140 160 180 200
HPR
(N L
/m3 .d
) (a) (I) (II) (III) (IV) (V) (VI)
3.5
4.5
5.5
6.5
7.5
8.5
0 20 40 60 80 100 120 140 160 180 200
pH
Time (d)
(b)
202
alkalinity to balance the pH conditions at optimum was required. Valdez-Vazquez et al.
(Valdez-vazquez et al., 2005) used NaHCO3 and K2HPO4 to maintain the optimum pH at
6.4, while Lee et al. (Lee et al., 2010) used NaOH and H3PO4 to maintain the culture pH
at 6. Thus, this pH decrease resulting from the production of acids can be minimized by
the use of lower OLRs. Higher OLRs can exert detrimental effects on the microbial
community, and thus H2 production, by decreasing the pH due to the accumulation of
metabolites (Van Ginkel and Logan, 2005).
Metabolic intermediates
Lactate, acetate, propionate, butyrate and ethanol were the main metabolic intermediates
observed during the different experimental periods. Such a mixture of intermediates is
characteristic of mixed fermentation pathways occurring with complex substrates (Guo
et al., 2013). Average concentrations of the main metabolites during the six different
experimental periods are summarized in Table 5.4. There can be a number of possible
H2 production pathways during mixed type fermentation, as represented by equations 2 –
5 (Table 4.6), whereas H2 consuming or unfavorable pathways presented in equations 6
– 9 might exist at the same time (Hawkes et al., 2007; Li and Fang, 2007). The presence
of ethanol, acetate and butyrate are evidences for the presence of an ethanol-acetate or
butyrate-acetate pathway for H2 production in the DF of the FW investigated. On the other
hand, the presence of lactate or propionate can be attributed to fluctuations in H2
production resulting in low H2 yields.
Table 5.4 - Characteristics of influent and effluents from DF of FW during different
experimental periods
Exp. Period pH_IN pH_OUT Lactate
(mM) Ethanol (mM)
Acetate (mM)
Propionate (mM)
Butyrate (mM)
I 7.00 4.7±0.3 0.1±0.2 4.8±0.2 13.1±3.6 3.85±2.21 10.4±2.8 II 7.00 4.5±0.1 0.6±1.4 5.4±3.5 3.2±2.0 3.44±2.33 6.2±4.2 III 7.00 4.5±0.2 4.0±9.1 8.7±2.7 4.9±0.6 5.97±2.16 11.0±1.6 IV 7.00 4.9±0.4 0.0±0.0 17.2±8.6 8.5±1.8 9.65±2.91 12.0±2.9 V 7.00 4.7±0.2 0.0±0.0 17.1±6.6 6.7±1.9 5.70±2.15 9.9±3.2 VI 7.00 4.4±0.1 0.5±0.9 9.4±5.3 5.7±2.8 5.89±2.70 11.1±7.5
Figure 5.3 shows the plot of correlation circles of the five major metabolites and the HY.
Figure 5.3 (a) shows that the butyrate and acetate concentration is well correlated with
the HY values. Not surprisingly, propionate, lactate and ethanol are in the Dim 2 and are
not correlated with the HY, which is supported by equations 6 - 9 (Table 4.6) in a DF
203
with glucose as model substrate. However, the pathways leading to ethanol-acetate also
yield H2, as shown in Equation 4 (Hwang et al., 2004; Lin and Hung, 2008). Nonetheless,
Figure 5.3 shows that the ethanol is not correlated with acetate. Therefore, most of the H2
yields can be attributed to the butyrate-acetate pathway, which showed a good correlation
and is explained in Dim 1. The variable Dim 3 is mostly explained by lactate
concentrations (Figure 5.3 b), which correlated oppositely with HY and is an orthogonal
and independent variable. The proximity of butyrate, ethanol and propionate suggests that
these metabolites can be expected from DF by mixed microbial consortia. This is also
supported in a study by Hwang et al. (Hwang et al., 2004) who obtained butyrate, ethanol
and propionate as the major metabolites during the DF at a pH range of 4-4.5, 4.5-5.0,
5.0-6, respectively.
Figure 5.3 - Correlation circle of five metabolites and HY formed by the first three principle
components Dim1, Dim 2 and Dim 3 representing 35.00, 18.03 and 16.54 % of the total
variance, respectively. Projections according to the first two (Dim 1 and Dim 2) (a) and first and
third factors (Dim 1 and Dim 3) (b)
Photofermentative H2 production from the liquid fraction of DF
The DFE from the semi-continuous DF reactor obtained during experimental period VI
was further converted to H2 by R. sphaeroides AV1b in a PF process. Cumulative H2
production and VFA consumption trends during the PF experiments are shown in Figure
5.4 (a) and (b), respectively. VFA and ammonium concentrations in the DFE medium
(shown in Table 5.1) were both non-inhibiting levels for photofermentative H2
production. Han et al. (Han et al., 2012) reported that concentrations equal to 9.8 mM,
10.9 mM and 4.2 mM, respectively, for acetate, butyrate and propionate gave the
-1.0 -0.5 0.0 0.5 1.0
-1.0
-0.5
0.0
0.5
1.0
Variables factor map (PCA)
Dim 1 (35.00%)
Dim
2 (1
8.03
%)
Lactic
Ethanol
Acetic
Propionic
Butyric.HY
-1.0 -0.5 0.0 0.5 1.0
-1.0
-0.5
0.0
0.5
1.0
Variables factor map (PCA)
Dim 1 (35.00%)
Dim
3 (1
6.54
%)
Lactic
Ethanol
Acetic
PropionicButyric.
HY
(a) (b)
204
optimum H2 yield using R. sphaeroides. However, concentrations up to 30 mM of acetate
have been reported by Hustede et al. (Hustede et al., 1993). Similarly, the ammonium
concentration was at non-inhibitory levels, as only a concentration higher than 2 - 5 mM
of NH4+-N has been reported to inhibit the photofermentative H2 production (Argun et
al., 2008; Lee et al., 2011).
Figure 5.4 - Cumulative hydrogen production (a) and depletion of major VFAs (acetate,
propionate and butyrate) (b) in a PF tests using DFE and R. sphaeroides AV1b.
205
The PF of spent DFE yielded a cumulative production of 365.6 ± 3.2 NmL H2,
corresponding to a volumetric yield of 914 ± 8 N L H2/m3 and a substrate yield of 427 ±
6 N L H2/kg COD consumed. The batch experiments were carried out for 40 days until
the H2 production completely ceased (Figure 5.4 a). This is longer than any H2 production
time reported elsewhere (Rai et al., 2014; Xia et al., 2013b). The long lag phase (9 days)
can partly explain this result. The final effluents were analyzed for COD, VFAs and
biomass concentration which showed a COD reduction of 60.1%, while more than 98 ±
1% of VFAs were removed to reach a final biomass concentration of 1.6 g TSS/L.
Theoretical COD removal calculated from the VFA concentration in final effluents
showed a COD removal efficiency of 99.2%. However, the production of biomass and
other bacterial carotenoids increased the final total COD of the PF effluent and thus
reduced the total COD removal efficiency. This was evident by the reddish brown color
of the effluent. The maximum percentage of H2 in the biogas was 89% with 8.9% of CO2.
The volumetric H2 production obtained in this study (914 ± 8 N L H2/m3) is higher than
the study of Rai et al. (2014) using Rhodopseudomonas BHU 01 with a volumetric H2
yield of 755 L H2/ m3. In another study by Uyar et al. (2009) using Rhodobacter
capsulatus (DSM 155) as biomass and DFE of Miscanthus hydrolysate as substrates, a
volumetric yield of 1000 L H2/ m3 was obtained, which is slightly higher than in this
study. The present study showed the potential of an integrated DF-PF system to achieve
higher H2 yields. Thus, the combined DF-PF processes can help in the industrial
development of DF processes using FW. The residues generated from the downstream of
these processes can, nevertheless, still be treated with anaerobic digestion in order to
provide additional conversion of organic matter to further recover energy.
AD of DF-PF waste stream
The solid residues generated by the coupled DF-PF process can be ideal for AD as the
undigested FW residues from the DF process and the PF effluent containing biomass
generated from the PF can be converted to methane in a biorefinery model (Figure 5.1).
The result of the average cumulative methane production trends during the biomethane
potential test using the waste stream generated from the DF-PF process is presented in
Figure 5.5. The cumulative CH4 production stabilized after 50 days and the average
cumulative CH4 production was 871 ± 16 mL, corresponding to a total average yield of
324 ± 6 N L CH4/kg VS added (feed) and 0.9 kg COD/kg VS removed (calculated from
206
CH4 produced), evaluated after subtracting the endogenous methane produced in the
controls. The initial and final average pH in the BMP tests was 7.0 and 7.7, respectively,
while the pH of the DF and PF residues were respectively, 4.33 and 7.26. The pH was not
adjusted with a buffering agent because the alkalinity of the inoculum was sufficient to
maintain the pH, this further adds the to practicability of the AD as a post-treatment
option.
Figure 5.5 - Methane yields from mesophilic AD of waste stream generated in the coupled DF-
PF processes
Energy yields from gas biofuels produced from food waste
When considering the conversion of the initial VS added at the beginning of the DF
process, the overall average H2 yield from coupling of the DF-PF process was increased
from 105.1 N L H2/kg VSinitial to 184.3 N L H2/kg VSinitial, with an additional 79.2 N L
H2/kg VSinitial from PF and 99.3 N L CH4/kg VSinitial from AD. The increase in energy
yields obtained in his study was compared with energy yields from the coupled process
previously reported in the literature (Table 5.5). The energy yields of hydrogen and
methane from the stand alone DF as well as the two stage DF-PF and DF-AD was
calculated based on the heating values of H2 (242 kJ/mol) and methane (801 kJ/mol).
These calculated energy yields represent the energy gain from the conversion of
substrates by biological processes. However, the net energy gain can be estimated by
considering the energy input in the processes, which is not representative in lab scale
reactors and thus not calculated in this study.
207
Table 5.5 - Comparison of energy yields from gaseous biofuels produced out of FW as feedstock using stand alone or coupling of different technologies
a The energy yield was calculated from the yield of biogas based on the heating values of hydrogen (242
kJ/mol and methane (801kJ/mol); b L H2/kg food waste; c Algal biomass pre-treatment by microwave
heating with dilute H2SO4; dAlgal biomass pre-treatment by steam heating with dilute H2SO4
By coupling DF with PF and AD processes, an additional 4.4 MJ/kg VS of energy yield
can be achieved from food waste, which is higher than the coupled DF - AD process or
stand alone DF processes (Table 5.5). Out of the overall energy recovered from the three-
stage conversion (DF-PF-AD) of food waste, H2 contributes only 35.8% out of 5.55
MJ/kg VS. However, this may be a positive add-on to the overall economic return
compared to CH4 productivity only. Therefore, the three-step process can definitely
increase the recovered energy yield. Moreover, it is a very good solution for waste
treatment as a higher FW conversion was accomplished. Table 5.5 shows that the energy
yield of DF and PF from the study of Zong et al. (2009) is higher than the energy yield
reported in this study. This is likely because of the difference in H2 yield achieved in these
studies. In other studies by Xia et al. (2013a, 2013b) and Wang et al. (2015), although the
overall energy yields obtained from the respective three and two step conversion were
high, the pre-treatment of the substrate required an energy input. Therefore, the overall
Feedstock Process/ type
H2 yield from DF / DF+PF (N L H2/kg VS)
a Energy yield from H2 (MJ/kg VS)
CH4 yield from AD (L CH4/kg VS)
aTotal energy yield (MJ/kg VS)
Reference
FW+paper Semi-continuous DF
360 3.89 - 3.89 (Shin et al., 2004)
FW DF+PF (batch) 671b 7.25 - 7.25 (Zong et
al., 2009)
Vinegar residue treated by HCl
DF+AD (batch) 53.2 0.57 192 7.4
(Z. Wang et al., 2015)
FW DF+AD (batch) 55 0.60 94 3.96 (Nathao et
al., 2013)
N. oceanica c DF+PF+AD (batch) 183.9 1.98 161.3 7.74 (Xia et al.,
2013b)
C. pyrenoidosa d
DF+PF+AD (batch) 198.3 2.14 186.2 6.66 (Xia et al.,
2013a)
FW
Semi-continuous DF + PF (batch) +AD (batch)
184 1.99 99.3 5.55 This study
208
energy yields obtained from the coupling of various processes depends on the H2 and CH4
yields and production rates in individual processes, which are mainly a function of
process operational conditions such as pH, temperature, HRT and OLR as well as
carbohydrate content and nature of the feedstock. Moreover, the coupling of the PF and
AD processes in the downstream process is not only advantageous from the energy point
of view, but it also provides biological treatment of the waste stream generated by the DF
processes (COD and pathogen removal) (Ward et al., 2008).
5.1.4 Conclusion
This study has shown the long-term feasibility of continuous H2 production as well as the
possibility to further recover energy through integration of PF and AD using FW as the
substrate. In addition, the viability of H2 production at low OLRs without the culture pH
control can minimize the excessive use of chemical buffering agents for pH control. The
integration of DF with PF can increase the overall H2 yield 1.75 fold. On the other hand,
applying AD for the post treatment of waste streams generated by the coupling of the DF-
PF processes can further increase the overall energy yield by 5.55 MJ/kg VS of food
waste, adding a synergistic effect to the overall energy recovery during the conversion of
food waste.
209
5.2 H2 and biopolymer production by phototofermentation
This section presents results of the study of concomitant production of biohydrogen and
polyhydroxybutyrate (PHB) from photofermentation (PF) using spent medium produced
from thermophilic dark fermentation (DF) of food waste mainly containing volatile fatty
acids (VFAs) and alcohols as soluble metabolites. This study showed that DF-PF
coupling not only yields energy and economic benefits in terms of H2 and PHB
productions but it also provides post treatment of residues by removal of COD.
5.2.1 Introduction
Biological hydrogen (bio-H2) processes have gained much interest as they could lead to
low cost and renewable hydrogen production technologies which are environmentally
benign (Das and Veziroglu, 2008). Biological hydrogen production processes can be
categorized into light dependent processes such as biophotolysis and light independent
processes such as dark fermentation (DF) and bioelectrochemical systems or microbial
electrolysis cells (Ghimire et al., 2015a). In light dependent processes, water is broken
down into H2 and O2 gas by algae and cyanobacteria. Alternatively, cyanobacteria or
cyanophytes can also synthesize H2 from water and inorganic carbon. Moreover,
photofermentation (PF) is carried out by photosynthetic bacteria, where
photodecomposition of organic compounds into H2 occurs (Das and Veziroglu, 2008;
Hallenbeck and Ghosh, 2009).
DF systems are a promising biological route for H2 production due to its mild operational
requirements (ambient temperature and pressure), higher conversion rates to H2 and wide
range of complex low cost waste biomass that can be used as feedstock (Ghimire et al.,
2015a; Guo et al., 2010). However, dark fermentative conversion of complex organic
biomass to H2 produces by-products, mainly volatile fatty acids (VFAs), lactic acids and
alcohols as soluble metabolites and un-hydrolyzed solid residues, leaving incomplete
conversion of the organic biomass (Xia et al., 2013). Dark fermentative biohydrogen
production is strongly correlated with the initial soluble carbohydrate fraction present in
the substrates (Alibardi and Cossu, 2016; Guo et al., 2013; Monlau et al., 2012).
Nonetheless, the soluble metabolites (organic acids and alcohols) present in DF residues
can be further converted to biohydrogen through PF (Chookaew et al., 2015; Ghimire et
al., 2015b; Rai et al., 2014).
210
Under anaerobic conditions, purple non-sulfur bacteria (PNSB) carry out an anaerobic
photosynthesis using light as the energy source synthesizing bio-H2. In PNSB, this takes
place with reduced carbon sources such as organic acids by the nitrogenase enzyme in the
presence of light (Barbosa et al., 2001). Photofermentative bio-H2 production systems are
attractive owing to their higher substrate to H2 conversion potential compared to dark
fermentative systems (Han et al., 2012).
Moreover, a theoretical H2 potential of 12 moles of H2 per mole of hexose could be
realized by integrating a PF process with DF systems (Han et al., 2012). Thus, the
integration of DF-PF can provide a practical solution to H2 production along with the
enhanced conversion of organic biomass. The integrated DF-PF process has been
demonstrated by several studies (Rai et al. 2014; Tawfik et al. 2014; Yang et al. 2015).
DF has the unique capability to utilize a wide range of complex waste biomass that can
ensure the future supply of feestock, and combining the two processes (DF + PF) can
provide the further conversion of organic substrate in addition to enhanced H2 yields.
The majority of the past studies carried out on combined DF-PF processes for H2
production have used synthetic pure substrates containing major VFAs and pure
microbial cultures (Chen et al., 2010; Tao et al., 2007). However, low cost complex waste
biomass such as agricultural residues, organic fraction of municipal solid waste
(OFMSW) and industrial wastes are attractive substrates for economically sustainable
scaled up applications of dark fermentative. A number of studies have recently shown the
possibility of combined DF-PF processes using waste biomass as the substrate
(Chookaew et al., 2015; Rai et al., 2014; Zong et al., 2009). In this scenario, the use of
dark fermentation effluents (DFE) generated from DF of complex organic waste and the
application of PNSB for its capability to produce H2 from DFE is attractive.
In addition to H2 production, PNSB can synthesize poly-β-hydroxybutyrate (PHB) under
certain conditions of physiological stress, such as high Carbon/Nitrogen (C/N) ratio or
sulfur deprivation (Eroglu and Melis, 2011; Waligórska et al., 2009). Similar to H2
production, PNSB synthesizes PHB as a way to dissipate the excess reducing power
(Waligórska et al., 2009). PHB is a polyhydroxyalkanoate, an interesting biodegradable
polymer having applications in bioplastics production and medicine (Kemavongse et al.,
2008). The amount of PHB accumulation depends on the PNSB strains and the process
211
operational conditions (De Philippis et al., 1992; Montiel-Corona et al., 2015). In R.
sphaeroides, Waligórska et al. (2009) found that accumulation of PHB increased 30 fold
when the C/N ratio rose from 6 to 120. Although PHB biosynthesis is a H2 competing
pathway, its concomitant production with hydrogen raises future interests, as PHB
possesses economic value as a precursor for biodegradable polymers (Koku et al., 2002).
Use of a mixed culture of PNSB is important for practical applications, as it reduces the
asepsis costs involved when waste residues from DF systems are utilized. PF by pure
cultures using spent DF residues generated from complex waste biomass has been
reported in a few studies, i.e. sugarcane bagasse (Rai et al., 2014), glycerol (Chookaew et
al., 2015) and cassava (Zong et al., 2009). However, there are limited studies that have
been conducted using mixed PNS cultures for DFE conversion to H2 (Montiel-Corona et
al., 2015; Tawfik et al., 2014). In a recent study, Ghimire et al. (2015b) reported the 1.75
fold increase in H2 yield from the integration of DF and PF processes using adapted R.
sphaeroides cultures as inoculum. However, a long lag phase for H2 production was
observed, which was attributed to the initial PHB accumulation (Ghimire et al., 2015b).
The aim of this study was to investigate the concomitant production of H2 and PHB from
DFE (with and without dilution) obtained from the thermophilic DF of food waste, using
adapted pure and mixed PNSB cultures under sterile and non-sterile conditions,
respectively. H2 production, PHB quantification and COD removal efficiency were the
major parameters taken into consideration during this study of DFE valorization. Other
hydrogen production performance parameters such as lag phase and time required to
achieve 95% of the maximum H2 production were considered for the evaluation of the
photofermentative H2 production performance.
5.2.2 Materials and methods
Dark fermentative H2 production
A thermophilic DF process, described elsewhere by Ghimire et al. (2015b), was set-up
for continuous hydrogen production from food waste. A semi-continuous stirred 2.0 L
serum bottle with a 1.5 L working volume and 500 mL headspace was used as DF reactor.
The culture pH was 4.5 (± 0.2). The H2 yields and production rates were 104 (± 17 NmL)
H2/g VS and 208 (±35) NmL H2/L/d at organic loading rates (OLRs) of 2 gVS/L/d and
hydraulic retention time (HRT) of 4 days (described in section 4.1).
212
Photo fermentative H2 production
PF inoculum R. sphaeroides AV1b (kindly provided by professor Roberto De Philipis, University of
Florence, Italy), isolated from the Averno Lake (Naples, Italy by Bianchi et al. 2010),
was used as inoculum for PF tests RS-I and RS-D. R. sphaeroides AV1b was first grown
in RPN medium as described by Bianchi et al. (2010) containing (g/L): DL-malic acid, 2;
time, and lactic acid and ethanol as the major metabolites were observed in all the tested
pH2 with FW.
These results are in contrast with the study of Cazier et al. (2015), which reported an
inhibition of H2 on the hydrolysis of WS during SS-AD. In this work, such an inhibition
started at pH2 > 742 mbars and substrate degradation decreased from 90 ± 10 to 20 ± 10 g
COD/kg TS in the controls and at pH2 1555 mbars, respectively, followed by the decrease
in production of methane and acidogenic metabolic products.
Figure 5.11 - Substrate degradation using FW (in g COD per kg of initial TS) (a); Substrate
degradation using FW (in g COD per kg of initial TS) (b); at the end of two fermentation times
(14 ≥14 d, 21 ≥ 21 d) and different pH2 of of A = 532 ± 33 mbar, B = 1,086 ± 29 mbar and
C = 0 mbar at 25 % TS content
0
20
40
60
80
100
120
C - 14 C - 21 A - 14 A - 21 B - 14 B - 21
Subs
trat
e D
egra
datio
n
(g C
OD
/kg
TS)
3.50
4.00
4.50
5.00
0
200
400
600
800
1000
1200
1400
1600
C - 14 C - 21 A - 14 A - 21 B - 14 B - 21
mm
ol/k
g TS
Acetate Other Metabolites Lactate Ethanol pH
(a)
(b)
232
The effect of pH2 on substrate conversion was not clearly evident during SSDF of readily
degradable substrate like FW. The culture pH decreased sharply regardless of adjusting
the initial pH with a buffering agent (i.e. MES). Therefore, further tests were carried out
with WS, a representative of substrate with low biodegradability, under the similar
experimental conditions with an objective to confirm the results obtained with FW.
Nonetheless, the pH did not significantly decrease at the end of the experimental period.
However, the effect of pH2 was not evident, as seen from Figure 5.12 a and b, which was
further verified with ANOVA (P-values >0.05). Obviously, the H2 production was
inhibited in the tests with higher pH2 (tests A and B). Similarly, lactic acid or ethanol was
not present in the metabolic products as in the tests with FW. Interestingly, the substrate
degradation of WS during the control tests, i.e. 22.4 ± 2 g COD/kg TS (at pH 5.4), is
similar in the study of Cazier et al. (2015), i.e. 20 ± 10 g COD/kg TS, when the maximum
inhibition of hydrolysis occurred at pH2 1555 mbars at pH 8-9.
0
5
10
15
20
25
30
35
40
C - 14 C - 21 A - 14 A - 21 B - 14 B - 21
Subs
trat
e D
egra
datio
n (g
CO
D/k
g TS
)
(a)
233
Figure 5.12 - Substrate degradation in WS (in g COD per kg of initial TS) (a); Substrate
degradation using WS (in g COD per kg of initial TS) (b); at the end of two fermentation times
(14 ≥14 d, 21 ≥ 21 d) and different pH2 of A = 552 ± 31 mbar, B= 1,087 ± 30 mbar and C = 0
mbar at 25% TS
5.3.4 Discussion
The results of the SSDF tests carried with FW at different TS content have shown that the
H2 production is impacted by the increase in TS contents, which was in accordance with
the earlier studies (Motte et al., 2014; Valdez-Vazquez & Poggi-Varaldo, 2009). In
particular, the results from the study of the effect of TS content (Figure 5.9 a and b) further
suggest that the limiting effect of TS content starts between 15 and 20% as in agreement
with Motte et al. (2014), that reported a metabolic shift at 19% TS with WS as substrate.
The metabolites in all the tested % TS were analysed for the possible biochemical
pathways.
Theoretically, presence of acetate and butyrate in metabolic by-products are generally
correlated with hydrogen production pathways (Ghimire et al., 2015; Guo et al., 2013);
however, in this study, the H2 production was only correlated with butyrate production as
shown by the PCA correlation plot in Figure 5.10 (a). Similarly, Figure 5.10 (b) showed
that the H2 production followed substrate degradation, while lactate production is not well
4.5
5.0
5.5
0
50
100
150
200
250
300
350
400
C - 14 C - 21 A - 14 A - 21 B - 14 B - 21
pH
Ferm
enta
tive
met
abol
ites (
mm
ol/k
g TS
)
Acetate Propionate Isobutyrate Butyrate Caproate Other metabolites H₂ pH
(b)
234
correlated with conversion of substrate. Two possible explanations for lactate production
at higher TS content are the following: i) lactic acid bacteria (LAB) are more adaptable
to harsh environmental conditions which enable them to inhabit in moisture limited
conditions at higher TS content (Sikora et al., 2013); ii) a decrease in pH related to the
higher substrate concentration and production of VFA can affect the microbial
community structure. However, pka of lactic acid is 3.86 in comparison to 4.75 and 4.78
for acetate and butyrate. Therefore, the decrease in pH is most likely due to the production
of lactic acid. This shift to LAB at higher TS contents has been also shown in a study by
Motte et al. (2014), regardless of the pH which was maintained constant at 5.50. This
further strengthens the fact that the moisture lacking conditions create harsh
environmental conditions, which trigger the growth of LAB. In addition, from the
decrease in pH in this study, it can be concluded that the alkalinity requirements at high
solids systems are higher than in the wet conditions.
Furthermore, Abbassi-Guendouz et al. (2012) showed significant inhibition of methane
yields at 30% TS due to accumulation of intermediates such as organic acids and
dissolved hydrogen. Thus, pH2 might impact the substrate conversion in SSDF, with the
accumulation of H2 in the medium, as reported in a recent study by Cazier et al. (2015) in
SS-AD. However, it has been confirmed from this study that the accumulation of H2 does
not impact on the hydrolysis of substrate under SSDF (Figure 5.11 and 5.12), in contrast
to the results obtained by Cazier et al. (2015) under SS-AD. This could be due to the fact
that the substrate degradation is already under limitation under DF conditions, which is
supported by the relationship established between H2 production (or substrate conversion)
and soluble carbohydrates present in the substrates, as reported by Guo et al. (2013) and
Monlau et al. (2012). In addition, the hydrolysis of substrate seems to be also a function
of culture pH as shown by Veeken et al. (2000).
Moreover, this difference in results can be also attributed to lower operational pH in the
present study (pH 3.7 - 5.5) compared to SS-AD (pH 8 - 9) as reported by Cazier et al.
(2015). The pH might also affect the conversion of substrates and metabolic products.
Veeken et al. (2000) reported the decrease in hydrolysis of complex substrates with the
decrease in culture pH. The hydrolase enzyme of hydrolyzing bacteria functions at an
optimal neutral pH (Parawira et al., 2005). Lin et al. (2006) reported that xylose removal
decreased from 85% to 37% when the culture pH decreased from 8 to 5. Similarly, Fang
235
and Liu (2002) also reported the decrease in glucose degradation by 10% when pH
decreased from 5.5 to 4.
Table 5.10 - Production of VFA from different types of fermentation
Feedstock Inoculum Operating conditions VFA Production Reference
Food waste Anaerobic digested sludge
Controlled pH 6.0, 35 °C
799 g COD/kg VSadded
(Wang et al., 2015)
Food waste Anaerobic activated sludge
Controlled pH 6.0, 30 °C
918 g COD/kg VSremoval
(Wang et al., 2014)
Kitchen waste
Waste activated sludge
Controlled pH 8.0, 37 °C
692.4 g COD/kg VSadded
(Chen et al., 2013)
Wheat straw Anaerobic digestate
Initial pH >8.0, Final pH 5.2, 37 °C, 23 TS content, 64 days SRT (batch)
140 ± 6 g COD/kg TSadded
(Motte et al., 2015)
Waste activated sludge
No inoculum addition
Controlled pH 8, 55 °C, 9 days SRT (batch)
368 g COD/kg VSadded
(Zhang et al., 2009)
Food waste Waste activated sludge
Initial pH 5.5, Final pH 5.1, 37 °C, 10 % TS, 14 days SRT (batch)
134.4 ± 22g COD/kg TSadded
This study
Wheat straw Waste activated sludge
Initial pH 5.5, 37 °C, 25 % TS, 14 days SRT (batch)
22.3 ± 2 g COD/kg TSadded
This study
VFAs yields obtained in this work are compared with the anaerobic fermentation studies
reported in the literature (Table 5.10). All the SSDF tests carried out in this study shown
lower VFAs yields (Table 5.10), which can be explained by the difference in operating
conditions during the fermentative studies. The production of VFAs under fermentative
conversion process is significantly affected by operating parameters such as culture pH,
temperature and substrate concentration (Cho et al., 2015; Wang et al., 2014, 2015). Most
of the studies reported in Table 5.10 are carried out at pH 6.0 and higher under controlled
pH conditions. This could explain the higher conversion of the waste biomass into
fermentative products reported in these studies, compared to the results of this study
236
where the hydrolysis was inhibited due to low pH conditions (3.7-5.1). Likewise, under
dry dark fermentative process, the conversion of substrate was dependent on culture pH
and TS content. However, the effect of pH2 was not clearly evident on substrate
hydrolysis. This might be due to the fact that substrate conversion in the tests with applied
pH2 was already under inhibited conditions due to high TS content (25% TS). In addition
the culture pH was in the range of 5 – 5.5 with WS and (3.7 – 5.3) with FW. In addition,
the accumulation of lactic acids during these limiting conditions suggests that LAB are
dominant in harsh and nutrient rich environment such as FW at higher % TS and not in
WS (Sikora et al., 2013). Likewise, the lactic acid fermentation pathways is not
favourable for conversion of substrates.
5.3.5 Conclusion and future perspectives
This study highlights the effect of limiting parameters on substrate conversion during
SSDF. Initial TS content has shown significant effect on the substrate degradation and
metabolic by-products. The biohydrogen production ceased at TS content higher than
15%, therefore the TS content in the SSDF has to be maintained lower than 15 %, if the
process is aimed at biohydrogen production. The investigation of the pH2 effect on
hydrolysis of FW and WS showed that accumulation of H2 as gaseous product does not
have inhibitory effect on hydrolysis of organic substrates in SSDF. However, in general,
the hydrolysis of substrate seemed to be limited under DF conditions due to low pH
conditions.
237
REFERENCES
Abbassi-Guendouz, A., Brockmann, D., Trably, E., Dumas, C., Delgenès, J.-P., Steyer, J.-P., & Escudié, R. (2012). Total solids content drives high solid anaerobic digestion via mass transfer limitation. Bioresource technology, 111, 55–61. Elsevier Ltd.
Alibardi, L., & Cossu, R. (2016). Effects of carbohydrate, protein and lipid content of organic waste on hydrogen production and fermentation products. Waste Management, 47(Part A), 69–77.
American Public Health Association (APHA). (2005). Standard Methods for the Examination of Water and Wastewater (21st ed.). Washington DC: American Public Health Association Water Works Association, American Water Environment Federation.
Argun, H., Kargi, F., & Kapdan, I. (2008). Light fermentation of dark fermentation effluent for bio-hydrogen production by different Rhodobacter species at different initial volatile fatty acid (VFA) concentrations. International Journal of Hydrogen Energy, 33(24), 7405–7412.
Aslanzadeh, S., Rajendran, K., & Taherzadeh, M. J. (2014). A comparative study between single- and two-stage anaerobic digestion processes: Effects of organic loading rate and hydraulic retention time. International Biodeterioration & Biodegradation, 95, 1–8.
Azwar, M. Y., Hussain, M. a., & Abdul-Wahab, A. K. (2014). Development of biohydrogen production by photobiological, fermentation and electrochemical processes: A review. Renewable and Sustainable Energy Reviews, 31, 158–173.
Barbosa, M. J., Rocha, J. M., Tramper, J., & Wijffels, R. H. (2001). Acetate as a carbon source for hydrogen production by photosynthetic bacteria. Journal of biotechnology, 85(1), 25–33.
Bianchi, L., Mannelli, F., Viti, C., Adessi, A., & De Philippis, R. (2010). Hydrogen-producing purple non-sulfur bacteria isolated from the trophic lake Averno (Naples, Italy). International Journal of Hydrogen Energy, 35(22), 12216–12223.
Bligh, E. G., & Dyer, W. J. (1959). A rapid method of total lipid extraction and purification. Canadian Journal of Biochemistry and Physiology, 37(8), 911–917.
Cavinato, C., Giuliano, A., Bolzonella, D., Pavan, P., & Cecchi, F. (2012). Bio-hythane production from food waste by dark fermentation coupled with anaerobic digestion process: A long-term pilot scale experience. International Journal of Hydrogen Energy, 37(15), 11549–11555.
Cazier, E. A., Trably, E., Steyer, J. P., & Escudie, R. (2015). Biomass hydrolysis inhibition at high hydrogen partial pressure in solid-state anaerobic digestion. Bioresource Technology, 190, 106–113.
Chen, C., Yeh, K., Lo, Y., Wang, H., & Chang, J. (2010). Engineering strategies for the enhanced photo-H2 production using effluents of dark fermentation processes as substrate. International Journal of Hydrogen Energy, 35(24), 13356–13364.
Chong, M., Sabaratnam, V., Shirai, Y., Ali, M., & Hassan, M. A. (2009). Biohydrogen production from biomass and industrial wastes by dark fermentation. International Journal of Hydrogen Energy, 34(8), 3277–3287.
238
Chookaew, T., O-thong, S., & Prasertsan, P. (2015). Biohydrogen production from crude glycerol by two stage of dark and photo fermentation. International Journal of Hydrogen Energy, 40(24), 2–7.
Chookaew, T., Prasertsan, P., & Ren, Z. J. (2014). Two-stage conversion of crude glycerol to energy using dark fermentation linked with microbial fuel cell or microbial electrolysis cell. New biotechnology, 31(2), 179–84.
Das, D., & Veziroglu, T. (2008). Advances in biological hydrogen production processes. International Journal of Hydrogen Energy, 33(21), 6046–6057.
De Philippis, R., Ena, A., Guastini, M., Sili, C., & Vincenzini, M. (1992). Factors affecting poly-β-hydroxybutyrate accumulation in cyanobacteria and in purple non-sulfur bacteria.pdf. FEMS microbiological reviews, 103, 187–194.
DuBois, M., Gilles, K., Hamilton, J., Rebers, P., & Smith, F. (1956). Colorimetric method for determination of sugars and related substances. Analytical Chemistry, 28(3), 350–356.
Elbeshbishy, E., Hafez, H., & Nakhla, G. (2012). Viability of ultrasonication of food waste for hydrogen production. International Journal of Hydrogen Energy, 37(3), 2960–2964.
Elefsiniotis, P., Wareham, D. G., & Smith, M. O. (2004). Use of volatile fatty acids from an acid-phase digester for denitrification. Journal of biotechnology, 114(3), 289–97.
Elsamadony, M., & Tawfik, A. (2015). Potential of biohydrogen production from organic fraction of municipal solid waste (OFMSW) using pilot-scale dry anaerobic reactor. Bioresource Technology, 196, 9–16.
Eroglu, E., & Melis, A. (2011). Photobiological hydrogen production: Recent advances and state of the art. Bioresource technology, 102(18), 8403–13.
Esposito, G., Frunzo, L., Liotta, F., Panico, A., & Pirozzi, F. (2012). Enhanced bio-methane production from co-digestion of different organic wastes. The Open Environmental Engineering Journal, 5, 1–8.
European Commission, D. E.-D. C. (2010). Prepatory study on food waste across EU 27-Final Report. European Commision. Retrieved from <http://ec.europa.eu/environment/eussd/pdf/bio_foodwaste_report.pdf> [accessed 10.07.14]
Fang, H. H. P., & Liu, H. (2002). Effect of pH on hydrogen production from glucose by a mixed culture. Bioresource technology, 82(82), 87–93.
Fernández, J., Pérez, M., & Romero, L. I. (2008). Effect of substrate concentration on dry mesophilic anaerobic digestion of organic fraction of municipal solid waste (OFMSW). Bioresource Technology, 99(14), 6075–6080.
García-Bernet, D., Buffière, P., Latrille, E., Steyer, J.-P., & Escudié, R. (2011). Water distribution in biowastes and digestates of dry anaerobic digestion technology. Chemical Engineering Journal, 172(2-3), 924–928.
Ghimire, A., Frunzo, L., Pirozzi, F., Trably, E., Escudie, R., Lens, P. N. L., & Esposito, G. (2015). A review on dark fermentative biohydrogen production from organic biomass: Process parameters and use of by-products. Applied Energy, 144, 73–95.
239
Ghimire, A., Frunzo, L., Salzano, E., Panico, A., Lens, P. N. L., & Pirozzi, F. (2015). Biomass enrichment and Scale-up implications for dark fermentation hydrogen production with mixed cultures. Chemical Engineering Transactions, 43, 391–396.
Ghimire, A., Valentino, S., Frunzo, L., Trably, E., Escudié, R., Pirozzi, F., Lens, P. N. L., et al. (2015). Biohydrogen production from food waste by coupling semi-continuous dark-photofermentation and residue post-treatment to anaerobic digestion: A synergy for energy recovery. International Journal of Hydrogen Energy, 40(46), 16045–16055.
Van Ginkel, S., & Logan, B. E. (2005). Inhibition of biohydrogen production by undissociated acetic and butyric acids. Environmental science & technology, 39(23), 9351–6.
De Gioannis, G., Muntoni, A., Polettini, A., & Pomi, R. (2013). A review of dark fermentative hydrogen production from biodegradable municipal waste fractions. Waste management (New York, N.Y.), 33(6), 1345–61.
Guo, X. M., Trably, E., Latrille, E., Carrere, H., & Steyer, J. (2013). Predictive and explicative models of fermentative hydrogen production from solid organic waste: Role of butyrate and lactate pathways. International Journal of Hydrogen Energy, 39(14), 7476–7485.
Guo, X. M., Trably, E., Latrille, E., Carrère, H., & Steyer, J.-P. (2010). Hydrogen production from agricultural waste by dark fermentation: A review. International Journal of Hydrogen Energy, 35(19), 10660–10673.
Gustavsson Jenny, Cederbery Christel, Sonesson Ulf, Van van Otterdijk Robert, M. A. (2011). Global food losses and food waste-Extent, causes and prevention. Rome. Retrieved from <http://www.fao.org/docrep/014/mb060e/mb060e.pdf> [accessed 04.04.2014]
Hallenbeck, P. C., & Ghosh, D. (2009). Advances in fermentative biohydrogen production: the way forward? Trends in biotechnology, 27(5), 287–97.
Han, H., Liu, B., Yang, H., & Shen, J. (2012). Effect of carbon sources on the photobiological production of hydrogen using Rhodobacter sphaeroides RV. International Journal of Hydrogen Energy, 37(17), 12167–12174.
Han, SK. and Shin, H. (2004). Biohydrogen production by anaerobic fermentation of food waste. International Journal of Hydrogen Energy, 29(6), 569–577.
Hawkes, F., Hussy, I., Kyazze, G., Dinsdale, R., & Hawkes, D. (2007). Continuous dark fermentative hydrogen production by mesophilic microflora: Principles and progress. International Journal of Hydrogen Energy, 32(2), 172–184.
Hustede, E., Steinbiichel, A., & Schlegel, H. G. (1993). Relationship between the photoproduction of hydrogen and the accumulation of PHB in non-sulphur purple bacteria. Applied microbiology and biotechnology, 39, 87–93.
Hwang, M. H., Jang, N. J., Hyun, S. H., & Kim, I. S. (2004). Anaerobic bio-hydrogen production from ethanol fermentation: the role of pH. Journal of biotechnology, 111(3), 297–309. Retrieved March 28, 2014, from http://www.ncbi.nlm.nih.gov/pubmed/15246666
James, B. W., Mauchline, W. S., Dennis, P. J., Keevil, W., Wait, R., & Keevil, C. W. (1999). Poly-3-Hydroxybutyrate in Legionella pneumophila, an energy source for
240
survival in low-nutrient environments. Applied and environmental microbiology, 65(2), 822–827.
Johnson, K., Jiang, Y., Kleerebezem, R., Muyzer, G., & Van Loosdrecht, M. C. M. (2009). Enrichment of a mixed bacterial culture with a high polyhydroxyalkanoate storage capacity. Biomacromolecules, 10(4), 670–676.
Kemavongse, K., Prasertsan, P., Upaichit, A., & Methacanon, P. (2007). Effect of co-substrate on production of poly-beta-hydroxybutyrate (PHB) and copolymer PHBV from newly identified mutant Rhodobacter sphaeroides U7 cultivated under aerobic-dark condition. Songklanakarin Journal of Science and Technology, 29(4), 1101–1113.
Kemavongse, K., Prasertsan, P., Upaichit, A., & Methacanon, P. (2008). Poly-beta-hydroxyalkanoate production by halotolerant Rhodobacter sphaeroides U7. World Journal of Microbiology and Biotechnology, 24(10), 2073–2085.
Khatipov, E., Miyake, M., Miyake, J., & Asada, Y. (1998). Accumulation of poly-beta-hydroxybutyrate by Rhodobacter sphaeroides on various carbon and nitrogen substrates. FEMS Microbiology Letter, 162(1), 39–45.
Koku, H., Eroglu, I., Gunduz, U., Yucel, M., & Turker, L. (2002). Aspects of the metabolism of hydrogen production by Rhodobacter sphaeroides. International Journal of Hydrogen Energy, 27(11-12), 1315–1329.
Koku, H., Eroglu, I., Gunduz, U., Yucel, M., & Turker, L. (2003). Kinetics of biological hydrogen production by the photosynthetic bacterium Rhodobacter sphaeroides O.U. 001. International Journal of Hydrogen Energy, 28(4), 381–388.
Kotay, S. M., & Das, D. (2008). Biohydrogen as a renewable energy resource -Prospects and potentials. International Journal of Hydrogen Energy, 33, 258–263.
Lee, C.-M., Hung, G.-J., & Yang, C.-F. (2011). Hydrogen production by Rhodopseudomonas palustris WP 3-5 in a serial photobioreactor fed with hydrogen fermentation effluent. Bioresource technology, 102(18), 8350–6.
Lee, Z.-K., Li, S.-L., Kuo, P.-C., Chen, I.-C., Tien, Y.-M., Huang, Y.-J., Chuang, C.-P., et al. (2010). Thermophilic bio-energy process study on hydrogen fermentation with vegetable kitchen waste. International Journal of Hydrogen Energy, 35(24), 13458–13466.
Li, C., & Fang, H. H. P. (2007). Fermentative hydrogen production from wastewater and solid wastes by mixed Cultures. Critical Reviews in Environmental Science and Technology, 37(1), 1–39.
Lin, C., & Hung, W. (2008). Enhancement of fermentative hydrogen/ethanol production from cellulose using mixed anaerobic cultures. International Journal of Hydrogen Energy, 33(14), 3660–3667.
Lin, C.-Y., Hung, C.-H., Chen, C.-H., Chung, W.-T., & Cheng, L.-H. (2006). Effects of initial cultivation pH on fermentative hydrogen production from xylose using natural mixed cultures. Process Biochemistry, 41(6), 1383–1390.
Liu, Z., Zhang, C., Lu, Y., Wu, X., Wang, L. L., Han, B., & Xing, X.-H. (2013). States and challenges for high-value biohythane production from waste biomass by dark fermentation technology. Bioresource technology, 135, 292–303.
241
Monlau, F., Sambusiti, C., Barakat, A., Guo, X. M., Latrille, E., Trably, E., Steyer, J.-P., et al. (2012). Predictive models of biohydrogen and biomethane production based on the compositional and structural features of lignocellulosic materials. Environmental science & technology, 46(21), 12217–25.
Montiel-Corona, V., Revah, S., & Morales, M. (2015). Hydrogen production by an enriched photoheterotrophic culture using dark fermentation effluent as substrate: Effect of flushing method, bicarbonate addition, and outdoor–indoor conditions. International Journal of Hydrogen Energy, 40(30), 9096–9105.
Motte, J.-C., Sambusiti, C., Dumas, C., & Barakat, A. (2015). Combination of dry dark fermentation and mechanical pretreatment for lignocellulosic deconstruction: An innovative strategy for biofuels and volatile fatty acids recovery. Applied Energy, 147, 67–73.
Motte, J.-C., Trably, E., Escudié, R., Hamelin, J., Steyer, J.-P., Bernet, N., Delgenes, J.-P., et al. (2013). Total solids content: a key parameter of metabolic pathways in dry anaerobic digestion. Biotechnology for biofuels, 6(1), 164.
Motte, J.-C., Trably, E., Hamelin, J., Escudié, R., Bonnafous, A., Steyer, J.-P., Bernet, N., et al. (2014). Total solid content drives hydrogen production through microbial selection during thermophilic fermentation. Bioresource technology, 166, 610–5.
Nasr, M., Tawfik, A., Ookawara, S., Suzuki, M., Kumari, S., & Bux, F. (2015). Continuous biohydrogen production from starch wastewater via sequential dark-photo fermentation with emphasize on maghemite nanoparticles. Journal of Industrial and Engineering Chemistry. 21, 500-506.
Nathao, C., Sirisukpoka, U., & Pisutpaisal, N. (2013). Production of hydrogen and methane by one and two stage fermentation of food waste. International Journal of Hydrogen Energy, 38(35), 15764–15769.
Noguerol-Arias, J., Rodríguez-Abalde, A., Romero-Merino, E., & Flotats, X. (2012). Determination of chemical oxygen demand in heterogeneous solid or semisolid samples using a novel method combining solid dilutions as a preparation step followed by optimized closed reflux and colorimetric measurement. Analytical chemistry, 84(13), 5548–55.
Ntaikou, I., Antonopoulou, G., & Lyberatos, G. (2010). Biohydrogen Production from Biomass and Wastes via Dark Fermentation: A Review. Waste and Biomass Valorization, 1(1), 21–39.
Ntaikou, I., Kourmentza, C., Koutrouli, E. C., Stamatelatou, K., Zampraka, A., Kornaros, M., & Lyberatos, G. (2009). Exploitation of olive oil mill wastewater for combined biohydrogen and biopolymers production. Bioresource technology, 100(15), 3724–30.
Oehmen, A., Zeng, R. J., Yuan, Z., & Keller, J. (2005). Anaerobic metabolism of propionate by polyphosphate-accumulating organisms in enhanced biological phosphorus removal systems. Biotechnology and Bioengineering, 91(1), 43–53.
Parawira, W., Murto, M., Read, J. S., & Mattiasson, B. (2005). Profile of hydrolases and biogas production during two-stage mesophilic anaerobic digestion of solid potato waste. Process Biochemistry, 40(9), 2945–2952.
242
Pisutpaisal, N., Nathao, C., & Sirisukpoka, U. (2014). Biological hydrogen and methane production in from food waste in two-stage CSTR. Energy Procedia, 50, 719–722.
Rai, P. K., Singh, S. P., & Asthana, R. K. (2014). Biohydrogen production from sugarcane bagasse by integrating dark- and photo-fermentation. Bioresource technology, 152, 140–6.
Robledo-Narváez, P. N., Muñoz-Páez, K. M., Poggi-Varaldo, H. M., Ríos-Leal, E., Calva-Calva, G., Ortega-Clemente, L. A., Rinderknecht-Seijas, N., et al. (2013). The influence of total solids content and initial pH on batch biohydrogen production by solid substrate fermentation of agroindustrial wastes. Journal of environmental management, 128, 126–37.
Ruggeri, B., Tommasi, T., & Sassi, G. (2010). Energy balance of dark anaerobic fermentation as a tool for sustainability analysis. International Journal of Hydrogen Energy, 35(19), 10202–10211.
Shin, H.-S., & Youn, J.-H. (2005). Conversion of food waste into hydrogen by thermophilic acidogenesis. Biodegradation, 16(1), 33–44.
Shin, H.-S., Youn, J.-H., & Kim, S.-H. (2004). Hydrogen production from food waste in anaerobic mesophilic and thermophilic acidogenesis. International Journal of Hydrogen Energy, 29(13), 1355–1363.
Sikora, A., Błaszczyk, M., Jurkowski, M., & Zielenkiewicz, U. (2013). Lactic Acid Bacteria in Hydrogen-Producing Consortia: On Purpose or by Coincidence? In D. J. M. Kongo (Ed.), Lactic Acid Bacteria - R & D for Food, Health and Livestock Purposes (InTech.).
Sreela-or, C., Imai, T., Plangklang, P., & Reungsang, A. (2011). Optimization of key factors affecting hydrogen production from food waste by anaerobic mixed cultures. International Journal of Hydrogen Energy, 36(21), 14120–14133.
Su, H., Cheng, J., Zhou, J., Song, W., & Cen, K. (2010). Hydrogen production from water hyacinth through dark- and photo- fermentation. International Journal of Hydrogen Energy, 35(17), 8929–8937.
Tao, Y., Chen, Y., Wu, Y., He, Y., & Zhou, Z. (2007). High hydrogen yield from a two-step process of dark- and photo-fermentation of sucrose, International Journal of Hydrogen Energy, 32, 200–206.
Tawfik, A., El-Bery, H., Kumari, S., & Bux, F. (2014). Use of mixed culture bacteria for photofermentive hydrogen of dark fermentation effluent. Bioresource technology, 168, 119–26.
Tenca, A., Schievano, A., Perazzolo, F., Adani, F., & Oberti, R. (2011). Biohydrogen from thermophilic co-fermentation of swine manure with fruit and vegetable waste: maximizing stable production without pH control. Bioresource technology, 102(18), 8582–8.
Turon, V., Baroukh, C., Trably, E., Latrille, E., Fouilland, E., & Steyer, J.-P. (2015). Use of fermentative metabolites for heterotrophic microalgae growth: Yields and kinetics. Bioresource Technology, 175, 342–349.
Uçkun Kiran, E., Trzcinski, A. P., Ng, W. J., & Liu, Y. (2014). Bioconversion of food waste to energy: A review. Fuel, 134, 389–399.
243
Uçkun Kıran, E., Trzcinski, A. P., & Liu, Y. (2015). Platform chemical production from food wastes using a biorefinery concept. Journal of Chemical Technology & Biotechnology, 90(October), 1364–1379.
Urbaniec, K., & Bakker, R. R. (2015). Biomass residues as raw material for dark hydrogen fermentation – A review. International Journal of Hydrogen Energy, 40(9), 3648–3658.
Uyar, B., Schumacher, M., Gebicki, J., & Modigell, M. (2009). Photoproduction of hydrogen by Rhodobacter capsulatus from thermophilic fermentation effluent. Bioprocess and biosystems engineering, 32(5), 603–6.
Valdez-Vazquez, I., & Poggi-Varaldo, H. M. (2009). Alkalinity and high total solids affecting H2 production from organic solid waste by anaerobic consortia. International Journal of Hydrogen Energy, 34(9), 3639–3646.
Valdez-vazquez, I., Riosleal, E., Esparzagarcia, F., Cecchi, F., & Poggivaraldo, H. (2005). Semi-continuous solid substrate anaerobic reactors for H2 production from organic waste: Mesophilic versus thermophilic regime. International Journal of Hydrogen Energy, 30(13-14), 1383–1391.
VALORGAS. (2010). Compositional analysis of food waste from study sites in geographically distinct regions of Europe-Valorisation of food waste to biogas. Retrieved from <http://www.valorgas.soton.ac.uk/Deliverables/VALORGAS_241334_D2-1_rev[1]_130106.pdf> [accessed 12.01.2013].
Waligórska, M., Seifert, K., Górecki, K., Moritz, M., & Laniecki, M. (2009). Kinetic model of hydrogen generation by Rhodobacter sphaeroides in the presence of NH4+ ions. Journal of applied microbiology, 107(4), 1308–18.
Wang, Q., Jiang, J., Zhang, Y., & Li, K. (2015). Effect of initial total solids concentration on volatile fatty acid production from food waste during anaerobic acidification. Environmental Technology, 36(15), 1884–1891.
Wang, Z., Shao, S., Zhang, C., Lu, D., Ma, H., & Ren, X. (2015). Pretreatment of vinegar residue and anaerobic sludge for enhanced hydrogen and methane production in the two-stage anaerobic system. International Journal of Hydrogen Energy, 40(13), 4494–4501.
Ward, A. J., Hobbs, P. J., Holliman, P. J., & Jones, D. L. (2008). Optimisation of the anaerobic digestion of agricultural resources. Bioresource Technology, 99(17), 7928–7940.
Wieczorek, N., Kucuker, M. A., & Kuchta, K. (2014). Fermentative hydrogen and methane production from microalgal biomass (Chlorella vulgaris) in a two-stage combined process. Applied Energy, 132, 108–117.
Xia, A., Cheng, J., Ding, L., Lin, R., Huang, R., Zhou, J., & Cen, K. (2013). Improvement of the energy conversion efficiency of Chlorella pyrenoidosa biomass by a three-stage process comprising dark fermentation, photofermentation, and methanogenesis. Bioresource technology, 146, 436–43.
Xia, A., Cheng, J., Lin, R., Lu, H., Zhou, J., & Cen, K. (2013). Comparison in dark hydrogen fermentation followed by photo hydrogen fermentation and
244
methanogenesis between protein and carbohydrate compositions in Nannochloropsis oceanica biomass. Bioresource technology, 138, 204–13.
Xiao, L., Deng, Z., Fung, K. Y., & Ng, K. M. (2013). Biohydrogen generation from anaerobic digestion of food waste. International Journal of Hydrogen Energy, 38(32), 13907–13913.
Yang, H., Shi, B., Ma, H., & Guo, L. (2015). Enhanced hydrogen production from cornstalk by dark- and photo-fermentation with diluted alkali-cellulase two-step hydrolysis. International Journal of Hydrogen Energy, 40(36), 12193-12200.
Yiǧit, D. Ö., Gündüz, U., Türker, L., Yücel, M., Eroǧlu, N., Gu, U., Tu, L., et al. (1999). Identification of by-products in hydrogen producing bacteria; Rhodobacter sphaeroides O.U. 001 grown in the waste water of a sugar refinery. Journal of Biotechnology, 70, 125–131.
Zong, W., Yu, R., Zhang, P., Fan, M., & Zhou, Z. (2009). Efficient hydrogen gas production from cassava and food waste by a two-step process of dark fermentation and photo-fermentation. Biomass and Bioenergy, 33(10), 1458–1463.
245
CHAPTER 6
DISCUSSION AND FUTURE PERSPECTIVE
246
6.1 Introduction and objectives
Several factors such as greenhouse gas emission and pollution problems from the by-
products of combustion of the fossil fuels are driving biobased economy for the
production of bioenergy and useful chemicals (Cherubini, 2010; Menon and Rao, 2012).
In this regards, current research technologies need to be directed towards biorefinery,
based on renewable sources such as waste biomass. Specifically, creation of hydrogen
(H2) based economy could hold the potential for future supply of energy. Moreover,
production of H2 from the biological pathways that utilize the renewable resources such
as organic waste biomass can be promising and could ensure sustainable production of
H2. Among the different biological technologies, dark fermentation (DF) is one of the
potential technologies for H2 production and valuable by-products such as organic acids
and alcohols. These by-products can be either recovered or further converted to other
valuable biofuels and platform chemicals in physical, chemical and or biological systems
(Bastidas-Oyanedel et al., 2015, Bonk et al., 2015).
DF processes utilizing waste biomass in scaled-up application are limited by low H2
yields and use of process by-products (Ghimire et al., 2015). The H2 production from
complex waste biomass by dark fermentative mixed culture is strongly influenced by
physico-chemical properties of the substrate and co-substrates, types of inocula, food to
microorganism (F/M) or substrate/inoculum (S/X) ratio, substrate concentration, organic
loading rates (OLR) in continuous bioreactors, pre-treatment of substrates, culture
temperature, pH reactor configuration and hydraulic retention times (HRT) (De Gioannis
et al., 2013; Ghimire et al., 2015a; Guo et al., 2010; Ntaikou et al., 2010; Urbaniec and
Bakker, 2015; Wang and Wan, 2009). The H2 yield and production rates from DF process
can be enhanced by the optimization of these parameters (Figure 2.4). Furthermore, by-
products from DF processes, which mostly include organic acids, alcohols and un-
hydrolyzed residues can be utilized in other biological systems for their valorization by
energy recovery (Figure 2.5). The DF effluents (DFEs) could be utilized in photo
fermentation (PF) processes, which could increase the total H2 yields from the substrate
(Figure 2.14). In addition, biopolymer (polyhydroxybutyrate or PHB) can be produced
concomitantly via PF processes, while the waste stream generated from coupling of DF-
PF processes can be utilized in anaerobic digestion (AD) for further energy recovery as
methane (Figure 5.1). Likewise, Solid State Dark Fermentation (SSDF) processes which
247
benefits from higher process yields and low energy and water requirements are attractive
for biorefinery applications.
This study undertakes the aims to investigate the potential of DF of various complex
waste biomasses for enhanced H2 production. The results presented in Chapter 3 elucidate
the effects of various operating parameters in dark fermentative H2 production from a
range of different waste biomass. The investigation on long-term operational feasibility
of DF process for continuous H2 production and application of co-substrates to support
stability in H2 production are demonstrated in Chapter 4. Moreover, a biorefinery concept
is introduced in Chapters 5 by utilizing dark fermentation effluents in PF and AD for
production of energy and biopolymers (PHB) and to investigate the limitations in the
application of SSDF. The present chapter 6 summarizes and discusses the future
implications of the major research findings in the application of DF processes for
production of H2 and other valued by-products by using mixed culture and complex waste
biomass as feedstock. Moreover, the significance of integration with other biological
systems for valorization of DF by-products is discussed in a biorefinery framework.
6.2 Major findings and highlights
6.2.1 Effect of operational parameters on dark fermentative H2 yields
A number of studies have investigated the optimal operational conditions (e.g. culture
pH, temperature, substrate utilization and inoculum enrichment) for maximizing H2
production in DF(Cappai et al., 2014; De Gioannis et al., 2013; Ghimire et al., 2015a;
Luo et al., 2010; Wang and Wan, 2011; Wong et al., 2014). However, selection of optimal
operating parameters depends higly on substrate type. Therefore, investigations becomes
vital in order to establish optimal operating conditions in the dark fermentative H2
production from a particular feedstock type. Moreover, this study recommends that the
biodegrability of the feedstock strongly influences the selection and application of various
operating conditions (Chapter 3).
In a DF by mixed culture, the presence of H2 producing microbial communities is
important to achieve higher H2 yields (Wong et al., 2014). In a scaled-up DF system
utilizing waste biomass, mixed cultures are comparatively easier and less expensive to
handle compared to pure cultures, as they do not require any asepsis procedure (Hawkes
et al., 2007). This study evaluated the different H2 producing inoculum preparation
248
methods for starting-up a DF process. Three types of inoculum pre-treatment methods
that are commonly reported in literature studies, namely acid treatment, heat shock
treatment (conducted at 95 °C and 105 °C) and load-shock treatment were applied to
anaerobic digestate obtained from an anaerobic digester treating buffalo manure and
cheese whey (Chapter 3, Section 3.1). The effectiveness of the inoculum pre-treatment
methods was evaluated for H2 production performance parameters such as cumulative H2
production, H2 production rate, length of the lag phase and process intermediates
production in biohydrogen potential (BHP) tests fed with glucose (Figures 3.1 and 3.2,
Table 3.1). Moreover, further evaluations were done based on operational costs and
feasibility of the inoculum pre-treatment methods for scaled-up application of DF (Table
3.3). The results shown that load shock on anaerobic digestion can favor higher H2 yields.
This can be due to development and growth of an efficient H2 producing bacteria
community as reported by O-Thong et al. (2009). Therefore, load shock pre-treatment can
be effective to prepare start-up inoculum for up-scaled DF systems. However, it should
be taken into account that in a continuous DF reactor the selection of H2 producing
communities is a function of reactor operating conditions rather than only inoculum
preparation or pre-treatment methods (Li and Fang, 2007). Nonetheless, this load shock
method can be applied to adapt the biomethanation process for dark fermentative H2
production. This could have application for the two-stage anaerobic digestion plants for
biohythane (biohydrogen and methane) production (Figure 2.8).
Another set of BHP tests were carried to investigate the effects of initial culture pH
(Figures 3.3, 3.4 and Table 3.6), combination of food to microorganism ratio (F/M) and
initial culture pH (Table 3.7), substrate pre-treatment (Figure 3.5 and Table 3.8) and type
of inoculum source (Figure 3.6 and Table 3.9) on the dark fermentative H2 yields. Three
model organic wastes, i.e. food waste, olive mill wastewater (OMWW) and rice straw
were used as representative of readily, moderarately and slowly biodegradable substrates,
respectively. BHP tests with food waste and heat treated anaerobic digestate have shown
that a decrease of initial culture pH from 7.0 to 4.5 and 5.0 can increase the H2 yields by
4.2 fold (60.6 ± 9 mL H2/gVS) and 3.5 fold (50.7 ± 1 mL H2/gVS), respectively.
Furthermore, BHP tests carried out at pH 5.0 and 6.0 with F/M ratios 0.5, 1 and 1.5 have
shown that the lower F/M ratios (0.5-1) at the initial pH 5 favored H2 production in
comparison to pH 6.5. Moreover, raw rice straw with alkaline treatment with 4% and 8%
NaOH at 55 ⁰C for 24 hours increased the H2 yields by 26 and 57 fold, respectively.
249
Similarly, in the DF of OMWW, the H2 yield was doubled when heat-shock pre-treated
activated sludge was used as inoculum in comparison to anaerobic digestate. The
anaerobic digestate took longer time to adapt to OMWW, which could be due to phenolic
compounds present in it (Figure 3.6). This study recommends that the selection and
application of different operating parameters to maximize the H2 yields depends strongly
on the biodegradability of the substrates (Table 3.10). These results have implications in
the design of high rate DF reactors using complex waste biomass as substrate.
6.2.2 Continuous biohydrogen production
Continuous or semi-continuous processes are generally preferred for continuous H2
production as they are more viable for scaling-up. Therefore, the future development of
DF process at industrial scale relies on the successful operation of continuous processes,
that can offer the advantages of steady operation compared to batch processes which
involves regular downtime periods of maintenance (Hawkes et al., 2007). This study
established a semi-continuous thermophilic DF process for H2 production at low organic
loading rates without controlling the culture pH. The continuous DF processes are not
stable due to the decrease in culture pH as a result of the production of organic acids.
Therefore, they require sources of alkalinity to maintain the culture pH at non-inhibiting
acidogenic pH range (4.5 - 6). Most of the studies conducted on continuous and/ or semi-
continuous dark fermentative H2 production relied on addition of chemical buffering
agents such as K2HPO4, NaHCO3, Na2HPO4 (Carrillo-Reyes et al., 2012; Elsamadony
and Tawfik, 2015; Valdez-vazquez et al., 2005). The high amount of chemical buffering
agents might increase the operational cost of DF bioreactors at scaled-up production. It
further adds uncertainty in the downstream processes applied for the treatment of DF
effluent (DFE). This study has demonstrated a long-term feasibility of continuous H2
production at varying operational conditions of the DF reactor (Section 5.1, Table 5.3).
The optimal operational OLR equivalent to 2.5 g VS/L/d and HRT of 4 days have been
established in a DF of food waste. These ranges of OLR and HRT values can be applied
to the first stage of a two-stage AD process for the production of H2 and CH4, repectively
(Aslanzadeh et al., 2014).
In another study presented in section 4.2, H2 production stability was investigated in the
DF of cheesewhey with buffalo manure as co-substrates. The results showed that buffalo
manure charaterised by higher alkalinity could be used to maintain a culture pH at a range
250
4.8 - 5, during the DF process. The use of co-substrate aided in the stability of the
continuous dark fermentative H2 production (Table 4.9). This can give economic
sustainability for a DF process inscaled-up applications, as it helps to achieve stability of
H2 production in an economical way, removing the dependency on chemical-buffering
agents. Moreover, the co-fermentation can provide the biological treatment of waste that
otherwise can pose environmental threats in places like Campania Region of Italy where
cheese whey and buffalo manure are abundant by-products of agro-industrial activities
(mozzarella cheese industries) (Ghimire et al., 2015b).
6.2.3 Integration of dark fermentation in a biorefinery concept
In addition to low process H2 yields, an incomplete conversion of organic biomass adds
another bottleneck in the commercialization of dark fermentative H2 production (Gómez
et al., 2011; Ren et al., 2011). Chapters 3 and 4 have shown that the higher H2 yields and
process stability can be achieved by optimizing the different operational parameters.
However, higher substrate conversion of complex waste biomass cannot be achieved with
a sole DF system and thus demands downstream process/es (Figure 2.5) (Gómez et al.,
2011). Similarly, there have been increasing interests in incorporating DF into biorefinery
concept utilizing it as a biological pre-treatment step (Bastidas-Oyanedel et al., 2015;
Motte et al., 2015; Sambusiti et al., 2015; Venkata Subhash and Venkata Mohan, 2014).
Recently, Motte et al. (2015) have reported higher substrate conversion of lignocellulosic
biomass through integration of SSDF in a biorefinery approach. SSDF is advantageous
in terms of higher process yields, due to its operation at high substrate loading rates and
low water addition. Benefits, such as reduced reactor volume and specific energy
requirements, simplicity in operation and handling of digestate, result in economic
advantages of the SSDF process. In this context, Chapter 5 covers these aspects, which
have been addressed by few studies.
Section 5.1 (Chapter 5) investigated the influence of integrating DF, PF and AD on total
energy yields from three-step conversion of food waste (Figure 5.1 and Table 5.5). The
supernatant, after separation of DFE, was used to recover H2 from a PF process using
Rhodobacter sphaeroides that increased H2 yield from the food waste by 1.75 fold. The
solid residual fraction of DFE along with PF effluent was converted into methane by AD,
increasing the total energy yield from 1.13 to 5.55 MJ/kg VSfoodwaste added. The three-
stage conversion can achieve the higher energy yields compared to stand-alone DF or DF-
251
PF systems. In addition, the integration provided the biological treatment of residues. This
was supported in studies from Xia et al. (2013a, 2013b), who reported that a three-step
conversion of algal biomass combining DF-PF-AD can achieve 1.7 and 1.3 times higher
energy yields in comparison to a two-stage DF-AD and a one stage AD process,
respectively.
Moreover, purple non-sulfur bacteria (PNSB) can concomitantly synthesize H2 and
polyhydroxybutyrate (PHB) in PF process under certain conditions of physiological stress
such as high Carbon/Nitrogen (C/N) ratio and sulfur deprivation (Waligórska et al., 2009;
Eroglu and Melis, 2011). The capability of PNSB to utilize DFE generated from DF of
complex organic waste for conversion to H2 and PHB could be of economical interest
(Figure 5.8). The PF of DFE by enriched mixed culture of PNSB and adapted culture of
Rhodobacter sphaeroides provided several benefits, e.g. treatment of effluent by COD
reduction and recovery of H2 and PHB as added value products. Thus, integration of DF
into a biorefinery concept can provide the economic sustainability to the scaled-up DF
processes.
Furthermore, the last section of Chapter 5 dealt with the limitations of dry fermentation
processes. SSDF processes are generally operated at total solids (TS) content higher than
15% and are constrained due to mass transfers limitations (Abbassi-Guendouz et al.,
2012; Motte et al., 2013). Therefore, the TS content in SSDF could impact in conversion
of feed to the desired fermentative products. In addition, accumulation of H2 could also
limit the conversion of substrates, as revealed in a study by Cazier et al. (2015) during
Solid State Anaerobic Digestion (SS-AD). The affect of TS content and accumulation of
H2 on substrate conversion during SSDF was investigated with food waste and wheat
straw as representative model substrates for readily and slowly degradable substrates.
During the SSDF of food waste, H2 production was inhibited at a TS content higher than
15%, resulting in a lactic acid accumulation (Figure 5.9). This suggests that the TS content
plays a vital role and for the case of SSDF of food waste, TS content has to be less than
15% if the process is aimed at H2 production. Moreover, the accumulation of H2 as
gaseous products does not exhibit inhibitory effects on hydrolysis of organic biomass
during SSDF in contrast to SS-AD (Figures 5.11 and 5.12). This could be due to the
operational culture pH of these two different processes. The lower hydrolysis during DF
process can be due to the inhibition of hydrolase enzyme at acidic pH (Parawira et al.,
252
2005). However, in general, the hydrolysis of substrate seemed to be limited under DF
conditions as found in this study.
6.3 Future research prospective
The current study addressed several issues and potential in the application of DF of waste
biomass interlinked in a biorefinery concept. However, more research needs to be directed
at the pilot to full scale implementation of DF process based on real feedstock such as
organic waste biomass (Bonk et al., 2015). Moreover, integration of DF with other
physical, chemical and or biological systems can improve energy yields which could lead
to reduction of the operational costs associated with DF and create possibility for revenues
from the recovery of added value chemicals in side stream process.
Based on the local availability, novel feedstock sources, which do not compete with food
and agriculture supply chain, should be utilized in DF process. The agricultural residues
biomass sources such as micro and macro algae could serve as the future supply of
feedstock for DF based biorefinery. A major difficulty in the utilization of this feedstock
sources is poor biological hydrolysis that limits the complete conversion of biomass into
intended products, as the efficient dark fermentative conversion depends on the presence
of readily available depolymerized carbohydrates (monomeric sugars) (Guo et al., 2013;
Monlau et al., 2012). However, different physical, chemical, biological and the
combination of these pre-treatment methods can be applied to enhance biological
hydrolysis depending on the physico-chemical characteristics of biomass (Carrere et al.,
2015; Monlau et al., 2013). More studies regarding technical and economical feasibilities
of pre-treatment methods could elucidate their application to DF process.
The selection of optimum operational parameters, such as culture pH, temperature,
substrate concentration, substrate, loading rate, food to microorganism ratio and reactor
configuration during DF of waste biomass is strongly dependent on substrate type and
source of inoculum (Tables 2.1, 2.5, 2.7 - 2.9 and 3.9). Therefore, the selection of these
parameters for a particular substrate type and experimental conditions needs
investigations before full-scale implementation of the process. Moreover, additional
research is required in process control with an aim to enhance the yield and recovery of
other targeted metabolic by-products such as acetate, butyrate, propionate, ethanol, etc.
In recent years, DF was extensively reviewed and aimed for H2 production. However,
253
dark fermentative H2 production accounts only 4% of the total products conversion with
the maximum theoretical conversion, while 67% remains as by-products in liquid phase,
i.e. acetic acid in a DF of glucose (Bastidas-Oyanedel et al., 2015).
Similarly, microbial community analysis during the varying operating conditions could
further elucidate the existence of different fermentative communities responsible for
yields of varying metabolites. The identification and enrichment of fermentative
communities could be a precursor for future application of DF process in the production
of targeted biomolecules in a biorefinery concept.
The residues generated from the DF process needs down stream process/es for the
complete utilization of waste biomass. Biopolymer production in PF utilizing DFE can
be economically interesting and requires investigations in process optimization for PHB
production (Section 5.2). Moreover, investigations in the technologies for the economic
recovery of H2 (gas cleaning and purification) and associated biochemicals (VFAs and
alcohols) from DF fermentation will determine the future application and development of
the DF process (Bonk et al., 2015).
Compared to wet fermentation processes which require large reactor volume and have
consequently higher energy requirements to treat same quantity of biomass, SSDF can
offer benefits in terms of higher volumetric production rates due to higher substrate
concentration (Elsamadony and Tawfik, 2015; Romero Aguilar et al., 2013). This
research work investigated the technical limitations of SSDF (Section 5.3, Chapter 5).
However, additional research is essential in the operational control of the SSDF process
towards intended metabolites production in SSDF, as this technology could hold greater
promise in the creation of future biorefinery for the production of biohydrogen and
biomolecules.
254
REFERENCES
Abbassi-Guendouz, A., Brockmann, D., Trably, E., Dumas, C., Delgenès, J.-P., Steyer, J.-P., & Escudié, R. (2012). Total solids content drives high solid anaerobic digestion via mass transfer limitation. Bioresource Technology, 111, 55–61.
Aslanzadeh, S., Rajendran, K., & Taherzadeh, M. J. (2014). A comparative study between single- and two-stage anaerobic digestion processes: Effects of organic loading rate and hydraulic retention time. International Biodeterioration & Biodegradation, 95, 1–8.
Bastidas-Oyanedel, J.-R., Bonk, F., Thomsen, M. H., & Schmidt, J. E. (2015). Dark fermentation biorefinery in the present and future (bio)chemical industry. Reviews in Environmental Science and Bio/Technology.
Bonk, F., Bastidas-Oyanedel, J.-R., & Schmidt, J. E. (2015). Converting the organic fraction of solid waste from the city of Abu Dhabi to valuable products via dark fermentation – Economic and energy assessment. Waste Management.
Cappai, G., De Gioannis, G., Friargiu, M., Massi, E., Muntoni, a., Polettini, a., … Spiga, D. (2014). An experimental study on fermentative H2 production from food waste as affected by pH. Waste Management, 34(8), 1510–1519.
Carrere, H., Antonopoulou, G., Affes, R., Passos, F., Battimelli, A., Lyberatos, G., & Ferrer, I. (2015). Review of feedstock pretreatment strategies for improved anaerobic digestion: From lab-scale research to full-scale application. Bioresource Technology, 199, 386-397.
Carrillo-Reyes, J., Celis, L. B., Alatriste-Mondragón, F., & Razo-Flores, E. (2012). Different start-up strategies to enhance biohydrogen production from cheese whey in UASB reactors. International Journal of Hydrogen Energy, 37(7), 5591–5601.
Cazier, E. A., Trably, E., Steyer, J. P., & Escudie, R. (2015). Biomass hydrolysis inhibition at high hydrogen partial pressure in solid-state anaerobic digestion. Bioresource Technology, 190, 106–113.
Cherubini, F. (2010). The biorefinery concept: Using biomass instead of oil for producing energy and chemicals. Energy Conversion and Management, 51(7), 1412–1421.
De Gioannis, G., Muntoni, a, Polettini, a, & Pomi, R. (2013). A review of dark fermentative hydrogen production from biodegradable municipal waste fractions. Waste Management (New York, N.Y.), 33(6), 1345–61.
Elsamadony, M., & Tawfik, A. (2015). Potential of biohydrogen production from organic fraction of municipal solid waste (OFMSW) using pilot-scale dry anaerobic reactor. Bioresource Technology, 196, 9–16. http://doi.org/10.1016/j.biortech.2015.07.048
Eroglu, E., & Melis, A. (2011). Photobiological hydrogen production: Recent advances and state of the art. Bioresource Technology, 102(18), 8403–13.
Ghimire, A., Frunzo, L., Pirozzi, F., Trably, E., Escudie, R., Lens, P. N. L., & Esposito, G. (2015a). A review on dark fermentative biohydrogen production from organic biomass: Process parameters and use of by-products. Applied Energy, 144, 73–95.
Ghimire, A., Frunzo, L., Pontoni, L., Lens, P. N. L., Esposito, G., & Pirozzi, F. (2015b). Dark fermentation of complex waste biomass for biohydrogen production by
255
pretreated thermophilic anaerobic digestate. Journal of Environmental Management, 152, 43–48.
Gómez, X., Fernández, C., Fierro, J., Sánchez, M. E., Escapa, A., & Morán, A. (2011). Hydrogen production: two stage processes for waste degradation. Bioresource Technology, 102(18), 8621–7.
Guo, X. M., Trably, E., Latrille, E., Carrere, H., & Steyer, J. (2013). Predictive and explicative models of fermentative hydrogen production from solid organic waste: Role of butyrate and lactate pathways. International Journal of Hydrogen Energy, 39(14), 1–10.
Guo, X. M., Trably, E., Latrille, E., Carrère, H., & Steyer, J.-P. (2010). Hydrogen production from agricultural waste by dark fermentation: A review. International Journal of Hydrogen Energy, 35(19), 10660–10673.
Hawkes, F., Hussy, I., Kyazze, G., Dinsdale, R., & Hawkes, D. (2007). Continuous dark fermentative hydrogen production by mesophilic microflora: Principles and progress. International Journal of Hydrogen Energy, 32(2), 172–184.
Li, C., & Fang, H. H. P. (2007). Fermentative hydrogen production from wastewater and solid wastes by mixed Cultures. Critical Reviews in Environmental Science and Technology, 37(1), 1–39.
Luo, G., Xie, L., Zou, Z., Zhou, Q., & Wang, J.-Y. (2010). Fermentative hydrogen production from cassava stillage by mixed anaerobic microflora: Effects of temperature and pH. Applied Energy, 87(12), 3710–3717.
Menon, V., & Rao, M. (2012). Trends in bioconversion of lignocellulose: Biofuels, platform chemicals & biorefinery concept. Progress in Energy and Combustion Science, 38(4), 522–550.
Monlau, F., Barakat, A., Trably, E., Dumas, C., Steyer, J.-P., & Carrère, H. (2013). Lignocellulosic Materials Into Biohydrogen and Biomethane: Impact of Structural Features and Pretreatment. Critical Reviews in Environmental Science and Technology, 43(3), 260–322.
Monlau, F., Sambusiti, C., Barakat, A., Guo, X. M., Latrille, E., Trably, E., … Carrere, H. (2012). Predictive models of biohydrogen and biomethane production based on the compositional and structural features of lignocellulosic materials. Environmental Science & Technology, 46(21), 12217–25.
Motte, J.-C., Sambusiti, C., Dumas, C., & Barakat, A. (2015). Combination of dry dark fermentation and mechanical pretreatment for lignocellulosic deconstruction: An innovative strategy for biofuels and volatile fatty acids recovery. Applied Energy, 147, 67–73.
Motte, J.-C., Trably, E., Escudié, R., Hamelin, J., Steyer, J.-P., Bernet, N., Dumas, C. (2013). Total solids content: a key parameter of metabolic pathways in dry anaerobic digestion. Biotechnology for Biofuels, 6(1), 164.
Ntaikou, I., Antonopoulou, G., & Lyberatos, G. (2010). Biohydrogen Production from Biomass and Wastes via Dark Fermentation: A Review. Waste and Biomass Valorization, 1(1), 21–39.
O-Thong, S., Prasertsan, P., & Birkeland, N.-K. (2009). Evaluation of methods for preparing hydrogen-producing seed inocula under thermophilic condition by process
256
performance and microbial community analysis. Bioresource Technology, 100(2), 909–18.
Parawira, W., Murto, M., Read, J. S., & Mattiasson, B. (2005). Profile of hydrolases and biogas production during two-stage mesophilic anaerobic digestion of solid potato waste. Process Biochemistry, 40(9), 2945–2952.
Ren, N., Guo, W., Liu, B., Cao, G., & Ding, J. (2011). Biological hydrogen production by dark fermentation: challenges and prospects towards scaled-up production. Current Opinion in Biotechnology, 22(3), 365–70.
Romero Aguilar, M. A., Fdez-Güelfo, L. A., Álvarez-Gallego, C. J., & Romero García, L. I. (2013). Effect of HRT on hydrogen production and organic matter solubilization in acidogenic anaerobic digestion of OFMSW. Chemical Engineering Journal, 219, 443–449.
Sambusiti, C., Bellucci, M., Zabaniotou, A., Beneduce, L., & Monlau, F. (2015). Algae as promising feedstocks for fermentative biohydrogen production according to a biorefinery approach: A comprehensive review. Renewable and Sustainable Energy Reviews, 44, 20–36.
Urbaniec, K., & Bakker, R. R. (2015). Biomass residues as raw material for dark hydrogen fermentation – A review. International Journal of Hydrogen Energy, 40(9), 3648–3658.
Valdez-vazquez, I., Rios-Leal, E., Esparza-Garcia, F., Cecchi, F., Pavan, P., & Poggi-Varaldo, H. M. (2004). A review on hydrogen production with anaerobic mixed cultures. Chemical Engineering Transactions, 4, 123–130.
Valdez-vazquez, I., Riosleal, E., Esparzagarcia, F., Cecchi, F., & Poggivaraldo, H. (2005). Semi-continuous solid substrate anaerobic reactors for H2 production from organic waste: Mesophilic versus thermophilic regime. International Journal of Hydrogen Energy, 30(13-14), 1383–1391.
Venkata Subhash, G., & Venkata Mohan, S. (2014). Deoiled algal cake as feedstock for dark fermentative biohydrogen production: An integrated biorefinery approach. International Journal of Hydrogen Energy, 39(18), 9573–9579.
Waligórska, M., Seifert, K., Górecki, K., Moritz, M., & Laniecki, M. (2009). Kinetic model of hydrogen generation by Rhodobacter sphaeroides in the presence of NH4+ ions. Journal of Applied Microbiology, 107(4), 1308–18.
Wang, J., & Wan, W. (2009). Factors influencing fermentative hydrogen production: A review. International Journal of Hydrogen Energy, 34(1), 799–811.
Wang, J., & Wan, W. (2011). Combined effects of temperature and pH on biohydrogen production by anaerobic digested sludge. Biomass and Bioenergy, 35(9), 3896–3901.
Wong, Y. M., Wu, T. Y., & Juan, J. C. (2014). A review of sustainable hydrogen production using seed sludge via dark fermentation. Renewable and Sustainable Energy Reviews, 34, 471–482.
Xia, A., Cheng, J., Ding, L., Lin, R., Huang, R., Zhou, J., & Cen, K. (2013). Improvement of the energy conversion efficiency of Chlorella pyrenoidosa biomass by a three-stage process comprising dark fermentation, photofermentation, and methanogenesis. Bioresource Technology, 146, 436–43.
257
Xia, A., Cheng, J., Lin, R., Lu, H., Zhou, J., & Cen, K. (2013). Comparison in dark hydrogen fermentation followed by photo hydrogen fermentation and methanogenesis between protein and carbohydrate compositions in Nannochloropsis oceanica biomass. Bioresource Technology, 138, 204–13.