BearWorks BearWorks
Articles by College of Humanities and Public Affairs Faculty
2019
Dark Sky Tourism: Economic Impacts on the Colorado Plateau Dark Sky Tourism: Economic Impacts on the Colorado Plateau
Economy, USA Economy, USA
David M. Mitchell Missouri State University
Terrel A. Gallaway Missouri State University
Follow this and additional works at: https://bearworks.missouristate.edu/articles-chpa
Part of the Tourism and Travel Commons
Recommended Citation Recommended Citation Mitchell, David, and Terrel Gallaway. "Dark Sky Tourism: Economic Impacts on the Colorado Plateau Economy, USA." Tourism Review (2019)
This article or document was made available through BearWorks, the institutional repository of Missouri State University. The work contained in it may be protected by copyright and require permission of the copyright holder for reuse or redistribution. For more information, please contact [email protected].
Tourism Review
Star Light, Star Bright: The Economic Impact from Dark Sky
Tourism on the Colorado Plateau Economy
Abstract: This case study examines the economic impact from dark-sky tourism in national parks in
the United States on the Colorado Plateau. The Colorado Plateau is a region encompassing parts of
Arizona, Colorado, New Mexico, and Utah that is known for its dark, star filled night skies.
Tourists to national parks are increasingly interested in observing this natural recreational
amenity—especially considering that it is an ecological amenity that is quickly disappearing from
the planet. Employing a 10-year forecast of visitors to the national parks and using standard Input-
Output modeling, we show, for the first time anywhere, the value of dark skies to tourism in this
area. We find that non-local tourists who value dark skies will spend $5.8 billion over 10 years in
the Colorado Plateau. These tourist expenditures will generate $2.4 billion in higher wages and
create over 10,000 additional jobs each year for the region. Furthermore, since dark skies are better
in the non-summer months, they have the ability to increase national park visitation year-round,
leading to a more efficient use of local tourism-related resources throughout the year.
Keywords: Dark Skies, Ecotourism, Economic Impact Analysis, National Parks, Light Pollution,
Colorado Plateau
Page 1 of 26 Tourism Review
123456789101112131415161718192021222324252627282930313233343536373839404142434445464748495051525354555657585960
Tourism Review
2
I. Introduction
Tourism has been an important industry for local and regional economic growth and
development for many decades. Tourists bring an inflow of domestic and international monies with
purchases of lodging, food, and other goods and services. This spending helps to sustain local jobs
and incomes for people involved in meeting tourists needs (Sinclair, 1998; Page and Dowling,
2001). Academic literature has documented that tourism has played a major economic role in the
growth and development of many areas including Eastern Europe, rural South Africa, and Taiwan
(Hall, 1991; Briedenhann and Wickens, 2004; Kim, Chen, and Jang, 2006). Over the past 30 years
or so, there has been a growing movement within the tourism industry towards ecotourism.
Ecotourism provides local citizens a stake in maintaining the ecological aspects of sites (Fennell
and Eagles, 1990; Muloin, 1998; Carr and Mendelsohn, 2003; Weaver, 1999). Our case study
shows that dark-sky ecotourism is a multi-billion dollar industry on the Colorado Plateau.
In 2015 the US National Park Service recorded nearly 26 million visitors to the national
parks contained within Arizona, Colorado, New Mexico, and Utah. These 26 million visitors spent
almost $1.8 billion dollars impacting the local and state economies and creating almost 27,000 jobs.
The visitors to the national parks are interested in a variety of recreational activities including
camping, fishing, wildlife watching, hiking, and photography. A significant, and growing, number
of these visitors are also interested in star gazing and are willing to pay to be able to see dark skies
at night (Mitchell, et. al., 2017).
The national parks in this four-state region provide visitors with the opportunity to
experience nature and see wildlife and picturesque vistas. They also provide a rare scenic and
recreational resource that most tourists cannot find at home—the nocturnal world in its wild and
natural state, largely free from light pollution. Light pollution is so pervasive that over 80% of the
world’s population and 99% of the populations of Europe and the United States live under light
Page 2 of 26Tourism Review
123456789101112131415161718192021222324252627282930313233343536373839404142434445464748495051525354555657585960
Tourism Review
3
polluted skies. Nearly 80% of North Americans cannot see the Milky Way from home and
approximately 40% of the US population no longer has the ability to see the night sky with an eye
that can truly adapt to darkness—in other words, it’s as if 40% of the population never experiences
‘nighttime’ (Cinzano et. al., 2001; 2016; Gallaway, et. al. 2010). By maintaining dark skies, these
national parks are able to provide visitors with a scenic and ecological asset that is unavailable in
many parts of the country. To date, we are unaware of any literature that has sought to place a
dollar value, from a tourism standpoint, on the dark skies at these national parks. This case study
seeks to remedy this by examining visitor spending for dark skies in national parks. Section 2
discusses light pollution in general, while section 3 examines the area of study. Section 4 outlines
our methodology and section 5 discusses results of the economic impact analysis. Section 6
sketches out some ways that local communities can leverage dark skies to increase tourism while
section 7 draws some conclusions.
II. Understanding Light Pollution
Light pollution (LP) is increasingly recognized as a serious environmental problem. Light
pollution is the artificial light at night that degrades the utility, function, biota, or aesthetics of the
surrounding environment. Often this is due to the presence of poorly engineered lighting. In fact,
the light pollution within a city can create ‘sky glow’ that can be seen from over 100 miles away.
Light pollution first attracted academic scrutiny by astronomers (e.g. Bertiau, 1973). Then,
in recent decades, the problem has increasingly been studied by those in the natural and biological
sciences. The presence of light pollution is known to interfere with the normal behavior of animals,
especially nocturnal animals, and even some flora. This interference with activities such as eating,
evading predators, mating, and the like, and can have an adverse effect on the health and population
size of many different species (Bennie, 2018; Cruz et al., 2018; Davies and Smyth, 2018; Kim et al.,
2018; Underhill and Höbel, 2018; Meier, et al. 2015; Salmon and Witherington, 1995; Salmon et.
Page 3 of 26 Tourism Review
123456789101112131415161718192021222324252627282930313233343536373839404142434445464748495051525354555657585960
Tourism Review
4
al, 1995 Verheijen, 1985;). Artificial light at night is a radical alteration of the environment. It can
have devastating impacts on ecology and aesthetics. Accordingly, economists can study the costs of
economic light pollution in much the same way as they might study how the Exxon Valdez oil spill
devastated commercial fishing and tourism (Shaw, 1992; Bue, Sharr, and Seeb, 1998).
Dark nighttime skies, especially in national parks, can help maintain existing tourism and be
used as a vehicle for attracting additional tourists to an area (Cater, 2010; Fayos-Solá, Marín and
Jafari, 2014; Hänel 2016; Labuda, Kolch, and Nagyová, 2015; Labuda, Pavličková, and Števová
2016; Rodrigeus, Rodrigues and Peroff, 2015). This effect is multifaceted. By having some areas
that are free of LP, tourists have a place to observe the night sky, experience a naturally dark
environment, and observe a less trampled wilderness in the same way that some people travel to
Yellowstone National Park to see bison and geysers. Secondly, preserving dark nighttime skies
helps to protect the health and diversity of local wildlife populations which are often the primary
amenity that visitors to national parks are seeking. In short, dark skies are both a necessary and
complementary characteristic to the more well-known amenity of ‘wildlife’ that attracts visitors to
national parks. Both the damage to scenic nightscapes and any related deleterious effects on
wildlife will likely reduce a visitor’s willingness to pay to visit areas such as a national parks.
III. Understanding the Colorado Plateau
This case study examines the economic impact from dark sky tourism in the area known as
the ‘Colorado Plateau Dark Sky Cooperative’ (Colorado Plateau) which covers approximately
130,000 square miles over the aforementioned states in the Southwestern United States and is
shown in Figure 1. The Colorado Plateau is home to many national parks as well as America’s first
Dark Sky Cooperative. Table 1 lists the different national parks on the Colorado Plateau as well as
their size in square miles. In addition to the national parks, there are public lands administered by
the state parks, the National Forest Service (USFS), and the Bureau of Land Management (BLM).
Page 4 of 26Tourism Review
123456789101112131415161718192021222324252627282930313233343536373839404142434445464748495051525354555657585960
Tourism Review
5
The size of these public lands can be extensive. For example, more than 70% of the state of Utah is
under public control, while Colorado, Arizona, and New Mexico are between 30 to 34% public
lands. Protecting these public lands has helped safeguard dark skies on the Colorado Plateau. One
would expect that explicit consideration about the value of dark skies would facilitate caring for
public lands and their contribution to the landscapes, wildlife, and natural experiences sought out by
tourists.
<<Figure 1 here>>
<<Table 1 here>>
Because of the low population density, abundance of public lands, and a generally arid
climate and high elevations, the Colorado Plateau has long enjoyed a reputation for excellent night
skies with spectacular views of the stars. This combination of natural and demographic conditions
creates a scarce ecotourism asset with important cultural, aesthetic, historical, and recreational
dimensions (Gallaway, 2010). Such high-quality views of the night sky are increasingly rare in
modern, urbanized, society. For many, a dark night sky is, in its own way, as exotic of a sight as a
herd of bison or a crystal-clear glacial lake.
International recognition of the importance of night skies on the Colorado Plateau has, in recent
years, become more explicit and formalized (see Figure 2). On March 6th, 2007, Natural Bridges
National Monument became the first International Dark Sky Park certified by the International
Dark-Sky Association. Since then, many national parks and state parks on the Colorado Plateau
have received similar recognition. This recognition is given in acknowledgement of extraordinary
dark sky conservation efforts. The Colorado Plateau is unique in both the number of these Dark Sky
Parks and by their superior quality; many of these parks are gold-tier certified, signifying that they
have the best and rarest night skies.
Page 5 of 26 Tourism Review
123456789101112131415161718192021222324252627282930313233343536373839404142434445464748495051525354555657585960
Tourism Review
6
<<Figure 2 here>>
The concentration of these International Dark Sky Parks on the Colorado Plateau points to the
global importance of maintaining darks skies in this region. It is an immense area with skies dark
enough and clear enough to make it the envy of the world. Much of the landscape is protected and
even though the area is vast and remote, it is highly accessible and already a destination for millions
of tourists each year. Consequently, the Colorado Plateau has a very unique and substantial
potential for night sky tourism. Importantly, dark skies give tourists a reason to extend visits to
include one or more overnight stays.
IV. Economic Impact Analysis Methodology
We will examine the economic impact of non-local tourists to the national parks in the
Colorado Plateau who stay inside the park and consider the ability to see and enjoy night skies to be
an important park amenity. We analyze the impact such tourists have on the state level economies
of New Mexico, Utah, Colorado, and Arizona. We estimate economic impacts of existing dark-sky
oriented visitors to National Parks in the area. However, it is important to recognize that the
potential for night sky tourism and its economic impact is larger. For example, we have not counted
non-local visitors who value dark skies but stayed outside of the park. Furthermore, there are good
reasons to believe that there is significant growth potential for this type of ecotourism. However, the
pace of this growth and the eventual magnitude of night-sky tourism depend on the willingness of
stakeholders to promote night-sky tourism and leverage the region’s unparalleled assets. This
economic impact analysis measures existing trends, where comparatively little is done to promote
night-sky tourism.
Page 6 of 26Tourism Review
123456789101112131415161718192021222324252627282930313233343536373839404142434445464748495051525354555657585960
Tourism Review
7
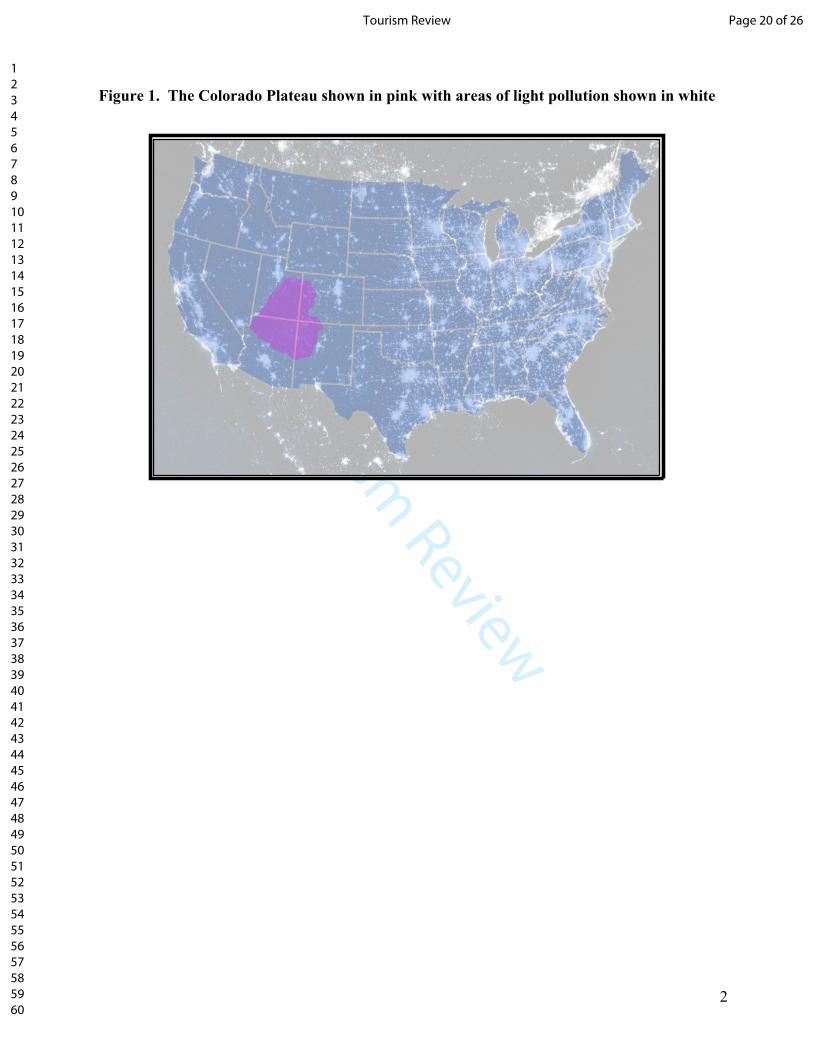
Our focus in this study is 27 parks in the Colorado Plateau administered by the National
Park Service (NPS). Many of the parks are quite large, with four of them each exceeding 1,500
square miles in area. Together, these parks cover a vast area.
We used the Park Service’s own data about visitation numbers and tourists’ lodging choices.
Economic impacts from visitor spending were analyzed using Input-Output Analysis (IO).1 IO is
commonly used in economic research and has a long history in tourism studies (Briassoulis, 1991;
Los and Steenge, 2010; Kim and Kim, 2015; Tohmo, 2018; Kronenberg, Fuchs, Lexhagen, 2018;
Cline and Seidl, 2010). More specifically, we used detailed models, developed by IMPLAN2, of the
US and state level economy to analyze the economic impact of spending by overnight tourists at
parks on the Colorado Plateau.
Input-Output analysis recognizes that the impact of tourist spending gets multiplied as one
person’s spending creates income and more spending by others. Tourism spending creates income
for hoteliers that is used to buy supplies and hire workers to meet the needs of customers; but
hoteliers also have their own personal consumption spending that is entirely unrelated to the tourism
industry.
The production of all goods and services requires multiple forward and backward linkages.
For example, restaurants must purchase supplies of food from a wholesaler. The restaurant
combines the input eggs with other labor and capital inputs, cooks and stoves, to provide an output,
breakfast for customers. Raw eggs are an input for restaurants but an output for wholesalers. Input-
Output analysis traces and aggregates the inter-industry linkages that exist between different goods
1 The literature on using IO analysis, especially in economic impact studies, is vast and extensive such that the nomenclature and measurement of the different effects (direct, indirect, and induced) is well understood. This paper is not a review of that methodology. However, for the reader who is interested, they can examine: McCann (2013), Armstrong and Taylor (2000), Isard, et. al. (1998). 2 IMPLAN is an industry-leading software package that is used in Input-Output analysis to determine the size and nature of economic linkages using a classification system of 509 different sub-sectors of the economy.
Page 7 of 26 Tourism Review
123456789101112131415161718192021222324252627282930313233343536373839404142434445464748495051525354555657585960
Tourism Review
8
and services. Some industries are closely related with big impacts on each other, while others have
relatively few interconnections. Modeling all of these complex interconnections allows one to
better understand the total impact on jobs and incomes within the region from an activity such as
tourism to an area.3 For example, Cline and Seidl (2010) showed that the economic impact from
tourism related to open spaces and water quality levels were larger than the economic costs of local
tax levies necessary to maintain open spaces. Thus, they argued that local tax levies that help to
maintain open spaces should be implemented.
We offer similar analysis in that we are seeking to quantify the economic impact from
tourism related to an environmental amenity that appeals to tourists—dark skies. To forecast the
economic impact of dark skies for the next 10 years we first examine National Park Service
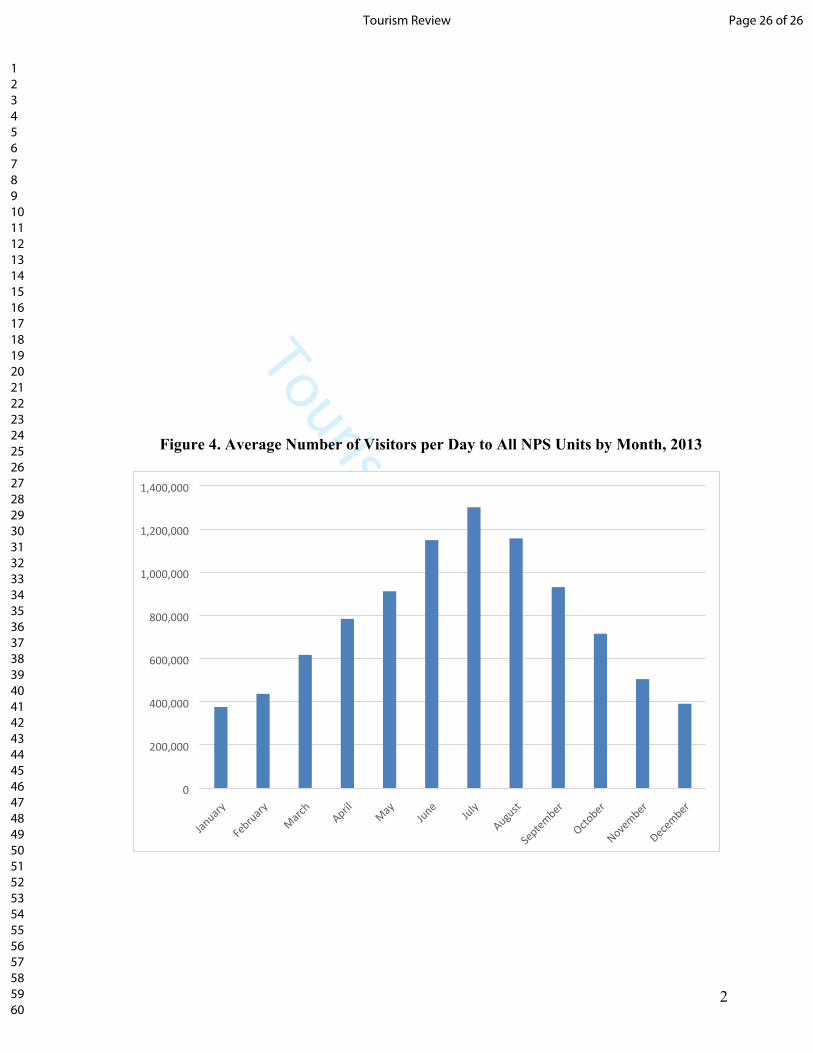
visitation data for the past 10 years. We emphasized the spending behavior of non-local visitors.
Local visitors to parks shift spending within a region rather than create new economic activity.4
Non-local visitors were disaggregated to account for day visitors and overnight visitors. Overnight
visitors were divided up into two distinct groups—those staying at the park lodges and those that
were tent, Recreational Vehicle, and backcountry campers—due to differences in the amount of
spending by lodge and non-lodge visitors. We also determined the compound average annual
growth rate over the past ten years in overnight and day visitors. These rates were used to project
total visitors, overnight lodge visitors, and other overnight visitors for each park under study for
3 When conducting economic impact analysis, different assumptions and methodologies can artificially inflate the true economic impact. For example, Input-Output studies will often examine ‘total spending’ on a good rather than ‘new spending’ to inflate the economic impact estimates. They count increased spending at new attractions but not the reduced spending elsewhere. We have endeavored to act in the opposite way—taking conservative views on the data, assumptions, and methodologies. Therefore, one can assume that the results from our analysis provide a lower bounds on the true economic impact of dark skies.4 A local visitor to the park for dark skies could create new economic spending if the spending was actually new and not a rearrangement of current spending. However, we do not have data to make such judgments. Furthermore, any new local spending on gas, food and lodging would be very small. .
Page 8 of 26Tourism Review
123456789101112131415161718192021222324252627282930313233343536373839404142434445464748495051525354555657585960
Tourism Review
9
each year for the next 10 years. As of the writing of this case study, 2015 is the most recent year for
complete data not subject to future revisions.
Table 2 shows these growth rates as well as the number of non-local visitors by category.
For example, Bryce Canyon had 1.6 million non-local visitors of which 53,792 spent the night at the
park lodge and 96,694 spent the night at the park in a non-lodge format. The number of lodge visits
to Bryce Canyon is expected to grow at an annual rate of 1.82% each year for the next 10 years
while non-lodge overnight visitors are expected to grow at a rate of 1.73%.
<<Table 2 here>>
Significantly, examining Table 2 illustrates some patterns that should be striking for those
interested in the economic impact of tourism. For example, based on recent trends at Grand Canyon
National Park, the number of overnight lodge visitors is expected to decline at an annual rate of
0.95% while at the same time, the number of overnight non-lodge visitors can be expected to
increase by 1.51% per year every year. This means that by overnight lodge visitors to the Grand
Canyon will decline from 540,000 in 2015 to 490,838 in 2025—a decrease of nearly 49,161
visitors. Meanwhile, other overnight visitors will increase from 635,342 in 2015 to 758,997 in
2025—an increase of 123,635.
We then used National Park Service data from past studies such as park-specific expenditure
surveys and other NPS sources to determine visitor spending on several different categories of
goods and services (Cui, et. al., 2013; Thomas, et.al, 2014). These categories were retail sales,
recreation spending, auto and transportation related spending, grocery spending, restaurant
spending, and lodging spending. Category specific price index data for the past 10 years was
collected on each of the different categories and was used to project the future prices of each of the
Page 9 of 26 Tourism Review
123456789101112131415161718192021222324252627282930313233343536373839404142434445464748495051525354555657585960
Tourism Review
10
different spending categories via the past average annual growth rate of prices within the category.
Once each category’s price growth rate was determined, a weighted average using each category’s
relative share of spending to total spending was established and used to determine the growth rate of
future spending. For example, visitors who stayed at a NPS lodge tended to spend 45.92% of the
total tourism dollars on lodging while those who stayed overnight in another format only spent
24.9% of the tourism dollars on lodging. These group-specific spending profiles, one for overnight
lodge visitors and for other overnight visitors, were adjusted for inflation so that all spending during
the project time period is occurring in 2017 dollars. Finally, the spending and all economic impacts
were discounted during the study period in accordance with standard economic methodology. The
average yield of the 10-year US Treasury bond over the past 10 years was used as the discount rate.
Once we had the yearly number of overnight visitors by category and knew how much each
visitor was going to be spending in inflation-adjusted dollars on each spending category, we needed
to determine how important the dark skies were for the purpose of their visit. If a non-local visitor
is spending the night at a park, but does not value a dark night sky as an attracting amenity, then it
would be inaccurate to count their spending, and subsequent economic impact from that spending,
in our analysis. As previously discussed, visitors who do not explicitly value dark skies might still
be benefit from them if, as research suggests, dark skies help protect wildlife. Accordingly, the
economic impact of preserving dark skies could be larger than the numbers presented here. Figure 3
gives a visual illustration of which visitors’ expenditures are being counted in the Input-Output
model. Tourists are divided into local and non-local groups which are then further subdivided into
those that value dark skies and those that do not. Finally, visitors are subdivided again into
overnight visitors or day visitors. Only visitors with a ‘Yes’ are having their tourism expenditures
entered into the Input-Output model—the tourism expenditures of visitors with a ‘No’ are left out of
our Input-Output analysis. As one can see, there is a significant amount of spending by visitors that
Page 10 of 26Tourism Review
123456789101112131415161718192021222324252627282930313233343536373839404142434445464748495051525354555657585960
Tourism Review
11
is outside the focus of our model, which further suggests our estimate of the economic impact of
dark skies on the regional economy is conservative.
<<Figure 3 here>>
Previous research has investigated the importance of scenic views and dark skies in national
parks (Culesza, 2013). Researchers conducted surveys to ascertain visitor opinions about dark
night skies and other issues. Forty-one studies were conducted between 1988 and 2011 in 15
National Parks. The surveys gathered responses from 18,345 visitor groups (Culesza, 2013). These
included several from the Colorado Plateau. Visitors were asked how important dark starry skies
were to their visit. They ranked the importance on a five-tier scale from not important to extremely
important. The percentage of respondents who answered that dark skies were very important or
extremely important were compiled and this weighed average of 65.1% was used for parks where
no dark sky opinion survey was conducted. In parks that did have data on visitor attitudes, those
specific survey numbers were used to determine the percentage of visitors who valued dark skies.
Over the past two decades, the percentage of people who believe that dark skies are
important has been increasing. For example, in 1990 only 14% of visitors to Death Valley thought
of dark skies as very or extremely important. By 1996, that figure had risen to 44%. Similarly, when
asked to rank the park asset that was the most important to protect, visitors to Death Valley rated the
night sky number 8 in 1990, 7 in 1996 and 6 in 2009 (Culesza, 2013). For the study as a whole,
2010 saw the largest number of visitors, from the most parks, surveyed. In that year, 69% of
respondents, on average, rated the night sky as very important or extremely important. What might
be driving this increase? Perhaps people are becoming more aware of light pollution. Or perhaps,
people are beginning to realize that dark skies are becoming ‘endangered’ and are now more apt to
act to preserve them. It should also be noted that scenic amenities have always been important to
Page 11 of 26 Tourism Review
123456789101112131415161718192021222324252627282930313233343536373839404142434445464748495051525354555657585960
Tourism Review
12
park visitors. Across the National Park Service, 90% of visitors say scenic views are an extremely
or very important resource to protect and preserve (Culesza, 2013). Therefore, it seems that
visitors are simply more aware that there is something worth seeing in the parks at night. No matter
the reason, the conclusion is clear—dark skies and their preservation is becoming increasingly
important to people. This fact suggests, once again, that the results of our study are a lower bound
on the economic impact of dark skies. Growing awareness of light pollution as well as the creation
and promotion of Dark Sky Parks suggests the percentage of visitors emphasizing the importance of
dark skies will be higher, by the end of the decade, than the backwards looking average we used.
V. Economic Impact Results
The results of our IO analysis are shown in Table 3. They show the economic impact of dark
sky related tourism on the Colorado Plateau, by year, for 10 years based upon recent trends in the
number of visitors, spending, and attitudes towards dark skies. This economic impact is examined
under several different metrics including visitor spending, wages, value added, and jobs and these
are tallied in Table 3 for both Lodge and non-lodge overnight visitors. The data on total non-local
visitor spending and the income (wages) and value added created from this spending, is reported in
real 2015 discounted dollars. All of the figures in the table represent the sum of direct, indirect, and
induced changes in the economy.
<<Table 3 here>>
As one can see, the effect of dark skies on the state economies is quite large. In the 10 years
from 2015 to 2024, visitors will spend nearly $5.75 billion visiting NPS parks on the Colorado
Plateau trying to see a dark sky at night. About 58% of this spending will be due to NPS lodges
with the remaining 42% at other NPS lodging. This is despite the fact that the NPS lodges receive
Page 12 of 26Tourism Review
123456789101112131415161718192021222324252627282930313233343536373839404142434445464748495051525354555657585960
Tourism Review
13
fewer visitors. This additional $5.75 billion in spending creates $3.8 billion in additional value
added for the local state economies. The total effect of all of this additional spending is to create an
average of 10,127 additional jobs per year for a total of 113,656 future job years. This will increase
wages in the states by over $2.423 billion dollars.
VI. Leveraging Dark-Sky Tourism
Table 2 shows a downward trend in the number of park visitors for several national parks.
This is problematic for local businesses that depend upon park visitors. Recall that some parks in
our study are expected to see visitorship increases—however, based on recent trends, a majority of
them are projected to see decreases. Of the 20 different NPS areas that had non-lodge overnight
visitors, 6 of them are expected to have decreases in the number of overnight visitors. The average
annual decline in the number of visitors was over 6.7% with a weighted average annual decline of
1.1%. Some of these decreases are quite substantial. If recent trends continue, Canyon de Chelly
would have annual non-Lodge overnight visitors decrease by 33% every year meaning that at the
end of the study period there will only be 8 non-Lodge overnight visitors to Canyon de Chelly per
year. Only 2 of the 7 lodges are projected to have increasing numbers of visitors over the next 10
years. The average annual decline in lodge visitors to the Colorado Plateau region is almost 7%
with a weighted average yearly decline of 1.3%. The declines for lodge visitors are even more
worrisome since they have a larger economic impact on local communities then non-lodge visitors.
This creates a strong incentive for both the NPS parks and local businesses on the Colorado
Plateau to work together to reverse recent trends, attract more visitors, and increase the number of
overnight stays. Survey data shows that visitors are increasingly considering dark skies as an
attraction and are willing to pay to see dark skies (Mitchell, et. al. 2017). Therefore, the dark skies
of the Colorado Plateau can be used, and promoted, as a magnet for tourism. Crucially, from an
Page 13 of 26 Tourism Review
123456789101112131415161718192021222324252627282930313233343536373839404142434445464748495051525354555657585960
Tourism Review
14
economic standpoint, the single most important thing about dark-sky tourism is that it necessitates
one or more overnight stays. The NPS estimates that the average spending per party per day is
about $90 for non-local day trips. For parties staying overnight at an NPS lodge, this spending rises
to over $390, for those staying in motels outside the park, the amount is a little over $270 (Thomas,
et. al. 2014; Cui, et. al. 2013). Increasing the number of visitors and encouraging overnight stays
can have large economic benefits for the local communities.
Similarly, by focusing on dark skies as a method of attracting visitors, the parks and local
communities can better utilize their resources without significant capital investment. Most national
parks have a surge of visitors in the summer months but far fewer visitors in the other seasons (see
Figure 4). This means the tourism related businesses and community infrastructure cannot be used
in an efficient manner. Hotel rooms and restaurants vacillate between being overcrowded and
empty. Dark skies grow in value as an amenity during off-peak times and can therefore be used to
spur tourism during the off season leading to an increase in efficiency of tourism related
infrastructure and resources.
Stargazing is, in many ways, better in the fall, winter, and spring due to longer nights and
other factors. For example, a popular activity among some recreational astronomers is participating
Messier Marathons, where individuals try to observe as many of the 110 deep-sky objects, such as
nebulae and galaxies, cataloged by the 18th century astronomer Charles Messier.
<<Figure 4 here>>
Messier marathons are held near the new moons in early spring, because it is possible to see
all of the objects in one night for mid to low latitudes of the Northern Hemisphere. In the Colorado
Plateau, cloud free nights with good air quality are most likely to be found during May and June, as
Page 14 of 26Tourism Review
123456789101112131415161718192021222324252627282930313233343536373839404142434445464748495051525354555657585960
Tourism Review
15
well as September and October (Moore, 2015). Accordingly, promoting dark skies will increase the
number of visitors during the off-peak seasons and provide a longer more sustained period of
tourism activity providing the park and local businesses with a steadier source of income.
VII. Conclusion
This case study has examined the impact that dark skies have on the local economies for
areas around national parks in the Colorado Plateau. The Colorado Plateau is an area known for its
dark skies. This amenity is becoming increasingly more important to visitors at the exact same time
that it is becoming more threatened. Our results indicate that the current economic impact of the
dark skies tourism is substantial. Of the over 4.1 million non-local overnight visitors to NPS parks
on the Colorado Plateau, those who rate the night sky as very important or extremely important will,
over ten years, create an additional 10,127 jobs per year on average because they will spend over
$5.75 billion. This will increase wages by over $2.4 billion and increase gross state product by over
$3.8 billion.
Importantly, these numbers do not include the very substantial economic impact of the
majority of non-local overnight visitors because they stayed in lodging outside the parks and were
not included in our calculations. Similarly, these figures do not measure the full economic
significance of these parks. Such a measure would include spending by locals as well. Nationally,
it should be noted, spending by locals and by visitors who lodge outside of the parks account for
over two-thirds of the total spending (Cui, et al., 2013). Additionally, these figures do not include
the impact of visitors to USFS or BLM lands. For now, we do not have sufficient data to estimate
the additional economic impact of night sky tourism associated with these lands. However, we do
know that, on the Colorado Plateau, both of these types of lands attract tens of millions of visitors
per year. We also know that experiencing nature and viewing scenic vistas are consistently
important factors to many visitors to public lands. These facts speak both to the existing additional
Page 15 of 26 Tourism Review
123456789101112131415161718192021222324252627282930313233343536373839404142434445464748495051525354555657585960
Tourism Review
16
economic impact of night sky tourism in the region and to the potential for leveraging the unique
resources of the Colorado Plateau to further promote such tourism.
The reported figures assume simply the continuation of existing trends, with no increase in
efforts to promote night sky tourism. We have shown that dark skies are a valuable resource. This
presents the local communities and the parks in the Colorado Plateau with a unique opportunity for
partnership. If public land managers and local communities were to work together to promote dark
sky tourism and increase the number of visitors to the area, the economic impact would be
substantial. We leave this impact to future research.
References
Armstrong, H. and Taylor, J. (2000). Regional Economics and Policy. 3rd edition. Malden, Massachusetts: Blackwell Publishers.
Bennie, J., Davies, T. W., Cruse, D., Bell, F. and Gaston, K. J. (2018) Artificial light at night alters grassland vegetation species composition and phenology. Journal of Applied Ecology, 55 (1) pp. 442-450.
Bertiau, F. C., de Graeve, E. and Treanor, P. J. (1973) The artificial night-sky illumination in Italy, Vatican Observatory Publications, 1, pp. 159-179.
Briassoulis, H, (1991). Methodological issues: Tourism input-output analysis. Annals of Tourism Research, 18(3), pp. 485-495.
Briedenhann, J. and Eugenia W. (2004). Tourism routes as a tool for the economic development of rural areas—vibrant hope or impossible dream?. Tourism Management, 25(1), pp. 71-79.
Bue, B., Sharr, S. and Seeb, J. (1998). Evidence of Damage to Pink Salmon Populations Inhabiting Prince William Sound, Alaska, Two Generations after the Exxon Valdez Oil Spill. Transactions of the American Fisheries Society, 127(1), pp. 35-43.
Carr, L. and Mendelsohn, R. (2003). Valuing Coral Reefs: A Travel Cost Analysis of the Great Barrier Reef. AMBIO: A Journal of the Human Environment, 32(5), pp. 353-358.
Cater, C. I. (2010) Steps to Space; opportunities for astrotourism. Tourism Management, 31(6), pp. 838–845. doi: 10.1016/j.tourman.2009.09.001.
Cline, S. and Seidl, A. (2010). Combining non-market valuation and input-output analysis for community tourism planning: Open space and water quality values in Colorado, USA.
Page 16 of 26Tourism Review
123456789101112131415161718192021222324252627282930313233343536373839404142434445464748495051525354555657585960
Tourism Review
17
Economic Systems Research, 22(4), pp. 385-405.
Cui, Y., Mahoney, E. and Herbowicz, T. (2013). Economic Benefits to Local Communities from National Park Visitation, 2011, Natural Resource Report NPS/NRSS/ARD/NRR-2013/632, Ft. Collins, CO: National Park Service, U.S. Department of the Interior.
Cruz, L. M., Shillinger, G. L., Robinson, N. J., Tomillo, P. S. and Paladino, F. V. (2018) Effect of light intensity and wavelength on the in-water orientation of olive ridley turtle hatchlings. Journal of Experimental Marine Biology and Ecology, 505 pp. 52-56.
Culesza, C., Le, Y., Littlejohn, M. and Hollenhorst, S. (2013) National Park Service Visitor Values & Perceptions of Clean Air, Scenic Views & Dark Night Skies 1988-2011, Natural Resource Report, NPS/NRSS/ARD/NRR-2013/632. Ft. Collins, CO: National Park Service , U.S. Department of the Interior.
Davies, T. W. and Smyth, T. (2018). Why artificial light at night should be a focus for global change research in the 21st century. Global Change Biology, 24.3, pp. 872-882.
Fayos-Solá, E., Marín, C. and Jafari, J. (2014). Astrotourism: No Requiem for Meaningful Travel. Pasos: Revista de Turismo y Patrimonio Cultural, 12.4, pp. 663-71.
Fennell, D. A, and Eagles, P.F.J. (1990). Ecotourism in Costa Rica: a conceptual framework. Journal of Park and Recreation Administration, 8(1), pp. 23-34.
Gallaway, T. (2010) On Light Pollution, Passive Pleasures, and the Instrumental Value of Beauty. Journal of Economic Issues, 44(1), pp. 71-88.
Gallaway, T., Olsen, R. and Mitchell, D. (2010). The Economics of Global Light Pollution. Ecological Economics, 69(3) pp. 658-65.
Hall, D. R. (1991).Tourism & economic development in Eastern Europe & the Soviet Union. London, IK: Belhaven Press.
Hänel, A. (2016) ‘Sternenparks – mehr als nur Naturtourismus:Anmerkungen und Ergänzungen zum Beitrag von Labuda et al’, Naturschutz & Landschaftsplanung, 48(2), pp. 61–63.
Walter, I., Azis, I., Drennan, M., Miller, R., Saltzman, S., and Thorbecke, E. (1998). Methods of Interreginoal and Regional Analysis. Brookfiled, Vermont: Ashgate Publishing.
Kim, Hyojin, and Kim, B-G. (2015). Economic Impacts of the hotel industry: an input-output analysis. Tourism Review, 70(2), pp. 132-149.
Kim, H. J. Chen, M.-H. and Jang, S. C. (2006). Tourism expansion and Economic Development: The case of Taiwan. Tourism Management, 27(5), pp. 925-933.
Kim, M., Subramanian, M., Cho, Y.-H., Kim, G.-H., Lee, E. and Park, J.-J. (2018). Short-term exposure to dim light at night disrupts rhythmic behaviors and causes neurodegeneration in fly models of tauopathy and Alzheimer's disease. Biochemical and Biophysical Research
Page 17 of 26 Tourism Review
123456789101112131415161718192021222324252627282930313233343536373839404142434445464748495051525354555657585960
Tourism Review
18
Communications, 495(2), pp. 1722-1729.
Kronenberg, K., Fuchs, M. and Lexhagen, M. (2018), A multi-period perspective on tourism’s economic contribution-a regional input-output analysis for Sweden, Tourism Review, 73(1), pp. 94-110.
Labuda, M, Kolch, R, & Nagyová, A. (2015) ‘Sternenparks als Maßnahme zu Unterstützung des Naturtourismus in den Großschutzgebieten: Eine Fallstudie im Naturpark Nossentiner/Schwinzer Heide’, Naturschutz & Landschaftsplanung, 47(12), pp. 380–388.
Labuda, M., K. Pavličková and J. Števová (2016). Dark Sky Parks - New Impulse for Nature Tourism Development in Protected Areas (National Park Muranska Planina, Slovakia). E-review of Tourism Research, 13(5/6). pp. 536-49.
Los, B. and Steenge, A. E. (2010). Tourism Studies and Input-Output Analysis: Introduction to a Special Issue, Economic Systems Research, 22(4), pp. 305-311.
Mace, B. L. and McDaniel, J.. (2013) Visitor Evaluation of Night Sky Interpretation in Bryce Canyon National Park and Cedar Breaks National Monument. Journal of Interpretation Research, 18(1), pp. 40-57.
McCann, P. (2013). Modern Urban and Regional Economics. Oxford, England: Oxford University Press.
Meier, J., Hasenöhrl, U., Krause, K. and Pottharst, M. (2015) Urban lighting, light pollution, and society. New York: Routledge, Taylor & Francis Group.
Mitchell, D., Gallaway, T., and Olsen, R. (2017). Estimating the Willingness to Pay for Dark Skies, International Journal of Research in Engineering and Technology, 6(3), pp. 18-24.
Moore, C. (2015) National Park Service, [email].
Muloin, S. (1998). Wildlife Tourism: The Psychological Benefits of Whale Watching. Pacific Tourism Review, 2(3-4), pp. 199-213.
Page, S.J. and Dowling, R.K. (2001). Ecotourism. Harlow, UK: Pearson.
Pomarico, B. (2014). Public Land Statistics 2013 Blm/Oc/St-14/004+1165 p-108-3, U.S. Department of the Interior. Washington, D.C., Bureau of Land Management.
Rodrigues, A. L. O., Rodrigues, A. and D. M. Peroff (2015). The sky and sustainable tourism development: A case study of a dark sky reserve implementation in Alqueva. International Journal of Tourism Research, 17.3, pp, 292-302.
Salmon, M., Tolbert, M., Painter, D., Goff, M., and Reiners, R. (1995). Behavior of loggerhead sea turtles on an urban beach. II. Hatchling orientation. Journal of Herpetology, 29(4), pp. 568-576.
Page 18 of 26Tourism Review
123456789101112131415161718192021222324252627282930313233343536373839404142434445464748495051525354555657585960
Tourism Review
19
Salmon, M. and Witherington, B. (1995). Artificial lighting and seafinding by loggerhead hatchlings: Evidence for lunar modulation. Copeia, 1995(4), pp. 931-938.
Shaw, D. (1992). The Exxon Valdez Oil-spill: Ecological and Social Consequences, Environmental Conservation, 19(3), pp. 253-258.
Sinclair, M. T. (1998). Tourism and economic development: A Survey. The Journal of Development Studies, 34(5), pp. 1-51.
Street, B. (2014). Statistical Abstract: 2013. Natural Resource Data Series Nps/Nrss/Eqd/Nrds—2014/635. Ft. Collins, CO: National Park Service, U.S. Department of the Interior.
Thomas, C. Huber, C. and Koontz, L. (2014). 2013 National Park Visitor Spending Effects: Economic Contributions to Local Communities, States, and the Nation Natural Resource Report NMPS/NRSS/EQD/NRR-2014/824. Ft. Collins, CO: National Park Service, U.S. Department of the Interior.
Tohmo, T. (2018) The economic impact of tourism in Central Finland: a regional input-output study. Tourism Review, 73(4), pp. 521-547.
Underhill, V. A. and Höbel, G. (2018). Mate choice behavior of female Eastern Gray Treefrogs (Hyla versicolor) is robust to anthropogenic light pollution. Ethology, 124.8, pp. 537-548.
Verheijen, F. J. (1985). Photopollution: artificial light optic spatial control systems fail to cope with. Incidents, causation, remedies. Experimental Biology, 44(1), pp. 1-18.
Weaver, D. (1999). Magnitude of ecotourism in Costa Rica and Kenya. Annals of Tourism Research, 26(4), pp. 792-816.
Page 19 of 26 Tourism Review
123456789101112131415161718192021222324252627282930313233343536373839404142434445464748495051525354555657585960
Tourism Review
2
Figure 1. The Colorado Plateau shown in pink with areas of light pollution shown in white
Page 20 of 26Tourism Review
123456789101112131415161718192021222324252627282930313233343536373839404142434445464748495051525354555657585960
Tourism Review
Table 1. NPS Parks in the Colorado PlateauNational Park State Area
(sq. miles)Arches NP UT 120Black Canyon of the Gunnison NP CO 47Bryce Canyon NP UT 56Canyon de Chelly NM AZ 131Canyonlands NP UT 527Capitol Reef NP UT 378Cedar Breaks NM UT 10Chaco Culture NHP NM 53Colorado NM CO 32Dinosaur NM CO, UT 329El Malpais NM NM 179El Morro NM NM 2Glen Canyon NRA AZ, UT 1875Grand Canyon NP AZ 1902Hovenweep NM CO, UT 1.2Hubbell Trading Post NHS AZ NALake Mead NRA AZ, NV 2338Mesa Verde NP CO 81Natural Bridges NM UT 12Navajo NM AZ 0.6Grand Canyon Parashant (Meade) AZ 1638Petrified Forest NP AZ 146Rainbow Bridge NM UT 0.25Sunset Crater Volcano NM AZ 5Walnut Canyon NM AZ 6Wupatki NM AZ 55Zion NP UT 229
Page 21 of 26 Tourism Review
123456789101112131415161718192021222324252627282930313233343536373839404142434445464748495051525354555657585960
Tourism Review
Figure 2. IDA and Tourism Promotion Posters for Dark Sky Parks in the Colorado Plateau (credit: Tyler Nordgren, NPS, IDA)
Page 22 of 26Tourism Review
123456789101112131415161718192021222324252627282930313233343536373839404142434445464748495051525354555657585960
Tourism Review
Table 2. 2015 Visitation and 10 Year Compound Annual Growth Rates (CAGR*)
Park Total Non-Local Visits
Overnight Lodge Visits
Other Overnight
Visits
CAGR* Overnight
Lodge Visits
CAGR* Other Overnight
VisitsArches 1,399,247 0 50,936 N/A -0.32
Black Canyon 196,800 0 22,199 N/A 4.88Bryce Canyon 1,649,360 53,792 96,694 1.82 1.73
Canyon de Chelly 762,587 6,536 607 -14.26 -32.98Canyonlands 598,440 0 97,731 N/A -0.05Capitol Reef 921,558 0 43,522 N/A 2.13Cedar Breaks 743,004 0 1,337 N/A -1.69Chaco Culture 37,007 0 12,987 N/A -3.51Colorado N M 551,344 0 19,602 N/A 3.02
Dinosaur 275,953 0 62,580 N/A 0.76El Malpais 146,523 0 0 N/AEl Morro 46,395 0 3,565 N/A 2.71
Glen Canyon 2,495,092 77,429 1,511,145 -5.87 4.77Grand Canyon 5,520,736 540,000 635,342 -0.95 1.51
Hovenweep 32,980 0 2,375 N/A 5.37Hubbell Trading
Post 55,712 0 0 N/A N/A
Lake Mead 5,063,423 21,162 461,402 -7.37 -1.57Mesa Verde 536,320 22,019 56,407 -6.19 3.50
Natural Bridges 89,080 0 7,501 N/A 1.94Navajo 66,964 0 3,362 N/A 0.30
Petrified Forest 742,614 0 437 N/A 4.86Rainbow Bridge 64,907 0 0 N/A N/ASunset Crater
Volcano 153,050 0 0 N/A N/A
Walnut Canyon 128,791 0 0 N/A N/AWupatki 199,245 0 0 N/A N/A
Zion 3,388,435 82,853 250,928 0.74 2.63
SUM 25,865,567 803,791 3,340,659Not all parks have lodges. *CAGR is the rate at which a given present value grows to a given future value in a
given amount of time. CAGR = (FV/PV)1/n – 1 where FV is the future value, PV is the present value, and n is the number of years.
Page 23 of 26 Tourism Review
123456789101112131415161718192021222324252627282930313233343536373839404142434445464748495051525354555657585960
Tourism Review
Table 3. Economic Impact of Dark Skies Total Spending in 2015 $
Year Visitor Spending Value Added Income Jobs2015 497,643,649 331,654,954 212,717,012 8,695 2016 513,682,130 341,730,051 218,934,460 8,949 2017 513,869,262 341,559,369 218,565,144 9,224 2018 514,932,369 341,911,087 218,515,616 9,522 2019 516,855,780 342,777,292 218,780,730 9,845 2020 519,628,241 344,152,476 219,356,778 10,194 2021 523,242,484 346,033,313 220,241,354 10,570 2022 527,694,871 348,418,477 221,433,248 10,975 2023 532,985,127 351,308,507 222,932,361 11,412 2024 539,116,114 354,705,691 224,739,639 11,882 Sum 5,745,743,681 3,802,865,197 2,423,073,364 113,656
Page 24 of 26Tourism Review
123456789101112131415161718192021222324252627282930313233343536373839404142434445464748495051525354555657585960
Tourism Review
Figure 3. Tourism Classification Illustrated
Page 25 of 26 Tourism Review
123456789101112131415161718192021222324252627282930313233343536373839404142434445464748495051525354555657585960
Tourism Review
2
Figure 4. Average Number of Visitors per Day to All NPS Units by Month, 2013
January
February
March
AprilMay
JuneJuly
August
September
October
November
December
0
200,000
400,000
600,000
800,000
1,000,000
1,200,000
1,400,000
Page 26 of 26Tourism Review
123456789101112131415161718192021222324252627282930313233343536373839404142434445464748495051525354555657585960