TEDDI: Tamper Event Detection on Distributed Cyber-Physical Systems Dartmouth Computer Science Technical Report TR2016-804 A Thesis Submitted to the Faculty in partial fulfillment of the requirements for the degree of Doctor of Philosophy in Computer Science by Jason Reeves DARTMOUTH COLLEGE Hanover, New Hampshire May 2016 Examining Committee: (chair) Sean W. Smith, Ph.D. Sergey Bratus, Ph.D. David F. Kotz, Ph.D. Zbigniew T. Kalbarczyk, Ph.D. Ryan Bradetich, Ph.D. F. Jon Kull, Ph.D. Dean of Graduate Studies
Transcript
TEDDI: Tamper Event Detection on Distributed Cyber-Physical Systems
In this thesis, we introduce TEDDI (Tamper Event Detection on Distributed Infrastructure),
a novel, distributed, sensor-based tamper protection architecture to address security issues
arising from the installation ofedge devices, or networked smart devices on the periphery
of utilities’ networks. We show how these edge devices lead to a problem we define asthe
grid defender’s dilemma; that is, these edge devices provide an easy way for an attacker to
cause massive damage to the grid, and while power grid defenders1 would like to use state-
of-the-art protection solutions to prevent this damage, the unique goals and constraints of
the power grid prevent defenders from doing so. We outline the various components of
TEDDI and how they interact with one another, and describe how the system uses factor
graphs [42] to make decisions about tamper events that are currently occurring based on
the available data. Finally, we evaluate the speed, accuracy, and resource requirements of
TEDDI, and show that TEDDI can solve the above dilemma with comparable or better
performance than prior work.
1We use the termsuser, operator, anddefenderinterchangeably in this thesis to describe the utility per-sonnel who are responsible for the security and proper operation of the power grid (and thus are the users wetarget with TEDDI).
1
1.1 Edge Devices and the Power Grid
A power grid is a large, interconnected web of power lines andsubstations designed to
transport electricity from the power plants that generate it to the homes and businesses that
consume it [139]. While the U.S. grid began as a collection of isolated utilities distributing
power within their local area, as the demand for power grew, these utilities began to connect
to each other to share the costs of building larger generation plants while also increasing
the reliability of their local grids (since a utility could now draw on reserves from other
utilities to meet demand when necessary). The result is our current grid setup, as described
by the U.S. Energy Information Administration:
“The interconnected [power grid] systems now include about 2,000 electric
distribution utilities, more than 300,000 miles of transmission and distribution
lines, millions of customers, and more than 7,200 power plants and generating
facilities that each has at least 1 megawatt of generating capacity” [139].
Because electricity cannot be stored effectively in large quantities, the power grid is
constructed as areal-timesystem; that is, power must be generated on-demand the moment
it is needed [139]. As a real-time system, the grid requires constant monitoring and timely
interventions to operate properly. Given the speed and destructive power of electricity, these
interventions must happen quickly, often within a small time window in which a human
cannot react. The need for such timely interventions has ledthe industry to automate many
routine tasks based on the state of the grid, using devices such as generator governors and
protective relays [143].
Recently, utilities have introduced a number of “smart” gridtechnologies into the grid,
with the aim of improving the grid’s reliability and efficiency by cutting down on power
losses, reducing maintenance times, and encouraging consumers to save energy [139]. As
part of this push towards a smarter grid, utilities have installed a number ofedge devices
2
on their SCADA2 networks. networks. Edge devices are resource-constrained embedded
devices that live on the periphery of a network, e.g. at a consumer’s home or on a telephone
pole. An example of an edge device is a recloser control [113], which is used to configure
how a utility’s reclosers3 behave when a fault is detected in the power lines, and is often
mounted inside boxes on utility poles in the field.
Edge devices present a major security challenge for the power grid for three reasons:
1. Distributed: These devices are distributed all across a utility’s service area and may
appear in almost any environment, from remote rural areas (where these boxes are
under very little supervision) to highly-populated urban areas (where they are easily
accessible to a large number of people).
2. Minimal Physical Security: These devices often have little in the way of physical
security. Generally, they are either directly exposed to the environment, or are locked
within an easily-accessible cabinet.
3. Network Access:These devices have a direct connection to a utility’s SCADA net-
work. While this is intended to allow the device to communicate with specific parties,
such as a data aggregator or a server at a utility’s control center, it may also grant the
device access to everything else on the network, such as other edge devices, other
control centers, or perhaps other pieces of the control infrastructure.
In short, edge devices are enticing targets for malicious actors, who can use them to
harm the grid on a number of levels:
At the Device Level: An attacker can access potentially sensitive data on the device (for
example, cryptographic keys) or modify the outputs to mislead network operators2SCADA stands for “Supervisory Control and Data Acquisition,” and is generally used to describe the
command-and-control networks used by critical industrieslike the power grid.3A recloseris a grid protection device that is used to quickly restore service in the event of a transient
fault, such as a short circuit [1]. When a transient fault is detected on a power line, a recloser can disconnectthe line, wait for the fault to clear, and then reconnect the line automatically, which leads to shorter outagesand fewer technician visits to field equipment.
3
(for example, report incorrect usage data to commit fraud).
At the Local-Area Network Level: Once a device is compromised, an attacker can com-
promise other similar devices that are nearby, and build a botnet of edge devices that
can be used to execute a coordinated attack against the grid.For example, an attacker
controlling a large number of smart meters can order them to all disconnect and then
reconnect at the same time, creating a large load shift that can be disastrous for grid
equipment [143].
At the Wide-Area Network Level: This scenario is the most concerning for utility oper-
ators, since an attacker could use a compromised edge deviceas a gateway toanyof
the devices on a utility’s SCADA network, leaving substations, control centers, and
potentially even generators open to attack. (Our conversations with industry insid-
ers indicate that flat, unsegmented networks are frequentlyencountered in the power
industry—for example, a recent attack on Ukraine’s power grid involved “issuing
commands directly from a remote station” [70]. Even if networks had some sort of
segmentation in place, there would still need to be holes forlegitimate communica-
tion, which can be leveraged by an attacker as well.) The consequences of such an
attack could be disastrous: A 2014Wall Street Journalarticle declared that malicious
attackers could cause a nationwide blackout by taking down fewer than ten critical
substations during a period of high demand on the grid, and that such a blackout
“could plunge the country into darkness for weeks, if not months” [116]. Thus, a
compromised edge device could give an attacker access to oneor more of these criti-
cal substations, and thereby allow them to cause damage thatextends far beyond the
loss of a single device.
Given these potential consequences, protecting edge devices is a high priority for utili-
ties.
4
1.2 The Grid Defender’s Dilemma
As a first step towards protecting these edge devices, we developed Autoscopy Jr. [99],4 a
host-based intrusion detection system that used control-flow integrity to sense the presence
of rootkits installed on the device. Autoscopy Jr. worked first by learning a profile of
“normal” behavior that occurred on the system, and then by monitoring the system and
identifying when the system deviated from this profile. It also minimized its burden on the
host by living directly within the OS itself, as opposed to using a resource-intensive virtual
machine to isolate our code from the kernel. Our prototype was so successful that we were
able to successfully transfer the technology to SchweitzerEngineering Laboratories, who
incorporated Autoscopy Jr. into their product line.
From Autoscopy Jr., we expanded our scope to look at the larger problem of devicetam-
peringwhen Schweitzer proposed the idea a few years later. (Details on “The Schweitzer
Scenario” can be found in Section 3.4.) While protecting devices from tampering is a long-
standing, well-researched problem (Kent [65] provides oneof the earliest examples, and
Weingart [151] provides a comprehensive summary of attacksand defenses), SCADA net-
works present a unique challenge for security professionals, which we define as thegrid
defender’s dilemma. A summary of the dilemma is given below (see Chapter 4 for details):
• SCADA networks are vulnerable to malicious attacks with devastating consequences
(for example, widespread outages [116]), but are also exposed to a large number of
“non-malicious” tamper events, ranging from technician visits to large-scale natural
disasters.
• Unlike traditional IT networks,SCADA networks prioritize availability over every-
thing else, including over system integrity.This means that correctly identifying and
reacting to an event is critical:
4We would be remiss if we did not mention Ashwin Ramaswamy, whose original Autoscopy work [100]provided the foundation for our Autoscopy Jr. system.
5
– Under-responding to a malicious event gives attackers an opening to execute a
major attack and bring the grid down for a prolonged period.
– Over-responding to a benign event, however, can lead to unnecessary technician
visits, device replacements, and service outages.
• The cost of improper responses can be staggering: A single “truck roll” to a remote
site costs an average of over $400 [126], meaning that the cost of false-positive re-
sponses could add up quickly. On the other hand, however, a large business served
by Pacific Gas and Electric could lose over half a million dollars from just a 4-hour
power outage [109].
• As a real-time system, grid SCADA networks operate under tight timing require-
ments [56], and the number of legacy devices in the grid placeit under strict resource
constraints as well (see Section 2.2 for more details). Thismeans that regardless of
what responses are taken, they have to happen quickly.
• Finally, while grid defenders have a clear idea of their security goals and the attacks
they want to guard against, their resources are limited: They may not have the time
nor the training data to configure a complex protection system for their network.
In total, a SCADA protection system has to operate on embeddeddevices and should
be able to properly identify the events currently affectingthe network, determine the cor-
rect responses to these events, and execute these responsesquickly. Current intrusion and
tamper protection systems do not meet these requirements:
Current protection systems lack the power and/or context todifferentiate between
important tamper events. Many tamper protection systems are host-centered, and
simply cannot collect the data needed to detect distributedor context-sensitive events.
6
Current protection systems treat any sort of tampering as malicious. Even if a system
could tell the difference between different events, it often still lacks the capability to
change their response accordingly.
Current protection systems have either no response or a single response.Either the
systems are detection-only, or they have a single “catch-all” response.
Current protection systems are reactionary. By the time these systems detect an at-
tacker on the network, the attacker is already inside the security perimeter and exe-
cuting their attack plan.
Current protection systems require a lot of manual configuration. Trying to build
and configure some of these systems takes far more time and resources than a grid
defender has to spend.
Current protection systems cannot adhere to the grid’s inherent performance con-
straints. These systems are designed for different networks with different goals, and
are not able to operate under the restrictions of a grid SCADA network.
To solve this dilemma, we require a protection solution thatis flexible and accurate
enough to handle different types of tamper events, powerfulenough to enact the proper
responses to these events, fast enough to operate even underthe demands of grid networks,
and simple enough to capture a defender’s intuition about the problem without placing an
undue burden on them.
1.3 Our Proposal: TEDDI
To address the grid defender’s dilemma, we propose taking adistributedapproach to tam-
per detection, separating the different components (tamper sensing, decision-making, and
enforcement) into different entities that can live in different places in the SCADA network.
7
We drew inspiration for our system from the XACML policy language, which was designed
to offer “a method for handling a distributed set of policy components, while abstracting
the method for locating, retrieving and authenticating thepolicy components” [89].
Our tamper protection proposal, which we have named TEDDI (Tamper Event Detec-
tion on Distributed Infrastructure), consists of three main components:
Tamper Information Points (TIPs) (Section 6.4): Sensor-equipped5 programs that live
near edge devices and scrutinize their surroundings for potential tamper events.
Tamper Decision Points (TDPs)(Section 6.5): Regional decision-making engines that
live in higher-security areas of the network (for example, inside substations), listen
for tamper reports from the TIPs it serves, and use the current state of the network to
make a fully-informed tamper decision.
Tamper Enforcement Points (TEPs)(Section 6.6): The programs responsible for en-
forcing the decisions made by TEDDI by enacting defender-defined response se-
quences corresponding to the decisions.
These components work together to make and enforce tamper decisions as follows (see
Figure 1.1):
• Monitors placed near an edge device look for the presence ofindicators in the local
environment that may comprise a tamper event. As these indicators appear and dis-
appear, the monitors report the indicators’ presence or absence to the edge device’s
TIP.
• The edge device’s TIP will do as much event detection as it can with the information
it collects, and if it is able to definitively detect an event,it sends that event decision
5Note that we use the termssensorandmonitor interchangeably in this thesis to describe the mechanismsthat actually look for indicators in the environment. We started by exclusively using “sensor,” but switchedto monitor to synchronize our terminology with Bohara, Thakore, and Sanders [18].
8
TIP TDP
TEP
(E)
TEP
(C)
TEDDI
Monitors
1 2
3
Environmental
Indicators4
Figure 1.1: A diagram of how the components in our TEDDI system interact.Whenan indicator appears in the environment around an edge device (for example, a box isshaken), it is captured by monitors near the device (1) and sent to the device’s TIP (2),which then attempts to make a tamper decision on its own. If the monitor data is notenough to make a definitive event decision, the TIP requests assistance from its TDP (3),which takes data from a number of TIPs and can make an authoritative decision based onthe regional indicators it sees. Once a decision is made by either a TIP or TDP, it is sent toappropriateedgeandcentralTEPs (4), which can then coordinate the proper response. Formore details on this process, see Section 6.
to theedgeandcentralTEPs assigned to that device.6 The TEPs can then coordinate
the execute the proper responses.
• If the TIP requires data from other devices to make an event decision, it sends an alert
to its assigned TDP, which collects this data from all of its managed TIPs and can
make an informed, authoritative event decision. The TDP canthen send this decision
out to the appropriate TEPs.
We selectedfactor graphs[42] as our decision-making algorithm due to its combination
of computational power and conceptual simplicity. Factor graphs are bipartite graphs made
up of variable nodesand function nodes, where function nodes define the relationships
between different variable nodes (see Section 2.3.5 for more details). In comparison to
more common techniques such as Bayesian networks (BNs) and Markov random fields
(MRFs), factor graphs are powerful enough to represent any relationship that either a BN
or MRF can, and can depict complex BNs and MRFs in a simpler mannerby combining
6See Section 6.6 for more details on why two TEPs are assigned to each TIP.
9
multiple variable relationships into a single factor function [23]. As we demonstrate in
Section 9.3, we are also able to process factor graphs quickly enough to satisfy the grid’s
tight constraints.
We began by building an initial TEDDI prototype, which consisted of a single TDP
managing five TIPs and ten TEPs, to confirm the feasibility of our idea. Once this step
was completed, we constructed theTEDDI Generation Tool, which eases the burden of
configuring TEDDI on grid defenders by creating the custom TIP, TDP, and TEP programs
needed for any arbitrary SCADA network. The tool takes in two key sets of inputs:
• The events, indicators, and monitors that make up TEDDI’s factor graph, as well as
the responses available for each event.
• The topology of the SCADA network in question, including thetypes of devices
involved (i.e. which devices should be protected with a TIP,and which devices are
candidates for hosting a TDP) and the relevant networking information (IP addresses,
ports, etc.).
With this information, the generation tool can create the code for the required TIPs,
TDPs, and TEPs. To further ease the burden on grid defenders,we included the following
features in our tool:
Factor-Graph Domain-Specific Language (FGDSL):We give grid defenders a simple
way to define the data and relationships involved in our factor graph by providing
a domain-specific language (DSL) [124] called FGDSL, orfactor-graph domain-
specific language. The grid defender defines the relevant events, indicators,monitors,
and responses in FGDSL, and the generation tool does the rest, i.e., compiling the
data down into a full factor graph, creating a series of logical predicates to represent
the graph sequence, and eventually generating the actual code.
10
Response Suggestion Engine:To assist grid defenders in choosing the right response for
an event, we provide a response suggestion engine that offers advice on how to mod-
ify the provided factor graph and response sequences. If an event has an especially-
long indicator sequence, the tool will suggest addingpre-eventsthat detect when an
event is about to occur, allowing the system to take a pre-emptive response. Addi-
tionally, if two events have similar event sequences but different response sequences,
the system will recommend taking responses from one event and applying them to
the other.
Network Topology Uploader: We constructed a network topology uploader based on
Weaver et al.’s Cyber-Physical Topology Language (CPTL) [149]. The uploader
takes a JSON file representing a SCADA network from the grid defender and parses
the relevant information, including which devices are connected, which devices need
protection via TIPs, and which devices are eligible to host aTDP.
TDP Placement Tool: Once the TIPs are placed, the generation tool uses the TDP
Placement Tool to determine i) the best places to put TDPs within the network, and
ii) which TIPs to link to those TDPs. The placement algorithmstarts by using a
greedy Set-Cover algorithm [30] to place TDPs near large clusters of TIPs, and then
performs a breadth-first search to link any stray TIPs that were not linked by greedy
Set-Cover.
To evaluate TEDDI, we measured its event detection accuracy, factor graph process-
ing performance, and the amount of time and effort needed to configure TEDDI using its
generation tool. In each case, we found that TEDDI was eithercomparable or better than
current state-of-the-art SCADA protection solutions:
• Our TIP detected the correct event in 99.2% of our test cases, while our TDP achieved
perfect accuracy over 200 rounds of testing.
11
• Our TIPs processed a 99-node factor graph in just under 233µs, while our TDP did
so in just over 143µs.
• Our generation tool allows a grid defender to build an eventsequence directly from a
simple description of the problem, and does not require the extra time or information
that other similar systems do.
Through our evaluations, we definitively demonstrate that TEDDI solves the grid de-
fender’s dilemma:
• TEDDI’s distributed information-gathering and decision-making capabilities allow it
to differentiate between important and non-important tamper events.
• TEDDI’s granular response strategy gives a grid defender the flexibility to craft the
proper response for every event they care about.
• TEDDI’s detection strategy can intercept an attacker earlier in the kill chain [54], and
potentially keep them off the network entirely.
• The TEDDI Generation Tool makes building and configuring TEDDI easy for any
arbitrary SCADA network.
• Our performance measurements indicate that TEDDI can operate efficiently enough
to handle even the strict constraints of the power grid.
1.4 Contributions
We make five contributions in this thesis:
• We introduce and define the grid defender’s dilemma, and show how the grid’s expo-
sure to a wide variety of tamper events, its strict time and resource constraints, and its
12
focus on availability make this a much more challenging problem than dealing with
tamper protection in a traditional IT network.
• We collect and present a set of edge device tamper events based on attacks from both
current literature and real-world examples, and build a taxonomy of tamper event
types from these examples.
• We propose TEDDI, a novel tamper protection system that addresses the above is-
sues and solves the grid defender’s dilemma. TEDDI’s distributed setup allows us
to capture wide-area events and differentiate them from local ones, its response con-
trols ensure defenders can execute the proper response for every event, and its novel
application of factor graphs allow it to operate under the grid’s strict constraints.
• We implemented TEDDI, and through our evaluations we demonstrate that TEDDI
is faster, more accurate, and required fewer resources to run than current state-of-the-
art protection systems. TEDDI’s factor graphs can be processed quickly enough to
stay out of the way of an edge device’s primary task, our eventdecision mechanisms
provide an improved layer of protection against attackers while minimizing false
positives and negatives, and our generation tool allows grid defenders to quickly
and easily configure TEDDI for their networks and capture their intuitions about the
events they are concerned about.
• We demonstrate how TEDDI detects every event in our collection of edge device
tamper scenarios, and show how TEDDI solves the grid defender’s dilemma.
• Finally, we show how existing computer science solutions can be adapted via TEDDI
to solve important problems in power grid systems. Our use oftechniques such as
factor graphs [42], CPTL [149], and the greedy Set-Cover algorithm [30] are critical
to TEDDI’s use and operation, and make TEDDI uniquely suitedto solve the grid
defender’s dilemma.
13
1.5 Thesis Outline
We structure the rest of this thesis as follows: Chapter 2 provides important background
information on edge devices, tamper protection systems, and data fusion algorithms; Chap-
ter 3 offers a taxonomy of tampering attacks, along with someexample tamper scenarios
and a list of common defense techniques; Chapter 4 provides a detailed description of the
grid defender’s dilemma; Chapter 5 discusses the related work in both tamper and intru-
sion protection and why it falls short of solving the dilemma; Chapter 6 describes TEDDI’s
components and how they work together to make decisions; Chapter 7 discusses the TEDDI
Generation Tool and how it simplifies the process of buildinga TEDDI system for grid
defenders; Chapter 8 demonstrates how TEDDI addresses some of the tamper scenarios
from Chapter 3 and solves the grid defender’s dilemma; Chapter9 evaluates TEDDI for its
speed, accuracy, and required resources; and Chapter 10 offers our conclusions and maps
out a direction for future TEDDI research.
All chapters are based partially on my prior publications from SECRYPT [102] and
ICMC [101]. Parts of Chapters 1, 2, and 5 are based on the Autoscopy Jr. work from my
masters thesis [99].
14
Chapter 2
Background
In this chapter, we summarize the overall layout of the powergrid, discuss the types of
devices being introduced to the smart grid, describe some basic concepts about tamper
protection, present a primer on factor graphs and discuss why we chose them over other
fusion algorithms, and briefly mention the XACML origins of our proposed framework.
2.1 The Power Grid: A High-Level Overview
First, we introduce the basic infrastructure of the power grid, and trace how power flows
through it. (We stress that this is a high-level summary withfew details, and point the
reader to other resources, such as Grigsby’s book [46], for more details.)
Generation: This group encompasses the power plants that first generate the electricity.
For the most past, this process involves spinning a large generator using steam from
a turbine, with the power behind the turbine coming from a conventional source such
as coal, natural gas, or a nuclear reactor [20]. Other fuels,ranging from sunlight [86]
to water [20], are also commonly used.
15
Transmission: Once electricity is generated, it is distributed to local electrical networks
via the transmission system. We define transmission systemsby two important crite-
ria:
• Thevoltage levelof electricity passing through the wires. Normally, the voltage
of electricity leaving a power plant is between 15 to 25 kilovolts (kV) [63], but
before entering the transmission system, the power is routed through a trans-
former that steps up the voltage into the hundreds of kilovolts (generally be-
tween 138 and 765 kV) [139]. The reason for this increase is toimprove the
efficiency of the system, as higher voltages reduce the amount of power lost
during delivery [20].1
• Thedistancethat the electricity will travel. The exact distance power can travel
on a single line depends on the voltage involved: “High voltage” lines (100 to
230 kV) have a maximum range of roughly two hundred miles, while “extra-
high voltage” lines (235 to 800 kV) can transport electricity four to five hundred
miles [63].
While high-voltages are more efficient for electricity transmission, they pose a sig-
nificant safety hazard, and are much more expensive to insulate from conductive
materials [143]. Therefore, once electricity gets close toits destination, its voltage is
stepped back down (typically to 10kV or less) as it passes to the distribution side of
the grid [20].
Distribution: The distribution portion of the grid covers the “last mile” between individ-
ual homes/businesses and the transmission system. Electricity enters this portion of
the grid through a distribution substation, which reduces the voltage back down to
safer levels and uses electrical buses to route the power in multiple directions [20].
1Interested readers are encouraged to consult HowStuffWorks [53] for more details on why high voltagesare more efficient.
16
As opposed to the transmission portion of the grid, distribution systems generally
send power between twenty and thirty miles [63].
Once electricity reaches an individual house, it passes though a final transformer that
reduces the voltage down to the 120/240-volt service we expect,2 gets recorded by a
power meter, and eventually reaches the requesting appliance.
What makes the distribution section of the grid so important from TEDDI’s per-
spective is that this section is where we see the vast majority of edge devices being
installed. We take a closer look at these devices and their attributes in the next sec-
tion.
2.2 The Smart Grid: Intelligence at the Endpoints
A number of intelligent electronic devices are being installed as part of the smart grid
movement [99]. Some examples of these devices include:
• Smart electric meters, which allow utilities to collect usage data without having to
send out a technician to read the meter [14].
• Demand response technologies (for example, in-home pricedisplays) that allow con-
sumers to adjust their electricity consumption based on real-time power costs [44].
• Synchrophasors, which give grid operators an up-to-date view of the grid by deliver-
ing precise, timestamped power system data to them [144].
• Digital relays, which use signal processing algorithms todetect electrical faults and
protect important grid equipment [156].
Intelligent electronic devices in the grid are subject to three important constraints:
2Note that this final value can vary from country to country, depending on their standard. Worldstan-dards.eu provides a complete standard list [155].
17
Resource Constraints. The specification and capabilities of these devices can vary
widely depending on their intended purpose, but in general they have fewer resources
than general-purpose computing systems by any measure. Motorola’s ACE3600 Re-
mote Terminal Unit, for example, only boasts a 200 mHz microprocessor, 16 MB of
Flash memory, and 32 MB of DRAM [82].
Time Constraints. While these devices may be resource-constrained, they are still
expected to do their jobs very quickly to accommodate the real-time demands of the
grid. Delivery windows for certain types of data are very tight—for example, system
protection data related to phasor measurement units must bedelivered to its target in
at most 30 ms, and breaker tripping commands used to protect power lines must be
delivered in at most 8 ms [56].
The installation of smarter edge devices (i.e. smart meters, recloser controls) introduces
a third restriction:
Network Constraints. Simply put, “power utilities monitor and control the power grid
through a partially unsecured slow legacy network” [122]. This constraint means
that the devices and programs using this network must be judicious about the data
they send, since they may not have the time or resources to send a lot of information,
and any information they do send inhibits other programs from sending their own
messages.
Despite these constraints, utilities are installing more and more edge devices in their
SCADA networks, with the goal of making their operations moreefficient. While smart
meters [35] and demand response interfaces [44] are the mostwell-known examples, this
set also includes lesser-known devices such as recloser controls [113].
18
a b
c
d e
P(a) P(b)
P(c|a, b)
P(d|c) P(e|c)
Figure 2.1: A Bayesian Network built from the example in Section 2.3.1.
2.3 Data Fusion Algorithms
In order to make event decisions, we need a way to fuse together the data we collect from
our monitors. We selectedfactor graphs[42] as our fusion algorithm, but there are a
number of other algorithms available; we outline a few here,and then discuss the reasons
behind our factor graph choice.
2.3.1 Bayesian Networks (BNs)
A Bayesian network is a probabilistic model that represents dependencies between vari-
ables using a directed acyclic graph [23]. Given a set of variablesS = {s1, s2, . . . , sn}, we
construct a BN graphG = (V,E) as follows:
• For every variablesi, we add a nodevi to V .
• If the chance ofvi occurring is affected byvj, then an edgevj → vi is added toE.
For example, consider the set of Boolean variables{a, b, c, d, e}, where theP (c) is de-
pendent onP (a) andP (b), and bothP (d) andP (e) are dependent onP (c). Our Bayesian
network for this set would look like Figure 2.1, with directed edges froma to c andb to c
indicating thata andb influencec’s value, and similar edges added fromc to d andc to e.
19
BNs are a popular method of modeling variable dependencies, and are seen in a number
of protection systems (for example, [105], [141], [146]). However, they suffer from two
major flaws: they are unable to capture complex dependenciesbetween events due to their
inherent independence assumptions, and adapting them to cover these dependencies can
make these models infeasibly complex [23]. This issue wouldbe a big problem for our
factor graphs, as our indicators have presence, order, and time components that would
all need to be modeled using separate variables. Therefore,BNs lack the flexibility and
simplicity we want for TEDDI.
2.3.2 Markov Random Fields (MRFs)
A Markov Random Field is a probability measure over a graph in which a local attribute of
any vertex is completely determined by the same local attribute of its neighbors [66]. More
formally, if the vertices in a graphG = (V,E) have an attributea, and we defineav as the
attribute value for a vertexv andN(v) as the set ofv’s neighbors inG, then the functionP
is an MRF ifP (av|aV−v) = P (av|aN(v)).
If we reconsider our variable set{a, b, c, d, e} from before, we can build an MRF equiv-
alent to the BN in Figure 2.1. To do so, we define the functionφ(w, x1, x2, . . . , xi) to
represent the conditional probability functionP (w|x1, x2, . . . , xk).3 Figure 2.2 depicts our
final MRF, which has a 3-variable clique to depict the relationship betweena, b, andc, and
2-variable cliques to showc relates to bothd ande.
MRFs offer a useful advantage over BNs by allowing groups of vertices in which each
pair within the group has an edge between them4 to have their behavior defined by a sin-
gle function, avoiding the need to make causal assumptions about variables such as in a
BN [23]. However, because MRFs deal with the maximum-sized cliques, it may not be
3We adopted theφ notation from Frey [42] and Cao et al. [23].4Note that this would be astrongly connected componentin a directed graph; MRF graphs, however, are
undirected.
20
a b
c
d e
ϕ(c, a, b)
ϕ(d, c) ϕ(e, c)
Figure 2.2: A Markov Random Field equivalent to the Bayesian Network from Figure 2.1.
able distinguish group-wide relations from those that onlyinvolve a few of the nodes in the
Binary decision diagrams (BDDs), orbranching programs, are directed acyclic graphs used
to represent complex Boolean functions [4]. Nodes are eitherdesignated as query nodes,
which represent a single Boolean variable and have two outgoing edges representing 0 and
1, or output nodes, which are sink nodes that are labeled 0 or 1[115]. Given an arbitrary
assignment of values for a set of Boolean variables, we can simply traverse the graph based
on the assignment of the variables in each query node until wereach an output node, thereby
giving us the result of the Boolean statement.
These programs can also be optimized asread-once branching programs, where we are
only required to check the value of each variable at most once. Unfortunately, we are unable
to optimize our own graphs into a read-once branching program, as our graph’s indicator
sequence setup (which include both indicator order and the time windows they must appear
in) means that nearly every node in the graph must be treated as a unique variable.
While we can potentially alter a branching program to handle non-binary outputs, cap-
turing complexities beyond whether or not a variable is present is a tricky endeavor, and
would involve creating a new variable to represent relationships like ’DidX occur before
21
Y ?’ While setting up such a program is possible, we would prefera simpler representation
of our indicator sequences.
2.3.4 Custom Algorithms
Some protection systems forgo formal methods altogether, and instead develop their own
custom system to handle event detection. Oftentimes this involves observing known, ac-
cepted behavior and using it as a model to verify future behavior, such as with SCADA-
Hawk’s snapshots [123] and Amilyzer’s flow-matching system[14]. While such techniques
can be effective, they have a high risk of false positives dueto their learning phases, as any
legitimate behavior that does not appear during this phase will be later flagged as suspi-
cious. The cost of avoiding this problem is a prolonged learning period, which is time that
grid defenders may not be able to spend.
2.3.5 Factor Graphs
Formally, a factor graph is a bipartite graph that connects aset of nodesV that repre-
sents system variables with a set of nodesF that represents functions relating these vari-
ables [42]. If a function is dependent on a variable, an edge is added to the graph between
the nodes that represent this variable and function.
If we go back to our simple example from Section 2.3.1, we define a variable node for
each member of our set{a, b, c, d, e}, and then define a function node for each conditional
probability. We then add edges to show which functions relate to which variables—in this
case, we relateP (a) to a, P (b) to b, a andb to P (c|a, b), P (c|a, b) to c, and so forth.5 The
final result is show in Figure 2.3.
The key to a factor graph’s flexibility are the functions represented byF : These func-
5Note that while we use directed factor graphs for TEDDI to better depict the input and output variablesfor function nodes, factor graphs can be either directed or undirected [42].
22
a b
c
d e
P(c|a, b)
P(d|c)P(e|c)
P(a) P(b)
Figure 2.3: A factor graph equivalent to the BN and MRF shown in Figures 2.1 and 2.2,respectively. Variable nodes are shown in white, while function nodes are show in black.
tions can be any “arbitrary factorization of the joint distribution” [42]. This feature allows
factor graphs to model any distribution that can be modeled by a BN or MRF, but do it
using a simpler model, as its functions “can simplify a complex BN or a complex MRF by
reducing the number of functional relations that have to be defined” [23]. (This statement
applies to branching programs as well, as it is trivial to model whether a variable is set to 0
and 1 within a factor graph.)
For example, while Figure 2.3 may seem a bit cluttered compared to its BN and MRF
counterparts, it offers significant benefits for TEDDI, which looks for specific indicator
sequences that denote events:
• Rather than having to define a variable for every single pieceof a relation function
(Is y present? Wasx present beforey? Did y appear too long afterx did?) as we
would be forced to do in a BN, we can represent the entirety ofx andy’s relationship
in a single graph node.
• If a relationship only involvesz variables, we can define a function node that only
involves those variables. This allows us to explicitly depict how variables relate to
one another, rather than obscuring relations between groups of variables as in an
23
MRF.
Therefore, using a factor graph gives us the flexibility to relate our variables in almost
any manner we like. For these reasons, we chose factor graphsas the fusion algorithm for
TEDDI.
Factor graphs have been applied to a number of different fields in the past, including
signal processing [73], robot navigation [57], evaluatingtrust on ad-hoc networks [128],
and even detecting malicious users in a system [23]. To the best of our knowledge, however,
TEDDI is the first system to use factor graphs for physical tamper protection.
2.4 XACML and the Power of Distributed Systems
At a high level, XACML is a specialized XML-based language designed for use in creating
and enforcing access control policies [31]. The goal of XACMLis to provide “a com-
mon language for expressing security policy” [91] to assistcompanies and other groups
in managing the security policies of every system operatingon their network [91]. Of
most importance for our purposes is one of the requirements laid out by version 3.0 of the
XACML standard:
“To provide a method for handling a distributed set ofpolicy components,
while abstracting the method for locating, retrieving and authenticating the
policy components”[91]. (emphasis added by original author)
To that end, the standard borrows a pair of terms from RFC 3198 [152] for its decision
and enforcement entities, and adds a third term to representsources of policy attributes:
“Policy Decision Point (PDP)...A logical entity that makespolicy decisions for
itself or for other network elements that request such decisions” [152].
24
“Policy Enforcement Point (PEP)...A logical entity that enforces policy deci-
sions” [152].
“Policy information point (PIP)...The system entity that acts as a source of
attribute values” [91]. (emphasis added by original author)
For TEDDI, we have co-opted the PDP, PEP, and PIP terminologyand purposes for our
tamper decision/enforcement/information points, which are all discussed in more detail in
Section 6. We made this choice because tamper events may not be distinguishable simply
by looking at the local environment of a single device. For example, a single box shaking
could signal that an attacker is trying to break into a device, but a lot of boxes shaking
simultaneously could signal a larger event such as a earthquake. The responses to these
events would be very different: An active attacker might merit a severe response, while an
earthquake might cause us to suspend our security procedures to allow workers from others
utilities to help repair the damage. Taking a distributed approach to tamper detection,
therefore, helps us to make better, more-accurate event decisions and improve the overall
security and availability of the grid.
2.5 Network Intrusion Protection Systems (NIPS)
Although TEDDI is a tamper protection system, it bears a striking resemblance to a network
intrusion protection system (NIPS). (We discuss this similarity a bit more in Section 6.7, but
the general idea is that packet sequences for a NIPS are analogous to indicator sequences
(Section 6.3) for TEDDI.) Below, we offer a brief descriptionof NIPS in general, and
discuss general attacks and defenses in this space.
NIPS generally work by monitoring traffic as it passes through their network, and ana-
lyzing this traffic to look for suspicious activity [96]. Many of these system use signatures
as their primary detection method, and look for either specific series of packets or specific
25
data within those packets that indicate a potential attack.While a NIPS lacks the device-
level information that a host-based protection system collects, its network-centric setup
allows it to detect “attacks that involve low-level manipulation of the network, and ...easily
correlate attacks against multiple machines on a network” [96].
Some of the common attacks against NIPS are:
Sequence Insertion:A packet is crafted such that the NIPS accepts it, but the target host
does not, disrupting the packet sequence that the NIPS sees and allowing the attack
to go through [96].
Sequence Evasion:A packet is crafted such that the NIPS rejects it, but the target host
accepts it [96]. Evasion can be done in several different ways, depending on the
configuration of the NIPS:
• The attacker can wait out the NIDS [114]. This can be done by fragmenting the
attack packets, and then sending them with just enough time in between each
one so that the NIPS does not reassemble the fragments, but the target host
does.
• The attacker can wait out the targeted host [114]. An attacker can do this by
fragmenting a set of benign packets, sending them to the target host, and waiting
until the host discards them. If the benign fragments are still being monitored
by the NIPS after the host throws them away, the attacker can then send mali-
ciously crafted packet fragments that match those still held by the NIPS, fooling
the NIPS into thinking the packets are harmless. The malicious fragments will
then reach the targeted host, and the attacker can now simplythe remaining
pieces of the malicious packets—the NIPS will think these fragments match
future segments, but the host will combine them and discoverthe malicious
payload.
26
• If a router lives between the NIPS system and the target host, the attacker can
use the time-to-live (TTL) field of the packet to evade detection [114]. Here,
the attacker splits their malicious packet into several fragments, and creates a
benign copy of one of the fragments (with a TTL field set to expire when it
reaches the router between the NIPS and the target. When the attacker sends
their packet fragments (with the benign fragment sent it place of its malicious
twin), the NIPS is fooled into think the packet is not a threat, but the target
receives a incomplete packet set (thanks to the router dropping the benign frag-
ment copy), and waits for the final piece of the packet. The attacker now gra-
ciously provides the remaining malicious fragment, which sneaks past the NIPS
(it thinks the fragment is part of a whole new packet) and completes the packet
set held by the target.
Despite these attacks, NIPS remain very popular among network defenders, and several
mature systems are commercially available (for example, Bro[21] and Snort [121]).
2.6 Autoscopy Jr.
Finally, we offer a few words about the work that preceded TEDDI, Autoscopy Jr. [99],
and how this work eventually inspired the TEDDI project.
Autoscopy Jr. is based on Kprobes [76], a kernel tracing framework built into Linux
that allowed a user to pause execution and inspect the current state of the OS, including
register values and kernel memory contents. For Autoscopy Jr., the goal of this inspection
is to see whether the kernel’s control flow is being altered unexpectedly, i.e. modified by
a rootkit looking to hide important information. The systems accomplishes this task by
examining the return address on the call stack when an important function is called, and
seeing where the current function was called from.
27
Autoscopy Jr. starts in alearning mode, where it monitors the kernel to see what its
various control flows look like under normal operation, and is eventually switched to a
detection modeto check future behavior against its learned model. If the observed return
address of a function leads us to an unexpected location thatdid not appear during our
learning mode, Autoscopy Jr. reports this issue back to the user.
In addition to its avoidance of a virtual machine, AutoscopyJr. also offers aprobe
profiling tool to further avoid overburdening an edge device. The profilingtool allows a
user to measure the amount of system overhead imposed by individual probes, and remove
probes that are interfering with the device’s primary tasks.
The response to Autoscopy Jr. was incredibly positive, and we managed to success-
fully transfer the technology to Schweitzer Engineering Laboratories (SEL) for use in their
own products.6 However, the system falls short when considering the full grid defender’s
dilemma:
• Its host-centered design leaves it unable to detect distributed events happening in the
larger network. (In fact, as an intrusion detection system,it neglects tamper events
entirely.)
• It detects problems, but does not have the ability to respond to them.
• Building a model of allowed behavior via the learning mode may take more time and
resources than a grid defender can spare.
To solve this dilemma, we will need to broaden our scope beyond a single device, and
build a system that can detect and respond to the events we areconcerned about.
6This also established the partnership that eventually led to SEL returning to us several years later withthe tamper problem that led to the creation of TEDDI.
28
Chapter 3
A Taxonomy of Tampering
In this chapter, we discuss the different types of physical tamper attacks that an edge device
may face, and highlight some examples of these attacks foundin the literature and the real
world. Based on the nature of these attacks, we group them in four categories: device
data accesses, device additions, device modifications, anddevice replacements. We also
highlight some of the defense techniques used to detect and prevent tampering.
3.1 Device Data Access
This first category of tampering attacks does not involve altering the device’s operation at
all—rather, the attacker simply tries to access secret information stored on the device for
future use. Some example techniques of this attack include:
• Placing passive probes on the circuitry of a device to record the signals that ap-
pear [151].
• Inserting a hardware Trojan that monitors and transmits the inter-chip communica-
tions of a device [39].
29
• Cutting through the sensor-mesh-encasing potting material that covers sensitive de-
vice components, which can be accomplished using lasers, chemicals, sandblasters,
or even a knife in the hands of a careful individual [151]. (This sort of attack was one
of the prime protection focuses of the IBM 4758 [119].)
• Imprinting data on a memory chip using radiation, low temperatures, or high volt-
ages [151].
Edge devices in the power grid, which could possess secret cryptographic keys for
communication or house sensitive customer demographic andusage information, are prime
targets for these techniques. Based the above techniques, wecan construct the following
tamper attacks:
Simple User Data Heist: An edge device stores a batch of customer power usage data
in a non-volatile memory chip, and periodically sends this data to a utility control
center. To access this data, an attacker performs the following steps:
1. First, the attacker opens the case of the device.
2. Next, they place probes on the output pins of the memory chip.
3. Finally, they read out the data when the device sends it to the utility.
Complex User Data Heist: This is similar to the above attack, except that the data in
question is stored in volatile memory, and the attacker doesnot want to wait around
for the device to send it to the utility. To obtain the data, the attacker uses an imprint-
ing attack as described by Weingart [151]:
1. The attacker starts by bombarding the device with X-rays (or other suitable
radiation), permanently burning the data into the chip.
2. The attacker then cracks open the device’s case to access the memory chip.
30
3. Rather than probing the chip, the attacker simply removes (and potentially re-
places) it
Device Credential Heist:An edge device stores its encryption key in a memory location
that is physically secured by a sensor mesh encased in a special potting material,
just as in the IBM 4758 [119]. To gain access to the key, an attacker must do the
following:
1. Pry open the case of the device.
2. Find a way through the mesh surrounding the key storage memory.
3. Probe the chip to extract the key material.
3.2 Device Additions
The second category of tampering attacks involve maliciousadditions to the device that
make it behave in unexpected ways. Here, we highlight two specific tamper attacks:
Pin-In-The-Meter Attack [132]: In 2010, an outlet reported that one consumer stopped
their (mechanical) meter in the following way:
1. They drilled a hole in the bottom of the device.
2. They stuck a pin through the hole, which kept the wheel inside the meter from
spinning.
Maintenance Mode Attack [33]: After two months of receiving anomalous readings
from some of its meters, a Brazilian utility discovered that their devices had been
victims of a sophisticated tampering scheme:
1. The attackers had first opened the device and broken a tamper-evident seal un-
derneath it.
31
2. Next, they installed a microcontroller attached to an RF receiver inside the me-
ters, allowing them to remotely send signals to the meters and switch them into
a special mode that “disconnects the meter without interrupting the electricity
flow to the consumer” [33].
3. Finally, the attackers made a convincing replica of the tamper-evident seal on
the device, making it appear as if the meters had not been altered.
What makes the maintenance mode attack even more interestingis that legitimate
technicians go through the same process (minus the additional hardware) when per-
forming regular maintenance—in fact, this is what the special mode was intended
for in the first place! Defending against this attack, therefore, may require additional
information than just the attack steps.
3.3 Device Modifications
Our next group of attacks, and perhaps the most common one, isthe actual modification
of the software and/or hardware of an edge device to bend it tothe attacker’s will. Some
examples in this space include:
• Unauthorized alteration to a meter’s firmware, causing it (and in a worst-case sce-
nario, many others simultaneously) to disconnect from the grid [14].
• The Ukraine power grid cyber attack, in which attackers loaded malicious firmware
onto the utility’s serial-to-Ethernet converters, deleted the master boot records of
workstations to render them inoperable, and even reconfigured one of the utility’s
backup power supplies to cause it to disconnect soon after the attack began [70].
• The Maroochy Water Services attack, where a rogue ex-employee disabled alarm
32
systems and generally altered the system “so that whatever function should have oc-
curred at affected pumping stations did not occur or occurred in a different way” [3].
• The Stuxnet worm, which modified the code on programmable logic controllers to
sabotage the centrifuges they were running, and which featured infected USB sticks
as one of its delivery methods [40].
While many of these are software modifications, and thereforeoutside of TEDDI’s
scope, our goal is to detect when the attacker has physicallyaccessed the box,beforethey
have the chance to modify the device’s software. We highlight two potential physical tam-
pering scenarios:
Malicious USB Firmware Update: In this scenario, a malicious third party with legiti-
mate credentials (such as a contractor hired by the utility)takes the following steps:
1. They access a cabinet-enclosed edge device using a key.
2. They open the cabinet and remove the plugs blocking the device’s USB port(s).
3. Finally, they plug in an infected USB device intended to upload a malicious
firmware update. (What the update actually does to exploit thesystem is less
important, as it is the exploit delivery process that TEDDI focuses on.)
Once again, we note that this event has a benign counterpart in which a utility tech-
nician uploads a legitimate software update to the system, which means that we need
to verify whether or not a firmware modification is expected ornot.
Return-To-Debug Attack: This scenario is based on Weingart’s description of how ion
beams can be used as a tampering tool [151]. The attack is as follows:
1. The attacker removes the cover of an edge device.
33
2. Using an ion beam, the attacker alters the circuitry in thedevice by connecting
the debug pins on the device’s circuit board, granting the attacker access to key
storage locations on the device.
From here, the attacker can access sensitive data on the device, and potentially mod-
ify this data to cause to malfunction or misreport its state.
3.4 Device Replacements
Finally, we consider the fourth category of tampering attacks, where an edge device is
removed from the network and is either replaced by a malicious device or removed to be
used and/or modified for malicious actions at a later date. Wedefine the following scenario
for this category:
The Schweitzer Scenario:This scenario is the one that originally inspired the TEDDI
project. In the summer of 2013, while I was interning at Schweitzer Engineering
Laboratories (SEL) for the summer, one of the group’s leaders came to us with a
troubling scenario involving the vandalizing of some of their edge devices. The at-
tackers went through the following steps:
1. They used a tool (either a crowbar or hammer) to break the lock off of the
cabinet containing a device.
2. They opened the cabinet using the newly-unlocked door andproceeded to van-
dalize the device, although we received no details as to how the devices were
manipulated.
While this attack was more of an annoyance than a major problem, members of the
Schweitzer product team worried what might have happened had the attackers taken
one more step:
34
4. Disconnecting the edge device from its network access point, and connecting
the attacker’s own device (for example, a laptop pre-loadedwith exploits to use
against other devices) in its place.
Given the structure of some SCADA networks, this fourth step could allow attackers
to reach deeper into the network to attack higher-value targets.
The Sensor Subversion Scenario:This scenario is a slight variation of the Schweitzer
Scenario, in which an attacker knows that the above sequenceis being used to protect
a device. To subvert this sequence and access the edge device, the attacker attempts
the following:
1. The attacker starts by drilling a small hole in the cabinetcontaining the edge
device.
2. Next, the attacker inserts a tube into the hole and squirtsglue onto the cover
switch [117], causing it to seize up and not move when the cabinet door is
opened.1
3. The attacker then proceeds as they would in the Schweitzerscenario, opening
the cabinet and unplugging the edge device.
There are more ways that an attacker could get into the cabinet—for example, they
could cut a hole through the side with a torch, and bypass the cover altogether—but the
overall event structure is similar to the two described above, so we do not discuss it here.
Additionally, tamper events involving device thefts can also be considered, with the differ-
ence being that the device is unplugged, but not replaced.
1While this possibility was not brought up by our Schweitzer contacts (and thus was not included in theSchweitzer Scenario), we discuss it here to illustrate the wide variety of tamper scenarios the grid faces.
35
3.5 Non-Malicious Tampering
The four types of tampering we discussed so far were cases of malicious tampering. While
we mentioned that a few malicious attacks have benign counterparts (such as firmware up-
dating), the grid faces a large number of non-malicious tamper events that affect its avail-
ability. (In fact, there has been some debate over whether squirrels actually pose a bigger
threat to the grid than hackers [92], and trees have played a role in a substantial number of
blackouts, such as a large 2003 blackout in Italy [12] and an August 1996 blackout on the
U.S. West Coast [50].) To cover the realm of accidents, mistakes, and natural disasters, we
present the following examples of non-malicious tampering:
The Taum Sauk Reservoir Overflow[62]: We examine a structural failure at the Taum
Sauk hydroelectric facility, where water is pumped from a lower reservoir into an
upper one during periods of low electricity demand, and released back into the lower
reservoir to spin turbines and generate electricity duringpeak demand periods [80].
In December of 2005, the facility’s water pumping system overfilled the upper reser-
voir, causing that reservoir’s dam to fail and dump the reservoir’s contents onto the
surrounding countryside [62]. From the post-failure investigation report, we see that
the problem stemmed from the pressure transducers that wereused to measure the
dam’s water level:
1. Some of the pipes covering and protecting those transducers had broken free
and moved from their initial positions.
2. The movement of the transducers caused them to report water levels lower than
the true level of the reservoir.
3. The errant water level values misled the pump system into overfilling the reser-
voir.
36
Earthquakes: Natural disasters are interesting events to investigate because they are of-
ten wide-spread events, and thus require information from anumber of distributed
sources to detect. As an example, consider the following earthquake scenario:
1. When an earthquake strikes, each individual edge device inthe area experiences
severe shaking at roughly the same time.
2. Each device must then gather information from others around it to confirm that
the event is wide-spread, and not an isolated local incident. The latter scenario
may indicate that a malicious tamper event is beginning, while the former leads
us to conclude that an active attacker is not involved (and furthermore, we may
want to initiate a utility’s disaster response protocol to prepare for potential
damage/outages).
3.6 Tamper Protections
People have been trying to keep malicious actors from tampering with important data for
centuries, as demonstrated by the ancient practice of usinghot wax and signet rings to both
seal and authenticate documents [22]. This problem carriessignificant weight in the digital
world, as many important identity assertions, such a digital certificates, rely on the ability
of a party to keep sensitive data secret. Thus, we must store such data in a place with
sufficient tamper protections to keep adversaries from accessing or altering it.
However, the term “tamper protection” is rather vague, and can mean different things
to different people. Smith and Marchesini summarize the thinking in this space:
• “ Tamper resistance:It should be hard to penetrate the [tamper protec-
tion] module.
• Tamper evidence:Penetration attempts should leave some visible signal.
37
• Tamper detection:The device itself should notice penetration attempts.
• Tamper response:The device itself should be able to take appropriate
countermeasures when penetration is detected”[117].
Existing tamper protection schemes fall into one (or more) of these four categories.
The race between the developers of these schemes and the attackers who try to defeat
these schemes has become a cat-and-mouse game, and technologists have developed a
number of sophisticated attack and defense mechanisms overthe years. Weingart offers a
comprehensive summary of these tactics [151]; we highlightsome of his defense categories
below:
Barriers: Materials that need to be penetrated to reach the inner logicof edge devices.
Examples range from conventional materials (such as metal and brick) to special
coatings that protect chips on a circuit from probing.
Sensors:Monitors that look for environmental phenomena that indicate a potential attack.
Examples include voltage sensors, temperature sensors, probe sensors, radiation sen-
sors, accelerometers, and meshes of wire sensors wrapped around a device.
Seals/Switches:Mechanisms that leave evidence when tampering occurs. Thiscategory
not only covers tamper-evident solutions like paints, labels, and packaging, but also
microswitches that can detect vibrations or small movements.
Data Destruction Methods: Methods of destroying data such that the adversary can-
not recover it, such as overwriting data on RAM chips or physically destroying the
memory and/or device.
In recent years, even policymakers have waded into the tamper protection field. In
1994, the National Institute of Standards and Technology (NIST) released Federal Infor-
mation Processing Standards Publication 140-1 (FIPS PUB 140-1) [134] to provide a stan-
dard for cryptographic modules that could be used by the United States government. These
38
guidelines were updated in 2001 by FIPS PUB 140-2 [135], which is the most recent of-
ficial version of the standard (although draft versions of FIPS PUB 140-3 [136] have been
released).
The FIPS standards outline four security certification levels that modules can obtain
based on the amount of protection they provided, with one being the lowest and four being
the highest, and listed the features that modules needed to reach each level:
• Level 1 provides no special guidance for physical securitybeyond mandating the use
of “production grade equipment” [135].
• Level 2 requires either tamper-resistant or tamper-evident controls on the module,
such as “tamper-evident coatings or seals or...pick-resistant locks” [135].
• Level 3 adds tamper detection and response controls to the list, mandating that the
mechanisms used “have a high probability of detecting and responding to attempts at
physical use, access, or modification” [135].
• Finally, Level 4 adds environmental testing requirementsto ensure a module is not
compromised by operating outside its specified voltage and temperature ranges, and
demands that the provided detection and response controls “provide a complete en-
velope of protection around the cryptographic module” [135].
Obtaining Level-4 certification is extremely difficult: According to NIST, only twelve
such certifications has ever been awarded, and only two have been awarded since 2003 [83].
An example of such a module is the IBM 4758 [119, 120], which wasthe first ever module
to obtain Level 4 certification under these guidelines. The 4758 design included a grid
of conductors wrapped around the device to detect physical tampering of the device, a
set of temperature sensors to ensure the device remained within its operational limits, and
a series of hardware “ratchet” locks that restrict softwareaccess to important data once
the ratchet reaches a certain level [118]. The design has held up remarkably well over
39
time; attacks against the 4758, such as Clayton and Bond’s attack on IBM’s Common
Cryptographic Architecture [28], focus on flaws in the applications running on the 4758
rather than the hardware itself. To the best of our knowledge, there are no known successful
attacks against the device’s physical and software configuration security. IBM has produced
several iterations of its cryptographic coprocessor sincethe debut of the 4758; the current
model on the market is the 4765 [55].
40
Chapter 4
The Grid Defender’s Dilemma
With all the time and effort spent on tamper protection research in the past, why have
current solutions not found their way into the power grid? Webelieve the issue lies with
the uniqueness of the grid environment and the sheer diversity of scenarios and threats the
grid must take into account, giving rise to a problem we call thegrid defender’s dilemma. In
this chapter, we describe in detail the issues that underly the dilemma, and list the reasons
that current protection solutions cannot fully address it.
4.1 What Is The Dilemma?
Fundamentally, the grid defender’s dilemma boils down to the tension between the integrity
and the availability of the grid’s SCADA network—more specifically, the struggle between
keeping attackers off the network and keeping the lights on.We give a more detailed
explanation below:
• First, grid SCADA networks are open to attacks that could have severe, long-lasting
consequences. For example, an attacker could cause a widespread, long-lasting
power outage by taking down critical substations during a period of high demand
41
on the grid [116]. Protecting against these types of attacks, therefore, is an absolute
necessity.
• However, edge devices within the grid have to deal with a number of different types
of tampering, not all of which are malicious or even involve an active adversary.
Some examples include:
Technician Visits. Broken and malfunctioning devices are a fact of life in the
power industry, and utilities often have to send technicians out to their remote
sites to “tamper” (update, repair, replace, etc.) with their equipment.
Natural Disasters and Weather Events. Earthquakes, hurricanes, and other such
disasters often wreak havoc on a utility’s infrastructure,and may damage or
destroy their edge devices.
• For standard IT networks, administrators err on the side ofintegrity, as the conse-
quences of a network breach are far more significant than a network outage, and thus
most tamper protection systems are geared towards this order of priorities. In the
power grid, however, these priorities are inverted: Availability is the top priority, as
the critical nature of these networks dictates that they need to be up and running as
much as possible, even in the face of malicious attacks.
• This focus on availability places a huge burden on both griddefenders and any pro-
tection solutions they use, because:
– Selecting the proper response to a tamper event affecting the grid is absolutely
critical. Under-responding to a malicious event leaves thegrid open to a major
attack, but over-responding to a benign event could lead to unnecessary techni-
cian visits, device replacements, and service outages. Thecost of unnecessary
responses can be staggering: TekTrakker estimated that sending a technician on
a single trip to a field site would cost a utility an average of over $400 [126],
42
and a study of Pacific Gas and Electric’s customers found thata 4-hour power
outage would cost a small/medium-sized business nearly $5,000, while a large
business would lose over half a million dollars [109].
– Correctly identifying a tamper event that is affecting the grid becomes important
as well, since defenders have little chance of choosing the correct response if
they do not know what event they are dealing with. This also means we must
be specific in our identification; just reporting that “a device is being tampered
with” is not enough.
– The real-time nature of the grid means responses may need to be selected and
executed quickly, so there may not be time to query a human forinput. In
these cases, the system should be able to select the proper response and enact
it quickly without outside intervention. Ideally, an eventwould be detected and
responded to early enough that if a malicious attacker is present, he or she does
not gain access to the SCADA network at all.
• Finally, grid defenders are busy people, and while they mayhave a rough idea of the
threats they face and the events they want to detect, they maynot have the time or
resources to build and configure a complex protection system.
4.2 Why Haven’t We Solved The Dilemma?
Despite the large amount of research in tamper protection, current state-of-the-art solutions
suffer from several problems that keep them from solving this dilemma:
Lack of Context Awareness:Current protection systems lack the power and/or context to
differentiate between important events. A large number of tamper protection systems
are focused on protecting data on a single host, and thus failto account for a large
class of tamper events simply because they do not gather the appropriate contextual
43
information. For power grid networks, however, being able to detect these events is
vitally important, as it may make the difference between distinguishing a malicious
event from a non-malicious one. If an edge device is shaking,is it because of an ac-
tive adversary, a natural disaster like an earthquake, or isit just sensor noise generated
by a vibrating appliance or a passing car? If an edge device’scabinet is breached,
is the perpetrator an attacker trying to exploit the device,a utility technician trying
to fix the device, or a colony of bees just looking to build a hive? Most protection
systems simply do not collect enough information to answer these questions.
Lack of Tampering Awareness: Current protection systems treat any sort of tampering
as malicious. Part of the response to the above points is to simply declare any sort
of tampering as malicious, and respond accordingly. The problem, however, is that
these lone responses serve as “catch-alls” for whatever tamper event they detect, so
they are naturally geared towards covering worst-case scenarios like malicious at-
tacks. The grid’s focus on availability and the presence of non-malicious tamper
events, however, makes this approach infeasible, because astrong response will be
overkill for most situations, and may end up doing more harm than good. For exam-
ple, reacting to a service technician as if they were an attacker could lead to added
costs and decreased system availability, while a severe tamper reaction to a natural
disaster could slow down recovery efforts unnecessarily.
Additionally, certain responses are ruled out by the grid defender’s dilemma, regard-
less of the severity of the event. For example, the IBM 4765 “zeroizes its critical
keys, destroys its certification, and is rendered permanently inoperable” [55]. Such
a response makes reducing the grid’s availability easy: Simply poke and prod the
device until it destroys itself!
Lack of Response Granularity: Current protection systems have either no response or a
single response. Sadly, system with single catch-all responses are better positioned
44
than the majority of tramper protections systems, which have no response mechanism
at all and thus are left wide open to a malicious attacker.
Lack of Timeliness: Current protection systems are reactionary—that is, they are reliant
on looking for activity that indicates a malicious actor is on the network, at which
point the actor is already putting their attack plan into effect. Given the importance
of grid SCADA networks, operators would prefer to stop the attack earlier in the “kill
chain” [54] and try to keep malicious actors off their network completely. While it is
impossible to accomplish this goal 100% of the time, an earlier response could still
limit the amount of damage an attacker can do.
Lack of Appropriateness: By “appropriateness,” we mean the ability of a solution to do
its job without interfering with the edge device’s primary tasks, and current protec-
tion systems cannot adhere to the grid’s inherent performance constraints. Exceeding
the time and resource constraints from Section 2.2 means keeping a power edge de-
vice from doing its job, which is exactly the situation we want to prevent. Systems
designed for a traditional IT setting are simply not equipped to meet these demands.
Lack of Automation: Current protection systems require a lot of manual configuration.
For example, the Response and Recovery Engine [161] requires that the operator
construct a full attack response tree (ART), complete with every potential step taken
by an attacker and the responses that correspond to each step, for each security goal
they want to maintain, while SCADA-Hawk [123] must run for a prolonged period
to collect data and capture the behavior snapshots it needs for anomaly detection.
Grid defenders, however, have neither the time nor the expertise to build these sorts
of systems.
These problems open the door for a different type of tamper solution, one that is flexible
and accurate enough to handle different types of tamper events, powerful enough to enact
45
the proper responses to these events, and simple enough to capture an operator’s intuition
about the problem without placing an undue burden on him or her.
46
Chapter 5
Related Work
In this section, we discuss some of the literature on tamper protection schemes, and how
they differ from our TEDDI proposal.
5.1 Tampering vs. Intruding
Before we begin, we need to address the similarities between tamper detection and its
closely-related cousinintrusion detection. Both fields have received extensive attention
over the years, and occasionally the question of what constitutes a tamper detection sys-
tem or an intrusion detection system (IDS) is just how the systems are labeled. (A good
example of this is SCADA-Hawk [123], which operates much likean anomaly-based IDS
despite being labeled as a tamper detection program.) While we consider work from both
disciplines as relevant to our own research, we differentiate the fields as follows:
• Tamper protection focuses on preventing both unauthorized physicalaccess to a de-
vice and unauthorized changes to a device’sstructure. For example, a system that
prevents malicious actors from changing a line of code through the device’s local
interface or modifying the internal circuitry of a device would be a tamper protection
47
system.
• Intrusion protection focuses on preventing both unauthorized networkaccess to a
device and unauthorized changes to a device’sbehavior.For example, a system that
prevented attackers from remotely exploiting a device vulnerability or feeding the
device bad data or operational parameters would be an intrusion protection system.
We can break these fields down further into five major categories, as shown in Fig-
ure 5.1:
Software Tamper Protection: Programs that prevent unauthorized access/changes to a
device’s software.
Hardware Tamper Protection: Programs that prevent unauthorized access/changes to
a device’s hardware.
Signature-Based Intrusion Protection: Programs that protect against known examples
of bad behavior that are taken either by or against a device.
Anomaly-Based Intrusion Protection: Programs that protect against devices that devi-
ate from a known or learned set of “normal” behaviors.
Hybrid Intrusion Protection: Programs that can use both signature- and anomaly-based
techniques to protect devices.
By these definitions, TEDDI falls into the Hardware Tamper Protection category. How-
ever, TEDDI also shares a striking number of characteristics with a signature-based intru-
sion protection system, which we discussed previously in Section 2.5.
In addition to the categories above, there are also some defense types that do not fit
nicely into any of them; we discuss some of these in Section 5.7.
48
Intrusion
Protection
Signature-Based
Protections
Anomaly-Based
Protections
Hybrid Intrusion
Protections
Tamper
Protection
Software
Protections
Hardware
Protections
Cyber
Physical
Figure 5.1: A taxonomy for prior work in both tamper and intrusion detection. Note thattamper protections are split between cyber and physical attacks, while intrusion detectionsystems focus primarily on the cyber domain.
5.2 Software Tamper Protections
Software tamper detection receives a lot of attention in conjunction with digital rights man-
agement, and a number of tools have been released (such as packers like UPX [140]) to
make software harder to understand and thus harder to modify. Obfuscation, or altering
a piece of code to make it harder to understand and/or reverseengineer, has also received
considerable attention in the academic world: Neves and Araujo integrate techniques like
overloading directly into a C++ compiler to allow it to obfuscate compiled code automat-
ically [85], while Collberg et al. take a more dynamic approach by constantly changing
the arrangement of code on the client, exhausting the attacker’s ability to adapt and keep
pace [29]. Anckaert, Sutter, and De Bosschere take this approach to the extreme by mak-
ing every particular copy of a program unique, including updates, and ensuring that other
modified copies of the program are not usable [8]. (While this defense is primarily geared
towards software piracy, this would hinder malicious, security-specific tampering as well,
as each individual copy of the software would need to be tampered with in a different way
to achieve the attacker’s malicious goal.) Finally, Okhravi, Riordan, and Carter cross over
into the hardware tamper protection realm by evaluating theeffectiveness of changing the
hardware and/or operating system behavior on the fly, and determining where the benefits
49
of dynamic changes lie [90].
Another popular method of tamper detection is self-verification, where a program runs
through a series of tests to determine if its code has been modified inappropriately. Of-
ten this process is accomplished through checksums, where amessage (or piece of code,
in this case) is run through a hash function to create a special value that is hard to du-
plicate with a different (i.e., erroneous or maliciously-crafted) input [117]. For example,
Giffin, Christodorescu, and Kruger use self-checksumming, augmented with a special self-
modifying-code mechanism, to detect and defeat code modification attacks [43], while
Tsang, Lee, and Pun take a checksum-like approach by placing“protectors” at various
points in the code and taking an appropriate response (whichcan vary by protector) if the
code has been changed [131]. Chang and Atallah use a set of “guards” embedded in the
code to perform certain security tasks, such as checksumming or code repair, that increase
the difficulty of modifying the code without authorization [25]. All of these techniques
increase the difficulty of tampering with protected programs, as an attacker is forced to
create a tampered version of the code that accomplishes their evil task while also matching
the original checksum value, an almost-impossible task if the checksum is created using a
cryptographic hash function [117].
5.3 Hardware Tamper Protections
Hardware tamper protections are what most people think about when they consider “clas-
sic” tamper protections. The roots of this area of research run deep, and includes semi-
nal works such as Kent’s ideas fortamper-resistant modules[65], White and Comerford’s
ABYSSplatform [153], White et al.’s work on theCitadel system [154], Tygar and Yee’s
Dyadplatform [133], and Smith, Palmer, and Weingart’s work on the IBM 4758[119, 120].
Today, a number of hardware solutions are available commercially, either in the form of
trusted platform modules ([9, 51, 58]) or cryptographic coprocessors [55]. However, these
50
solutions are geared towards single-device protection, and may have trouble operating in
the extreme conditions power devices must face (for example, the IBM 4765 is only de-
signed to run within a temperature range of 10 to 35 degrees Centigrade, and treats any
temperature outside that range as a potential attack [55], while the SEL-651R recloser con-
trol must be able to run within a temperature range of -40 to 55degrees Centigrade [110].
In recent academic work, Dragone uses several layers of “patches” connected by a
wire mesh and laid out in a random pattern such that anyone attempting to drill through the
material could not avoid hitting a patch and triggering a response [37], while Megalingam et
al. discuss connecting a smart meter’s power supply to the screws that hold its case together,
rendering the meter useless if anyone tries to open the case and access its internals [78].
Desai, on the other hand, takes an obfuscation approach by adding extra dummy states to
a chip’s finite state machine, and only transitioning to the true functional states if a special
code-word is provided to the chip [36].
Physically unclonable functions (PUFs) have also receiveda lot of attention as a pro-
tection technique, as they can verify the integrity of a device or piece of code in a way
that is difficult for an attacker to replicate. For example, if a user produces a message
authentication code (MAC) for a piece of software using the output of a PUF as a key, if
an attacker wishes to tamper with the software, he or she is forced to either replicate the
PUF’s secret or find a key/malicious code pair that produces the same MAC, neither of
which is an easy task. Much of the work in this space focuses onimproving PUFs them-
selves, such as Niewenhuis et al.’s work on using scan chainsas a low-cost PUF [88], Maiti
and Schaumont’s proposal to improve the quality of ring-oscillator-based PUFs [75], and
Ruhrmair and van Dijk’s analysis (and critique) of “Strong PUF” proposals [107]. Other
work highlights the many ways PUFs can be used for security, including Bolotnyy and
Robins’s research on using PUFs to improve the security of RFIDsystems [19] and Suh,
O’Donnell, and Devadas’s processor architecture that combines PUFs with several off-chip
memory protections to provide a private and secure execution environment [125].
51
Finally, hardware Trojans can been viewed as a tamper protection scheme with the tra-
ditional roles reversed, as now the attacker is the one trying to protect device hardware (or at
least their malicious addition) from being circumvented bydefenders. Here, both sides are
on the lookout for tampering, with attackers trying to protect the sanctity of their additions
and defenders looking for ways to verify that the hardware they receive is the hardware
they expect, so analyzing both sides can provide some insight into tamper protection and
detection. On the offensive side, malicious actors use a number of techniques to avoid be-
ing discovered, such as use rare or distributed trigger conditions to avoid exposure during
testing [16]. Meanwhile, on the defensive side, some recentprotection schemes include fin-
gerprinting chip designs using path delays [60], insertingdummy flip-flops to circumvent
triggering mechanisms [108], using linear programming to examine the physical properties
of logic gates and detect the presence of extra circuits [95], using capacitor behavior as
a detection mechanism [39], and combining a number of known detection techniques to
reduce the chance of a Trojan hiding and activating [16].
5.4 Signature-Based Intrusion Protections
Signature-based detection methods have taken a lot of heat in recent years, as they provide
little protection against new and novel attacks, or even older attacks that have undergone
small changes [129]. Nevertheless, the topic remains an active area of research. Litty,
Lagar-Cavilla, and Lie’sPatagonixsystem studies the behavior of a system’s hardware to
identify programs that are running (and which may be hidden from the operating system)
and verify the programs against a trusted set of binary hashes [72]. Jiang, Wang, and Xu’s
VMWatcherreconstructs the workings of a potentially-compromised OSfrom the safety
of a virtual machine, allowing an antivirus program or otherprotection device to analyze
the untrusted OS without fear of being compromised [59]. However, as pointed out in my
prior intrusion detection work [99], both of these programsare based on the use of a virtual
52
machine, which is not feasible for use on resource-constrained embedded systems.
Azab et al.’sTrustZone-based Real-time Kernel Protection system (TZ-RKP) makes use
of ARM’s secure TrustZone environment to build a system that is isolated from untrusted
programs yet still able to effectively protect the kernel from a malicious attacker [10]. From
within TrustZone, TZ-KRP can evaluate the impact of running specific pieces of code on
the system and block them from harming the system if necessary, while also restricting
user processes from accessing kernel memory directly. However, strict enforcement of
these rules may cause problems with legacy programs that rely on this functionality, and its
host-centric design may have trouble gathering information on regional events.
Grochocki et al. study a number of potential grid attacks anddetermine the optimal in-
trusion detection system to combat them: A centralized intrusion detection system coupled
with sensors embedded in the remote devices [47]. While this approach is very similar to
our own proposal, the sensors in this case are focused on internal values such as “health
reports, firmware and software integrity, and memory contents” [47], rather than the state
of the device’s physical environment.
Zhao, He, and Yao’sFilter driver and Proxy based Website Anti-tamper System (FP-
WAS)system applies a distributed approach to the problem of protecting websites, using a
file monitoring system and a set of web proxies to protect against a set of known website
attacks [159]. While the proposal is labeled as a tamper protection system, its behavior
more closely resembles an IDS looking for known bad behavior—for example, scanning
files on the server for illegal modifications. However, giventhe number of additional proxy
servers required by the system, deploying this system wouldbe a costly proposition.
Zonouz et al.’sSecurity-Oriented Cyber-Physical State Estimation (SCPSE)system
combines intrusion detection alerts with power system information to more accurately es-
timate the security state of an electrical network [162]. SCPSE builds an attack graph that
traces the possible paths an attacker could follow via exploiting network nodes, and deter-
53
mines how power information in the system should be correlated to devices in the network.
In its monitoring mode, SCPSE uses power flow information and intrusion alerts to esti-
mate the attacker’s path through the graph, and thus reveal which devices in the network
are potentially compromised. Despite its increased awareness, however, this system still
ignores external environmental factors that might affect the network’s security state, and
does not incorporate possible responses into its design.
Roblee, Berk, and Cybenko’sProcess Query Systems (PQS)combine host and network
monitoring to determine which nodes in a network might be compromised [105]. Process
sensors at the host level report information back to PQS’s fusion engine, which uses con-
ditional probabilities to relate events to one of its attack/failure models. While the system
focuses on bad behavior within devices and their network, the system could potentially be
configured to handle environmental events as well. However,trying to track a large number
of behavior models may produce a prohibitive amount of overhead on an edge device in the
grid.
Wang and Hauser’sevidence-based trust assessment (EBTA) frameworktries to eval-
uate the trust they can place in a device based on the evidencethey collect [146]. The
authors collect a series of data vectors within a small time window, define a loss function
that captures the consequences of taking an actiona when the device’s trust level ist, and
finally use a parameterized risk function to decide whether the device is trustworthy. How-
ever, the program suffers from the weakness of its Bayesian basis, and only makes a binary
trust decision, which is not granular enough to extend to intrusion response (and such an
extension would make the system too unwieldy and complex to use, as it would need to
make a separate trust decision for each tamper event we care about).
Cheetancheri et al. propose a coordination system for local detection programs targeted
at detecting worm outbreaks within a network [26]. When a device receives an alert from
its local IDS, it sends a message tom randomly-selected other devices in the network. If
54
a recipient has also received an alert from its own IDS, it combines the message with its
own data and forwards the message to anotherm randomly-selected nodes. If a message
chain is forwarded enough times (i.e., enough devices are reporting an intrusion), a global
outbreak message it sent to all of the devices. The major issue with this approach is that
large portions remained ill-defined: What responses (if any)are taken in response to the
global warning? How does the IDS this system relies on detectworm attacks?1 Without
more clarity, its applicability to the grid defender’s dilemma is unclear.
Valdes and Skinner’sProbabilistic Alert Correlation (PAC) systemuses Bayesian-based
data fusion as a way to reduce false positives within an intrusion detection system [141].
The system maintains a list ofmeta alertsthat might represent an attack, and adds individ-
ual alerts to a meta alert if the system thinks they are similar. The system also maintains a
minimum similarity threshold and a priority field within themeta alert, all with the goal of
showing the administrator only the issues that are most likely to be security violations. The
similarity metric, however, can become cumbersome as the number of meta alerts and alert
features grow, and attack class similarity is evaluated viaa static matrix that would require
updating as different threats emerge.
TheResponse and Recovery Engine (RRE)takes the concept of attack signatures a step
farther than most systems: Instead of simple signatures, the RRE usesattack response trees
(ARTs) to define the security goals it wants to maintain, the various ways these goals might
be violated, and the possible responses that could be taken to maintain those goals [161]. As
intrusion alerts come in, the system determines which nodesin the tree have been reached,
which represents what the attacker has achieved thus far. The trees are converted to Markov
decision processes, which are then solved to determine the optimal action to take against
the attacker. The RRE also has local and global components, which allow it to monitor
both the state of individual boxes and the overall state of the network. While the RRE1We assume that this is based on a signature-based IDS, as pairing it with an anomaly-based IDS would
cause problems with making sure every device saw the same anomaly.
55
is arguably the system that most closely resembles TEDDI within the current literature,
however, it currently does not consider external events such as environmental factors, and
the response trees have to be complete enough to cover the entire attack space that the
administrator is concerned about.
5.5 Anomaly-Based Intrusion Protections
Another popular method of intrusion detection involves verifying device actions against a
pre-defined or learned model of system behavior, and raisingan alarm when the system
deviates from its model. There are two common flavors of this type of system:
Specification-Based Intrusion Detection: The model of system behavior is derived
from a known specification or protocol. Specification-basedsystems have become
very popular for SCADA network protection, as SCADA networks are fairly static
and tend to exhibit predictable behavior that rarely changes [27]. In most cases,
the restrictions focus on the allowed behavior of the protocols spoken by SCADA
In this chapter, we describe the general architecture of TEDDI, and explain each component
of the system in detail. We also describe the TEDDI Generation Tool, which we use to
create TEDDI systems for arbitrary SCADA networks.
6.1 Problem Assumptions and Attacker Model
Before we get into the details of TEDDI, we first state our assumptions about the problem:
• We assume that the SCADA network is always available, and that packets always
reach their intended destinations. Given that utilities require reliable SCADA net-
works to properly manage and maintain their infrastructure(and any disruption in
this service would draw the utility’s attention), this assumption appears to be reason-
able.
• We assume that the sensors used by TEDDI always report the correct values, and
are immune to malfunctioning or manipulation. We believe this is a reasonable as-
sumption because the same physical (i.e., the cabinet or device exterior) would be
protecting the sensors as well as the edge device. (We note that our Sensor Sub-
65
version Scenario from Section 3.4 violates this assumption, but point out that the
attacker still has to penetrate the boundary to compromise the cover switch.)
• TEDDI makes one assumption about the topology of the underlying network: There
is at least one node present that does not require protectionand is able to support a
tamper decision point (TDP, Section 6.5). (If the utility has several disconnected net-
works to maintain, each network requires at least one TDP-eligible node.) Otherwise,
TEDDI can operate on any arbitrary SCADA network with minimalconfiguration.
• We assume that all of our tamper information points (TIP, Section 6.4) are equipped
with equivalent sensor sets, and are synchronized to take their sensor snapshot at
roughly the same time. While the system will still operate without the latter as-
sumption, it makes calculating the regional tamper states of a TDP more challenging
because of the time difference between readings. (The levelof synchronization re-
quired will depend on how long we wish to wait for data to reachthe TDP; we discuss
this more in Section 6.5.)
Next, we define the capabilities of the attackers we are targeting as follows:
• We assume that the attacker must go through an edge device toaccess the SCADA
network. More specifically, we assume that the attacker mustpenetrate some sort of
physical boundary, which could be as simple as the device’s own exterior, to access
the edge device’s hardware and network access point.
• The attacker is unable to inject packets into the network without first gaining access
to an edge device and plugging a cable into the device’s access point. Wireless ac-
cess points are not considered in our analysis, as they may bereachable outside the
device’s physical boundary.
• We only consider attacks on edge devices, and not other sorts of power equipment.
Tampering with power lines, for example, is considered out of scope.
66
• Network attacks originating from outside the SCADA networkare considered out of
scope.
• While TEDDI’s sensors monitor the device’s physical boundary, we assume that
there are no limits to the tools an attacker can use or the timethey can take to pene-
trate this boundary.
6.2 TEDDI Architecture Overview
TEDDI is made up of three components:
• Tamper Information Points(TIPs, Section 6.4): Programs that collect sensor data and
attempt to make local tamper decisions.
• Tamper Decision Points(TDPs, Section 6.5): Programs that take the sensor data from
TIPs, determine the regional state of the network area they monitor, and make tamper
decisions when asked by the TIP.
• Tamper Enforcement Points(TEPs, Section 6.6): Programs that listen for tamper
decisions and execute responses based on those decisions.
TEDDI takes a distributed approach to tamper detection by placing TIPs, TDPs, and
TEPs all throughout the network it is protecting, which improves its information-gathering
capabilities and allows the system to detect regional tamper events that locally-based pro-
tection systems, such as the IBM 4758 [119], would miss.
To illustrate how TIPs, TDPs, and TEPs work together to make tamper decisions, con-
sider the following example:
1. A utility operator uses the TEDDI Generation Tool (Chapter7) to construct a simple
tamper system consisting of a single TDP and three TIPs:A, B, andC. The operator
67
TDP
TIP A
TIP B
TIP C
2
4
Attacker?
Earthquake?5
3
1
To substation
To re
mote
device
s
TEPTEP
TEP
TEP
TEP
TEP6
Response?7
8
Figure 6.1: A diagram of the example given in Section 6.2. First, a utility operator buildsthe tamper system using the generation tool (Step 1), and then deploys the various compo-nents to their proper locations in the network (Step 2). When aTIP senses shaking (Step3), it sends an alert to the TDP (Step 4), which then uses it full information base to decideexactly what is happening (Step 5). This decision is then sent to the appropriate TEPs (Step6), who then decide the proper response to the event (Step 7).
denotes that the TIPs are equipped with an accelerometer as part of their sensor
set, and tells the system to watch out for shaking as either part of an attack or an
earthquake.
2. The TDP and TIPs programs are deployed, and the TIPs begin monitoring their en-
vironment for event indicators.
3. TIPA experiences intense shaking, causing its accelerometer toexceed its thresh-
old. (See Section 6.4 for more information on how TEDDI dealswith thresholds
for multi-dimensional monitors such as accelerometers.)A’s limited factor graph
(Section 6.3) knows that either an attack or an earthquake isoccurring, but it cannot
differentiate between the two possibilities without knowing the state of other boxes
in the system.
4. A sends an alert to the TDP about its situation, and requests assistance on making a
decision.
68
5. The TDP receivesA’s alert and attempts to determine the overall state of the system.
In doing so, it finds thatB andC have also experienced intense shaking (and in turn,
have also sent the TDP alerts about potential tampering).
6. The widespread shaking causes the TDP’s full version of the factor graph (Sec-
tion 6.3) to decide that the shaking is due to an earthquake. This decision is passed
along to the two TEPs associated withA.
7. Because the shaking is due to an earthquake,A’s TEPs do not take any action for
the time being, since the utility does not want to reduce the system’s availability
unnecessarily. (However, if the shaking had been identifiedas part of an attack, the
TEPs could execute a severe response set—revoking certificates, monitoring traffic,
etc.—to ensure an attacker does not gain access to the SCADA network.)
6.3 TEDDI Factor Graphs
At the heart of our tamper decision engine is a factor graph [42] that looks for sequences
within its sensor data to determine what event is occurring.By using these graphs, we
simplify the TEDDI setup process by capturing the grid defender’s intuition about tamper
events, and by not requiring a large amount of data or configuration to operate the system.
Our graph, as shown in Figure 6.2, is constructed from two important datasets:
Events: The setE = {e1, . . . , ej} of tamper events we want to detect.
Indicators: The setI = {i1, . . . , ik} of phenomena connected to the events inE. For
example, ifE includes the Schweitzer Scenario from Section 8.2,I will need to
include an indicator representing an open cabinet door. Thepresence or absence of
an indicatori is calculated by looking at its corresponding monitorm to see if the
69
monitor reading has reached or crossed an operator-defined threshold. (Our threshold
setup may require some pre-processing of sensor data; see Section 6.4 for details.)
Indicators can be classified aslocal, in which their value depends solely on the value
of the monitor at the edge device, orregional, which depend on the monitor values of
all of the TIPs operating under a TDP, and are therefore only visible to TDPs. (How
a TDP calculates its regional indicators is discussed in Section 6.5.)
While they are not explicitly included in the factor graph, the system’smonitorsrep-
resent a third important set. Monitors are excluded from theformal factor graph because
TEDDI assumes a one-to-one relationship between them and the indicators they look for.
We make this assumption for simplicity and without loss of generality, as anything that
breaks this assumption can be easily modeled by breaking monitors down into separate
components or using multiple indicators with different thresholds.
We build our factor graph via a three-step process:
1. For each concerning eventej, the operator defines a sequence of indicators that sig-
nalsej ’s presence, as well as the maximum amount of time that can pass between
each indicator. This process is described in more detail in Section 6.3.1. In Fig-
ure 6.2, for example, we define the sequence “Indicator 1, andthen Indicator 3 within
W seconds of 1” for Event 1, “Indicator 4, then Indicator 1 within X seconds of 4,
and then Indicator 2 withinY seconds of of 1” for Event 2, and “Indicator 5, and
then Indicator 1 withinZ seconds of 5” for Event 3.
2. The operator ranks the events by their importance, declaring which events are the
most important to detect. Here, the events happen to be ranked in numerical order:
Event 1 is the most important event, Event 2 is the second-most important event, and
Event 3 is the least important event of the three.
3. Finally, the indicator sequences are arranged within thefactor graph in order of their
70
Event 1 Event 3
I�������� �
<W �� ��
I�������� �
<X �� ?
I�������� �
<Y �� ��
I�������� �
<Z �� �?
N
N N
N
N
N
N
Figure 6.2: An example factor graph generated by our TEDDI system. The blank nodesrepresent intermediate steps in each event sequence, but are just treated as placeholdersbetween factor nodes in our system. Note that this example looks for the sequences “1,then 3 withinW seconds of 1” (Event 1), “4, then 1 withinX seconds of 4, then 2 withinYseconds of 1” (Event 2), and “5, then 1 withinZ seconds of 5” (Event 3). See Section 6.3.1for an explanation of why sequences are encoded in reverse.
rank, assuring that events are checked in that order. In the figure, Event 1 will be the
first event TEDDI looks for, followed by Event 2, and then by Event 3.
Whenever we poll our monitors for data, we calculate the presence of indicators based
on this data, and then use our factor graph to see what events are occurring, starting from
the most-important event.
This setup offers two advantages over other fusion algorithms. First, the resulting graph
is much less complex than a comparable graph generated usinganother fusion algorithm.
For example, a equivalent graph created using a Bayesian network would require that our
factor nodes be split into its ordering and time-window components, leading to an explosion
in the potential state space. Second, in comparison to the setup requirements of other
systems, such as the complete attack response tree of the RRE [161] and the initial training
71
period for SCADA-Hawk [123], constructing a factor graph in the above manner is simple
and less time-consuming. However, we must raise the following points:
• The sequences themselvesmustbe linearized to be properly encoded in the factor
graph. For example, a sequence such as “1or 2, then 3” would have to be split into
two the separate sequences “1, then 3” and “2, then 3,” and then ranked sequentially
to ensure they are properly prioritized. This splitting is currently a manual process,
and while we assume that a grid defender will have a clear ideaof how events should
be encoded and ranked, Section 6.7 discusses what could happen if this is not the
case.
• Currently, TEDDI only returns a single event decision even if multiple events are
present simultaneously, which makes properly ranking the events a critical task. We
are reliant on the operator having a clear sense of the relative importance of events,
and list in Section 6.7 what could happen if this assumption is violated.
When we generate the final factor graph, we create two versions: a full version for
tamper decision points, and alimited version for tamper information points. We create
the two versions to account for differences in the information bases between decision and
information points:
• If a sequence contains one or more regional indicators, thesequence is truncated at
thelatest-occurringregional indicator (i.e., the first one that TEDDI will encounter in
the sequence) in the limited factor graph. If this sequence truncation causes multiple
sequences to appear the same in the limited graph, those events are collapsed into a
single sequence with a rank equal to that of the highest-ranked event.
For example, if Indicator 1 in Figure 6.2 were a regional indicator, then the lim-
ited factor graph given to the TIPs would look like Figure 6.3. Any time the graph
encounters Indicator 1 when looking through its event sequences, it would have to
72
TO TDP TO TDP
Indicator 3TO TDP� �
Figure 6.3: A limited version of the factor graph from Figure 6.2, where Indicator 1 isclassified as a regional indicator. In this case, since Indicator 1 is part of every sequence,the TIP will not be determine if any of the events it is lookingfor are present, and will haveto request assistance from its TDP every time it reads data from its monitors.
defer its event decision to its TDP, which would have the proper context information
to resolve whether or not the indicator is present.
• If an information source is only available to tamper decision points (such as data
from an external database), monitors and indicators associated with that information
source are not included in the limited factor graph. (Note that the limited graph in
Figure 6.3 would look the same if Indicator 1 was an external indicator rather than a
regional one, as both types are only resolvable by the TDP)
While TEDDI’s use of indicator sequences captures a grid defender’s intuition about
potential tamper events, the way TEDDI looks for these events is a bit unorthodox. We
discuss TEDDI’s sequence-checking method in the next section.
6.3.1 How TEDDI Looks For Sequences
People generally define indicator sequences by the order in which the indicators occur: “A
first, then B, and then C.” However, TEDDI must wait for the entire sequence to appear
before making an event decision, and thus its decision is made at the moment in time when
the last indicator in the sequence occurs. Therefore, we encode the sequences inreverse
73
Indicator
A
Indicator
B
Indicator
C
A first, then B,
and then C
C now, then B before C,
and then A before B
time
Figure 6.4: A diagram showing how users and TEDDI define indicator sequences in op-posite directions. Users normally think of sequences by starting with the earliest indicatorand ordering them chronologically. TEDDI, however, has to wait for the entire sequence toappear before declaring that an event is present, so it starts by waiting for thelast indicatorin a sequence to appear, and then looking backwards in time tosee if the earlier indicatorsappeared in the correct sequence and within the allowed timewindows.
order within the factor graph: “Look for C, then see if B has occurred in the past, and
then see if A has occurred before B.” This setup leads to a mismatch between a user’s
mental model of the sequence and the implementation of the sequence within the code (see
Figure 6.4), so we rely on the TEDDI Generation Tool to translate from one to the other.
When traversing the factor graph, TEDDI uses the following procedure to determine
the presence of sequences:
• If the node represents an indicator at the end of a sequence (i.e., it’s the first node
TEDDI sees in the graph sequence), TEDDI looks to see if the indicator is currently
present. If it is, TEDDI moves to the next node in the current sequence; otherwise,
TEDDI moves on to the next sequence in the graph.
• If the node represents an indicator that is not at the end of asequence, TEDDI exam-
ines the last five time periods that this indicator was present. A time periodp for an
indicatori is defined by the pair(a, d), wherea is the timestamp representing when
i switched from absent to present (i.e.,i was absent at timea− 1, but present at time
a), andd is the timestamp representing when the first timei became absent aftera
(i.e.,d = a + k, wherei was found to be present from timesa througha + (k − 1)
74
but absent at timea+ k).
If one of these periods occurred both before the last indicator that TEDDI checked
and within the allowable time window as defined by the user, TEDDI moves to the
next node in the current sequence (or, if this is the first nodein the sequence, declares
that event to be present). Otherwise, TEDDI moves on to the next sequence in the
graph.
• If TEDDI goes through all of the sequences in the graph without finding any of them,
it reaches the end of the graph and declares that no events arecurrently happening.
As an example, consider the following scenario:
• An edge device is installed in a locked cabinet on a utility pole, but the grid operator
is concerned about someone cutting through the cabinet wallwith a torch and drilling
through the potting material surrounding the memory holding the encryption keys for
the device, allowing the attacker to then spoof traffic as that device.
• The operator decides to install a light and temperature sensor with the edge device,
and defines the following event sequence for his factor graph:
– High temperaturecaused by the torch.
– Light as the box is penetrated and the attacker searches for the device and mem-
ory they want to access. The time window between the high temperature and
light indicators is set to ten minutes.
– Finally, a tamper signalfrom the potting material1 indicating that someone is
trying to remove it. The time window between this indicator and the light indi-
cator is set to five minutes.1Generally, potting materials inside tamper-resistant devices have sensors embedded within them to detect
when they are being penetrated.
75
• When a malicious actor performs the above attack, TEDDI notes the presence of the
initial indicators as they appear, but does not actively respond until the last signal—in
this case, an alert from the potting material sensors—appears. When this indicator is
present, TEDDI goes through its factor graph like so:
1. TEDDI checks to see if the potting material tamper indicator is present (it is in
this case).
2. TEDDI moves on to the next indicator (light), and examinesthe last five time
periods the light indicator was present. If none of these periods appear within
the five minutes preceding the potting material indicator, TEDDI moves on to
the next sequence in the graph.
3. If one of the above light indicator time periodsdoesoverlap with the five-minute
time window, TEDDI moves to the first indicator in the sequence (high tempera-
ture) and repeats the checking sequence. If any of the last five high temperature
time periods falls within the ten minute window preceding the light period se-
lected above,2 TEDDI declares that the attack event is occurring, and movesto
take the appropriate response.
Note that while the above factor graph traversals are very linear, TEDDI could be
adapted to process the sequences in parallel; however, thiswould require breaking the
graph-checking code into individual threads for each sequence, and single-processor edge
devices would render this change useless.
6.4 Tamper Information Points (TIPs)
Tamper information points are the eyes and ears of TEDDI, andare responsible for collect-
ing the sensor data needed for decision making. A TIP is assigned to each edge device in2Choosing which of the light indicators to base our window on introduces a conflict between accuracy
and performance; see Section 9.2.1 for further discussion of this problem.
76
the network, and lives either on or near (i.e., within the same cabinet) the device to monitor
the surrounding environment. (Exactly where the TIP lives may be dictated by the sorts
of indicators you are looking for—for example, if “network disconnect” is in the indicator
set, the TIP will need to be on an auxiliary device (such as theSEL 3622 [112]) to avoid
getting disconnected along with the edge device.)
Every few seconds, the TIP performs the following tasks:
• First, it takes a snapshot of its monitor values and determines whether any indica-
tors are currently present by comparing these values to operator-defined thresholds.
These thresholds are just single numbers in our prototype, so the TIP may need to
pre-process the monitor data to fit its threshold setup:
– The TIP could use a simple heuristic to calculate the value tocompare with the
threshold. For example, an accelerometer that detects motion in three directions
would need its components combined into a single magnitude value for com-
parison. This setup, however, may not be fine-grained enoughto differentiate
different event behaviors.
– The TIP could use a machine-learning algorithm for pre-processing, and output
a specific indicator value based on its findings (i.e. it couldoutput 1 for a minor
benign shake, 2 for a stronger force possibly generated by anattacker, 3 for a
severe shake caused by a natural disaster, etc.). This decision, however, may
conflict with our goal of reducing the configuration burden ongrid defenders,
since they will need to gather the data needed to train the algorithm.)
When a monitor exceeds its threshold, the corresponding indicator is considered
presentin our factor graph; otherwise, the indicator isabsent. This set could po-
tentially be expanded to include non-binary indicators, but we can model these cases
using our existing binary indicators—for example, “is the current temperature above,
77
below, or within the normal operating range?” can be captured through the indicators
“are we belowX degrees?” (too cold) and “are we aboveY degrees?” (too hot).
• As indicators appear and disappear, the TIP updates its history counters to save the
last five times each indicator was seen. (We chose five to balance the threat of attack-
ers circumventing sequences by repeating indicators with the additional complexity
introduced by having these indicator options (see Section 9.2.1 for more details).
• Once the indicator set is built, the TIP sends it to the tamper decision point that
manages the TIP. The TDP uses this data for its own decision-making process, and
takes the data as a sign that the TIP is still active.
Along with its data, the TIP sends both its ID and the current timestamp, which
the TDP uses to authenticate the message and make sure that the data they receive
is fresh. To preserve the integrity of the message, the TIP takes its message, as
well as a 64-bit secret key, and generates a hash-based message authentication code
(HMAC) [67] with the SHA-256 cryptographic hash function. The MAC is appended
to the message, and the TDP verifies this value upon receipt tovalidate the message’s
integrity.3
• Finally, the TIP runs its indicator set and history counters through its factor graph to
make a local tamper decision by itself, and if successful, sends this decision directly
to the appropriate TEPs. However, as mentioned in Section 6.3, TIPs only have a
limited factor graph, and thus may not be able to definitively resolvesequences with
regional indicators. When this happens, the TIP defers to itsTDP and sends an alert
message to ask the TDP for assistance.
3A similar authentication scheme is used for TIP-to-TEP and TDP-to-TEP communication.
78
6.5 Tamper Decision Points (TDPs)
Tamper decision points serve as the final word regarding whattamper events are occurring
on a SCADA network. Ideally, TDPs live in centrally-located,higher-security areas of
a utility’s SCADA network, such as within a substation, but any node in the network is
eligible to host a TDP provided it is not already hosting a TIP. (We restricted TDPs to
non-TIP nodes because we assume that the edge devices that are hosting TIPs have limited
resources, and thus are not suited to host both a TIP and TDP. However, a TIP could be
installed to protect the device hosting the TDP from local attacks.) We discuss the optimal
placement of TDPs in Section 7.
Each TDP is given a full copy of the system’s factor graph, which allows them to make
definitive tamper decisions based on the data they receive. Its primary source of data is the
set of TIPs it serves, but it can also query external databases (for example, weather feeds
or utility incident databases) to make tamper decisions. (We added a MySQL connection
to our original TDP prototype to demonstrate the feasibility of the idea, but given the wide
range of potential data sources, we did not include externaldata sources within the TEDDI
Generation Tool.) While every TIP in the system is paired witha specific TDP, the exact
number of TIPs that each TDP serves is up to the network administrator: More TIPs give the
TDP a better sense of the network’s overall tamper state, butservicing too many decision
requests may overwhelm the device the TDP lives on.
Each TDP is made up of three threads that are spawned when the program starts:
Heartbeat Thread: This thread is responsible for processing the non-alert messages
coming from its TIPs. Upon receiving a message, the heartbeat thread verifies that
the message is fresh and came from a legitimate TIP, and if so,it stores the set of
local indicators from the message and updates its history counters accordingly.
The heartbeat thread handles regional indicator calculations using a simple majority-
79
rules voting scheme that involves the corresponding local indicators. For example,
if a TDP needs to know the value of a regional shaking indicator, it takes the local
shaking indicator values from all of its TIPs, and checks to see if a majority of the
TIPs are currently experiencing shaking. In general, the TDP constructs its set of
If any of themaj(ip) functions do not find a clear majority (i.e. the TIPs are evenly split
on sensorp), the TDP has several options:
• It can break ties arbitrarily, and declare that an even split will always be reported
as present or absent.
• It can reach out to apeer TDPfor assistance. The requesting TDP sends all
of its state data to its peer, including current indicator values, past indicator
histories, and other important bookkeeping information such as the number of
TIPs that the requesting TDP serves. The peer TDP can then combine its own
TIP data with that of the requesting TDP, creating a new jointset of regional
indicators to use in making an event decision.
Using the combined regional indicator set, the peer TDP can make an event de-
cision and pass it back to the requester, who can then pass it on to the proper en-
forcement points as needed. (While this functionality was included in our orig-
inal TEDDI prototype, we did not include it in the TEDDI Generation Tool.)
80
Once the current regional indicators are calculated, we update their history counters
in the same manner as the local indicators. (Note that the heartbeat thread does not
deal with external indicators; these indicators are processed by the alert thread.)
Alert Thread: This thread is responsible for handling decision assistance requests from
TIPs. Upon receiving an alert and verifying that it comes from a legitimate source,
the TDP takes the following steps:
• First, the thread waits a short period of time to receive messages from other
TIPs. This is done to make sure we have current data from all ofthe TIPs before
we try to make an event decision—otherwise, if a global indicator was present,
the system would not recognize this fact until half of the TIPs had reported it,
and might make an incorrect decision for early-responding TIPs.
In our evaluations, our initial waiting time of 1 second proved to be too long, as
it causes the TDP’s alert socket queue to overflow in the face of steady traffic
(while also potentially providing the attacker more time toact before a response
could be executed). However, reducing this time too much opened TEDDI
up to TIP synchronization issues: If some of a TDP’s TIPs wereslower in
providing fresh data to the TDP due to clock drift, a TDP may beforced to
make decisions with stale, inaccurate data. We eventually settled on a wait time
of 100 milliseconds to balance these issues, but this duration could be adjusted
by a grid defender if necessary.
• Next, the TDP determines the status of its external indicators by querying the
data sources associated with the indicators. For example, if TEDDI requires
data from a SQL-based incident database about a potential maintenance visit, it
queries the database to see if the current time falls within aknown maintenance
window for the edge device in question.
• Once all of the external indicators are collected, the TIP combines them with
81
Alert
M����g�
L�g�timate
M����g��
W��� ���
M��� �ata
C�����ate
R�g��o�� �����
�� ���te
C�����
G�� ������on
F��! "���
R�o F�����
G��#$
Event
Present?
Decision
To TEPs
%& '('%)
Y*+
,-
Y*+
,-
Y*+
,-
Figure 6.5: A flowchart depicting how a TDP’s alert thread responds to a message. Thedashed lines indicate that getting help from a peer TDP is an optional step.
both its regional indicators and the local indicators of theTIP who sent the origi-
nal alert. The TDP runs the entire set through its full version of the factor graph,
which allows the TDP to make a definitive, fully-informed event decision.
• Once an event decision is made, the TDP sends its decision tothe appropriate
TEPs to handle the system’s response.
A flowchart of this process can be found in Figure 6.5.
Audit Thread: This thread runs periodically to look for “lost” TIPs and remove them
from future calculations. TIPs are considered lost if they do not report data within a
specified timeout window (set to 60 seconds in our prototype).
If a TIP is lost, a “lost TIP” event is sent to the appropriate TEPs to further action.
While TDP peering was left out of the current generation tool,for the sake of complete-
ness we define a fourth thread for handling peer assistance requests:
Helper Thread: This thread is responsible for servicing assistance requests sent by other
TDPs. When it receives a request, which includes the local data from the TIP who
initially sent the alert, the helper thread takes the following steps:
82
• It combines the TIP data from the requester TDP with its own TIP data, and uses
that to create an indicator setIcombined that represents the regional indicator state
of both TDPs. (If the state is still unclear, the helper thread could request help
from another peer TDP, and the pattern could continue arbitrarily until either
a TDP finally has enough data to get a clear idea of the regionalstate, or we
run out of TDPs to query. This feature, however, was not implemented in our
prototype.)
• It takes both the indicatorsIlocal from the TIP who initially sent the data, fuses
it with Icombined, and runs the whole set through its full factor graph. Once a
decision is reached, it sends the decision back to the requesting TDP.
Finally, once the alert thread decides that an event is present, it sends its decision to the
appropriate tamper enforcement points to handle the response.
6.6 Tamper Enforcement Points (TEPs)
Tamper enforcement points are positioned between the TIP and its TDP on the SCADA
network, and they are responsible for responding to decisions made by these devices.
For each TIP, anedge TEPis installed at the TIP’s location, and acentral TEPis placed
closer to the TIP’s associated TDP. The two TEPs allow us to execute responses in the
location that makes the most sense in the current context—for example, erasing secret data
on the edge device is best handled by the edge TEP, while filtering network traffic might be
more appropriate for the central TEP.
Unlike most tamper response systems, in TEDDI TEPs are not limited to making a
single response to a decision, but instead can execute an ordered series of responses to
mitigate any problems. Responses themselves are defined by three attributes:
83
• The shell script (provided by the user) that defines the actions that make up the re-
sponse.
• The severity classification of the response. Responses can be classified as either
weak, moderate, or strong.
• Whether or not the response is repeatable.
These attributes allow for flexibility in TEDDI’s response,which is critical when ad-
dressing the grid defender’s dilemma, given the costs associated with taking the wrong
response to an event (Section 4).
The system operators set exactly which responses to take foreach event, as well as what
order to take them in, using the TEDDI Generation Tool. In cases where responses need to
be taken by both the edge and central TEPs, the TEPs coordinate their response to ensure
that responses occur in the proper order.
6.7 Limitations of TEDDI
While the above architecture offers a number of advantages over existing systems, it is not
without its drawbacks:
• TEDDI is also vulnerable to “low and slow” attacks; that is,attacks that progress
slowly enough that one or more of the sequence’s timing windows are exceeded. This
technique is commonly used when exfiltrating data from a system, and could be used
to great effectiveness here. However, if an attacker must beon location to physically
tamper with a device, slowing down their attack may increasetheir chances of being
noticed in other ways (such as being spotted by a passerby).
This attack has a parallel in the network intrusion protection sphere, where packet
fragmenting can lead to similar issues with sequences and timeouts, albeit involv-
84
ing network traffic rather than environmental indicators [114]. Oftentimes, attacks
against a network intrusion protection system (NIPS) exploit differences between
the timeout values of the NIPS and the system it is trying to protect—for example, if
a NIPS waits forx seconds before discarding fragmented packets, but the protected
system waitsy > x seconds before doing so, an attacker can send a packet fragment
everyz seconds such thatx < z < y, causing the fragments to sneak past the NIPS
undetected and still get reassembled on the victim system.
The primary reason TEDDI is vulnerable to slower attacks, therefore, is that the host
system has no mechanism for “discarding” physical indicators, meaning thaty is
essentially infinite in this scenario. That means that patient attackers only have to
wait for thex time window to expire before continuing their attack. (However, since
x is different for each time window, the attacker may have trouble determining how
long they have to wait.)
• Because TEDDI only reports one tamper event at a time (the highest-ranked one that
it sees), improperly ranking events could lead to two problems:
– If a high-priority event is ranked too low, then TEDDI may miss the event if it
appears at the same time as a higher-ranked (but actually lower-priority) event.
– If the sequence for an eventEi is a exact subset (i.e., it has same indicators, in
the same order, and the same time windows) of a sequence for the eventEj,
then if Ei is ranked ahead ofEj, TEDDI will never detectEj because it will
always look for (and find)Ei first.
These issues make it possible for an attacker to mask an eventby inducing a concur-
rent sequence that corresponds to a higher-ranking event. However, the attacker must
be careful when taking this approach, as the response to the higher-ranking event may
still interfere with the event the attacker wants to mask. Additionally, TEDDI could
be modified to report any number of events that happen simultaneously, rather than
85
just the event with the highest rank; however, this change may complicate our re-
sponse mechanisms, as the actions taken for one event may be the very actions we
want to avoid for another.
• While we assume that the SCADA network is reliable and always available, this may
not always be the case in the real world. TIPs can still perform local event detection
when isolated, but if a regional indicator is needed, the TIPsimply sends an alert to
the TDP and assumes that the problem will be take care of by someone else, which
could lead to problems if the TDP is not available.
• A single component failure in our system may leave the systems supported by that
component open to compromise. For example:
– If a TIP fails, TEDDI will no longer receive indicator data from the correspond-
ing edge device. Eventually, the TDP will recognize that theTIP is no longer
active, and stop including its data in the TDP’s regional state calculations.
– If one of the threads spawned by a TDP fails, all of the TIPs managed by that
TDP are put at risk. Without the heartbeat thread, for example, the TDP would
not be able to collect current indicator data from TIPs, and would have to rely
on stale data to make event decisions (and eventually lose its ability to calculate
regional indicators). Losing the alert thread, on the otherhand, would keep
TEDDI from responding to any event with a regional indicator, as the TIPs
trust that the TDP will always be there to assist them and willblindly send
alerts even when the TDP disappears.
– Losing a TEP will effectively turn TEDDI into a detection-only protection sys-
tem for the corresponding edge device, as the TDP and TIP willcontinue send-
ing event decisions with the assumption that the TEP is available to handle the
response. This issue may arise even if only one of a TIP’s TEPs(either edge or
86
central) is lost, as the remaining TEP will likely end up waiting for the lost TEP
while trying to coordinate its response.
• The indicators available to TEDDI are constrained by the monitors available to the
operator, which means that there may be an added cost to deploying TEDDI in the
form of installing monitors around edge devices. (However,some manufacturers
have started building monitors into their products—for example, the SEL 3622 fea-
tures an accelerometer and light sensor [112].)
• Finally, the most glaring issue with TEDDI is that as a signature-based protection
system, it is only as good as the signatures (or sequences, inthis case) that it has.
A grid defender may have an incorrect mental model of a tamperevent, and end up
assigning an incorrect indicator sequence to that event, causing TEDDI to miss the
event when it eventually occurs. Some possible pitfalls include:
Excluding or misordering important indicators in a sequence. Omitting indica-
tors is not as big a problem as it might seem, since the event should still match
the indicators that are included in the graph (provided the time windows are
long enough). For example, if an eventE is made up of the indicator sequence
ABC, the event will still match the sequencesAB, AC, or BC if one of the
indicators is left out of the graph.
Misordering indicators, however, is a bigger problem, as this will cause TEDDI
to miss the event completely: While looking forAB will still catch the sequence
ABC, looking forACB will not.
Adding extraneous indicators to a sequence.An operator may over-think the
process and add unnecessary indicators to a sequence.
Choosing an improper response set for an event.Even if an operator defines a
suitable sequence for an event, they may still select an incorrect set of responses
to apply.
87
One possibility for mitigating this problem is to add an early-response mechanism
that allows grid defenders to apply a subset of the event’s responses when we see the
initial portion of the event sequence. This is part of the motivation behind the “pre-
event” portion of our Response Suggestion Engine, which we discuss in Section 7.2.
Another issue with our signature structure is that multiplesequences may need to
be defined if the exact sequence for an event is ill-defined (for example, “A, then
either B or C, and then D”). This may force an operator to define several sequences
to capture all of the potential possibilities, increasing the chances that they will make
one of the sequence mistakes mentioned earlier.
All of these issues underscore the importance of building anaccurate, comprehensive
factor graph containing the events a grid defender is worried about.
The challenge of avoiding the above pitfalls while buildinga factor graph, combined
with the fact that a unique program must be generated for every TIP, TDP, and TEP a
network requires, suggests that building a TEDDI system, and in particular putting together
a proper factor graph, may be a challenge for grid defenders,and that constructing a tool
that helps automate this process would be very useful. For example, we could suggest an
early response if the beginning indicators of a long sequence are present, or try to fill in
gaps in response sequences for events that appear. To address these concerns, we designed
the TEDDI Generation Tool, which we discuss in detail in the next chapter.
88
Chapter 7
The TEDDI Generation Tool
In this chapter, we describe theTEDDI Generation Tool, a program that takes information
about the network, the devices, and the events we want to detect, and outputs the necessary
custom programs to deploy TEDDI on any arbitrary network.
The tool itself is written in a combination of PHP, C, and MySQL, and encompasses
over 10,000 lines of code in total. The tool has two major components: A TEDDI website
that collects the data from the user and translates it into intermediate files representing
TIPs, TDP, TEPs, and the full factor graph; and a code generation program that turns the
intermediate files into the C files that then be compiled and deployed on their destination
hosts.
To show how the generation tool works, consider the following example: A grid de-
fender is deploying a set of edge devices around the utility’s service area, and is looking to
build a TEDDI system to protect them. Upon accessing the TEDDI website, the defender
goes through the following process:
1. The user enters the events, indicators, and monitors thatwill make up TEDDI’s factor
graph. For example, if our operator is concerned about someone breaking into an
edge device cabinet and plugging a malicious USB drive into the edge device (as
89
described in Chapter 3), they could define the following items:
• Event: “Malicious USB Drive.”
• Monitors: A cover switch, a photosensor, and a USB drive cap(to keep the
port covered). We also include a link to query an external database for an extra
indicator, which we explain below.
• Indicators: “Open Door,” “Presence of Light,” “USB Cap Removed,” and “USB
Accessed.” However, if firmware updates or other patches canbe provided
via USB, a fourth indicator “Unscheduled Activity” can be added to interface
with a utility’s incident database and see whether the device is scheduled to be
serviced. This fourth indicator will also be marked as accessible only by the
TDP.
2. Next, the user links the monitors and sensors, and then defines the indicator se-
quences that make up the events:
• The Open Door indicator is linked to the cover switch, the Presence of Light
indicator is linked to the photosensor, USB Accessed links to the drive cap, and
Planned Maintenance is joined to our external database. Since the cover switch
and drive cap are binary sensors that are either Open or Closed, their thresholds
are simply set to Open, while the photosensor threshold is set to ensure it is
above the amount of light emitted by the device’s own LEDs. The database
threshold is set depending on the query that is made—for example, if we just
ask if an incident ticket is currently open for this device, the threshold can be
set as binary (there is a ticket, there is no ticket).
• The indicator sequence order for the Malicious USB Drive event is defined
as “Open Door, then Presence of Light, then USB Cap Removed, then USB
Accessed, and finally Unscheduled Activity.” The time window between the
90
first two indicators is set relatively short (i.e. a few seconds), as either ambient
light will immediately strike the the device, or the attacker will have a light
source of their own that they will shine on the device. The time window between
light and the USB device will only be slightly longer, on the order of a few
minutes, as we assume the attacker will not want to wait around once they
have the cabinet open and will thus proceed quickly with their attack. (For the
external database, the TEDDI-defined time window is ignoredin favor of the
window defined by the incident ticket, i.e. “A technician will be at this box
between 10 AM and noon on April 21st.”)
3. Now, the user enters the responses available to the system, and links them to the
events. For our USB event, the utility may want to send an alert back to their control
center (which they label as a Weak response), begin monitoring traffic for suspicious
behavior (a Moderate response), and disable the port to keepthe attacker off their
device (which could be labeled as either Moderate or Strong).
4. Next, the user defines the topology of their SCADA network, and decide where the
TIPs, TDPs, and TEPs should be placed. In our example, the operator uses the
Network Topology Uploader (see Section 7.3) to quickly inform TEDDI of their
network layout and tell TEDDI that their USB-vulnerable device (and every other
device like it) requires a TIP for protection. The TDP Placement Tool (Section 7.4)
is then called upon to place TDPs, and determine which TDP should be linked to our
device.
5. Finally, the user enters the IP/port information for all of the devices on which TIPs,
TDPs, and TEPs will live. Once done, the generation tool spits out the TIP code then
can then be compiled and deployed on the edge devices.
The generation tool includes four important components that assist the user in con-
structing their TEDDI system: the Factor Graph Domain-Specific Language, the Response
91
Suggestion Engine, the Network Topology Uploader, and the TDP Placement Tool. We
now describe each of these components in detail.
7.1 Factor Graph Domain-Specific Language (FGDSL)
To accomplish our goal of capturing an operator’s intuitionabout the events they want to
detect, the generation tool provides adomain-specific language (DSL)[124] based on our
factor graph, which we callFGDSL(factor graph domain-specific language). DSLs have
been used to simplify and streamline a diverse set of tasks, ranging from generating video
card drivers [130] to creating and verifying cache coherence protocols [24] to streamlining
software production for the Estonian customs system [41]. FGDSL provides similar ben-
efits by letting operators define components and component relationships at a high level,
and then automatically translating them down into C code.
FGDSL consists of four basic data structures: Events, indicators, monitors, and re-
sponses. The structures are formally defined in Figure 7.1.
On top of the basic structures, we define three important relations:
• A one-to-oneindicator/monitorrelation, which links indicators to the monitors that
look for them.1 The threshold for this relation is defined here as well.
• An ordered, one-to-manyevent/indicatorrelation, which links events to the indicator
sequences that define them. This is also where the allowed time windows between
indicators are defined.
• And ordered, one-to-manyevent/responserelation, which links events to their re-
spective response sequences.
1We define indicator/monitor relations as one-to-one to simplify our monitor-reading code, but couldexpand our prototype to link a monitor to several indicatorsif desired.
Figure 7.1: The definitions of (a) events, (b) indicators, (c) monitors,and (d) responses inFGDSL.
Mental
ModelFGDSL
Factor
GraphLogical
PredicatesCode
Figure 7.2: A diagram of the model-to-code conversion process in TEDDI.Note that theuser only needs to complete the first transition to FGDSL; everything else is managed bythe TEDDI Generation Tool.
With these primitives, a grid defender can easily translatetheir mental model of an event
directly into FGDSL. From here, our generation tool can build a factor graph, define the
logical predicates that make up the factor functions of the graph, and eventually generate the
low-level C code that looks for the events. The conversion process is shown in Figure 7.2,
and described in more detail in Section 9.4.
7.2 Response Suggestion Engine
The assigning of responses to events is a manual process, andcan be a little tedious even
with the Generation Tool. Therefore, we included the Response Suggestion Engine to help
93
users determine response strategies for events with long orsimilar indicator sequences.
After the user completes a first pass of linking responses to events, the engine does the
following:
Pre-Event Suggestions:The suggestion engine has two sequence length thresholdsa
and b, which by default are set to four and six, respectively. (These numbers are
based on our assumption that indicator sequences will generally contain fewer than
ten indicators, but could be tuned at a later point if necessary.)
If e’s indicator sequencei falls in the rangea < |i| < b, ande’s response sequence
begins with one or more weak responses, the system suggests defining a new “pre-
event”e∗ in the factor graph, allowing the user to take some pre-emptive steps for a
larger event that may be coming.e∗ is given the following attributes:
• e∗ will be ranked behind all of the other events, to make sure we do not overlook
a full event in favor of a pre-event.
• The indicator sequence fore∗ will be set as the first half ofe’s sequence (which
is two by default).
• The response set fore∗ will be the weak responses that begine’s response set,
and they will be ordered the same as ine. For example, ifABC is the ordered
set of responses we take fore, A is classified as a weak response, andB is
classified as a moderate response, the response set/order for e∗ will just beA.
If |i| < b, the system suggests defining two pre-eventse∗ ande∗∗ in the factor graph.
e∗ is defined exactly as described above, bute∗∗ is constructed as follows:
• e∗∗ will be ranked behind all other events, but ahead ofe∗.
• The indicator sequence fore∗∗ will be set as the firstfour indicators ine’s se-
quence.
94
• The response set fore∗∗ will be the weakand moderateresponses that begin
e’s response set, and they will be ordered the same as ine. For example if we
consider the same response sequenceABC from above, the response set/order
for e∗∗ will be AB (and potentiallyABC, if C is not a strong response).
For example, suppose we are considering the Schweitzer Scenario from Section 3.4
as one of five events in our factor graph, and we have determined that our response will
be to alert the control center (a weak response) and then sever the edge device’s network
connection (a strong response). When we examine the problem,we wind up extracting four
for more details on this breakdown). This sequence would cause TEDDI to suggest the
following pre-evente∗:
• We sete∗’s rank to six, to ensure that we consider all of the full events before we start
looking for pre-events.
• e∗’s indicator sequence will consist of the first two indicators from the Schweitzer
Scenario—in this case,shakingandcover open.
• e∗’s response sequence will just include alerting the controlcenter, as the other re-
sponse (severing the network) is considered too strong for apre-event.
Pre-events assist grid defenders in two ways:
• They reduce TEDDI’s reaction time to an event by letting TEDDI take pre-emptive
steps towards mitigating an event before the event actuallyoccurs.
• They help guard against incorrect event sequences by only considering the start of
the sequence. For example, if a defender setse’s indicator sequence asABCD, but
e’s true sequence isABCE, TEDDI will suggest a pre-eventAB that will still be
detected even if the full sequence is not.
95
Response Suggestions:If two events have response sequences that begin the same way,
the suggestion engine will offer to combine the sequences such that the same re-
sponses are used for both events. More formally, if eventse1 and e2 have corre-
sponding response sequencesr1 andr2, and there exists a response sequences such
that length(s) ≥ 2 andr1 = sr′ andr2 = sr′′, TEDDI will set both response se-
quences tost, wheret = (r′∪ r′′). (In merging the response sequences, however, the
tool does not attempt to order the added responses; this taskis left to the user once
the merging is complete.)
Combining responses for similar events help guard against response omissions—for
example, if we consider the Maintenance Mode Attack from chapter 3, if the defender
chooses to log the benign event but not the malicious one, TEDDI will ask about adding
the log response to the latter event. However, the grid defender needs to carefully review
these suggestions before accepting them, as the responses for one event may not be suitable
for the other given the difference in event severity.
7.3 Network Topology Uploader
Unlike factor graphs, we assume that grid defenders alreadyhave a diagram of their net-
work topology on hand. Rather than forcing defenders to enterthe details of their network
manually into TEDDI, we want to let them upload their existing topology to the system,
and allow TEDDI to use the provided information to fill in the details automatically. This
goal led us to construct our network topology uploader.
Network topologies can be expressed in a number of differentways—for example, one
industry representative we spoke with stored their topology records in an Excel spread-
sheet. TEDDI’s topology uploader, however, is based upon Weaver et al.’s Cyber-Physical
Topology Language (CPTL) [149]. CPTL takes a SCADA network, complete with infor-
96
mation about the various devices and the links between them,and depicts it as a high-level
graph, where vertices represent devices and edges represent the network links between
them. From there, CPTL defines a set of primitives that combines both cyber and physical
information sources to describe the network in question (for example, high-level documen-
tation or low-level IP information), as well as a set of operations that can be run on these
primitives. CPTL stores graph data and attributes in a JSON-like syntax, which can be seen
in Figure 7.3.
CPTL was originally designed as a way to streamline NERC CIP audits,2 which are
estimated to “consume 30 man-days of work per day per audit” [149]. To assist grid de-
fenders in preparing for and demonstrating NERC CIP compliance, the authors define a
set of “vertex and edge attributes” [149] that augment the graph with domain-specific in-
formation (device classifications, IP information, etc.),as well as a pair of operations to
support network expansion and contraction. These operation help grid defenders visualize
their networks by allowing them to quickly view informationat the desired level of granu-
larity, thereby making it easy to evaluate the vulnerability and configuration status of their
devices.
For TEDDI, we lean on CPTL’s vertex and edge attributes to determine the structure of
the given network. More specifically, we look for specific information within the JSON-
based storage files that give us clues as to where TIP and TDPs should be placed:
• CPTL’s rdfs:typevertex attribute tells TEDDI what sort of device this node is, and
whether or not it needs to be protected. Types such as “Generator,” “Meter,” or “Re-
closer Control” indicate that we should place a TIP on or with these devices, while
types such as “Node” or “Meter Controller” indicate potential TDP locations. In Fig-
ure 7.3, for example, thesyard:Generator attribute dictates thatGenerator1
2NERC stands for “North American Electric Reliability Corporation,” and their Critical InfrastructureProtection (CIP) standards are mandatory rules regarding cybersecurity controls, documentation, and report-ing/recovery processes needed by covered utilities [84]. Failure to adhere to these standards can lead to stiffpenalties, such as fines as high as $1 million per day that the standard was not followed [149].
Figure 7.3: An example of a network topology file used by CPTL [149] and TEDDI.TEDDI uses therdfs:type field of nodes to decide where TIPs and TDPs should beplaced, and uses therelation field of links to see which nodes are directly connected.
will require a TIP for protection, while thesyard:Node attribute of Node1 signals
that we should consider hosting a TDP on this device.
TEDDI which devices are directly connected. (In Figure 7.3,thehasLine shows
there is a communication path betweenGenerator1 and Node1.) We can de-
duce the general topology of the network through this relation, and it is also vitally
important to the TDP Placement Tool (Sec. 7.4).
The CPTL syntax also offer the potential for expanding the topology uploader and
further reducing the burden on TEDDI’s users. For example, the “CPTL enterprise names-
pace... incorporates more detailed information about devices on a network via vertex at-
tributes such as IP address” [149], which could allow users to avoid manually entering IP
information for TIPs, TDPs, and TEPs.
Once a SCADA network is uploaded, placing TIPs and TEPs is a straightforward pro-
cess: Every device in the network that we want to protect requires a TIP to be installed with
98
it, and TEPs default to the locations of the TIPs (edge TEPs) and TDPs (central TEPs).
Placing TDPs is a trickier process, but a process that is mademuch easier by our TDP
Placement Tool.
7.4 TDP Placement Tool
The TDP Placement Tool assists a grid defender in placing tamper decision points within
their network. Any non-TIP device in the SCADA network is a potential location for a
decision point, but we want tominimizeboth the number of TDPs we have to place in the
network and the distances between TDPs and their TIPs, in order to simplify the installation
process for the utility.
Thankfully, our question generalizes to a well-studied problem within computer sci-
ence: thesimple plant location problem (SPLP)[52]. In the general form of this problem
(known as thefixed cost median problem (FCMP)), we wish to find the optimal locations
to build service centers such that we minimize our total costs, which consist of i) the cost
of building these centers, and ii) the cost of servicing other locations in the area from the
centers they build. The SPLP represents the discrete mediancase of the FCMP, which seeks
to solve the following problem: Given the set of locationsL we want to serve, the set of
potential plant locationsP , dlp is the cost of serving locationl ∈ L from locationp ∈ P ,
andfp is the cost of placing a facility atp, find the optimal subsetS ∈ P that minimizes
the costZ(S). Defined formally by Hochbaum [52] (note that we have changeda few of
the variable names from his equation):
minS⊂P
Z(S), whereZ(S) =∑
l∈L
minp∈S
dlp +∑
p∈S
fp (7.1)
In our case, our setL is the set of TIPs in the networks, whereasP denotes the potential
TDP locations,dlp is the number of hops betweenl andp in the graph (for now, we weight
99
all links equally and do not consider how they translate intoactual distance), andfp is 1 for
all p ∈ P . With these definitions, solving the simple plant location problem will provide a
solution that serves all of our TIPs with the fewest number ofTDPs.
Unfortunately, finding an optimal solution to the SPLP is noteasy, as we can reduce a
known NP-complete problem (Set-Cover) to the SPLP, thus showing that the SPLP is also
NP-complete [52]. However, we use a greedy Set-Cover algorithm to produce an initial
TDP set that approximates the optimal solution [30].3
We define our Set-Cover algorithm as follows:
• We start with the formal definition of the problem: “An instance(X,F) of the set-
covering problem consists of a finite setX and familyF of subsets, such that every
element inX belongs to at least one subset ofF ...The problem is to find a minimum-
sized subsetC ⊆ F whose members cover all ofX” [30].
• We defineX as the set of TIP-protected nodes in our graph that areadjacentto a
potential TDP node. (We deal with TIP nodes that are only adjacent to other TIP
nodes in a separate step after we run our algorithm.)
• For each potential TDP nodet in our graph, we define a setft that contains all of the
nodes inX that are adjacent tot.
When the greedy Set-Cover algorithm is run with these definitions, it will choose the
node adjacent to the most TIPs in every round. Therefore, oursolution setC will contain the
nodes on which we should install TDPs, and tell us which TIPs each TDP should service.
With this approach, we obtain a near-optimal solution for both the number and position of
our decision points.
While any node that is not a TIP is considered a potential TDP landing spot, in practice
there may be nodes that are not suitable for hosting decisionpoints. This issue can be3Specifically, the set produces by Greedy Set-Cover isH(d) time larger than the optimal, whereH(d) is
thedth harmonic number [30].
100
solved in one of two ways: either the Network Topology Uploader can be tweaked to
account for non-TIP, non-TDP nodes, or the user can adjust the TDP layout after-the-fact
by re-assigning TIPs to other decision points. (The former method is preferable, as the
latter forces defenders to manually tweak their TIPs every time they create or update a
TEDDI system.)
While greedy Set-Cover will satisfy most of our needs, a minor problem remains: If a
TIP is not immediately adjacent to a potential TDP node, it will get left out of our algorithm
and not get connected to a TDP. To address this issue, once we have a TDP set from greedy
Set-Cover, we run a simple breadth-first search (BFS) from eachTIP node that was not
included in the algorithm, and connect it to the first TDP it finds.
In terms of the its runtime, the algorithm breaks down as follows for a network featuring
the setD of TDP-eligible devices, the setA of TIP-protected devices that are adjacent to
nodes inD, the setN of TIP-protected devices that arenot adjacent to nodes inD, and the
setK of network links:
1. Our initial splitting of the nodes into TIP and TDP groups runs inΘ(D + A + N)
time.
2. Constructing the subsets for our Set-Cover algorithm requiresO(D(D + A)) time.
3. Identifying and setting aside the excluded nodes takesO(K(A+N)) time.4
4. Our Set-Cover implementation gives us a runtime ofO(AD(1 + A)) time.5 This
differs from Cormen et al.’s runtime ofO(|A| ∗ |D| ∗ min(|A|, |D|)) [30] due to a
slight difference in implementation.
5. Our BFS implementation matches Cormen et al. more closely, and gives us an equiv-
alent runtime ofΘ(N) ∗O(D + A+N +K) [30].
4This could also be written asO((A+N)(D + A+N)) time, i.e. “we might have to check every nodeas a potential neighbor” versus “we might have to traverse every network link to find the neighbors.”
5This could also be written asO(D2(1 + A)), as the number of outermost loop iterations are upperbounded by both the number of sets (i.e., the number of TDPs) and the number of TIP nodes inA.
101
The resulting combination runs in quadratic time, but the term that ends up dominating
the equation will depend on the relative sizes ofD, N , A, andK. (Our performance
evaluation, on the other hand, depicts a linear relationship between system performance and
the overall number of network nodes; we discuss the potential reasons why in Section 9.3.)
Finally, we note that the BFS term’s impact could be minimizedby expanding the
definition of sets within Set-Cover to include nodes some number h of hops away from a
TDP-eligible node, but how this might affect the runtime of greedy Set-Cover is unclear.
7.5 Generation Tool Limitations
The TEDDI Generation Tool helps improve the usability of thesystem by simplifying the
process of creating a TEDDI system, but updating an existingTEDDI system (for example,
adding a new event to a factor graph) can be a bit of a hassle because the system has to be
re-generated and re-deployed to all of the devices in the system. For example, while TIPs
will automatically reconnect to a TDP that is taken down and updated, a TIP that disappears
for too long will eventually be considered “lost” by the TDP,and the TIP will no longer
be able to send messages or alerts to TEDDI. These sorts of issues, however, could be
addressed by making the system a bit more modular (for example, a TIP could read in a
factor graph file upon startup) such that a TIP or TDP would nothave to be stopped to be
updated.
102
Chapter 8
TEDDI in Action
In this chapter, we demonstrate the effectiveness of TEDDI by revisiting the tamper scenar-
ios from Chapter 3, and show how TEDDI addresses the issues raised by the grid defender’s
dilemma.
8.1 Scenario 1: Device Credential Heist
Our first scenario breaks down nicely into a sequence of indicators: First the attackeropens
(o) the device case, uses alight source(l) to locate the protected memory chip, and then
attempts to pierce the pottedmesh(m) andprobe(p) the chip underneath to extract the se-
cret key. In addition to the device’s mesh, then, we need a cover seal/switch, photosensor,
and a special probe sensor [151] in our monitor set. (While these would most likely in-
stalled specially for our purposes, manufacturers are starting to include monitors is in their
products, such as the SEL 3622 [112].)
The time windows for this scenario are set as follows:
• The window betweeno andl can be fairly short (sixty seconds or less), since ambient
light will be let in as soon as the device opens, and the attacker will use an external
103
light source (for example, a flashlight) if there is not enough ambient light.1
• Thel-m window can be set to be a bit longer (perhaps several hours), as we expect an
attacker to be more cautious as he or she tries to penetrate the mesh’s potting material
without tripping the mesh sensors.
• Finally, them-p window can be somewhere in between the prior two (roughly sixty
minutes), as the attacker may need some time to place the probes while continuing
to avoid the sensor mesh.
(We note here that it can be difficult to validate the exact time windows needed without
empirical evidence, and thus grid defenders may want to err on the side of longer windows
to ensure that slower attackers are still detected by TEDDI.)
Most of these indicators are binary values (cover open/closed, sensor mesh hit/not hit,
probe present/absent), but the photosensor threshold willneed to be calibrated to pick up
the sharp increase in light that occurs once the device is opened.
For our response sequence, we take the following steps:
• We log the event, both on the device and in the control center.
• We limit the traffic this device is allowed to send through selective revocation of its
keys. For example, if the edge device in question is a smart meter, it may still be
allowed to communicate with its upstream data aggregator, but not directly back to
the utility’s control center.
• We attempt to destroy the keys revoked in the previous step,to keep the attacker from
using them in the first place.
1Attackers striking at midnight who are either equipped withnight vision goggles or who know the devicewell enough that they do not require a light source will require a different indicator sequence.
104
p?
Ec
m?.
? o?
Figure 8.1: A diagram of the factor graph sequence used to represent the Device CredentialHeist scenario.
Once the indicators and response sequence is defined, the user’s work is finished;
TEDDI easily turns the sequence data into a simple factor graph sequence chain for our
tamper eventEc (which is shown in Figure 8.1) using the indicatorso, l, m, andp.
Next, TEDDI produces a logical representation for our credential heist:
• The eventEc is defined by the indicator sequenceolmp, whereo represents the open-
ing of the device,l represents the presence of light,m represents the the piercing of
the sensor mesh, andp represents device probing.
• We defineI as the set ofk time periods{I1, . . . , Ik} when the indicatori was present.
(In our case,k = 5, as we only save and consider the last five periods an indicator is
present.) Each periodIj in I has the following attributes:
– s(Ij): The start time ofIj.
– e(Ij): The end time ofIj.
In addition, we useX ′ to represent a single time period within the setX, and define
w(x, y) as the time window for two adjacent indicatorsx andy.
• We say thatEc occurs if all of the indicators that make upEc appear in the proper
order and within the appropriate time windows.
The final predicate is arranged as follows:
105
∃ P ′ ∈ P ∧
∃ M ′ ∈ M ∧ (s(M ′) ≤ s(P ′) ≤ (e(M ′) + w(m, p))) ∧
∃ O′ ∈ O ∧ (s(O′) ≤ s(L′) ≤ (e(O′) + w(o, l))) ⇒ Em
(8.6)
From here, the predicates are encoded in our TIPs and TDPs.
8.6 Summary: Scenarios 3-4
Our breakdown of the prior two scenarios addresses the following points of the grid de-
fender’s dilemma:
Current protection systems lack the power and/or context todifferentiate between
important tamper events. TEDDI overcomes this hurdle because its distributed
setup improves our information-gathering capabilities over a single-device tamper
system, and allows us to capture the presence of distributedand context-dependent
events.
In these scenarios, for example, the two events are very similar, and only differenti-
ated by an external event. Most tamper protections systems do not have the capability
to gather the necessary contextual information to differentiate these two events, and
thus must choose arbitrarily how to treat these events when they occur. TEDDI, on
115
the other hand, is able to gather the necessary context (in these cases, querying an
incident database to learn about scheduled service), allowing it to make a proper
decision for the situation.
Current protection systems treat any sort of tampering as malicious. Other protec-
tion systems are unable to tailor their response based on whether an event is benign
or malicious, and would have to treat both the same way. TEDDI, however, has the
power to enact the proper response to either case (here, we can choose from infor-
mation alerts or more active responses like network filtering), and the defender does
not have to risk ignoring an attacker or unnecessarily reducing grid availability.
Current protection systems have either no response or a single response. Either a
system can only detect when an event is happening (and thus gives an attacker a
window to act before a grid defender can respond), or they have a single response to
handle any sort of tampering (meaning the defenders risks overreacting to a benign
event). TEDDI, as discussed in the previous point, gives a grid defender the flexibility
to craft enough responses to handle events in whatever manner is needed.
8.7 Scenario 5: Taum Sauk Dam Overflow
For our fifth case study, we examine the structural failure atthe Taum Sauk hydroelec-
tric facility. While TEDDI may not be able to stop this incident using the facility’s 2006
monitoring setup,4 the breakdown of the failure suggests that we can cover the accident
using a three-step indicator sequence that includes a regional indicator as its closing step.
We start by making a slight change to the facility’s pre-failure transducer setup, where the
three transducers are enclosed inside a single protective pipe [62]. Instead, wedistribute
transducers around the reservoir to gain a wider view of whatthe water level may be. We
4Admittedly, we have the benefit of hindsight when approaching this event. Had the event not occurred inthe first place, we may not have had such a clear idea of how to sense it.
116
then construct our event sequence as follows:
• Our monitors include the existing transducers (now in new locations) and a sensor
placed on the cables holding the transducer pipes into place(to tell us whether the
pipe is secured or free). Each transducer setup is assigned aTIP.
• Our local indicators include “Cable Loose” and “Normal Water Level.” We also have
a regional indicator “High Water Level,” for detecting if the majority of sensors see
the water level as too high.
• Our exact sequence for our eventEw is as follows: “Cable Loose” (c), then “Nor-
mal Water Level” (n), and then our regional “High Water Level” (h). This let us
capture the event where the transducer pipe has come loose, and a transducer has
moved enough to give us falsely-normal readings when the water level is actually
dangerously high.5
The thresholds for this scenario are easier to set than in theprevious case studies:
Whether a cable has come loose is a binary event, and the properreservoir water level has
already been determined. (These levels were set just short of 1600 feet when the disaster
occurred, but the resulting study found that these levels were too high to allow for potential
mistakes [62], so they have probably been lowered since then.) The response to this event
is similarly straightforward: Stop pumping water to the upper reservoir immediately, and
alert facility staff that one of the sensors requires maintenance.
For our time windows, we start by setting our window between the loose cable and the
local water level reading to be very long (on the order of months, if not years), as it may
take a long time for the transducers to rise to an unsafe levelone it breaks loose. On the
other hand, the window between the normal local and abnormalregional readings will be
very short (a few seconds), as the local level will not stop reporting erroneous water levels
5Note that this is not actually a case of monitor failure; rather, the monitor’s readings are wrong becauseof incorrect assumptions—i.e., the sensor has been moved without its knowledge.
117
h? n? c?
E
Figure 8.5: A diagram of the factor graph sequence used to represent the Taum Sauk DamOverflow.
once it starts (and thus the normal local and abnormal regional readings will be present
simultaneously).
Our factor graph sequence for this event is shown in Figure 8.5.
Our logical equation breaks down like this: The eventEw is defined by the indicator
sequencecnh, and state thatEw occurs when there exists time periodsH ′ ∈ H, N ′ ∈ N ,
andC ′ ∈ C such that they occur in the proper order and within the propertime windows.
∃ H ′ ∈ H ∧
∃ N ′ ∈ N ∧ (s(N ′) ≤ s(H ′) ≤ (e(N ′) + w(n, h))) ∧
∃ C ′ ∈ C ∧ (s(C ′) ≤ s(N ′) ≤ (e(C ′) + w(c, n))) ⇒ Ew
(8.7)
This scenario highlights how TEDDI handles the following points of the grid defender’s
dilemma:
Current protection systems lack the power and/or context todifferentiate between
important tamper events. Once again, we see that a regional event, which a number
of tamper protection systems do not have the ability to detect, plays an important role
in identifying an event. TEDDI’s distributed setup gives itthe upper hand over prior
work by allowing the user to collect the contextual information they need.
Current protection systems treat any sort of tampering as malicious. The overfill-
ing of the Taum Sauk upper reservoir was a mechanical failure, not an attack, and
responding to it as if an active adversary were in the system (for example, isolating
118
the facility from the grid) could reduce the availability ofthis system longer than
needed. TEDDI, on the other hand, allows the grid defender todefine and handle
non-malicious events (unlike many other protection systems), and the problem can
be pinpointed and fixed with minimal downtime.
8.8 Other Tamper Scenarios
For the sake of completeness, we offer a brief summary of how TEDDI handles the re-
maining scenarios from Chapter 3, including the indicators,graph sequences, and logical
equations that are involved.
8.8.1 Simple User Data Heist
Indicator Sequence:An attacker must firstopen(o) the case of the device, letlight (l)
into the device as they locate the memory chip with the data they want, and then
placeprobes(pr) onto the chip to collect the data when it appears.
Monitors: We will need a cover switch or seal to detect when the device isopened, a
photosensor to catch the light that reaches the device’s circuitry, and a probe sensor,
such as a piezo-electric sheet [151], to alert when a probe has been placed on the
device.
Time Windows: The windows for this sequence will be relatively short: We expect the
light to stream in soon after the case is cracked open, and while the probes make take
some time to place, the attacker will be motivated to finish the attack quickly, as they
do not need to be present as the probes wait for the desired information. Therefore,
we choose to set the open-light window at sixty seconds, and the light-probe window
at ten minutes.
119
Responses:For our response, we choose to log the event, flag the device for maintenance,
and hold off on having the device report its data back to the control center (or perhaps
only report a subset of this data until the device is confirmedto be safe).
Graph Sequence:The graph sequence for our eventEsh is as follows:
Indicator Sequence: Here, the attackershakes(s) the box with its drilling, avoids the
cover switch, letslight (l) into the box, anddisconnects(d) the edge device.
Monitors: For this sequence, we need an accelerometer, photosensor, and network cable
monitor to detect this sequence. (We assume we have a cover switch as well, if for
no other reason than for the attacker to target it.)
Time Windows: The shake-light time window will be much longer than in the Schweitzer
Scenario (i.e. 3-4 hours, if not longer), as the attacker will have to apply the glue to
the cover switch by aiming through a small hole, and then waitfor the glue to set
and disable the switch. Once the attacker opens the box, however, they will move
123
quickly to plug in their own device, and thus the light-disconnect window will be
short (perhaps five minutes at most).
Responses:Much like in the Schweitzer Scenario, the traffic coming fromthe edge de-
vice’s access point will be either filtered or dropped, and the certificate used by the
edge device for authentication may also be revoked.
Graph Sequence:We define the graph sequence for our eventE3s as follows:
d? ? s?START
E3s
∃ D′ ∈ D ∧
∃ L′ ∈ L ∧ (s(L′) ≤ s(D′) ≤ (e(L′) + w(l, d))) ∧
∃ S ′ ∈ S ∧ (s(S ′) ≤ s(L′) ≤ (e(S ′) + w(s, l))) ⇒ E3s
(8.12)
8.8.6 Earthquake
Indicator Sequence:Here, we look forlocal shaking(ls) at the edge device level, and
then check to see ifregional shaking(rs) is present (i.e., many devices are shaking).
(For this event, we define “shaking” as any acceleration values that rate a four (IV)
or above on the Mercalli scale [137].)
Monitors: We only need an accelerometer here, as both the local and regional indicators
in our sequence are based on its readings.
Time Windows: The shaking at all of the devices should occur at roughly the same time,
so the time window betweenLS andRS will be very small (five to ten seconds).
Responses:For this event, we want to alert the utility to its presence, and perhaps initiate
a disaster response protocol to prepare for potential service losses.
124
Graph Sequence:We construct our graph sequence for the eventEeq as follows:
rs? s?START
Eeq
Logical Sequence:
∃ RS ′ ∈ RS ∧
∃ LS ′ ∈ LS ∧ (s(LS ′) ≤ s(RS) ≤ (e(LS ′) + w(ls, rs))) ⇒ Eeq
(8.13)
8.9 Overall Summary
The above scenarios demonstrate how TEDDI (nearly) solves the grid defender’s dilemma:
• TEDDI can gather the necessary context information neededto differentiate between
important tamper events.
• TEDDI does not force us to treat any tampering as malicious.
• TEDDI provides a flexible response strategy to allow operators to deal with events
with exactly the right amount of severity.
• TEDDI can intervene earlier in the kill chain [54] of an attack than many other pro-
tection systems.
• TEDDI reduces the amount of manual configuration needed to define a protection
system for any arbitrary SCADA system.
However, there is one final point in the dilemma that we need toconsider: Does TEDDI
adhere to the strict performance constraints of the power grid? We address this question,
as well as take a closer look at the amount of effort required to configure and use TEDDI,
in the next chapter.
125
Chapter 9
Evaluation
In this chapter, we evaluate TEDDI’s performance in three areas: speed, accuracy, and
configuration resource requirements. In each case, we find that TEDDI has equal or better
performance than existing tamper solutions, all while adhering to the strict constraints of
the power grid.
9.1 A Word on System Comparison
In looking through the prior work on this subject, a concerning trend emerges: The speed
and performance evaluations of these systems are not alwaysrigorous, and are sometimes
non-existent (and in the case of usability analyses,alwaysnon-existent). Table 9.1 offers a
sampling of prior evaluations.
While we cannot definitively say why evaluations in this area are so spare, we can offer
some theories:
• Some of these systems are proposals (for example, EBTA [146]and CAPMS [138]),
and do not have a proof-of-concept implementation to evaluate.
• In our discussions with industry representatives, we found that they were loathe to
126
Table 9.1: A sampling of some of the evaluation results from prior protection solutions.
System Accuracy Performance
RRE [161] None Calculates optimal response actions for900-node tree in under 45 secs; generatesmodel for 330K nodes in under 24 ms
EBTA [146] None NonePAC [141] Detected 1 of 1 attacks NoneSCADA-Hawk [123] Detected 1 of 1 attacks NoneAmilyzer [14] Detected 4 of 4 attacks No hard numbers, but scaled to 32K nodes
in real meter deploymentPQS [105] Detected 1 of 1 attacks When facing a DOS, takes 30 secs to
switch to ‘Questionable,’ and 19 secs tothen switch to ‘Compromised’
SCPSE [162] Detected 3 of 3 attacks Took about .08 secs per state to locatebad data; upper bound of about 11.7 secsfor finding bad data in each state; generatesan attack graph template for 3500 nodes inroughly 1200 ms
Edwards [39] 89.75% accuracy against Nonethree intruder platforms
Kenaza et al. [64] Roughly 76% accuracy Noneagainst six attacks after16 test iterations
Boggs et al. [17] 0.03% FP rate; true Average of 4,579.85 minutespositive rate unknown between similar alerts from separatesites(no ground truth)
Neves and Araujo [85] No attacks considered Cost classified as free/cheapCollberg et al. [29] Blocked 8 of 8 attacks Code breakdown adds 5-20% overhead;
latency cost dominated by compilation(≈ 1 sec per function)
ADSDB [8] Defeated 4 of 5 attacks Only production costs consideredGCK [43] Defeated 3 of 3 attacks Overhead ranged from 90–969µsTLP [131] Resisted 4 of 4 attacks Added 1 sec to bzip runtime
in slowest configurationIBM 4758 [120] Defeated 7 of 7 attacks Immediate secret zeroizationDragone [37] Detected 1 of 1 attacks NoneMegalingam et al. [78] Detected 1 of 1 attacks Tamper detection speed not testedDesai [36] Defeated 2 of 2 attacks Speed not evaluated, but hardware
overhead≤ 10% for each techniquePatagonix [72] Defeated 9 of 9 rootkits Averages≤ 160µs to identify code;
imposed up to 30% overhead on appsSRID [145] Detected 23 of 24 attacks and None
49 of 56 attack originsAutoscopy Detected 15 of 15 rootkits [100] Imposed less than5% overhead [99]Roosta et al. [106] Defeats 6 of 6 attacks NoneDussel et al. [38] Detected 8 of 8 attacks; Throughput up to 429.1 Mbps
≤ .1 avg FP rate on 13 othersCAPMS [138] None NoneBRIDS [81] 26 attacks considered None
across 3 devices; at least 92%detection accuracy per device
127
discuss specific examples of attacks on their systems, and consequently real examples
of attacks are very hard to come by. This may explain the limited number of attacks
used for evaluation in prior work.
• Performance evaluations are often considered secondary to accuracy results, since a
fast system that does a poor job of detecting attacks is of no use to anyone. This
attitude, however, is counterproductive in a power grid setting, where performance is
just as important (and perhaps more important) than accuracy.
Overall, prior work in this space does not provide a great basis to use for compari-
son with TEDDI. Therefore, our evaluations will instead be geared towards answering the
following questions:
1. Can we achieve a correct event decision rate of 90% or better?We derive this
rate from the accuracy rate of BRIDS [81] and the false-positive rate of Dussel et
al. [38].
2. Can we process our factor graphs and come up with an event decision in under
400 µs? This number comes from IEEE Standard 1646-2004 [56], where several
types of substation communication have an upper bound of 8 mson delivery time, and
from Autoscopy Jr. [99], where we state that we want to incur less than 5% overhead
(400µs is 5% of 8 ms). (Unlike our indicator windows, factor graph processing time
may get in the way of an edge device’s primary function, whichis why we want to
keep this time as short as possible.)
In addition, we wish to examine the amount of effort requiredto configure our system,
an attribute that is not considered by any of the prior work inthis space. To accomplish this
task, we examine a sample case study to see how easy it is to translate a problem within
the narrative into a workable protection system using TEDDI, as opposed to using other
similar protection solutions. More specifically, we attempt to answer the question“Given
128
a small set of events, can a grid defender create a TEDDI system that detects these
events with less time/resources than if we used another system?”
With our three questions in hand, we now evaluate TEDDI to seehow well we can
answer them.
9.2 Detection Accuracy
Because of our distributed setup, we need to evaluate TEDDI’saccuracy at both the TIP
and the TDP levels.
9.2.1 TIP Event Detection
We set up our TIP testing as follows:
• We configured a single TIP to read from ten different monitors, with each moni-
tor containing either a zero or one. All of the monitors were simulated using text
files, mimicking Linux’s habit of representing external devices as files in the/dev
directory.
• The TIP was given a ten-function-node1 factor graph, where each node in the graph
represented a unique indicator. In alignment with the monitors, each indicator had a
threshold of one, and were said to be present if the corresponding monitor contained
that value.
• The graph itself contained four events: Three local eventsdefined by three-indicator
sequences that could be definitively identified by the TIP, and a fourth event defined
by a single regional indicator. The time windows for the local sequences ranged from
1While factor graphs have both function and variable nodes, recall that variable nodes are mostly place-holders in our system, and thus do not incur any computational cost.
129
seven to sixty seconds. The regional event was the lowest-priority event of the four,
and while it was primarily targeted at our TDP testing, it wasstill important to know
if the TIP would recognize the possibility of a larger event and properly defer to the
TDP.
• The TIP test consisted of one hundred rounds, each of which lasted ten seconds. In
each round, for each monitor, we randomly select a value (either 0 or 1) correspond-
ing to whether or not the given indicator will be present or absent in this round. Our
data generation model can be considered a zero-order approximation, in which both 0
or 1 are equally likely to be selected [94]. We choose this model rather than a larger-
order approximation because we do not have any ground truth data on how often
these indicators appear in real environments, and thus cannot make any assumptions
about how likely an indicator is to appear.
We obtain our random data by drawing a byte from/dev/urandom , dividing by
two, and placing the remainder into the proper monitor file, and we repeat this process
for all of the system’s monitors. These files were then read atthree-second intervals
by the TIP, meaning that the files could be read three or four times in a single round.
This meant that the TIP’s event decisions could change even when the monitor data
did not, as indicators that are not currently present may eventually fall out of the
prescribed windows.
For example, consider the indicator sequenceAB, where the allowed time window
betweenA andB is 5 seconds. If a round change causesA to flip from present
to absent andB to flip from absent to present, the first two the TIP reads the data
(assuming the TIP had been reading the data prior to the change, and reads the data
immediately after it changes), the event will be consideredpresent becauseA was
last seen 3 seconds ago. The next time the data is read, however, the event will be
considered absent becauseA’s last sighting would now be six seconds ago.)
130
• The data from each round and decision were manually verifiedafter the tests to deter-
mine what the correct event decision should be, and see how well the TIP performed.
Over the course of the one hundred rounds, the TIP made a totalof 332 event decisions.
Of these, 329 of the decisions matched our manual analysis, giving us an accuracy rate
(99.1%) that far exceeds our 90% goal. Our incorrect decisions were concentrated in a
single round, meaning that we achieved 100% accuracy in ninety-nine of our one hundred
rounds.
While these numbers are more than satisfactory, they beg the question: What happened
in that one round (Round 71, to be specific) that threw off our decision engine? It turns out
that this round exposes a limitation in our TIP prototype, one whose solution could create
a significant performance issue.
The Curious Case of Round 71
First, for the sake of clarity, we label our events and sequences as follows:
• Our highest-priority event is labeledEvent 1, and is defined by the indicator sequence
ABC.
• Our second-highest priority event,Event 2, and is defined by the indicator sequence
DEF .
• Our third-highest priority event,Event 3, and is defined by the indicator sequence
GHI.
• Finally, our regional eventEvent Rhas the the lowest priority, and is defined by the
regional indicatorJ . If none of the other events are present, the TIP must therefore
send an alert to the TDP and let it decide ifR is present.
131
At the start of Round 71, the TIP looked to see if the final indicator of any of these
sequences were currently present. IndicatorsC andI were absent for this round, which left
events 2 andR as the only possible decisions.
IndicatorF was present in Round 71, butD andE were not, leading TEDDI to consult
its history counters. The maximum-allowed time window forF andE was twenty-five
seconds, and the history counters showed that two prior instances ofE fell within this
window: one at Round 70 (3-12 seconds before 71) and one at Round68 (24 seconds).
The error arose in TEDDI’s selection of the instance ofE to use for event detection. Our
prototype was constructed to select themost recentinstance of an indicator when looking
for event sequences, which meant that TEDDI selected theE from Round 70 to continue
its search from. However, the most recent occurrence ofD happened in Round 67, and
the maximum time window allowed betweenD andE was only ten seconds. This led
TEDDI to conclude that Event 2 was not present, and it asked its TDP to look for EventR.
However, had TEDDI continued searching using theE instance from Round 68, it would
have found thatD fell within the proper time window, and made the correct decision that
Event 2 was present.
The simple solution to this problem is to have TEDDI look for events usingevery
viable indicator instance, rather than picking just one. However, this sort of setup leads
to a potentially exponential increase in the number of indicator instances to check: After
checking the last indicator in a sequence, our last-five history counter setup means that
there could be five instances to check for the next indicator,which could mean checking
twenty-five instances of the indicator beyond that, one hundred twenty-five beyond that,
and so on. While both our sequence chains and time windows wererelatively short for our
accuracy tests, having longer sequences and larger time windows increase the chances of
seeing the full exponential case.
132
Given the potential for such a solution to lead to performance issues in an industry that
is particularly sensitive to them, we decided that are most-recent-viable-indicator setup
was preferable to checking every viable indicator. However, the latter option could be
made more palatable by reducing the number of history counters we maintain (for example,
cutting down from five to two or three). Taking another approach with our algorithm may
also help mitigate this problem (for example, treating our graph as a state machine and
moving through it in real-time as indicators appear and disappear), but they would require
substantial changes to our data fusion structure.
The Danger of Too Few Time Periods
To test our theory about longer time window increasing our chances of seeing failures like
Round 71 above, we re-ran our accuracy tests with some small changes:
• The indicators and overall structure of our factor graph were not changed, but we
lengthened the time windows between indicators. For this test, they ranged from ten
to one hundred eighty seconds.
• We altered our round length to match our TDPs tests (see Section 9.2.2). Each round
now lasts three seconds, giving the TIP an entirely new dataset every time it checks
its monitors. We also increased the number of rounds from 100to 200 to see how
our TIP held up under long periods of rapidly-changing data.
Our TIP proved to be remarkably resilient to our changes: Despite the higher number of
rounds, longer time windows, and increased data variability, the TIP made the correct event
decision in 199 of 200 rounds (99.5%). Interestingly enough, our one incorrect decision
(once again involving Event 2 and itsDEF event sequence) came about for an unexpected
reason:
133
• At the time of our incorrect decision in Round 62, ourF indicator had been present
since Round 56. The first available time period forE that met our sequence criteria
(i.e., it started before Round 56, but within the sixty-second window allowed between
E andF ) was also fairly long, stretching from Rounds 46 to 55.
• IndicatorD had been present in Round 43, which fell well within the available time
window (in this case, 30 seconds before Round 46). However, inbetween Rounds
44 and 62,D had appeared and disappeared five separate times, meaning that D’s
presence in Round 43 was no longer stored in our history counters by the time we
reached Round 62.
• Because of our history counter limitation, TEDDI missed thepresence of Event 2,
and instead reported the presence of the lower-priority Event 3. If TEDDI had kept
six time periods in its history counters instead of five, the system would have been
able to capture Event 2’s presence.
This result suggests that we shouldincreasethe number of time periods we collect, con-
tradicting the conclusions we drew in our first test! Ultimately, the optimal number of time
periods required for event detection will depend on the environment of the edge device
(for example, do we expect indicators to appear and disappear rapidly near an edge de-
vice?), which suggests that the number of time periods should be a configurable parameter
in future iterations of our prototype.
Overall, however, the TIP make 528 correct event decisions in 532 opportunities, giving
us a final accuracy rate of 99.2%, far above the 90% threshold we sought to beat.
9.2.2 TDP Regional State Calculation
Since we had already evaluated factor graph accuracy in our TIP tests, we decided to focus
on the regional state calculations of the TDP, as this feature is the primary difference be-
134
tween our full and limited graphs. We used the same monitors,indicators, and factor graph
as with the TIP tests, so the TDP’s decision on whether or not EventR was present was
completely dependent on its ability to accurately calculate the regional state across all of
its TIPs.
For this test, we connected four TIPs (via wired network connections) to a single TDP.
This time, the test rounds were only three seconds long, potentially making the data differ-
ent every time the TIPs read from the monitors. Only the localindicator tied to our regional
indicatorJ received random data. Every other indicator was absent, ensuring that the TIPs
would keep going back to the TDP for assistance.
We ran our TDP test for fifty rounds, during which the TDP made 200 decisions on the
regional state of the TDPs. Afterwards, the results were again manually verified to validate
the TDP’s decisions. We found that the TDP correctly calculated the regional state, and
therefore made the correct event decision, in all 200 instances.
An important things to note here is how TIP synchronization (or lack thereof) affects
our regional state calculations. Ideally, the TIPs all collect and send their data at roughly
the same time, so that when a coordinated regional event occurs (such as an earthquake), all
of the data arrives within the 100 millisecond waiting time of the alert, and each TIP sees
the proper regional state. Otherwise, if the alerts are received one at a time, a regional event
will not be reported until half of the TIPs have sent in their data. (Network latency can also
cause problems, as alerts that have to travel over slower or more-congested networks may
not arrive within our waiting time. However, such latency would have to be persistent and
widespread to affect our calculations.)
135
9.3 System Performance
Next, we investigate the performance impact of TEDDI at the TIP, TDP, and Generation
Tool levels.
Factor Graph Performance
For the factor graph performance tests, we used the following hardware:
TIP: We used the Raspberry Pi 2 Model B [98] for our SCADA edge devices. We based
this decision on a conversation with one of our industry contacts, who stated that they
use Pis for edge device prototype development.
TDP: We used a a Dell Precision 340 desktop computer [34] equippedwith a 2 GHz
Pentium 4 processor and 1 GB of RAM, and running version 12.04 of the Ubuntu
operating system. While this machine is less powerful than the substation computers
available today (for example, the SEL 3355 can have either a dual-core 2.5GHz or
quad-core 2.1GHz processor as a base [111]), given the prevalence of weaker legacy
devices in the grid, we decided that using an early-2000s-era machine was accept-
able.
In the TIP test, we placed a TIP on three different Pis, connected them all to a single
TDP (again via wired connections), and had each TIP go through ten rounds of decision
making to see how long it took to traverse their factor graphs. For the TDP tests, we just
had a single TIP go through 30 rounds of decision making.
We began by using the factor graph from Section 9.2.1 for our performance tests, which
meant that the full and limited factor graphs had the same number of nodes (the difference
being that the TDP had enough information to make a decision upon reaching the last
node, whereas the TIPs did not). From here, we increased boththe number of events and
136
Table 9.2: A table of the factor graph processing times for both TIPs andTDPs.
the lengths of the indicator sequences in the graph (while still ensuring the full and limited
graphs had the same number of nodes), to observe how well our algorithm scaled. In all
cases, the TIP monitors were instrumented such that both theTIPs and TDP would be
forced to go through every node in their factor graph to make adecision.
We conducted four separate tests, each with a different sizeof factor graph (10, 26, 50,
and 99 function nodes). We feel that these sizes accurately reflect the graphs for real-world
networks, as most sequences appear to be fairly short (in fact, the longest sequence we
built in Chapter 8 was five function nodes long), meaning that these graph sizes give grid
defenders plenty of room to define 20–30 tamper events that they may be concerned about.
The results for the average factor graph processing time across all of the TIPs can be
seen in Figure 9.1 and Table 9.2. The processing time was lessfor smaller graphs, and
appeared to increase linearly as the graph size increased. For ten function nodes, our TIP
processed the graph in 111.083µs, while the TDP processed the graph in 53.338µs. For 26
nodes, the TIP needed 138.187µs, while the TDP required 70.668µs. The 50-node graph
took 161.461µs to walk through on the TIP, and 94.514µs on the TDP. Lastly, the TIP
processed our largest graph (99 nodes) in 232.586µs, while the TDP needed just 143.255
µs. On the whole, both the TIPs and TDP performed well even whenprocessing the larger
graph, and kept processing times comfortably underneath our 400µs limit.
137
Figure 9.1: Factor graph processing times for both TIPs and TDPs. Note that even in the99-node graph case, the times fall well within our 400µs limit.
138
TDP Placement Performance
While our TDP placement algorithm is run in an offline setting and therefore not subject to
the real-time performance demands of the power grid, it is still important that the algorithm
do its job within a reasonable amount of time. To verify that this is the case, we tested our
algorithm against a number of different network topologiesto see how well it performed.
We used three distinct topology types in our test runs:
Linear: The network nodes are arranged more or less in a single line. We chose to test
this topology because we received an example of a real substation network that was
arranged in this fashion.
Mesh: The network nodes are arranged in a grid pattern, and each node is connected
to its immediate neighbors. We took this topology choice from Ward [148], who
cited “conversations with industry contacts” [148] for choosing this topology for his
simulation.
Star: The network nodes are arranged in several tree-like structures, with a single central
node serving as the root for each tree. This topology also came from Ward [148] for
the same reasons as the mesh network.
We ran our tests using the Firefox Web Browser on two differentmachines: The Ubuntu
desktop machine used in Section 9.3, and a MacBook Pro runningOSX version 10.10 with
a 2.4 GHz processor and 4 GB of RAM.2 Each topology was tested at five different sizes,
and the time for each size/type combination was averaged over ten runs. The results of our
testing are shown in Figure 9.2 and Table 9.3.
Linear and mesh networks exhibited no difference in their placement times, with the
largest of the networks (a 128-node linear network) requiring only .583 seconds to deter-
2The browser versions for the original tests were not recorded; however, a re-run of selected topologiesusing browser version 45.0.1 on both Ubuntu and OSX generated similar times, and we saw no significantdifference between times across machines in either the original or subsequent tests.
139
mine where TDPs should live. Star networks, on the other hand, took a bit more time to
process—for example, a 120-node star network needed .749 seconds for TDP placement
despite having eight fewer nodes than the linear network mentioned previously. The reason
for this difference may lay with the number of TIP nodes in thenetwork, as our star net-
works tend to have a higher percentage of TIP nodes than the other topologies. (Intuitively
this makes sense, given that “leaf” nodes in a star network not only tend to make up the
largest group of nodes in the graph, but are also the places weexpect edge devices, and
therefore TIPs, to live.) TIP nodes require more processingin our TDP placement code
(for example, we need to figure out which TDP set to place them in, and then check the
entire set to see if any were excluded), and thus having more of them will slow down our
algorithm. As evidence, we note that our 84-node star network, which had 75 TIP nodes,
and our 128-node linear network, which had 72 TIPs, have verysimilar processing times
(.581 and .583 seconds, respectively).
One important point to note: Our test networks are a bit smallcompared to real-world
SCADA networks, which may explain the linear relationship wefound between network
size (specifically, the total number of network nodes) and the placement tool’s performance
(despite our expected quadratic relationship). To test ouralgorithm on a larger network, we
built a model based on the energy management (EM) network here at Dartmouth, which
was based on the information gathered from conversations with Dartmouth network op-
erators and features 441 nodes (400 of which are TIP nodes) arranged in a star topology.
Despite its size, however, the TDP Placement Tool was still able to calculate the optimal
TDP locations for the network in 2.811 seconds, which was only slightly higher than our
As a final test, we tripled the size of our EM example (1323 nodes) and ran it through
our placement tool. This larger network’s average TDP placement time (8.790 seconds)
is higher than our trendline predicted (8.221 seconds), butis small enough to suggest that
a linear model with a steeper slope is still a better fit than a quadratic model. (Indeed, if
140
Figure 9.2: TDP placement tool processing times for networks of different shapes andsizes. (Note that our real-life examples are excluded.) As showcased by the trendlines, thestar topologies took longer to process than the other networks.
the larger data points are included in our trendline calculations, the star trendline equation
shifts slightly toy = 0.0066x− .0201.) Further testing may be needed to pinpoint the best
growth model, but regardless of whether this trend is a linear or a slow-growing quadratic
relationship, the generated times do not suggest that the tool will become noticeably slow
for reasonably-sized SCADA networks.
While these numbers fall a bit short of the model generation times mentioned in Ta-
ble 9.1, they are not onerous, and are perfectly reasonable for a one-time, offline step.
Future testing on larger networks, however, may be needed.
141
Table 9.3: TDP placement processing times, including a large real-life example based onthe energy management network at Dartmouth.
Network Type Network Size Average TDP(# Nodes) Placement Performance
Linear 16 0.104 s32 0.173 s48 0.231 s96 0.414 s128 0.583 s
Star 19 0.139 s40 0.252 s60 0.387 s84 0.581 s120 0.749 s
EM Example 441 2.811 s(star)
1323 8.790 s
142
9.4 Usability Analysis
While we would like to provide a measurement of TEDDI’s usability using evaluation
criteria used by existing methods, tamper and intrusion protection systems often ignore
this issue; in fact,none of the related work in this area considers it in their evaluations.
However, some of the prior work in domain-specific languagesgives us a blueprint for our
own evaluation—namely, they use simple case studies to observe the improvements their
languages provide over prior work ([24, 130]).
Along those lines, we now consider a case study describing a tamper incident involving
edge devices in critical infrastructure, and see what time and/or data is required to construct
a TEDDI system to detect that event, versus building a similar protection system from
selected prior work. (While we found that industry members are loathe to discuss specific
tamper events that had affected their organizations, this fact does not impact our analysis.)
In addition to TEDDI, we examine the following five systems, which we believe are the
works within the SCADA protection space that are most similarto TEDDI:
• the Response and Recovery Engine (RRE) [161],
• the SCADA-Hawk system [123],
• Process Query Systems [105],
• the Probabilistic Alert Correlation system [141], and
• the Security-Oriented Cyber-Physical State Estimation system [162].
For this study, we determine the amount of information required to set up a working
protection system against the given event, and see how TEDDIfares in comparison to the
field. We begin by defining an example scenario with the following components:
143
• Edge Devices: The operator wants to protect a set of recloser controls mounted
within metal cabinets attached to utility poles.
• Events: The tamper events we are concerned about are:
1. The Schweitzer Scenario (Section 8.2),
2. A Malicious Firmware Attack (Section 8.5),
3. A Benign Firmware Update (Section 8.5),
4. An earthquake (Section 8.8), and
5. A (benign) local shake event (for example, shaking causedby a passing truck).
• Responses:We also have the following response possibilities:
1. Send a response back to the control center alerting them ofthe event.
2. Selectively filter network traffic coming from the device.
3. Passively monitor network traffic coming from the device.
4. Completely sever the network connection of the edge device.
5. Revoke the device’s credentials to send traffic on the SCADA network.
6. Delete any secret data (such as cryptographic keys) from the device.
7. Disable the external USB ports on the device.
(Note that taking no response is also an option.)
TEDDI: This scenario lines up nicely with the data required by FGDSL. We previously
defined the indicators and the sequences for events 1–4 in Section 8, and the shaking
events can be quickly defined as just local shaking.
Since we already require an accelerometer and a shaking indicator for the Schweitzer
scenario, the local shake event adds nothing extra to eitherour monitor set or our re-
sponse set (since we will take no action in response). Thresholds can be set relatively
144
low or high (or better yet, measured experimentally) to strike the proper balance
between false positive and negatives.
Now, we must rank the events to make sure that we always capture the most important
ones. We note that similar events need to be ranked such that TEDDI looks for the
more specific event first, which means that the benign firmwareupdate should be
checked before the malicious one, and the earthquake shouldbe checked before the
local shake. With this is mind, we rank the events like so:
1. The Schweitzer Scenario (Es).
2. The Benign Firmware Update (Eb).
3. The Malicious Firmware Attack (Em).
4. An Earthquake (Eq).
5. A Local Shake Event (El).
Once the events are defined and ranked, TEDDI can turn the datainto a suitable factor
graph, which is shown in Figure 9.3. (Note that the indicatorand event variable are
different than in Chapter 8; consult the figure key for more information.)
RRE: Much of the information required by the RRE is the same as TEDDI:indicators,
responses, assets to protect, etc [161]. However, there is one major difference: The
complete attack response trees (ARTs) used by the RRE have to bebuilt ahead of
time (as opposed to TEDDI, which needs the individual sequences but can combine
them automatically using its generation tool). For a simpleevent set, this is not a big
problem, but as the events become longer and more complex, a problem emerges:
• The RRE focuses on the overall security properties that the system wants to
maintain, anda separate tree must be maintained for each of these properties.
(The authors suggest using three to cover the classic confidentiality, integrity,
145
START
D? U?
R?U?L?
O? R? L?
O?L?
O?
Es
Eb
Em
Eq
El
Key
D
L
O
X
U
S(R)
S(L)
Network
Disconnect
Light
Cover
Open
S(L)?
Shaking
(Local)
Shaking
(Regional)
Scheduled
Service
(eXternal)
USB Cover
Removed
USB Device
Plugged In
Path If
Present
Path If
Absent
R
Figure 9.3: The full factor graph that TEDDI generates for the example inSection 9.4.Note that the limited factor graph would combineEb andEm, as well asEq andEl, becauseit would not be able to resolve external or global indicatorsand the events are otherwiseidentical.
146
and availability attributes, but in this case we would recommend slightly smaller
goals such as “Edge device compromised” or “Edge device bypassed.”) These
graphs, depending on the goals defined, could each wind up being as big as our
full factor graph. TEDDI, in contrast, requires only a single graph be configured
to cover the entire system.
• The RRE lacks an FGDSL-like system for simplifying the tree-building pro-
cess; in fact, the authors explicitly state that the “ART model in RRE’s global
server needs to be designed manually” [161]. This means thatthe operator
must go through the long and time-consuming process of hand-crafting their
own ARTs, and do it without the help of a tool like our generation tool.
• Finally, the presence of regional indicators means that tamper logic will have
to be split across the local and global detection engines, anadded hassle to
operators who are already manually defining their own ARTs. TEDDI, on the
other hand, relieves operators of this burden by building its own full and limited
factor graphs.
Additionally, the RRE makes use of a Bayesian classifier to guardagainst the chance
that an alert was sent in error, or the chance that an alert wasnot sent even though the
something bad actually occurred. While this feature may helpreduce potential false
positives and negatives, the classifier uses probabilitiesthat are “calculated based on
historical information about the system” [161], further increasing the amount of data
needed to allow the RRE to run.
Admittedly, RRE does offer some small advantages over TEDDI—for example, its
ability to assign responses to each individual step within the tree eliminates the need
for defining pre-events. On the whole, however, the drawbacks listed above make the
RRE a bit more cumbersome to use than TEDDI.
SCADA-Hawk: As an anomaly-based protection system, SCADA-Hawk’s biggest issue
147
is that it models “normal” behavior when verifying system actions [123]. These
models can be provided in two ways:
• The operator can manually define a sequence of events that feeds into SCADA-
Hawk as an example of normal behavior. This, however, requires the operator
to determine every possible normal behavior that can happenin the system,
and manually construct an example for each behavior to give to the system.
Defining such behaviors can be a tricky process, as it requires that the grid
defender have complete knowledge of the tasks performed by every device in
the network, and any behavior that is not defined may generatea false posi-
tive, potentially leading to increased costs and decreasedsystem availability.
In general, signature-based systems looking for bad behavior (such as TEDDI)
have lower false positive rates than anomaly-based systemsthat verify normal
behavior [68].
• The system can be placed into a learning mode, to record “snapshots” of nor-
mal behavior sequences. While this option is less time-consuming for the grid
defender than the prior one, it means the operator has to delay deployment un-
til SCADA-Hawk has seen enough system behavior before it can actually start
protecting the network. The length of this learning period is at best arbitrary,
as not allocating enough time to this task may mean legitimate but infrequent
behaviors are missed, and will later appear as false positives.
In short, operators who attempt to deploy SCADA-Hawk are forced to spend a long
period of time either training SCADA-Hawk or manually defining the system’s ex-
pected behavior, all with the risk of high false positive rates if either method does not
do enough to cover the system’s behavior space. With TEDDI, on the other hand, a
defender can select the events they are concerned about and get the system up and
running more quickly, and usually with fewer false positives.
148
PQS: On the surface, PQS [105] has many of the same usability benefits as TEDDI:
• The process models can be constructed using a number of different methods,
such as “state machines, formal language descriptions, Hidden Markov Models,
kinematic descriptions, or a set of rules” [105]. The systemeven has a special
markup language that these models are compiled into for submission to the
system.
• The process models can be quickly constructed using the data found within
a narrative. In the case of the Schweitzer scenario, the indicator sequence can
quickly be parsed out and translated into one of the PQS-friendly models above.
• Increasing the amount/complexity of sequences does not significantly increase
the complexity of the PQS model. Each event can be easily described in its own
model.
The issue with PQS, however, is similar to that of the RRE: It does not provide any
guidance as to how its models should be built—instead, it blindly uses the provided
models without providing any feedback as to their quality. TEDDI, in comparison,
goes a step farther by working with the user to build its sequences and using its
Response Suggestion Engine to help the user refine their models. By building a
modelwith TEDDI as opposed tofor PQS, the user finishes with a more-functional
model for their system.
PAC: The biggest issue with PAC [141] is that it relies on information that are not present
in our given set of events. More specifically:
“ [PAC uses]probabilistic methods for sensor correlation...Sensor cou-
pling in this fashion is easily expressed in Bayes formalisms; specifically,
the coupling is achieved by dynamically modifying priors inthe TCP ses-
sion monitor” [141].
149
PAC also requires that users define alert similarities for specific scenarios and min-
imum values that similarity scores must reach before being reported, but these are
analogous to the indicator sequences and monitor thresholds required by TEDDI.
This setup means that PAC requires some knowledge of the prior distribution regard-
ing how sensors relate to one another, data that cannot be obtained just from our set
of events. Much like SCADA-Hawk, this distribution data needs to be collected and
analyzed beforehand, increasing the time and effort neededto put PAC into place.
SCPSE: SCPSE holds an initial configuration advantage over the RRE, as the attack
graph templates (AGTs) used by SCPSE are generated automatically from the access
control rules of the network [162]. However, the drawback from our PAC analysis
also applies: To predict the attacker’s path through the network “a posterior probabil-
ity distribution over the AGT’s state space is calculated according to the false positive
and negative rates of the triggered and non-triggered IDS alerts, respectively” [162].
Again, such information is far beyond what the narrative canprovide, and also far
beyond what TEDDI requires to operate.
9.5 Summary
All together, our evaluation demonstrates that TEDDI answers all of our questions regard-
ing its speed, accuracy, and configuration requirements, and performs comparably or better
than current state-of-the-art protection solutions:
• We can process our factor graph fast enough to satisfy the constraints of the power
grid. In our tests, TEDDI processed even our largest factor graph (99 function nodes)
well within our 400µs limit.
• Our event detection accuracy rates compare favorably to other protection systems.
In our tests, TEDDI made the correct event decision (given 4 possible options) with
150
99.2% accuracy at the TIP level, and accurately computed theglobal state and made
the proper event decision 100% of the time at the TDP level.
• Our TEDDI Generation Tool gives us a distinct usability edge over comparable sys-
tems, which either need more resources or more time than TEDDI to put together a
protection plan.
These results suggest that TEDDI can operate effectively even under the constraints of
the power grid, and can be configured to do so with considerably less hassle than other
systems.
151
Chapter 10
Conclusions
In this thesis, we examined the need for securing edge devices installed in power grid
SCADA networks, and highlighted the consequences of failingto secure them adequately.
We introduced thegrid defender’s dilemma, a collection of conflicting interests that hin-
der grid defenders’ efforts to secure the grid by making protection systems designed for
standard IT networks infeasible to apply. We proposed a distributed, sensor-based method
of tamper protection as an alternative, and introduced our TEDDI system as a prototype
of such a method. We outlined the architecture of TEDDI, and described how its tamper
information points, decision points, and enforcement points work together to make deci-
sions and respond to the events it sees. We showed how TEDDI’simproved data-gathering
capabilities, flexible response strategy, and use of factorgraphs [42] for data fusion allow it
to work around all of the stumbling blocks that hinder prior work, and allow it to solve the
grid defender’s dilemma. We also proposed and developed theTEDDI Generation Tool, a
program that lets a grid operator easily define and configure TEDDI for their own unique
network, and outlined features such as FGDSL, the Response Suggestion Engine, the Net-
work Topology Uploader, and the TDP Placement Tool, all of which enhance the program’s
usability. Finally, we evaluated TEDDI’s performance and detection rate and analyzed its
usability, and demonstrated that the program is faster, more accurate, and required less
152
effort to use than prior work.
In the future, we would like to relax some of the assumptions TEDDI makes about the
network, as TEDDI’s success is heavily reliant on the underlying network and sensors:
• TEDDI assumes that a TIP will always be able to reach its TDP,but what could it do
if the connection were severed? Could it integrate itself into another TDP’s dataset,
or perhaps even work with other isolated TIPs to determine the regional state of the
system? A fair amount of work already exists in the distributed-decision-making field
(for example, Reidt, Srivatsa, and Balfe’s distributed key-revocation proposal [103]),
and some of these ideas could potentially be worked into TEDDI.
• TEDDI assumes that a monitor will always provide accurate readings, but what might
happen if a sensor fails or is compromised? Bad data detectionhas been studied
extensively in the fields of power system state estimation (for example, Niemira et
al.’s analysis of how both real and reactive power measurements are affected by bad
data injections [87]) and general sensor validation (such as Zhu et al.’s scheme for
validating data from individual sensors operating within asensor network [160]),
and incorporating this work into TEDDI may make the system more resilient against
crafty attackers.
• TEDDI assumes that attackers must compromise an edge device to reach a SCADA
network, but what if an attacker ignores the device entirelyand taps directly into the
SCADA network, or reaches the network via a device’s wirelessaccess point? Han-
dling this issue would likely require expanding TEDDI’s monitoring scope to include
network-specific indicators and look for malicious packets, much like Bro [21] and
Snort [121].
Additionally, including software or power-specific indicators in TEDDI’s detection
scheme would also be a useful nest step. Many protection systems, including TEDDI,
limit themselves to looking at specific type of indicators, such as software signals
153
or physical sensors. By incorporating both types of data intoa detection system,
however, we could further improve our event detection capabilities by using one
dataset to help confirm decisions based on the other, furthering our goal of accurate
event detection.
Finally, we would like to get TEDDI into the hands of as many power professionals as
possible, and evaluate TEDDI’s speed, accuracy, and usability within a realistic power grid
setting. While the industry professionals we demonstrated TEDDI for gave us very positive
feedback, and we performed our own analyses that showed how TEDDI bested prior work
in this front, we were not able to have grid defenders use TEDDI directly within their own
grid environments. Feedback from such hands-on tests wouldbe immensely valuable, and
would help us refine and enhance TEDDI’s features and make thesystem even more useful
for grid defenders.
We hope that TEDDI inspires others to take a harder look at howto secure SCADA
networks operating in the power grid. These networks have fundamentally different goals
and challenges than traditional IT networks, and simply taking a system that is designed
for a “normal” network and sticking it into the power grid maycause more harm than
good. However, we can applysomeexisting solutions to the grid defender’s dilemma, and
properly applying just the right ideas can strike a workablebalance between securing grid
networks and respecting their availability needs. With TEDDI, we show that striking such
a balance is possible, and take the first step towards finally securing some of our nation’s
most critical infrastructure.
154
Bibliography
[1] ABB. Why use reclosers?, 2016.http://www.abb.com/product/ap/


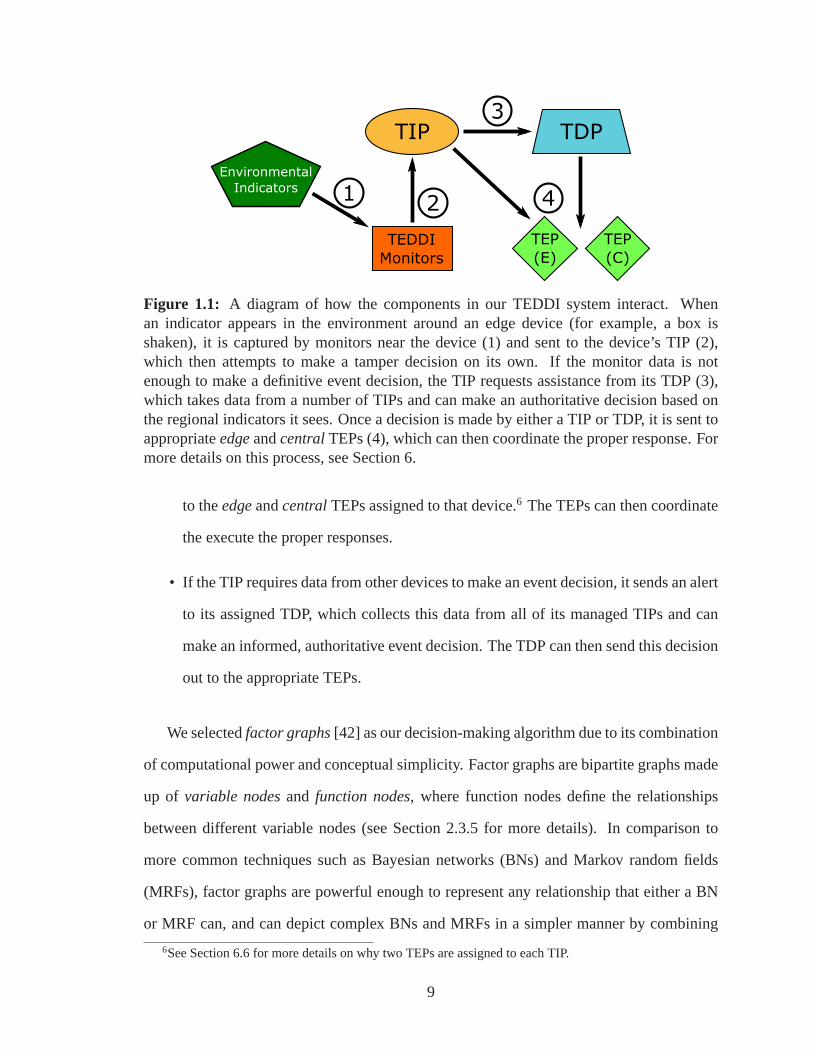


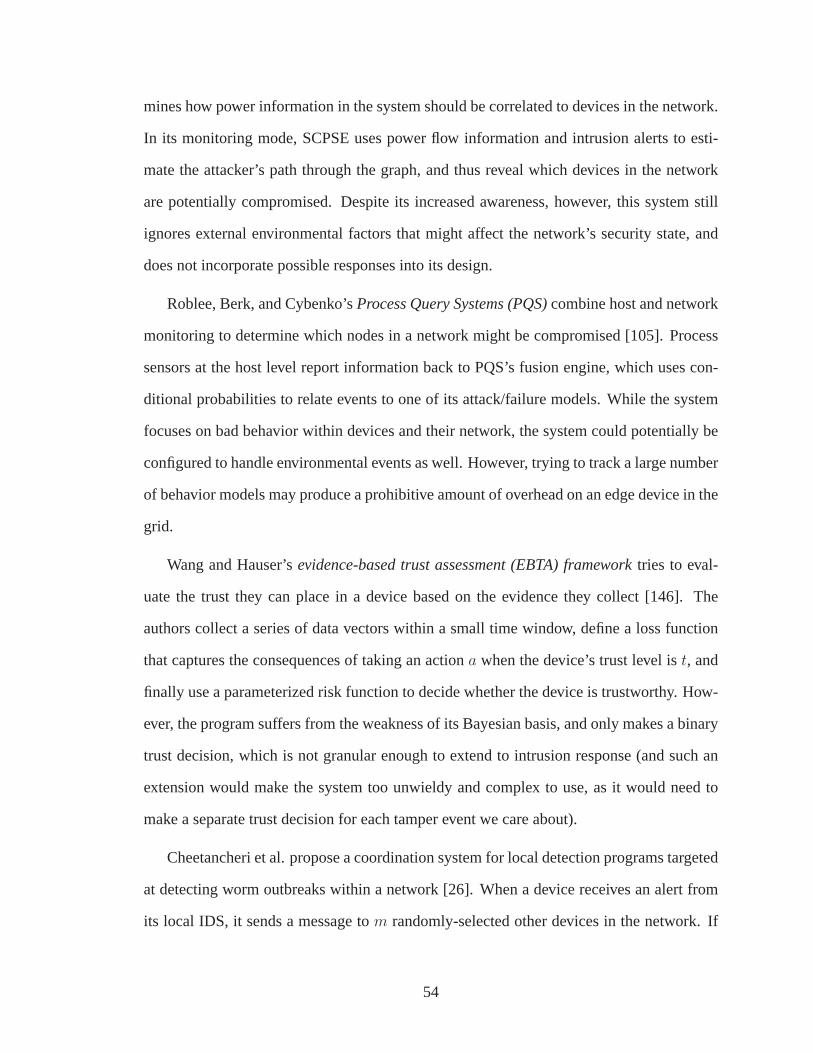


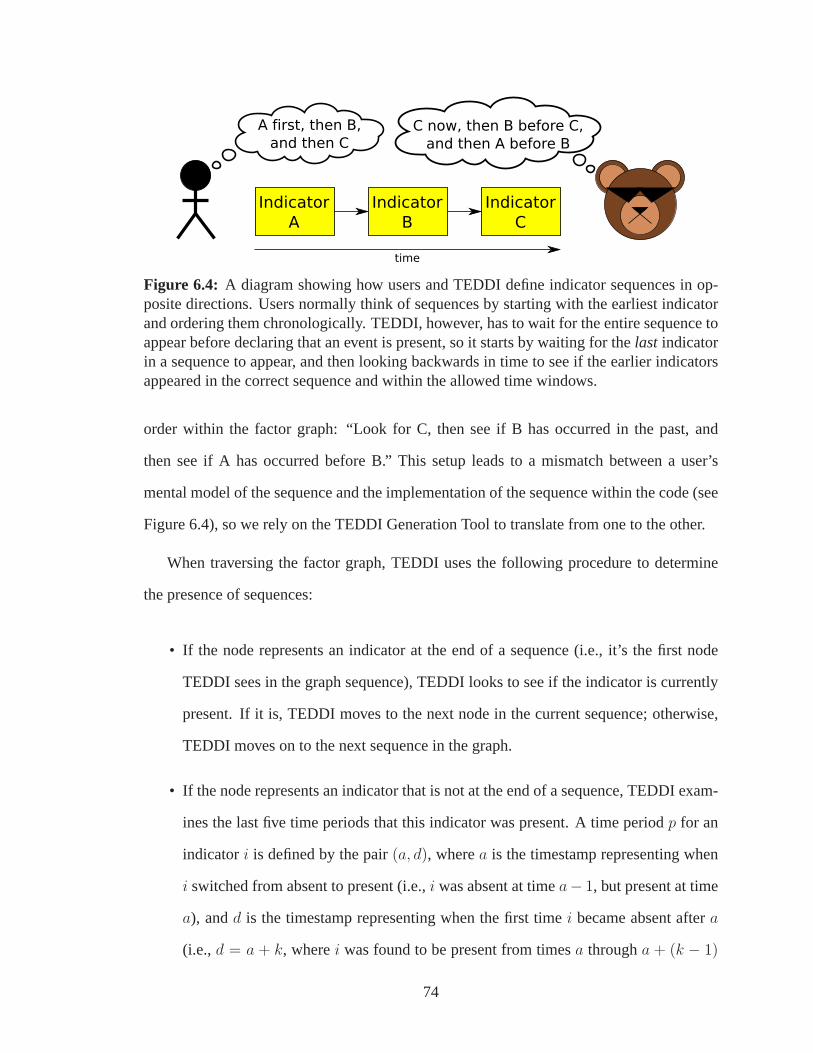


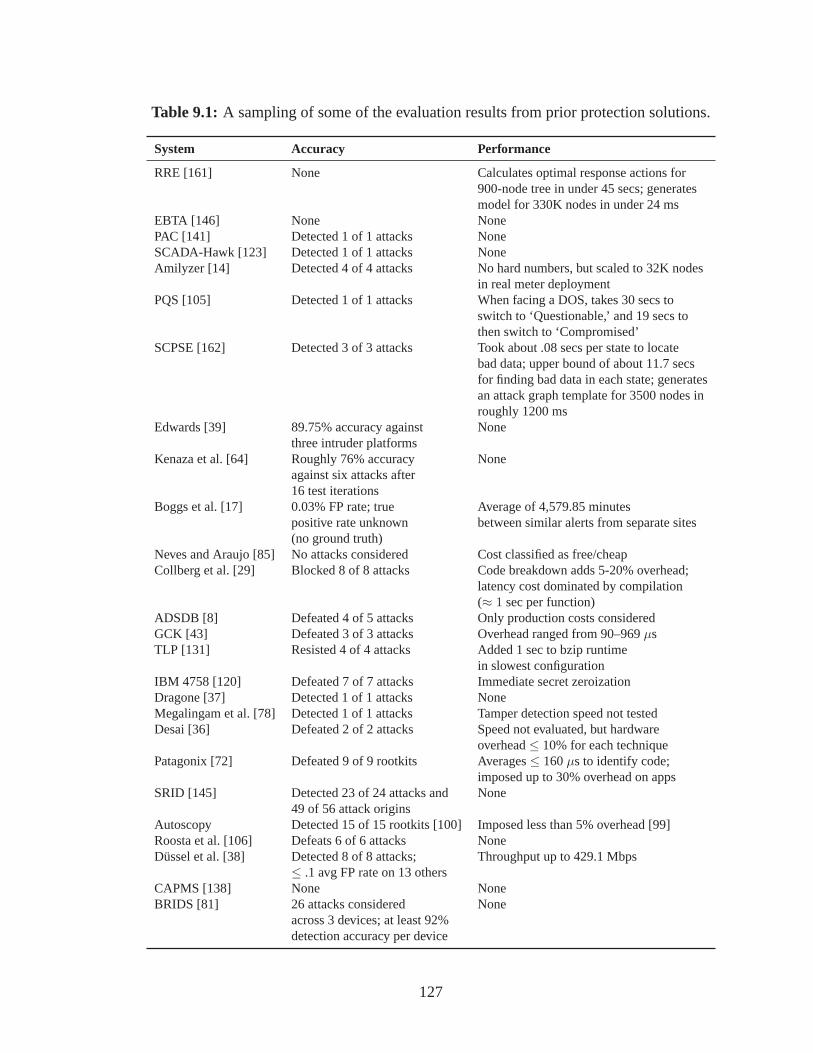


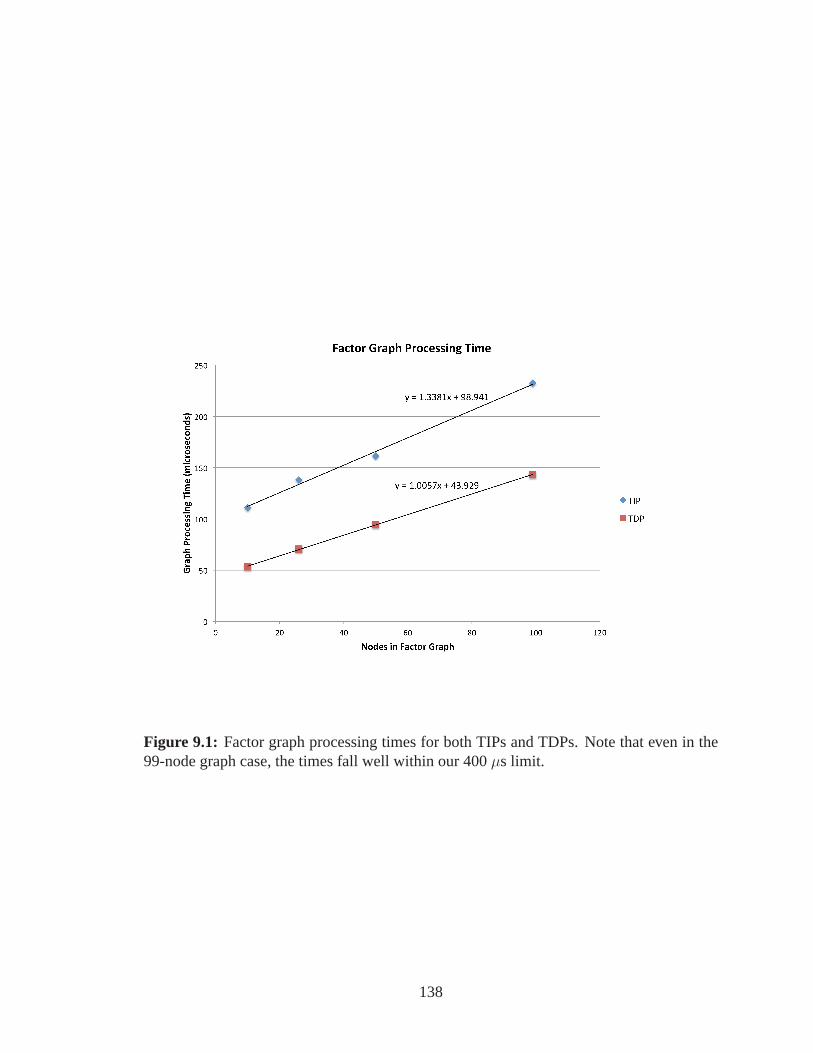


 6](ClO 4) 2 Crystal structure and phase transitions Joanna Hetman´czyk • Łukasz](https://static.documents.pub/doc/80x56/5cd1481b88c993230f8cba40/thermal-properties-of-polycrystalline-mnnh-clo-thermal-properties-of-polycrystalline.jpg)


