58
DARWIN FENNER FUND HEALTHCARE & CONSUMER STAPLES FINAL REPORT S&P 600 SMALL-CAP Brandon Bujnowski, Yuan (Miya) Meng, Chao Wang, Yinuo (Perfeeno) Wang April 30th, 2015
DARWIN FENNER FUND HEALTHCARE &
CONSUMER STAPLES FINAL REPORT
S&P 600 SMALL-CAP
Brandon Bujnowski, Yuan (Miya) Meng, Chao Wang, Yinuo (Perfeeno) Wang
April 30th, 2015
Small-Cap Portfolio: Healthcare & Consumer Staples
Page 1 of 57
3
HEALTHCARE 3
STOCK LIST 4
RECOMMENDATIONS 6 HEALTHCARE SECTOR ANALYSIS 6
STOCK PERFORMANCE SNAPSHOT 6
OVERVIEW 7
RELATIVE PERFORMANCE AND RISK 7
GROWTH/VALUE SECTOR CLASSIFICATION 9
OVERWEIGHT AND UNDERWEIGHT DECISION 10
HEALTHCARE SECTOR PROCESS FLOWCHART 11
QUANTITATIVE SCREENINGS AND ANALYSIS 12
STEP 0: CAPITALIZING R&D 12
STEP 1: FUNDAMENTAL GROWTH 12
RISK ANALYSIS: STEP Z: BANKRUPTCY RISK 14
STEP 2: VALUE OR GROWTH 14
STEP 3: PROFITABILITY 15
QUALITATIVE SCREENS & ANALYSIS 16 MACROECONOMIC DRIVERS 17
FIRM OPERATIONS 17
CORPORATE GOVERNANCE AND MANAGEMENT 18
FINANCIAL QUALITY 18
FIRM-SPECIFIC QUALITATIVE ANALYSIS TABLES 19
NATUS MEDICAL INC. (BABY) 20
MERIDIAN BIOSCIENCES INC. (VIVO) 20
SURMODICS INC. (SRDX) 21
ANIKA THERAPEUTICS INC. (ANIK) 22
EMERGENT BIOSOLUTIONS INC (EBS) 22 CAMBREX CORP. (CBM) 23
ALMOST FAMILY INC. (AFAM) 24
PHARMERICA CORP (PMC) 24 INVESTMENT IDEA SUMMARY 25
NATUS MEDICAL INC. (NASDAQ: BABY)- STRONG BUY 25
MERIDIAN BIOSCIENCE, INC. (NASDAQ: VIVO)- BUY 25
SURMODICS, INC. (NASDAQ: SRDX)- BUY 26
ANIKA THERAPEUTICS INC. (NASDAQ: ANIK)- DELETE 26
EMERGENT BIOSOLUTIONS INC (NASDAQ: EBS)- HOLD 26
CAMBREX CORP. (NASDAQ: CBM)- HOLD 26 ALMOST FAMILY INC. (NASDAQ: AFAM)- SELL 27
PHARMERICA CORP (NASDAQ: PMC)- SELL 27
Table of Contents

Small-Cap Portfolio: Healthcare & Consumer Staples
Page 2 of 57
CONSUMER STAPLES 28
STOCK LIST 29
RECOMMENDATIONS 30 HEALTHCARE SECTOR ANALYSIS 30
STOCK PERFORMANCE SNAPSHOT 30
OVERVIEW 31
RELATIVE PERFORMANCE AND RISK 31
GROWTH/VALUE SECTOR CLASSIFICATION 33
OVERWEIGHT AND UNDERWEIGHT DECISION 34 HEALTHCARE SECTOR PROCESS FLOWCHART 35
QUANTITATIVE SCREENINGS AND ANALYSIS 36
STEP 1: FUNDAMENTAL GROWTH 36
RISK ANALYSIS: STEP Z: BANKRUPTCY RISK 38 STEP 2: VALUE OR GROWTH 38
STEP 3: PROFITABILITY 39
QUALITATIVE SCREENS & ANALYSIS 40 MACROECONOMIC DRIVERS 40
FIRM OPERATIONS 40
CORPORATE GOVERNANCE AND MANAGEMENT 40
FINANCIAL QUALITY 41 FIRM-SPECIFIC QUALITATIVE ANALYSIS TABLES 42
B&G FOODS INC. (BGS) 43
SPARTNASH CO. (SPTN) 44 MEDIFAST INC. (MED) 45
INVESTMENT IDEA SUMMARY 45
B&G FOODS (NYSE: BGS)- BUY 45 SPARTANNASH CO. (NASDAQ: SPTN)- HOLD 46
MEDIFAST INC. (NYSE: MED)-STRONG SELL 46
REFERENCES 47
APPENDIX 48

Small-Cap Portfolio: Healthcare & Consumer Staples
Page 3 of 57
Healthcare

Small-Cap Portfolio: Healthcare & Consumer Staples
Page 4 of 57
TICKER NAME SUB-SECTOR
RGEN Repligen Biotechnology
SPPI Spectrum Pharmaceuticals Biotechnology
EBS Emergent Biosolutions Biotechnology
LGND Ligand Pharmaceuticals Biotechnology
MNTA Momenta Pharmaceuticals Biotechnology
ACOR Acorda Therapeutics Biotechnology
ACET Aceto Health Care Distributors
PMC PharMerica Health Care Distributors
BABY Natus Medical Health Care Equipment
ANGO AngioDynamics Health Care Equipment
ALOG Analogic Health Care Equipment
GB Greatbatch Health Care Equipment
IVC Invacare Health Care Equipment
NUVA NuVasive Health Care Equipment
IART Integra LifeSciences Holdings Health Care Equipment
CYNO Cynosure Health Care Equipment
MASI Masimo Health Care Equipment
ABAX Abaxis Health Care Equipment
ABMD ABIOMED Health Care Equipment
SRDX SurModics Health Care Equipment
CNMD CONMED Health Care Equipment
CMN Cantel Medical Health Care Equipment
CYBX Cyberonics Health Care Equipment
CRY CryoLife Health Care Equipment
HGR Hanger Health Care Facilities
SEM Select Medical Holdings Health Care Facilities
KND Kindred Healthcare Health Care Facilities
ENSG Ensign Group/The Health Care Facilities
AMSG Amsurg Health Care Facilities
CHE Chemed Health Care Services
PRSC Providence Service/The Health Care Services
CCRN Cross Country Healthcare Health Care Services
LDR Landauer Health Care Services
Stock List
Healthcare (71 Stocks)

Small-Cap Portfolio: Healthcare & Consumer Staples
Page 5 of 57
TICKER NAME SUB-SECTOR
AHS AMN Healthcare Services Health Care Services
LHCG LHC Group Health Care Services
IPCM IPC Healthcare Health Care Services
HWAY Healthways Health Care Services
AIRM Air Methods Health Care Services
BRLI Bio-Reference Laboratories Health Care Services
AMED Amedisys Health Care Services
CRVL CorVel Health Care Services
AFAM Almost Family Health Care Services
EXAM ExamWorks Group Health Care Services
ICUI ICU Medical Health Care Supplies
VIVO Meridian Bioscience Health Care Supplies
HAE Haemonetics Health Care Supplies
MMSI Merit Medical Systems Health Care Supplies
NEOG Neogen Health Care Supplies
VASC Vascular Solutions Health Care Supplies
WST West Pharmaceutical Services Health Care Supplies
ANIK Anika Therapeutics Health Care Supplies
OMCL Omnicell Health Care Technology
CPSI Computer Programs & Systems Health Care Technology
QSII Quality Systems Health Care Technology
MDSO Medidata Solutions Health Care Technology
HSTM HealthStream Health Care Technology
MDAS MedAssets Health Care Technology
LMNX Luminex Life Sciences Tools & Services
AFFX Affymetrix Life Sciences Tools & Services
PRXL PAREXEL International Life Sciences Tools & Services
AMRI Albany Molecular Research Life Sciences Tools & Services
CBM Cambrex Life Sciences Tools & Services
MGLN Magellan Health Managed Health Care
MOH Molina Healthcare Managed Health Care
ANIP ANI Pharmaceuticals Pharmaceuticals
LCI Lannett Co Pharmaceuticals
SGNT Sagent Pharmaceuticals Pharmaceuticals
DEPO Depomed Pharmaceuticals
PBH Prestige Brands Holdings Pharmaceuticals
IPXL Impax Laboratories Pharmaceuticals
MDCO Medicines Co/The Pharmaceuticals

Small-Cap Portfolio: Healthcare & Consumer Staples
Page 6 of 57
Table 1 illustrates all Buy, Hold, and Sell recommendations for the S&P 600 Healthcare stocks
covered in the quantitative and qualitative screens and analyses described in this report.
Table 1: Healthcare Sector Recommendations
Ticker Name Sub-industry Recommendation
BABY Natus Medical Inc. Healthcare Equipment STRONG BUY
VIVO Meridian Bioscience Inc. Healthcare Supplies BUY
SRDX SurModics Inc. Healthcare Equipment BUY
EBS Emergent Biosolutions Inc. Biotechnology HOLD
CBM Cambrex Corp. Life Science Tools & Services HOLD
PMC PharMerica Corp. Healthcare Distributors SELL
AFAM Almost Family Inc. Health Care Services STRONG SELL
Sector Performance Snapshot (as of February 22, 2015)
Previous 36 Month Data S&P 600 Healthcare
Alpha - 0.70%
CAPM Beta 1 0.95
Downside CAPM Beta 1 0.61
CAR - 23.02%
BAH Return 51.63% 89.18%
Abnormal BAH Return - 37.55%
Cumulative Wealth 1.516 1.89
Sharpe Ratio .34 .46
B-M Ratio 0.449 0.301
CF-P Ratio 0.071 0.045
E-P Ratio 0.034 0.019
Avg. Sales Growth (past 5 years) 27.93% 25.13%
Recommendations
Healthcare Sector Analysis

Small-Cap Portfolio: Healthcare & Consumer Staples
Page 7 of 57
Overview
The Healthcare sector of the S&P 600 consists of 71 firms and, as of February 22, 2015, makes
up 11.96% of the S&P 600 market capitalization. All data in this sector analysis section is
recorded as of February 22, 2015. The two sub-industry groups include:
Pharmaceuticals, Biotechnology, and Life Sciences Tools and Services.
Healthcare Facilities, Healthcare Equipment and Supplies, Healthcare Providers and
Services, and Healthcare Technology.
Figure 1: Healthcare Sub-Industry Weights
Relative Performance and Risk
The healthcare sector outperformed the S&P 600 over the past 36 months. As shown in Figure 5,
the cumulative wealth of healthcare has been dominating the S&P 600 over the past 36 months.
The cumulative market adjusted abnormal return is 23.02%. The buy and hold (BAH) return is
89.18%, higher than that of the S&P 600 (refer to Figure 3).
Biotechnology6.20%
Life Sciences Tools & Services
7.65%
Parmaceuticals12.98%
Healthcare Technology
8.21%
Healthcare Products & Services27.65%
Healthcare Equipment &
Supplies37.31%

Small-Cap Portfolio: Healthcare & Consumer Staples
Page 8 of 57
Figure 2: Cumulative Wealth over the Past 36 Months (Healthcare vs S&P 600)
Figure 3: Buy and Hold Return over the Past 36 Months (Healthcare vs S&P 600)
Concerning risk, the healthcare sector has a CAPM beta of 0.95, showing that the sector has a
slightly lower systematic risk than S&P 600. One possible explanation is that people are in need
of medical care and pharmaceuticals even in downward market periods. Therefore, stocks in the
healthcare sector are defensive, and are less sensitive to systematic risks.
Figure 4: Systematic Risk of Healthcare over the Past 36 Months
0.8
1
1.2
1.4
1.6
1.8
2
S&P 600 Healthcare
89.18%
51.63%
Buy and Hold Return
Healthcare S&P 600
10.95
S&P 600 HC

Small-Cap Portfolio: Healthcare & Consumer Staples
Page 9 of 57
Additionally, the sector has a downside beta of 0.62 over the past 36 months, lower than S&P
600, showing that the healthcare sector did not lose as much as S&P 600 in market downturns.
As mentioned before, the economic drivers of healthcare are increasing, preserving the sector
performance in a downward market periods. The upside beta of the healthcare sector is 1.18,
higher than 1, showing that when market returns were positive, the healthcare sector earned more
than the market on average. The higher-than-market upside beta leads to a CAPM beta close to 1.
Figure 5: Upside and Downside Betas for Healthcare over the Past 36 Months
Growth/Value Sector Classification
Using the S&P 600 as the benchmark, we first calculated the weighted average B/M ratio of the
S&P 600 and Healthcare sector. Results shown in Table 2 indicate that, comparing to the
benchmark, Healthcare is classified as a growth sector. We further tested the CF/P ratio and E/P
ratio (weighted average) for S&P 600 and Healthcare sector and found similar evidence.
Table 2: B/M, CF/P, and E/P ratio for S&P 600 and Healthcare
S&P 600 Healthcare G/V
B/M Ratio 0.449 0.301 G
CF/P Ratio 0.071 0.045 G
E/P Ratio 0.034 0.019 G
*Data source: Bloomberg, 02/22/2015
The B/M ratio, CF/P ratio, and E/P ratio have a good consistency in classifying the Healthcare
sector. Therefore, the Healthcare sector is classified as a growth sector.
1
1
0.62
1.18S&P 600 HC

Small-Cap Portfolio: Healthcare & Consumer Staples
Page 10 of 57
Overweight and Underweight Decision
Previously stated performance evidence and industry trends suggest that the Darwin Fenner Fund
(DFF) portfolio should overweight the healthcare sector.
Currently, the DFF has four healthcare sector stocks: Almost Family Inc., Cambrex Corp.,
Emergent Biosolutions Inc., and PharMerica Corp., weighing at 11.25% of the portfolio.
Similarly, the healthcare sector weight in the S&P 600 is 11.96%.
Several reasons can be used to explain the decision to overweight. First, economic drivers for
healthcare remain strong. The drivers, such as NHE and government budget, will take time to
boost revenue and stock price growth as the sector realizes a delayed impact. Second, the
population of senior citizens continues to rise. After the ACA was enacted and executed, more
previously uninsured people became included into the U.S. healthcare system, which will
increase industry revenue. And third, both the systematic and downside beta of the healthcare
sector over the past 36 months was lower than the S&P 600 benchmark, all the while producing a
significant, outperforming BAH return. Therefore, the Darwin Fenner Fund portfolio should
overweight the S&P 600 Healthcare sector.

Small-Cap Portfolio: Healthcare & Consumer Staples
Page 11 of 57
Healthcare Sector Process Flow Chart

Small-Cap Portfolio: Healthcare & Consumer Staples
Page 12 of 57
The quantitative screens are based on a theory of isolating firms that are increasingly financially
healthy, undervalued, and currently profitable. To begin, all stocks with an initial public offering
(IPO) within the last three years are eliminated prior to the remaining screening steps. After this
initial step, Sagent Pharmaceuticals (SGNT) was eliminated before any screens (also due to
lack of data available). The healthcare sector is unique in the sense that the firms spend various
amounts on research and development (R&D), including none at all. To control for R&D
spending, all R&D amounts are capitalized to account for total assets and net income. The
stocks then enter the firm fundamental stage and, based on variables that measure the change in a
firm’s financial ability, all stocks are ranked into quintiles. Each stock receives a score of 1 – 5
for each variable based on how well the stock ranked relative to other healthcare sector stocks.
After receiving scores for each variables, they are then weighted equally and summed up to
receive an aggregate score for each step. Below are the variables and methods used in Step 0:
Capitalize R&D and Step 1: Fundamental Growth:
Step 0: Capitalizing R&D
The healthcare sector is composed of several companies which may or may not develop patents
and new technology. Therefore, adjusting R&D expense for all companies is a key step to start
the quantitative screens. According to Chan, Lakonishok and Sougiannis, without capitalizing
R&D the book-to-market (B/M) ratio is distorted. Additionally, without adding back R&D
expense into earnings the cash flow-to-price (CF/P) ratio will also be distorted. The two
equations below were used to control for R&D expenses to create a fair screening process for
different types of firms, and the results are shown in Appendix _.
Adjusted Assets:
Adjusted Earnings:
Step 1: Fundamental Growth
The following growth variables are used to measure the trend in a company’s profitability,
financial health, and fundamental growth. Therefore, all variables are calculated by determining
the ratio for each of the past four years, calculating the change in each variable year over year,
and averaging the change over the last four years. Asness, Frazzini, and Pedersen (2014) and
Piotroski and So (2012) find that firm’s performing strongly under these variables statistically
generate higher abnormal returns. Step 1 results are shown in Exhibit 1 of the Appendix.
Quantitative Screens & Analysis

Small-Cap Portfolio: Healthcare & Consumer Staples
Page 13 of 57
Δ Return on Assets (ROA)
The change in ROA indicator measures the trend of management’s effectiveness in its ability to
generate revenue relative to the firm’s total assets during past years. ROA is calculated by:
𝑅𝑂𝐴 = 𝐴𝑑𝑗𝑢𝑠𝑡𝑒𝑑 𝑁𝑒𝑡 𝐼𝑛𝑐𝑜𝑚𝑒𝑡/(𝐴𝑑𝑗𝑢𝑠𝑡𝑒𝑑 𝐴𝑠𝑠𝑒𝑡𝑠𝑡−1 + 𝐴𝑑𝑗𝑢𝑠𝑡𝑒𝑑 𝐴𝑠𝑠𝑒𝑡𝑠𝑡
2)
An increasing ROA ratio earns a higher score.
Δ Gross Margin
The gross margin indicator measures the trend of a firm’s percentage of sales after subtracting
the cost of goods sold (COGS). A firm’s gross margin is an easy variable to illustrate how cost
effective a company can be. An increasing gross margin earns a higher score.
Δ Gross Profit Over Assets (GPOA)
According to Novy-Marx’s paper “The Other Side of Value” (2013), this indicator has the same
power as the B/M ratio. This ratio illustrates the trend of a company’s profit efficiency and
financial health over past years. A higher Δ GPOA earns a higher score. GPOA is calculated
by:
𝐺𝑃𝑂𝐴 = 𝐺𝑟𝑜𝑠𝑠 𝑃𝑟𝑜𝑓𝑖𝑡𝑡/𝐴𝑑𝑗𝑢𝑠𝑡𝑒𝑑 𝐴𝑠𝑠𝑒𝑡𝑠𝑡
Δ Asset Turnover
This indicator measures the trend of how efficiently a company takes advantage of its assets. A
high Δ asset turnover earns a higher score. Asset turnover is calculated by:
𝐴𝑠𝑠𝑒𝑡 𝑇𝑢𝑟𝑛𝑜𝑣𝑒𝑟 = 𝑅𝑒𝑣𝑒𝑛𝑢𝑒𝑡/(𝐴𝑑𝑗𝑢𝑠𝑡𝑒𝑑 𝐴𝑠𝑠𝑒𝑡𝑠𝑡−1 + 𝐴𝑑𝑗𝑢𝑠𝑡𝑒𝑑 𝐴𝑠𝑠𝑒𝑡𝑠𝑡
2)
Δ Leverage
This indicator implies the trends company’s ability to payback long-term debt in future.
According to Piotroski, the increasing number of leverage show a negative signal because the
additional borrowing adds pressure to company’s financial flexibility. So we give the highest
score to the company with the lowest ΔLeverage ratio.
Small-Cap Portfolio: Healthcare & Consumer Staples
Page 14 of 57
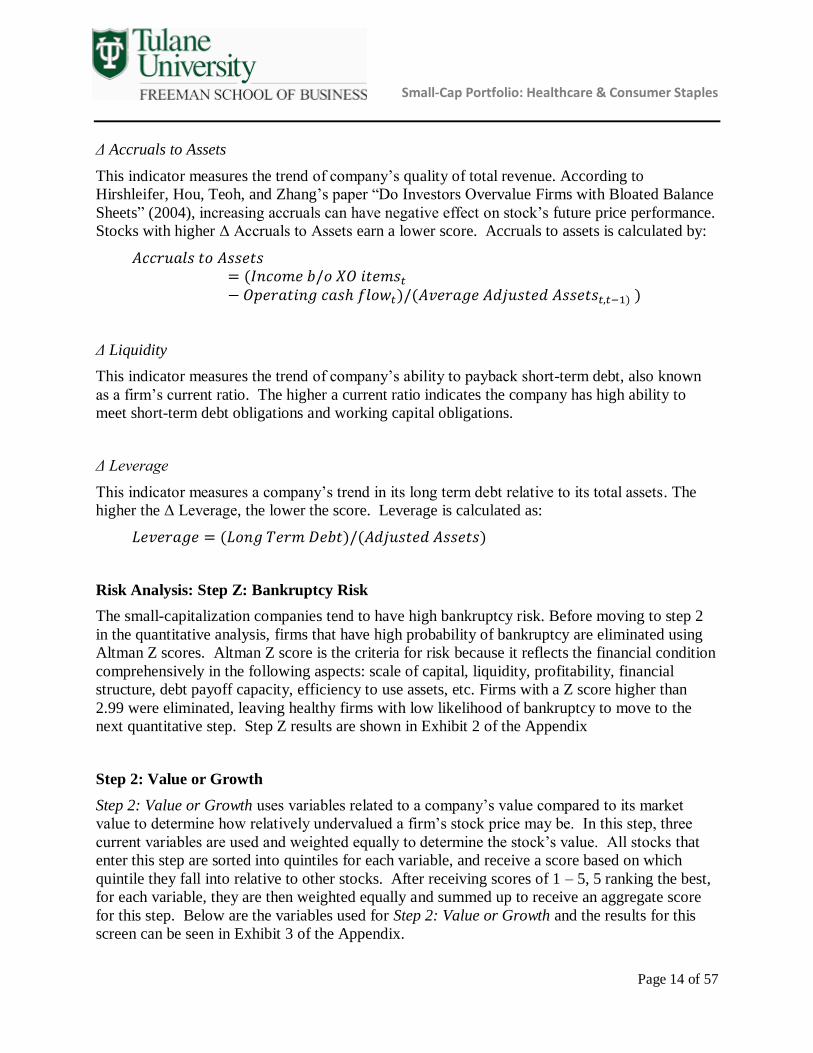
Δ Accruals to Assets
This indicator measures the trend of company’s quality of total revenue. According to
Hirshleifer, Hou, Teoh, and Zhang’s paper “Do Investors Overvalue Firms with Bloated Balance
Sheets” (2004), increasing accruals can have negative effect on stock’s future price performance.
Stocks with higher Δ Accruals to Assets earn a lower score. Accruals to assets is calculated by:
𝐴𝑐𝑐𝑟𝑢𝑎𝑙𝑠 𝑡𝑜 𝐴𝑠𝑠𝑒𝑡𝑠= (𝐼𝑛𝑐𝑜𝑚𝑒 𝑏/𝑜 𝑋𝑂 𝑖𝑡𝑒𝑚𝑠𝑡
− 𝑂𝑝𝑒𝑟𝑎𝑡𝑖𝑛𝑔 𝑐𝑎𝑠ℎ 𝑓𝑙𝑜𝑤𝑡)/(𝐴𝑣𝑒𝑟𝑎𝑔𝑒 𝐴𝑑𝑗𝑢𝑠𝑡𝑒𝑑 𝐴𝑠𝑠𝑒𝑡𝑠𝑡,𝑡−1) )
Δ Liquidity
This indicator measures the trend of company’s ability to payback short-term debt, also known
as a firm’s current ratio. The higher a current ratio indicates the company has high ability to
meet short-term debt obligations and working capital obligations.
Δ Leverage
This indicator measures a company’s trend in its long term debt relative to its total assets. The
higher the Δ Leverage, the lower the score. Leverage is calculated as:
𝐿𝑒𝑣𝑒𝑟𝑎𝑔𝑒 = (𝐿𝑜𝑛𝑔 𝑇𝑒𝑟𝑚 𝐷𝑒𝑏𝑡)/(𝐴𝑑𝑗𝑢𝑠𝑡𝑒𝑑 𝐴𝑠𝑠𝑒𝑡𝑠)
Risk Analysis: Step Z: Bankruptcy Risk
The small-capitalization companies tend to have high bankruptcy risk. Before moving to step 2
in the quantitative analysis, firms that have high probability of bankruptcy are eliminated using
Altman Z scores. Altman Z score is the criteria for risk because it reflects the financial condition
comprehensively in the following aspects: scale of capital, liquidity, profitability, financial
structure, debt payoff capacity, efficiency to use assets, etc. Firms with a Z score higher than
2.99 were eliminated, leaving healthy firms with low likelihood of bankruptcy to move to the
next quantitative step. Step Z results are shown in Exhibit 2 of the Appendix
Step 2: Value or Growth
Step 2: Value or Growth uses variables related to a company’s value compared to its market
value to determine how relatively undervalued a firm’s stock price may be. In this step, three
current variables are used and weighted equally to determine the stock’s value. All stocks that
enter this step are sorted into quintiles for each variable, and receive a score based on which
quintile they fall into relative to other stocks. After receiving scores of 1 – 5, 5 ranking the best,
for each variable, they are then weighted equally and summed up to receive an aggregate score
for this step. Below are the variables used for Step 2: Value or Growth and the results for this
screen can be seen in Exhibit 3 of the Appendix.
Small-Cap Portfolio: Healthcare & Consumer Staples
Page 15 of 57
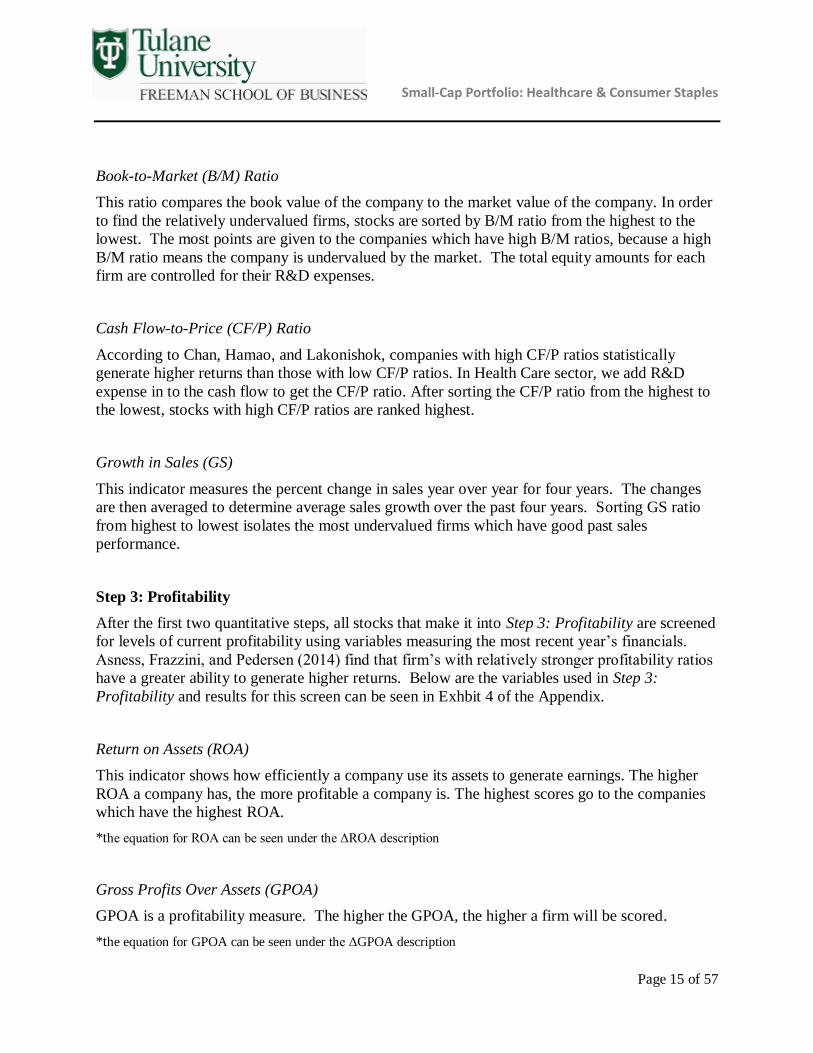
Book-to-Market (B/M) Ratio
This ratio compares the book value of the company to the market value of the company. In order
to find the relatively undervalued firms, stocks are sorted by B/M ratio from the highest to the
lowest. The most points are given to the companies which have high B/M ratios, because a high
B/M ratio means the company is undervalued by the market. The total equity amounts for each
firm are controlled for their R&D expenses.
Cash Flow-to-Price (CF/P) Ratio
According to Chan, Hamao, and Lakonishok, companies with high CF/P ratios statistically
generate higher returns than those with low CF/P ratios. In Health Care sector, we add R&D
expense in to the cash flow to get the CF/P ratio. After sorting the CF/P ratio from the highest to
the lowest, stocks with high CF/P ratios are ranked highest.
Growth in Sales (GS)
This indicator measures the percent change in sales year over year for four years. The changes
are then averaged to determine average sales growth over the past four years. Sorting GS ratio
from highest to lowest isolates the most undervalued firms which have good past sales
performance.
Step 3: Profitability
After the first two quantitative steps, all stocks that make it into Step 3: Profitability are screened
for levels of current profitability using variables measuring the most recent year’s financials.
Asness, Frazzini, and Pedersen (2014) find that firm’s with relatively stronger profitability ratios
have a greater ability to generate higher returns. Below are the variables used in Step 3:
Profitability and results for this screen can be seen in Exhbit 4 of the Appendix.
Return on Assets (ROA)
This indicator shows how efficiently a company use its assets to generate earnings. The higher
ROA a company has, the more profitable a company is. The highest scores go to the companies
which have the highest ROA.
*the equation for ROA can be seen under the ΔROA description
Gross Profits Over Assets (GPOA)
GPOA is a profitability measure. The higher the GPOA, the higher a firm will be scored.
*the equation for GPOA can be seen under the ΔGPOA description

Small-Cap Portfolio: Healthcare & Consumer Staples
Page 16 of 57
Gross Margin
By using this ratio, a stock’s profitably is measured by sales after subtracting COGS. The higher
the ratio is, the higher a company is ranked.
Cash Flow Over Assets (CFOA)
This ratio is used to find how efficient a company uses its assets to generate cash flows. The
higher the variable, the more points the firm scores. This variable is calculated as:
𝐶𝐹𝑂𝐴 = 𝑁𝐼𝑡 + 𝐷𝑒𝑝𝑟&𝐴𝑚𝑜𝑟𝑡 − (𝑊𝑜𝑟𝑘𝑖𝑛𝑔 𝐶𝑎𝑝𝑖𝑡𝑎𝑙𝑡 − 𝑊𝑜𝑟𝑘𝑖𝑛𝑔 𝐶𝑎𝑝𝑖𝑡𝑎𝑙𝑡−1) − 𝐶𝐴𝑃𝐸𝑋𝑡
Accruals to Assets
This variable measures the quality of a firm’s revenue. The lower the ratio is relative to other
firms, the higher the stock is ranked.
*the equation for Assets to Accruals can be seen under the ΔAssets to Accruals description
The qualitative screening process delves into firm-specific details that measure several factors
considered either too subjective or difficult to quantify, or not powerful enough to remove stocks
prior to looking at them further. The qualitative screening process assesses all variables
collectively to determine each firm’s ability to generate high abnormal stock returns in the
future. Each variable is collected through numerical data and data supplied in each firm’s annual
reports as well as competing companies financial filings. Below is a table of firm specific
variables used in the qualitative screen.
Qualitative Screens & Analysis

Small-Cap Portfolio: Healthcare & Consumer Staples
Page 17 of 57
Category Variables
Macroeconomic Drivers
Regulations
Population
Technology Driver
Firm Operations
Products/ Patents Development or Moats
R&D Efficiency
Acquisition & Spin-off Quality
Corporate Governance &
Management
Stock Repurchases
Insider Trading
Management Stability
Financial Quality
Profitability Improvement
Earnings Surprise Performance
Downside Beta
Macroeconomic Drivers
Macroeconomic drivers are considered external variables impossible for firms to control, such as
demographics, regulations, available and/or competing technologies. If a firm is exposed to a
macroeconomic risk, it will be mentioned under this variable.
Firm Operations
R&D Efficiency
R&D Efficiency is measured by:
𝑅&𝐷 𝐸𝑓𝑓𝑖𝑐𝑖𝑒𝑛𝑐𝑦 = (𝑅&𝐷 𝐸𝑥𝑝𝑒𝑛𝑠𝑒)/(𝑀𝑎𝑟𝑘𝑒𝑡 𝑉𝑎𝑙𝑢𝑒 𝑜𝑓 𝐸𝑞𝑢𝑖𝑡𝑦)
According to Chan, Lakonishok and Sougiannis, stocks with high levels of R&D efficiency
generate higher abnormal returns. The firms R&D efficiency ratios are calculated and compared
to each other in this screen step.
Products/Patents Development or Moats
Many small-cap healthcare companies rely on certain niche products and patents developed in
R&D departments to keep the company alive and financially healthy/protected. This analysis
discusses which products these companies plan to produce, acquire, or continue to develop in the
future and how they affect the company’s financials.
Small-Cap Portfolio: Healthcare & Consumer Staples
Page 18 of 57
Acquisition and Spin-off Quality
Acquisitions play a large part in many companies’ growth strategies. This variable assesses each
company’s ability to generate revenue through acquisitions in both the past and the future
depending on the historical data and future plans of each firm.
Corporate Governance and Management
Stock Repurchases
This indicator represents a firm’s plans to repurchase stock from the public. Usually, a stock
repurchase is a positive signal because it shows the company’s confidence in its financial
condition and undervalued stock price. Here, any stock repurchases over the last two years are
reported in the variable.
Insider Trading
This information shows how many stocks the company executives bought and sold in the past 3
or 12 months. If the number of shares bought exceeds the number of shares sold, it shows a good
signal that the company is in good financial condition and the executives are confident about the
price of their own firm’s shares.
Management Stability
Management stability is measured using several factors including whether or not the founder has
recently left the company or if management has been restructured in a way that may benefit or
hurt the condition of the company. Any issues related to the strength of management or any
signals of a change in management can be found here.
Financial Quality
Profitability Improvement
Many of the quantitative factors used in the initial screening process may have been inflated or
deserve further investigation. This section reports any interesting findings regarding a
company’s improving financial condition upon further investigation of financial data.
Earnings Surprise Performance
This indicator shows how many times in the past 2 years the company earnings actually
exceeded consensus analyst estimates. The more times the company beats its earnings estimates,
the better signal it shows. Another variable used in this analysis is the earnings surprise ratio.
Doyle, Lindholm and Soliman (2006) explain that stocks with high earnings surprise ratios
statistically achieve higher future abnormal returns. The earnings surprise ratio is calculated as:

Small-Cap Portfolio: Healthcare & Consumer Staples
Page 19 of 57
𝐸𝑆 𝑅𝑎𝑡𝑖𝑜 = (𝐴𝑐𝑡𝑢𝑎𝑙 𝐸𝑃𝑆 − 𝐴𝑛𝑎𝑙𝑦𝑠𝑡 𝐶𝑜𝑛𝑠𝑒𝑛𝑠𝑢𝑠 𝐸𝑃𝑆)/(𝐴𝑐𝑡𝑢𝑎𝑙 𝑆𝑡𝑜𝑐𝑘 𝑃𝑟𝑖𝑐𝑒)
Downside Beta
The downside beta shows the systematic risk a company is exposed to during market downturns.
A downside beta lower than one shows the systematic risk of the company is lower than the
market. A downside beta higher than one shows there is a higher risk behind the company than
the risk of the market. While this variable is useful for consideration, the investment theory
behind this process does not support the theory that historical betas affect future systematic risk.
Firm-Specific Qualitative Analysis Tables
Table 3: Post-Screening Firm Overview
Ticker Name STEP 1 STEP 2 STEP 3
BABY Natus Medical 6th/70 14th/28 4th/16
VIVO Meridian Biosciences 11th/70 8th/28 2nd/16
SRDX SurModics 4th/70 2nd/28 1st/16
EBS Emergent Biosolutions 29th/70 6th/28 5th/16
CBM Cambrex Corp 7th/70 15th/28 12th/16
AFAM Almost Family 66th/70 N/A N/A
PMC PharMerica Corp 47th/70 N/A N/A

Small-Cap Portfolio: Healthcare & Consumer Staples
Page 20 of 57
Natus Medical Inc. (BABY)
Natus Medical Inc. (NYSE: BABY)
Natus Medical (BABY) has recently acquired and created several new products, captured a large
contract, and is on track to have double the exposure it had by year end 2014. This neurology and
newborn centered healthcare firm has a strong acquisition quality,
Firm
Operations
The firm’s growth strategy revolves around acquisitions, using newly acquired products in there research and development to create new patents and products.
BABY is on pace to be exposed in nearly double the amount of hospitals it was at
year end 2014, from being in 58 hospitals to aiming for 100 by year end 2015.
In April of 2015, Natus Medical was cleared to manufacture and sell the first 256-channel quantum amplifier used to measure brain activity related to epiliepsy and
sleep disorders. This new technology sensitive tool for measuring can be used in
many other products and services offered by BABY.
The R&D efficiency rate of BABY in 2014 was 2.46%, lower than the sector average
which is 3.32%.
BABY recently acquired two companies, GND and NicView, to expand its product
portfolio. GND supplies convenient EEG testing for brain activity and NicView offers hospitals a 24-hour monitoring system for newborns.
Corporate
Governance &
Management
Insider holdings over the past 12 months have shown that executives have sold shares
at a high rate
On June 9, 2014, BABY entered into a share repurchase program.
Financial
Quality
The firm has beat consensus estimate earnings in all past 8 quarters.
Downside beta is -0.65, much lower than the sector downside beta 0.61.
Recently awarded a 5-year, $32.5 million contract in the state of California.
Meridian Biosciences Inc. (VIVO)
Meridian Bioscience Inc. (NYSE: VIVO)
Meridian Bioscience mainly provides quick, cheap, and simple diagnostic test kits for niche markets and
diseases. The company is able to defend itself from market downturns with its leverage ratio at 0% and pays exceptional dividends to shareholders. While its major patented product will be unprotected soon,
VIVO will be releasing new testing kits for much more common diseases that can be used at home or
more efficiently in a physician’s office than other tests.
Firm Operations
VIVO has zero debt and utilizes an aggressive R&D expenditure strategy to outgrow its competition.
Meridian Bioscience is one of small-cap healthcare companies that pays dividends,
and has paid dividend for the past 21 years without decreasing its dividend amount.
The company maintains a large market share in specific medical areas and uses this strategy to offer leading products in niche markets..
VIVO develops a line of illumigene products: a patented technology used to test
more common diseases. In the next couple years, the company will be releasing its illumigene STD testing kits into the market, a test that may be widely used as STD
are amongst the most commonly feared and easily contractible diseases

Small-Cap Portfolio: Healthcare & Consumer Staples
Page 21 of 57
Its H. pylori testing kit will be losing its patent in 2016 and 2017, leaving its second
most revenue-generating technology unprotected
The R&D efficiency rate of VIVO in 2014 was 1.54%, lower than the sector average of 3.32%.
Increasing competition has kept market share at a flat rate year over year.
Corporate
Governance & Management
Insider holdings over the past 12 months have shown that executives bought more
shares than sold.
Financial Quality
The firm has missed consensus estimate earnings in 5 of 8 past quarters.
Downside beta is 1.53, higher than the sector downside beta of 0.61.
SurModics Inc. (SRDX)
SurModics Inc. (NYSE: SRDX)
SurModics is a medical device coating and in vitro diagnostic test producing company with strong R&D
efficiency, plans to offer ground-breaking products, and confidence amongst management that the stock
is undervalued.
Firm Operations
SurModics business strategy focuses highly on R&D and generating new patents
consistently to keep up with competition. They are able to do so by licensing out
most of its products/patents in order to generate passive revenue while focusing on
innovation.
SRDX recently sold all of its assets in an inefficient pharmaceutical subsidiary.
SRDX will continue its research and development project on a new drug coated
balloon product, SurVeil, which will enter human trails in November of 2015. Drug coated balloons have gained a wide acceptance in the medical community recently,
and only two competitors exist. They are useful for breaking down blockage and
clots in arteries and have a wide range of demand among other uses.
While SurModics will be losing one of its prominent medical device coating patents, PhotoLink, it has developed an improved coating, Serene, that the firm is attempting
to convert existing customers to use.
The R&D efficiency rate of SRDX in 2014 was 4.63%, higher than the sector average of 3.32%.
SRDX is increasing R&D expenditures by 5-7% in 2015 for its new SurVeil product.
Corporate
Governance & Management
Insider holdings over the past 12 months have shown that executives have bought more
shares than sold
On November 11, 2014, SRDX entered into an accelerated share repurchase program.
Financial Quality
The firm has beat consensus estimate earnings in 7 of 8 past quarters.
Downside beta is 1.34, much higher than the sector downside beta 0.61.

Small-Cap Portfolio: Healthcare & Consumer Staples
Page 22 of 57
Anika Therapeutics Inc. (ANIK)
Anika Therapeutics Inc. (NYSE: ANIK)
Anika Therapeutics embraces its long lived patented technology to supply its massive product line. The
company has proved to be very effective in creating value without straying from its core business.
Recently, they have significantly cut margins and captured major customers that produce well over the
majority of their revenue.
Firm Operating
ANIK creates a large line of products using its Hyaloric Acid (HA) based technology.
Two years ago, the company consolidated plant production from dual facilities into
one facility and reduced production in Italy, cutting costs and increasing gross margins dramatically.
ANIK has developed two significant revenue generating products within the last 12
months, MonoVisc and OrthoVisc, and plans to increase R&D spending by 15% in
the near future.
The R&D efficiency rate of ANIK in 2014 was 1.38%, lower than the sector average
of 3.32%.
Competition has increased dramatically, but Anika Therapeutics generates 72% of its
revenue from a Johnson & Johnson subsidiary. This has kept there revenue generating ability protected but also increases its risk in the ability to generate similar
revenue without the single client.
Corporate
Governance & Management
Insider holdings over the past 12 months have shown that executives have sold a
significantly more shares than they have bought.
Financial
Quality
The firm is covered by one analyst and has no data regarding earnings estimates.
Downside beta is 2.17, much higher than the sector downside beta of 0.61.
Emergent Biosolutions Inc. (EBS)
Emergent Biosolutions Inc. (NYSE: EBS)
Emergent Biosolutions Inc. performs well in the qualitative analysis with new patent licensed, high
probability to augment BioThrax manufacturing capacity, high R&D efficiency, good acquisition
quality, lower-than-average downside beta, and stable increases in revenue and net income. Though the leverage is increasing, we are still positive on the company.
Firm Operating
BioThrax contributes more 80% to EBS’ revenue. Building 55 will triple the
BioThrax manufacturing capacity. Biomedical Advanced Research and
Development Authority (BARDA) is funding the project. FDA’s might approve an sBLA in late 2015 or early 2016.
On April 22, EBS concluded its investigation in the particles sources of two
BioThrax production lots.
FDA approved Anthrasil™ (seven-year market exclusivity) on March 25, EBS now
enjoys five only-one patents licensed by FDA in its Biodefense division. BARDA
offers EBS $7 million for the achievement.
The R&D efficiency rate of EBS in 2014 is 13.45%, three times higher than sector average which is 3.32%.
Small-Cap Portfolio: Healthcare & Consumer Staples
Page 23 of 57
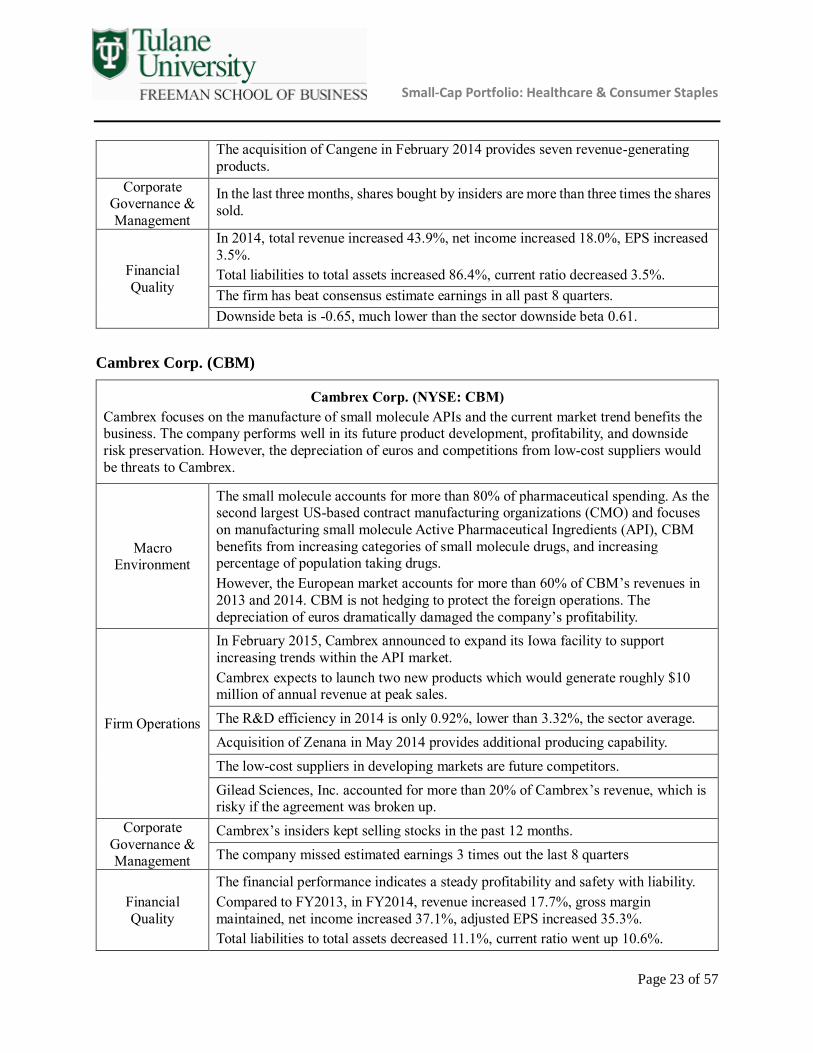
The acquisition of Cangene in February 2014 provides seven revenue-generating
products.
Corporate Governance &
Management
In the last three months, shares bought by insiders are more than three times the shares
sold.
Financial
Quality
In 2014, total revenue increased 43.9%, net income increased 18.0%, EPS increased
3.5%.
Total liabilities to total assets increased 86.4%, current ratio decreased 3.5%.
The firm has beat consensus estimate earnings in all past 8 quarters.
Downside beta is -0.65, much lower than the sector downside beta 0.61.
Cambrex Corp. (CBM)
Cambrex Corp. (NYSE: CBM)
Cambrex focuses on the manufacture of small molecule APIs and the current market trend benefits the business. The company performs well in its future product development, profitability, and downside
risk preservation. However, the depreciation of euros and competitions from low-cost suppliers would
be threats to Cambrex.
Macro Environment
The small molecule accounts for more than 80% of pharmaceutical spending. As the second largest US-based contract manufacturing organizations (CMO) and focuses
on manufacturing small molecule Active Pharmaceutical Ingredients (API), CBM
benefits from increasing categories of small molecule drugs, and increasing percentage of population taking drugs.
However, the European market accounts for more than 60% of CBM’s revenues in
2013 and 2014. CBM is not hedging to protect the foreign operations. The
depreciation of euros dramatically damaged the company’s profitability.
Firm Operations
In February 2015, Cambrex announced to expand its Iowa facility to support
increasing trends within the API market.
Cambrex expects to launch two new products which would generate roughly $10 million of annual revenue at peak sales.
The R&D efficiency in 2014 is only 0.92%, lower than 3.32%, the sector average.
Acquisition of Zenana in May 2014 provides additional producing capability.
The low-cost suppliers in developing markets are future competitors.
Gilead Sciences, Inc. accounted for more than 20% of Cambrex’s revenue, which is risky if the agreement was broken up.
Corporate
Governance & Management
Cambrex’s insiders kept selling stocks in the past 12 months.
The company missed estimated earnings 3 times out the last 8 quarters
Financial
Quality
The financial performance indicates a steady profitability and safety with liability.
Compared to FY2013, in FY2014, revenue increased 17.7%, gross margin
maintained, net income increased 37.1%, adjusted EPS increased 35.3%.
Total liabilities to total assets decreased 11.1%, current ratio went up 10.6%.

Small-Cap Portfolio: Healthcare & Consumer Staples
Page 24 of 57
Cambrex has a downside beta of -0.31, indicating that the firm generates abnormal
returns under bad market conditions.
Almost Family Inc. (AFAM)
Almost Family Inc. (NASDAQ: AFAM)
Though Almost Family Inc. is in a good market condition and it did well in 2014, the company’s business strategies cannot sustain its future growth and advantages for competition.
Macro
Environment
The increase of healthcare expenditures and the increase of aging population will
benefit healthcare services industry.
Firm Operating
The firm did three acquisitions in 2013 and one acquisition in 2014, and signed one acquisition contract in 2015. However, the firm’s operating efficiency did not
increase with the acquisitions. Besides, AFAM extends its business mainly by
referrals which are not sustainable. The competition of the industry is fierce.
Corporate Governance &
Management
Insiders kept buying AFAM in the past 12 months.
AFAM beats estimated earnings 6 times in the last 8 quarters.
Financial
Results
Compared to FY 2013, in FY 2014, net income increased 67.3%. Total liabilities to total assets went down 7.9%. However, gross margin maintained the same level.
PharMerica Corp. (PMC)
PharMerica Corp (NYSE: PMC)
PharMerica Corp benefits from its market position, acquisition strategies, and increasing healthcare
expenditures. However, the company becomes unfavorable because (1) it lost two major customers; (2) its genetic dispensing rate is increasing; (3) its failure to control cost; (4) its illegal issues in the past
years; and (5) bad profitability performance in FY 2014.
Macro
Environment
The increase in aging population and lifestyle changing results in the increase of
healthcare expenditure. The US government’s Center for Medicare and Medicaid Services (CMS) stated that healthcare expenditure in the country rose recently
6.8%. The increase in healthcare expenditures boosts the development of
pharmaceutical service companies.
Firm Operating
PharMerica Corp is the second largest institutional pharmacy service company in the US. The four acquisitions in 2014 enhances the company’s service offerings.
However, PMC lost two major customers last year, dramatically reduces its revenue
sources. The company’s generic drug dispensing rate kept increasing in the last three years, adversely affecting its profitability. Failure to control cost resulted in
increasing revenue but decreasing operating income. The illegal issues generated
extraordinary expenses. Besides, PMC failed to call back the receivables, its asset
turnover ratio kept decreasing in the past three years.
The President and CEO of PMC’s subsidiary will resign on July 3, 2015.
Small-Cap Portfolio: Healthcare & Consumer Staples
Page 25 of 57
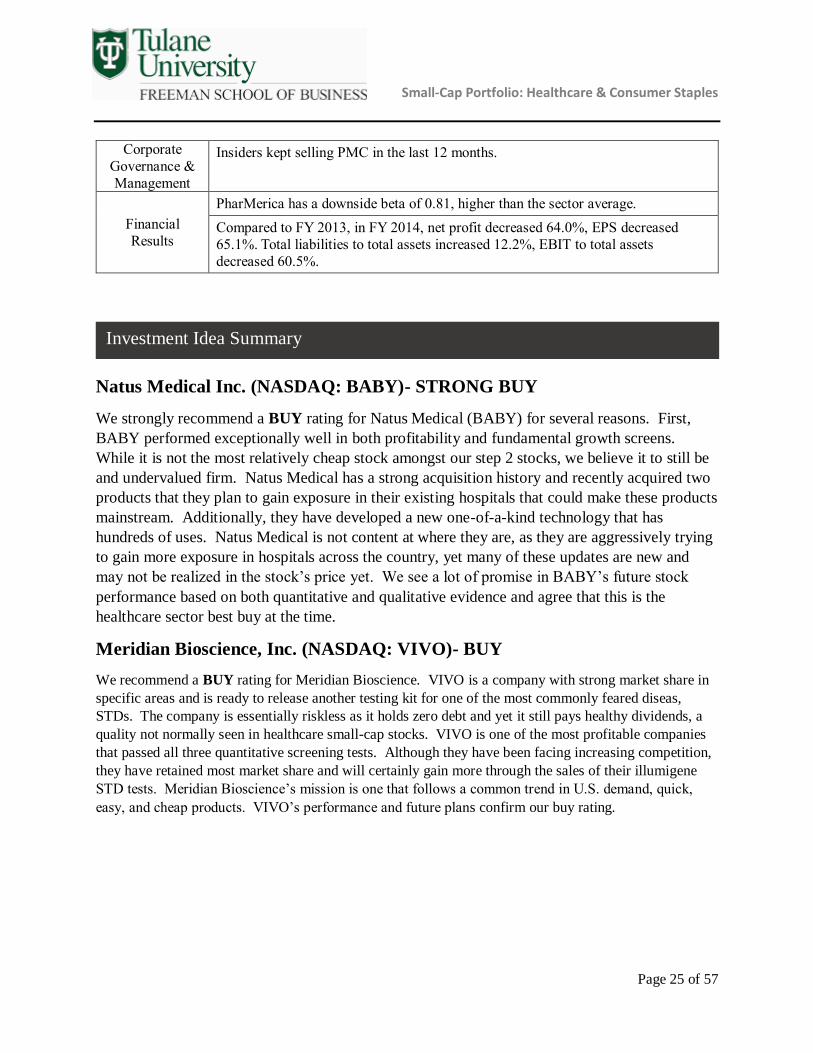
Corporate
Governance &
Management
Insiders kept selling PMC in the last 12 months.
Financial
Results
PharMerica has a downside beta of 0.81, higher than the sector average.
Compared to FY 2013, in FY 2014, net profit decreased 64.0%, EPS decreased
65.1%. Total liabilities to total assets increased 12.2%, EBIT to total assets
decreased 60.5%.
Natus Medical Inc. (NASDAQ: BABY)- STRONG BUY
We strongly recommend a BUY rating for Natus Medical (BABY) for several reasons. First,
BABY performed exceptionally well in both profitability and fundamental growth screens.
While it is not the most relatively cheap stock amongst our step 2 stocks, we believe it to still be
and undervalued firm. Natus Medical has a strong acquisition history and recently acquired two
products that they plan to gain exposure in their existing hospitals that could make these products
mainstream. Additionally, they have developed a new one-of-a-kind technology that has
hundreds of uses. Natus Medical is not content at where they are, as they are aggressively trying
to gain more exposure in hospitals across the country, yet many of these updates are new and
may not be realized in the stock’s price yet. We see a lot of promise in BABY’s future stock
performance based on both quantitative and qualitative evidence and agree that this is the
healthcare sector best buy at the time.
Meridian Bioscience, Inc. (NASDAQ: VIVO)- BUY
We recommend a BUY rating for Meridian Bioscience. VIVO is a company with strong market share in
specific areas and is ready to release another testing kit for one of the most commonly feared diseas,
STDs. The company is essentially riskless as it holds zero debt and yet it still pays healthy dividends, a
quality not normally seen in healthcare small-cap stocks. VIVO is one of the most profitable companies
that passed all three quantitative screening tests. Although they have been facing increasing competition,
they have retained most market share and will certainly gain more through the sales of their illumigene
STD tests. Meridian Bioscience’s mission is one that follows a common trend in U.S. demand, quick,
easy, and cheap products. VIVO’s performance and future plans confirm our buy rating.
Investment Idea Summary

Small-Cap Portfolio: Healthcare & Consumer Staples
Page 26 of 57
SurModics, Inc. (NASDAQ: SRDX)- BUY
We recommend the Darwin Fenner Fund BUY SRDX stock for several reasons. To start, SRDX
passed all of our quantitative screens in flying colors, landing in the top 5 of every step and
ranking 2nd in our value screen and 1st in our profitability screen. SRDX is extremely close to
clearing their developing product, a drug coated balloon, which has already gain recent wide
acceptance in the medical field and has several types of uses. SRDX’s only issue to overcoe will
be transferring its current customers over to its new patent protected Serene products once their
PhotoLink patent expires soon. The stock has consistently beaten analyst estimates and SRDX is
currently in a share repurchase program, showing strong financial performance and even stronger
confidence within the company that reaffirms our buy rating.
Anika Therapeutics Inc. (NYSE: ANIK)- DELETE
Anike Therapeutics was DELETED during our firm specific qualitative screens. We realized
that the firm’s financial performance and strong quantitative screen results were due to a one
time consolidation of manufacturing resources and contract signing with a Johnson & Johnson
subsidiary. We are very put off by the fact that 72% of its revenue is in the hands of one
customer and we believe this stock is much too risky and overvalued to be considered for the
Darwin Fenner Fund.
Emergent Biosolutions Inc. (NYSE: EBS)- HOLD
We recommend to HOLD Emergent Biosolutions Inc. because it did well in our quantitative
screen and has favorable qualitative performance. EBS ranks 29th in step 1 screening, a middle
performer in fundamental growth trend. The company ranks 6th in step 2, indicating that EBS is
more undervalued than other companies in the sector. EBS got the 5th place in step 3, showing a
top current profitability. We confirm our hold recommendation because of the newly-licensed
patent, high probability to augment BioThrax manufacturing capacity, high R&D efficiency,
good acquisition quality, lower-than-average downside beta, and stable increases in revenue and
net income. After considering all the factors, we recommend to hold EBS.
Cambrex Corp. (NYSE: CBM)- HOLD
We recommend to HOLD Cambrex Corp. based on our quantitative and qualitative analysis.
CBM ranks the 7th in step 1, indicating that the firm has a strong trend of fundamental growth.
CBM ranks in the middle in step 2, showing that the firm is relatively a value firm. CBM does
not rank in the top in step 3, but the increase in net income and decrease in leverage in FY 2014
indicate a steady profitability and financial safety. The market concentration on small molecule
API benefits the firm’s business. However, CBM should be aware of the foreign currency
environment and low-cost competitors. After considering about all the factors, we recommend to
hold CBM.

Small-Cap Portfolio: Healthcare & Consumer Staples
Page 27 of 57
Almost Family Inc. (NASDAQ: AFAM)- Strong Sell
We recommend to STRONG SELL Almost Family Inc. based on our quantitative and
qualitative analysis. AFAM was deleted from step 1 with a ranking of 66th, indicating that the
company has a poor fundamental growth trend. Though Almost Family Inc. is in a good market
condition and it did well in 2014, the company’s business strategies cannot sustain its future
growth and advantages in a fierce competitive environment. After considering about all the
factors, we recommend to sell AFAM.
PharMerica Corp (NYSE: PMC)- Sell
We recommend to SELL PharMerica Corp based on our quantitative and qualitative analysis.
PMC ranks 47th in step 1 and failed to move into the next step. PharMrica Corp benefits from its
market position, acquisition strategies, and increasing healthcare expenditures. However, the
company lost two major customers in 2014, failed to control cost in the most recent years, and
bad profitability in 2014 confirmed our strong sell recommendation.

Small-Cap Portfolio: Healthcare & Consumer Staples
Page 28 of 57
Consumer
Staples

Small-Cap Portfolio: Healthcare & Consumer Staples
Page 29 of 57
TICKER NAME SUB-SECTOR
DAR Darling Ingredients Agricultural Products
ANDE Andersons/The Food Distributors
SPTN SpartanNash Co Food Distributors
CASY Casey's General Stores Food Retail
WDFC WD-40 Co Household Products
CENTA Central Garden & Pet Co Household Products
CALM Cal-Maine Foods Packaged Foods & Meats
JJSF J&J Snack Foods Packaged Foods & Meats
CVGW Calavo Growers Packaged Foods & Meats
BGS B&G Foods Packaged Foods & Meats
SAFM Sanderson Farms Packaged Foods & Meats
SENEA Seneca Foods Packaged Foods & Meats
DMND Diamond Foods Packaged Foods & Meats
LNCE Snyder's-Lance Packaged Foods & Meats
MED Medifast Personal Products
IPAR Inter Parfums Personal Products
UVV Universal/VA Tobacco
Stock List
Consumer Staples (17 Stocks)

Small-Cap Portfolio: Healthcare & Consumer Staples
Page 30 of 57
Table 4 illustrates all Buy, Hold, and Sell recommendations for the S&P 600 Consumer Staples
stocks covered in the quantitative and qualitative screens and analyses described in this report.
Table 4: Consumer Staples Sector Recommendations
Ticker Name Sub-industry Recommendation
BGS B&G Foods Inc Packaged Foods & Meats BUY
SPTN SpartanNash Co Food Distributors HOLD
MED Medifast Inc Personal Products STRONG SELL
Sector Performance Snapshot (as of February 22, 2015)
Previous 36 Month Data S&P 600 Consumer Staples
Alpha - 0.45%
CAPM Beta 1 0.81
Downside CAPM Beta 1 0.69
CAR - 8.13%
BAH Return 51.63% 64.33%
Abnormal BAH Return - 12.71%
Cumulative Wealth 1.516 1.643
Sharpe Ratio 0.34 0.40
B-M Ratio 0.449 0.442
CF-P Ratio 0.071 0.074
E-P Ratio 0.034 0.049
Avg. Sales Growth (past 5 years) 27.93% 11.63%
Recommendations
Consumer Staples Sector Analysis

Small-Cap Portfolio: Healthcare & Consumer Staples
Page 31 of 57
Sector Overview
The Consumer Staples sector of the S&P 600 consists of 17 stocks and, as of February 22, 2015,
makes up 3.09% of the S&P 600 market capitalization. All data in this sector analysis section is
recorded as of February 22, 2015. Consumer Staples generally refers to firms that produce
necessities and products under constant demand. Sub-industries in this sector are shown in
Figure 6.
Figure 6: Consumer Staples Sub-Industry Weights
Performance and Risk
The consumer staples sector outperforms the S&P 600 over the past 36 months. As shown in
Figure 7, the cumulative wealth of consumer staples has consistently larger than the S&P 600.
The cumulative market adjusted abnormal return is 8.13%. The BAH return is 64.33%, higher
than that of the S&P 600, 51.63% (refer to Figure 8).
Food & Beverages
56.40%
Tobacco5.22%
Household Products
7.25%
Personal Products
4%
Food Retailers16.63%
Food Distributors
10.50%

Small-Cap Portfolio: Healthcare & Consumer Staples
Page 32 of 57
Figure 7: Cumulative Wealth over the Past 36 Months (Consumer Staples vs S&P 600)
Figure 8: Buy and Hold Return over the Past 36 Months (Consumer Staples vs S&P 600)
Regarding risk, the consumer staples sector has a CAPM beta of 0.81, showing that the sector
has a lower systematic risk than the S&P 600. Consumer staples are products that the general
population are in need of constantly, no matter where a person’s financial condition. People
cannot or are unwilling to live without consumer staples. Thus, stocks of the consumer staples
sector are non-cyclical, tending to have lower systematic risks.
Figure 9: Systematic Risk of Consumer Staples
0.8
1
1.2
1.4
1.6
1.8
S&P 600 Consumer Staples
64.33%
51.63%
Buy and Hold Return
Consumer Staples SP600
1
0.81
S&P 600 CONS

Small-Cap Portfolio: Healthcare & Consumer Staples
Page 33 of 57
Additionally, the sector has a downside beta of 0.69 over the past 36 months, higher than that of
the S&P 600. The downside beta shows that the volatility of consumer staples stocks in market
downturns was lower than the volatility of the S&P 600 during the same period, returning a
lower loss than the market on average. As mentioned before, consumer staples stocks are
defensive in relation to the performance of the economy. Even if the market goes down, the
stocks are able to keep outperforming the market.
Figure 10: Upside and Downside Betas for Consumer Staples
Growth/Value Sector Classification
Using the S&P 600 as the benchmark, we first calculated the weighted average B/M ratio of the
S&P 600 and consumer staples sector. Results shown in Table 2 indicate that, compared to the
benchmark, the consumer staples sector is classified as a growth sector. However, the consumer
staples sector retain certain previously mentioned attributes, such as stability and necessity,
which reflect the constant demand of broad consumers. Furthermore, Consumer Staples has a
similar B/M ratio compared to S&P 600. After further analyzing the CF/P ratio and E/P ratio
(weighted average) for the S&P 600 and consumer staples sector, the sector maintains different
characteristics of growth/value throughout its separate ratios. Results are shown in Table 2.
1
1
.69
0.92
S&P 600 CONS

Small-Cap Portfolio: Healthcare & Consumer Staples
Page 34 of 57
Table 5: B/M, CF/P, and E/P ratio for S&P 600 and Consumer Staples
S&P 600 Consumer Staples G/V
B/M Ratio 0.449 0.442 G
CF/P Ratio 0.071 0.074 V
E/P Ratio 0.034 0.049 V
*Data source: Bloomberg, 02/22/2015
CF/P ratio and E/P ratio have a good consistency in Consumer Staples sector. And, as mentioned
before, investor sentiment of this sector has historically been conservative. While poor industry
performance may lead to weak CF/P and E/P ratios, active investors tend to believe this sector
has a high floor of performance which can lead to growth-style B?M ratios. Therefore, the
consumer staples sector is classified as a value sector.
Overweight and Underweight Decision
Taking into account past systematic risk and historical characteristics of the consumer staples
sector, the DFF portfolio should market-weight this sector of the S&P 600.
Currently, there are two consumer staples stocks in the fund, Medifast Inc. and Spartan Stores
Inc., which weigh at 7.25% of the DFF portfolio. Comparatively, the consumer staples sector
holds a market capitalization of 3.09% of the S&P 600.
Underweighting this sector would not be reasonable because the economy and consumer staples
market drivers are continuing to improve this year. Additionally, demand for consumer staples
products is elastic and people don’t purchase a significant amount more as disposable income
increases. Since the stock is generally conservative and the B/M ratio has remained lower than
that of the S&P 600 during market downturns, the DFF portfolio should market-weight the
consumer staples sector.
Small-Cap Portfolio: Healthcare & Consumer Staples
Page 35 of 57
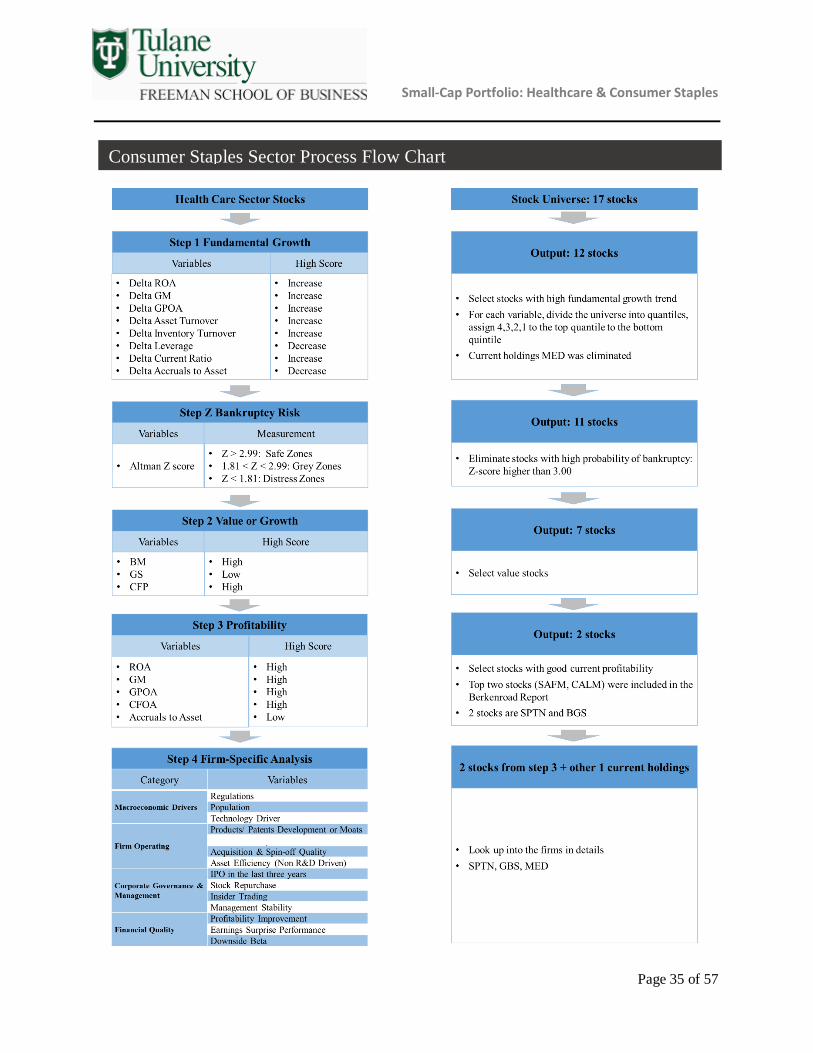
Consumer Staples Sector Process Flow Chart

Small-Cap Portfolio: Healthcare & Consumer Staples
Page 36 of 57
The quantitative screens are based on a theory of isolating firms that are increasingly financially
healthy, undervalued, and currently profitable. To begin, the stocks enter the firm fundamental
growth stage and, based on variables that measure the change in a firm’s financial ability, all
stocks are ranked into quartiles. Each stock receives a score of 1 – 4 for each variable based on
how well the stock ranked relative to other consumer staples sector stocks. After receiving
scores for each variables, they are then weighted equally and summed up to receive an aggregate
score for each step. Below are the variables and methods used in Step 1: Fundamental Growth:
Step 1: Fundamental Growth
The following growth variables are used to measure the trend in a company’s profitability,
financial health, and fundamental growth. Therefore, all variables are calculated by determining
the ratio for each of the past four years, calculating the change in each variable year over year,
and averaging the change over the last four years. Asness, Frazzini, and Pedersen (2014) and
Piotroski and So (2012) find that firm’s performing strongly under these variables statistically
generate higher abnormal returns. Step 1 results can be seen in Exhibit 5 of the Appendix.
Δ Return on Assets (ROA)
The change in ROA indicator measures the trend of management’s effectiveness in its ability to
generate revenue relative to the firm’s total assets during past years. ROA is calculated by:
𝑅𝑂𝐴 = 𝐴𝑑𝑗𝑢𝑠𝑡𝑒𝑑 𝑁𝑒𝑡 𝐼𝑛𝑐𝑜𝑚𝑒𝑡/(𝐴𝑠𝑠𝑒𝑡𝑠𝑡−1 + 𝐴𝑠𝑠𝑒𝑡𝑠𝑡
2)
An increasing ROA ratio earns a higher score.
Δ Gross Margin
The gross margin indicator measures the trend of a firm’s percentage of sales after subtracting
the cost of goods sold (COGS). A firm’s gross margin is an easy variable to illustrate how cost
effective a company can be. An increasing gross margin earns a higher score.
Δ Gross Profit Over Assets (GPOA)
According to Novy-Marx’s paper “The Other Side of Value” (2013), this indicator has the same
predictive power as the B/M ratio. This ratio illustrates the trend of a company’s profit efficiency
and financial health over past years. A higher Δ GPOA earns a higher score. GPOA is
calculated by:
𝐺𝑃𝑂𝐴 = 𝐺𝑟𝑜𝑠𝑠 𝑃𝑟𝑜𝑓𝑖𝑡𝑡/𝐴𝑠𝑠𝑒𝑡𝑠𝑡
Quantitative Screens & Analysis

Small-Cap Portfolio: Healthcare & Consumer Staples
Page 37 of 57
Δ Asset Turnover
This indicator measures the trend of how efficiently a company takes advantage of its assets. A
high Δ asset turnover earns a higher score. Asset turnover is calculated by:
𝐴𝑠𝑠𝑒𝑡 𝑇𝑢𝑟𝑛𝑜𝑣𝑒𝑟 = 𝑅𝑒𝑣𝑒𝑛𝑢𝑒𝑡/(𝐴𝑠𝑠𝑒𝑡𝑠𝑡−1 + 𝐴𝑠𝑠𝑒𝑡𝑠𝑡
2)
Δ Leverage
This indicator implies the trends company’s ability to payback long-term debt in future.
According to Piotroski, the increasing number of leverage show a negative signal because the
additional borrowing adds pressure to company’s financial flexibility. So we give the highest
score to the company with the lowest Δ Leverage ratio.
Δ Accruals to Assets
This indicator measures the trend of company’s quality of total revenue. According to
Hirshleifer, Hou, Teoh, and Zhang’s paper “Do Investors Overvalue Firms with Bloated Balance
Sheets” (2004), increasing accruals can have negative effect on stock’s future price performance.
Stocks with higher Δ Accruals to Assets earn a lower score. Accruals to assets is calculated by:
𝐴𝑐𝑐𝑟𝑢𝑎𝑙𝑠 𝑡𝑜 𝐴𝑠𝑠𝑒𝑡𝑠= (𝐼𝑛𝑐𝑜𝑚𝑒 𝑏/𝑜 𝑋𝑂 𝑖𝑡𝑒𝑚𝑠𝑡
− 𝑂𝑝𝑒𝑟𝑎𝑡𝑖𝑛𝑔 𝑐𝑎𝑠ℎ 𝑓𝑙𝑜𝑤𝑡)/(𝐴𝑣𝑒𝑟𝑎𝑔𝑒 𝐴𝑠𝑠𝑒𝑡𝑠𝑡,𝑡−1) )
Δ Liquidity
This indicator measures the trend of company’s ability to payback short-term debt, also known
as a firm’s current ratio. The higher a current ratio indicates the company has high ability to
meet short-term debt obligations and working capital obligations.
Δ Leverage
This indicator measures a company’s trend in its long term debt relative to its total assets. The
higher the Δ Leverage, the lower the score. Leverage is calculated as:
𝐿𝑒𝑣𝑒𝑟𝑎𝑔𝑒 = (𝐿𝑜𝑛𝑔 𝑇𝑒𝑟𝑚 𝐷𝑒𝑏𝑡)/(𝐴𝑠𝑠𝑒𝑡𝑠)
Δ Inventory Turnover (Consumer Staple sector only)
The Δ Inventory Turnover measures the trend over time of how many times a company sells and
replaces its products. This indicator is important to the Consumer Staple sector because the

Small-Cap Portfolio: Healthcare & Consumer Staples
Page 38 of 57
business strategy is simple and requires selling goods through inventory based operations. With a
strong Δ Inventory Turnover ratio, a company would be consistently paying less and less for
storage costs over time. Inventory Turnover is calculated as:
𝐼𝑛𝑣𝑒𝑛𝑡𝑜𝑟𝑦 𝑇𝑢𝑟𝑛𝑜𝑣𝑒𝑟 = 𝐶𝑜𝑠𝑡 𝑜𝑓 𝐺𝑜𝑜𝑑 𝑆𝑜𝑙𝑑/(𝐴𝑣𝑒𝑟𝑎𝑔𝑒 𝐴𝑠𝑠𝑒𝑡𝑠)
Risk Analysis: Step Z: Bankruptcy Risk
The small-capitalization companies tend to have high bankruptcy risk. Before moving to step 2
in the quantitative analysis, firms that have high probability of bankruptcy are eliminated using
Altman Z scores. Altman Z score is the criteria for risk because it reflects the financial condition
comprehensively in the following aspects: scale of capital, liquidity, profitability, financial
structure, debt payoff capacity, efficiency to use assets, etc. Firms with a Z score higher than
2.99 were eliminated, leaving healthy firms with low likelihood of bankruptcy to move to the
next quantitative step. Step Z results can be seen in Exhibit 6 of the Appendix.
Step 2: Value or Growth
Step 2: Value or Growth uses variables related to a company’s value compared to its market
value to determine how relatively undervalued a firm’s stock price may be. In this step, three
current variables are used and weighted equally to determine the stock’s value. All stocks that
enter this step are sorted into quintiles for each variable, and receive a score based on which
quintile they fall into relative to other stocks. After receiving scores of 1 – 5, 5 ranking the best,
for each variable, they are then weighted equally and summed up to receive an aggregate score
for this step. Below are the variables used for Step 2: Value or Growth and the results for this
screen can be seen in Exhibit 7 of the Appendix.
Book-to-Market (B/M) Ratio
This ratio compares the book value of the company to the market value of the company. In order
to find the relatively undervalued firms, stocks are sorted by B/M ratio from the highest to the
lowest. The most points are given to the companies which have high B/M ratios, because a high
B/M ratio means the company is undervalued by the market. The total equity amounts for each
firm are controlled for their R&D expenses.
Cash Flow-to-Price (CF/P) Ratio
According to Chan, Hamao, and Lakonishok, companies with high CF/P ratios statistically
generate higher returns than those with low CF/P ratios. In Health Care sector, we add R&D
expense in to the cash flow to get the CF/P ratio. After sorting the CF/P ratio from the highest to
the lowest, stocks with high CF/P ratios are ranked highest.
Small-Cap Portfolio: Healthcare & Consumer Staples
Page 39 of 57
Growth in Sales (GS)
This indicator measures the percent change in sales year over year for four years. The changes
are then averaged to determine average sales growth over the past four years. Sorting GS ratio
from highest to lowest isolates the most undervalued firms with good past sales performance.
Step 3: Profitability
After the first two quantitative steps, all stocks that make it into Step 3: Profitability are screened
for levels of current profitability using variables measuring the most recent year’s financials.
Asness, Frazzini, and Pedersen (2014) find that firm’s with relatively stronger profitability ratios
have a greater ability to generate higher returns. Below are the variables used in Step 3:
Profitability and results for this screen can be seen in Exhibit 8 of the Appendix.
Return on Assets (ROA)
This indicator shows how efficiently a company use its assets to generate earnings. The higher
ROA a company has, the more profitable a company is. The highest scores go to the companies
which have the highest ROA.
*the equation for ROA can be seen under the ΔROA description
Gross Profits Over Assets (GPOA)
GPOA is a profitability measure. The higher the GPOA, the higher a firm will be scored.
*the equation for GPOA can be seen under the ΔGPOA description
Gross Margin
By using this ratio, a stock’s profitably is measured by sales after subtracting COGS. The higher
the ratio is, the higher a company is ranked.
Cash Flow Over Assets (CFOA)
This ratio is used to find how efficient a company uses its assets to generate cash flows. The
higher the variable, the more points the firm scores. This variable is calculated as:
𝐶𝐹𝑂𝐴 = 𝑁𝐼𝑡 + 𝐷𝑒𝑝𝑟&𝐴𝑚𝑜𝑟𝑡 − (𝑊𝑜𝑟𝑘𝑖𝑛𝑔 𝐶𝑎𝑝𝑖𝑡𝑎𝑙𝑡 − 𝑊𝑜𝑟𝑘𝑖𝑛𝑔 𝐶𝑎𝑝𝑖𝑡𝑎𝑙𝑡−1) − 𝐶𝐴𝑃𝐸𝑋𝑡
Accruals to Assets
This variable measures the quality of a firm’s revenue. The lower the ratio is relative to other
firms, the higher the stock is ranked.
*the equation for Assets to Accruals can be seen under the ΔAssets to Accruals description

Small-Cap Portfolio: Healthcare & Consumer Staples
Page 40 of 57
The qualitative screening process delves into firm-specific details that measure several factors
considered either too subjective or difficult to quantify, or not powerful enough to remove stocks
prior to looking at them further. The qualitative screening process assesses all variables
collectively to determine each firm’s ability to generate high abnormal stock returns in the
future. Each variable is collected through numerical data and data supplied in each firm’s annual
reports as well as competing companies financial filings. Below is a table of firm specific
variables used in the qualitative screen.
Category Variables
Macroeconomic Drivers
Regulations
Population
Technology Driver
Firm Operations Products/ Patents Development or Moats
Acquisition & Spin-off Quality
Corporate Governance &
Management
Stock Repurchases
Insider Trading
Management Stability
Financial Quality
Profitability Improvement
Earnings Surprise Performance
Downside Beta
Macroeconomic Drivers
Macroeconomic drivers are considered external variables impossible for firms to control, such as
demographics, regulations, available and/or competing technologies. If a firm is exposed to a
macroeconomic risk, it will be mentioned under this variable.
Firm Operations
Acquisition and Spin-off Quality
Acquisitions play a large part in many companies’ growth strategies. This variable assesses each
company’s ability to generate revenue through acquisitions in both the past and the future
depending on the historical data and future plans of each firm.
Corporate Governance and Management
Stock Repurchases
Qualitative Screens & Analysis

Small-Cap Portfolio: Healthcare & Consumer Staples
Page 41 of 57
This indicator represents a firm’s plans to repurchase stock from the public. Usually, a stock
repurchase is a positive signal because it shows the company’s confidence in its financial
condition and undervalued stock price. Here, any stock repurchases over the last two years are
reported in the variable.
Insider Trading
This information shows how many stocks the company executives bought and sold in the past 3
or 12 months. If the number of shares bought exceeds the number of shares sold, it shows a good
signal that the company is in good financial condition and the executives are confident about the
price of their own firm’s shares.
Management Stability
Management stability is measured using several factors including whether or not the founder has
recently left the company or if management has been restructured in a way that may benefit or
hurt the condition of the company. Any issues related to the strength of management or any
signals of a change in management can be found here.
Financial Quality
Profitability Improvement
Many of the quantitative factors used in the initial screening process may have been inflated or
deserve further investigation. This section reports any interesting findings regarding a
company’s improving financial condition upon further investigation of financial data.
Earnings Surprise Performance
This indicator shows how many times in the past 2 years the company earnings actually
exceeded consensus analyst estimates. The more times the company beats its earnings estimates,
the better signal it shows. Another variable used in this analysis is the earnings surprise ratio.
Doyle, Lindholm and Soliman (2006) explain that stocks with high earnings surprise ratios
statistically achieve higher future abnormal returns. The earnings surprise ratio is calculated as:
𝐸𝑆 𝑅𝑎𝑡𝑖𝑜 = (𝐴𝑐𝑡𝑢𝑎𝑙 𝐸𝑃𝑆 − 𝐴𝑛𝑎𝑙𝑦𝑠𝑡 𝐶𝑜𝑛𝑠𝑒𝑛𝑠𝑢𝑠 𝐸𝑃𝑆)/(𝐴𝑐𝑡𝑢𝑎𝑙 𝑆𝑡𝑜𝑐𝑘 𝑃𝑟𝑖𝑐𝑒)
Downside Beta
The downside beta shows the systematic risk a company is exposed to during market downturns.
A downside beta lower than one shows the systematic risk of the company is lower than the
market. A downside beta higher than one shows there is a higher risk behind the company than
the risk of the market. While this variable is useful for consideration, the investment theory
behind this process does not support the theory that historical betas affect future systematic risk.

Small-Cap Portfolio: Healthcare & Consumer Staples
Page 42 of 57
Firm-Specific Qualitative Analysis Tables
Table 6: Post-Screening Firm Overview
Ticker Name STEP 1 STEP 2 STEP 3
BGS B&G Foods Inc 6th/17 6th/11 5th/7
SPTN SpartanNash Co 7th/17 1st/11 3rd/7
MED Medifast Inc 14th/17 NA N/A

Small-Cap Portfolio: Healthcare & Consumer Staples
Page 43 of 57
B&G Foods Inc. (BGS)
B&G Foods Inc. (NYSE: BGS)
B&G Foods manufactures, sells and distributes a diverse portfolio of branded, high quality, shelf-stable
foods and household products in the United States, Canada, and Puerto Rico. The company offers its
products directly, as well as via a network of independent brokers and distributors to supermarket chains,
food service outlets, mass merchants, warehouse clubs, non-food outlets, and specialty distributors.
Macroeconomic
Drivers
The processed food industry is one of the United States' largest industries, which
characterized by relatively stable sales growth, based largely on price and population
increases.
B&G experiences margin pressure in certain markets as a result of competitors' pricing practices.
Firm Operations
The company has been built upon a successful track record of both organic and
acquisition-driven growth.
Net cash provided by operating activities decreased $15.8 million to $99.1 million in fiscal 2014 from $114.9 million in fiscal 2013 was primarily due to costs associated with the
Ortega and Las Palmas recall and other activities.
The company historically financed acquisitions with borrowings and cash flows from operating activities. On January 3, 2015, its total long-term debt of $1,025.9 million, net
of our cash and cash equivalents of $1.5 million, was $1,024.4 million. Stockholders'
equity as of that date was $338.0 million.
Unique multi-channel distribution strategy and unique multi-channel distribution strategy are primary differentiators that allow it to compete in this market.
Corporate
Governance & Management
The company just announced the primary equity offering on 04/28/2015 with an offer
size of 128.52 million.
B&G Food did not repurchase any shares of common stock during fiscal 2014, 2013 or
2012.
The number of shares bought exceeded the number of shares sold for the insider trading
in the past 3 months.
Financial
Quality
6 Analyst coverages
Downside beta is 0.41 comparing to the sector’s beta, which is 0.70.

Small-Cap Portfolio: Healthcare & Consumer Staples
Page 44 of 57
SpartanNash Co. (SPTN)
SpartanNash Co. (NYSE: SPTN)
SpartanNash is a good company with wide distribution range and continuously good acquisitions. The
company shows a financial health, an efficient management, low analyst coverages, and high frequency of
beating the market for earnings surprises. Stock repurchases showed the expectations of the future from the
firm’s prospective. The good financial results give us the confident that the company will continue well-performed in the future.
Macroeconomic
Drivers
Military, Food Distribution and Retail segments operate in highly competitive and low
profit margins markets. However, SpartanNash offers a full set of services, from value added service to the inclusion of fuel centers which helps it to compete with other peers.
Firm Operations
Several projects were planned for the fiscal year ending January 2, 2016 to further
integrate SpartanNash supply chain capabilities across distribution centers and thereby
increase the efficiency of both its inbound and outbound distribution operations.
The distribution facilities are strategically located to efficiently serve the company’s
current customers and have the available capacity to support future growth. the over-
arching focus on the consumer gives it competitive insight into purchasing and consumption behavior.
Corporate Governance &
Management
During fiscal years ended January 3, 2015 and March 30, 2013, the Company
repurchased 245,956 and 634,408 shares of common stock for approximately $5.0
million and $11.4 million, respectively.
The number of shares bought exceeded the number of shares sold for the insider trading in the past 3 months.
Financial Quality
Earnings surprise beat 5 of 6 in the last 6 periods.
4 Analyst coverages
Downside beta is 1.09, which is higher comparing to the consumer staples, 0.70.

Small-Cap Portfolio: Healthcare & Consumer Staples
Page 45 of 57
Medifast Inc (MED)
Medifast Inc. (NTSE: MED)
Midifast has its board of directors reconstituted and decreased from 12 to 9 independent directors. A franchise loan caused Midifast’s revenue and income from operations decreasing in 2014 from the 2013
level. With the development of consumer discretionary, Medifast faces uncertainties of its future profits.
Macroeconomic
Drivers
Consumer discretionary spending environment challenges the revenue of Medifast.
There are various weight loss products and programs within the highly competitive
weight-loss industry.
Firm Operations
Medifast expanded its product line in 2014 by introducing the most new products in the
Company’s history to meet consumer demand.
The Company experienced lower marketing efficiencies and new customer acquisition
during the year because of a default on a franchise loan guaranteed by Medifast and an
increase in legal expenses that caused $2.6 million in extraordinary expenses.
Income from operations decreased by $8.2 million, or 21%, versus 2013 with the percent of sales decreasing to 10.6% in 2014 as compared to 11.9% in 2013.
Medifast Direct Sales revenue decreased 24% to $57.2 million as compared with $75.5
million in 2013, a decrease of $18.3 million.
Corporate Governance &
Management
In the year ended December 31, 2014, Cash from financing activities was used to
purchase $33.9 million of treasury stock in the open market.
Medifast announced reconstitution of board of directors in 04/07/2015, which will eliminate its classified board and decrease the size of the board from 12 to 9.
The number of shares sold exceeded the number of shares bought for the insider trading
in the past 12 months.
Financial Quality
4 Analyst coverages
Downside beta is 0.43 comparing to the sector’s beta, which is 0.70.
B&G Foods (NYSE: BGS)- BUY
We suggest buying BGS because this stock ranked highly in all of the quantitative screens. The
company has the highest scoring Inventory Turnover ratio, GS ratio, and Margins. The high
inventory ratio shows that the company saves huge amounts of money on storage costs and the
customers are willing to buy its products, meaning the company is gaining market share from
other competitors. Both the high GS and Margins tells us the company’s sales are increasing
rapidly year by year and becoming more efficient. From the qualitative aspect, the company
historically finances the acquisitions by borrowing long-term debt. The debt to equity ratio for
B&G Foods is over 1. In many situations, this could be a dangerous strategy. However, we
Investment Idea Summary

Small-Cap Portfolio: Healthcare & Consumer Staples
Page 46 of 57
believe that the defensiveness and constant demand for Consumer Staples products will protect
BGS from competitors with less debt. Comparing to the Consumer Staple sector, it has a low
beta, which is 0.41. Therefore, we suggest buy BGS stock.
SpartanNash Co. (NASDAQ: SPTN)- HOLD
SpartanNash is a leading multi-regional grocery distributor and grocery retailer and the largest
distributor, by revenue, of grocery products to military commissaries and exchanges in the
United States. We give a ‘hold’ recommendation because this stock passed both of our
quantitative and qualitative screen. Especially in quantitative screen step 3, it ranks at the top.
The company has the highest Inventory Turnover ratio which shows the company can sell and
replace its products efficiently. The high GS ratio shows the company increases its revenue year
by year. Additionally, the high leverage ratio guarantees the company’s high ability to payback
short-term debt. From the qualitative aspect, it has a wide distribution range and continuously
good acquisitions. The company shows strong financial health, an efficient management, low
analyst coverages, and high frequency of beating the market for earnings surprises. Stock
repurchases showed confident expectations of the future from the firm’s inside perspective. The
good financial results give us confidence that the company will continue to outperform in the
future. In summary, the best choice for us is to hold SPTN stock.
Medifast Inc. (NYSE: MED)-STRONG SELL
Medifast engages in the production, distribution, and sale of nutritional and weight-management
products since the company was founded. The company is a Darwin Fenner Student
Management Fund current holding. In the quantitative screening, Medifast was knocked out in
the first fundamental growth screening, ranking the 14th of 17 stocks. The company performed
poorly in change in gross profit over assets as well as asset turnover, which means Medifast
could not use its assets efficiently to generate profits. After analyzing the qualitative and
quantitative prospectus, we found that Medifast had its board of directors reconstituted and
decreased from 12 to 9 independent directors. Furthermore, a franchise loan caused Medifast’s
revenue and income from operations decreasing in 2014 from the 2013 level. With the
development of consumer discretionary, Medifast faces uncertainties of its future profits.
Therefore, we strongly recommend a sell recommendation for Medifast.
Small-Cap Portfolio: Healthcare & Consumer Staples
Page 47 of 57
Bloomberg
SEC Filings
IBIS World
Kenneth R. French – Data Library
Department of Health and Human Services, “What’s Medicare?”
Research America, “Truth and Consequences: Health R&D Spending in the U.S.”
Chan, Lakonishok, and Sougiannis, “The Stock Market Valuation of Research
and Development Expenditures,” Journal of Finance, 2001, Vol. 56, pp. 2431-
2456
Eberhart, Maxwell, and Siddique, "An Examination of Long-Term Abnormal
Stock Returns and Operating Performance Following R&D Increases," Journal of
Finance, 2004, Vol. 59, pp. 623-650
Hirshleifer, Hsu and Li, "Innovative Efficiency and Stock Returns" Journal of
Financial Economics, 2013, Vol. 107, pp. 632-654
Fama and French, “The Cross-Section of Expected Stock Returns,” Journal of
Finance, June 1992, Vol. 47, No. 2, pp. 427-465
Piotroski and So, “Identifying Expectation Errors in Value/Glamour Strategies: A
Fundamental Analysis Approach,” Review of Financial Studies, 2012, Vol. 25,
pp. 2841-2875
Doyle, Lundholm and Soliman, “The Extreme Future Stock Returns Following
I/B/E/S Earnings Surprises,” Journal of Accounting Research, Dec. 2006, Vol. 44,
Issue: 5, pp. 849-887
Novy-Marx, “The Other Side of Value: The Gross Profitability Premium, Journal
of Financial Economics, 2013, Vol. 108, pp. 1-28
Asness, Frazzini, and Pedersen, “Quality Minus Junk,” 2014 AQR Capital
Management and New York University Working Paper
Loughran and Ritter, “The New Issues Puzzle” Journal of Finance, March 1995,
Vol. 50, No. 1, pp. 23-51
References

Small-Cap Portfolio: Healthcare & Consumer Staples
Page 48 of 57
Exhibit 1: Step 1
(Healthcare)
Appendix
Ticker Delta ROA
Delta Gross
Margin
Delta GP
Over Assets
Delta Asset
Turnover
Delta
Leverage
Delta Current
Ratio
Delta Accruals
Over Assets
S6HLTH Index
ABAX UW Equity -0.00154 -2.39344 -0.01379 -0.00119 -0.00038 0.76645 -0.02589
ABMD UW Equity 0.02326 0.46793 0.04240 0.06391 0.00000 0.02884 0.00160
ACET UW Equity 0.01346 2.17313 0.01006 -0.08100 0.01602 -0.01865 0.00949
ACOR UW Equity -0.02172 0.89966 -0.06940 -0.07808 0.07356 -0.18518 0.00680
AFAM UW Equity -0.01650 -1.36233 -0.01316 -0.01272 0.04182 -0.38393 0.01360
AFFX UW Equity 0.00494 0.15472 0.02561 0.04198 0.01479 -0.96163 0.00987
AHS UN Equity 0.01417 0.80636 -0.00063 -0.00197 -0.04150 0.02277 0.01155
AIRM UW Equity 0.00762 3.17710 0.03566 0.00486 -0.01888 0.24002 -0.00110
ALOG UW Equity 0.00514 1.97649 0.00578 -0.02170 0.00000 0.03616 0.00106
AMED UW Equity 0.12214 -1.40231 -0.01152 0.12161 0.00862 -0.07042 0.19706
AMRI UW Equity 0.02241 1.83186 -0.00145 -0.02284 0.13503 0.42501 0.02764
AMSG UW Equity -0.02477 -0.07352 -0.02734 -0.04887 0.03978 -0.22348 -0.00121
ANGO UW Equity -0.00700 -2.50676 -0.01603 -0.01177 0.04831 -1.83727 0.00915
ANIK UW Equity 0.04487 7.17507 0.04871 0.03758 -0.02088 6.28766 0.00093
ANIP UQ Equity 0.17623 -3.00282 0.04960 0.09547 0.08790 2.44941 0.02112
BABY UW Equity 0.03282 1.29276 0.02006 0.02444 -0.00063 -0.00528 0.02354
BRLI UW Equity -0.01134 -1.33892 -0.06111 -0.08993 -0.00220 -0.02405 0.01551
CBM UN Equity 0.02409 1.35619 0.01293 0.02095 -0.04932 -0.00212 0.01727
CCRN UW Equity -0.03816 -0.54346 0.04741 0.29481 0.04825 -0.06203 -0.01579
CHE UN Equity 0.00251 0.17408 0.00198 -0.00231 -0.01510 -0.01415 0.03206
CMN UN Equity 0.00463 1.82303 0.00490 -0.03594 0.02391 -0.03320 -0.00483
CNMD UW Equity 0.00718 0.96290 -0.00772 -0.02011 0.03891 0.18925 0.02304
CPSI UW Equity -0.01202 0.04104 -0.02949 -0.10521 0.00000 0.41308 0.01533
CRVL UW Equity 0.00379 -0.90416 -0.02742 -0.02884 0.00000 0.06143 0.01037
CRY UN Equity -0.00197 -0.09512 -0.00039 -0.00684 0.00000 0.41050 0.01827
CYBX UW Equity -0.02066 0.79548 0.01008 -0.00713 0.00421 0.72311 0.00472
CYNO UW Equity 0.02207 0.06054 -0.00946 -0.01477 0.00964 -0.17670 0.01041
DEPO UW Equity -0.08559 0.09643 -0.01514 -0.02241 0.10300 2.66440 0.07453
EBS UN Equity 0.00634 -3.62672 -0.01069 0.01197 0.04089 0.35654 -0.02361
ENSG UW Equity -0.01160 -0.27988 0.05015 0.07639 -0.05540 0.07899 -0.01169
EXAM UN Equity 0.01055 0.61002 0.02774 0.00824 -0.01556 -0.16131 0.02252
GB UN Equity 0.00824 0.64581 0.00960 0.01255 -0.02549 0.13670 0.01206
HAE UN Equity -0.02586 -0.86220 -0.03434 -0.06293 0.07803 -0.41946 -0.00510
HGR UN Equity 0.00952 -0.06703 0.01173 -0.00334 -0.03899 0.16520 0.00525
HSTM UW Equity -0.00660 -1.86117 0.01237 0.01408 0.00000 -0.38774 0.00129
HWAY UW Equity 0.06456 -2.15339 -0.02464 0.02463 -0.03025 -0.03956 0.07469
IART UW Equity -0.00096 0.11462 -0.01347 -0.01135 -0.01696 -0.07984 0.01095
ICUI UW Equity -0.02715 0.61641 -0.03834 -0.10066 0.00000 2.11147 -0.00183
IPCM UW Equity -0.01227 0.04665 -0.03262 -0.14357 0.04338 -0.02561 -0.00908
IPXL UW Equity -0.00733 0.69880 -0.00541 -0.02327 0.00000 0.25937 -0.01428
IVC UN Equity -0.01614 -1.56379 -0.00473 0.02053 -0.05755 -0.15807 0.00508
KND UN Equity 0.00529 1.00922 0.00848 -0.21742 0.04482 0.05625 0.01379
LCI UN Equity 0.06051 10.93911 0.08160 0.09392 -0.01293 0.98317 0.00167
LDR UN Equity -0.08459 -2.79389 -0.01647 -0.03564 0.20207 0.11361 -0.06958
LGND UQ Equity -0.03779 0.72906 0.01987 0.04375 0.16203 2.46332 -0.03445
LHCG UW Equity -0.03329 -1.22569 -0.03416 -0.02556 0.01192 -0.05949 -0.06448
LMNX UW Equity 0.02100 0.78300 -0.00525 -0.01006 -0.00239 -0.46075 0.01552
MASI UW Equity -0.01285 -0.13000 -0.02074 -0.01829 0.06052 -0.30606 -0.00002
MDAS UW Equity 0.00009 -0.93433 0.01940 0.03471 -0.00376 0.00998 -0.00561
MDCO UW Equity -0.06966 -2.44805 -0.04604 -0.07418 0.03576 -0.49611 -0.02699
MDSO UW Equity -0.05943 1.09906 -0.05930 -0.10288 0.10313 0.56389 -0.04005
MGLN UW Equity -0.01705 -1.10596 -0.02865 0.00490 0.04071 0.00341 -0.02773
MMSI UW Equity -0.00674 -0.61522 -0.02237 -0.06041 0.06441 -0.16728 -0.00415
MNTA UW Equity -0.17468 -0.19473 -0.16235 -0.15710 0.00000 -5.42963 0.00179
MOH UN Equity 0.00119 -0.34436 -0.03854 -0.14435 0.02362 -0.08306 -0.04578
NEOG UW Equity -0.00796 -0.42880 -0.01272 -0.02447 0.00000 0.22551 0.01555
NUVA UW Equity 0.01934 -1.05887 0.01673 0.01523 -0.02424 0.14360 0.00982
OMCL UW Equity 0.00753 -0.75326 0.01521 0.04469 0.00000 -0.71821 -0.00224
PBH UN Equity 0.00317 1.90619 0.00923 -0.00788 0.01988 0.03859 0.01339
PMC UN Equity -0.00749 1.24645 -0.01198 -0.22908 -0.00975 -0.52011 -0.01266
PRSC UW Equity -0.00624 -0.30088 -0.04647 -0.19968 0.01506 -0.12514 -0.00237
PRXL UW Equity 0.01007 0.00083 0.02543 0.06935 0.00601 -0.06406 -0.04128
QSII UW Equity -0.03883 -4.47837 -0.03766 -0.02378 0.00000 0.01161 -0.04821
RGEN UW Equity 0.01464 -6.00529 0.01462 0.05330 0.00000 -1.50060 -0.01211
SEM UN Equity 0.00120 -0.64521 -0.00462 0.01554 0.00910 0.02623 0.00773
SPPI UW Equity -0.08479 1.02152 -0.05538 -0.09813 0.04980 -0.28076 -0.02746
SRDX UW Equity 0.01989 -0.38697 0.04528 0.05538 0.00000 2.90747 -0.00124
VASC UW Equity -0.00338 0.03592 -0.02410 -0.02022 0.00000 0.19489 0.00552
VIVO UW Equity 0.00822 -0.02679 0.00311 0.00448 0.00000 0.76313 -0.01379
WST UN Equity 0.00728 1.01552 0.00716 -0.01393 -0.00974 0.22343 0.00253

Small-Cap Portfolio: Healthcare & Consumer Staples
Page 49 of 57
Exhibit 1:
Step 1 Ranks
(Healthcare)
Ticker Delta ROA
Delta Gross
Margin
Delta GP Over
Assets
Delta Asset
Turnover
Delta
Leverage
Delta Current
Ratio
Delta Accruals
Over Assets Total Scores
S6HLTH Index
ANIK UW Equity 5 5 5 5 5 5 3 33
LCI UN Equity 5 5 5 5 4 5 3 32
AIRM UW Equity 4 5 5 4 5 4 3 30
SRDX UW Equity 5 2 5 5 4 5 4 30
ABMD UW Equity 5 4 5 5 4 3 3 29
BABY UW Equity 5 5 5 4 4 3 1 27
CBM UN Equity 5 5 4 4 5 3 1 27
ENSG UW Equity 2 2 5 5 5 4 4 27
GB UN Equity 4 4 4 4 5 4 2 27
PRXL UW Equity 4 3 5 5 3 2 5 27
VIVO UW Equity 4 3 3 4 4 5 4 27
HGR UN Equity 4 3 4 3 5 4 3 26
LGND UQ Equity 1 4 5 5 1 5 5 26
MDAS UW Equity 3 2 5 5 4 3 4 26
NUVA UW Equity 5 2 4 4 5 4 2 26
WST UN Equity 4 4 4 3 4 4 3 26
ALOG UW Equity 4 5 4 2 4 3 3 25
ABAX UW Equity 3 1 2 4 4 5 5 24
AHS UN Equity 4 4 3 3 5 3 2 24
CYBX UW Equity 2 4 4 3 3 5 3 24
EXAM UN Equity 4 4 5 4 4 2 1 24
IPXL UW Equity 2 4 3 2 4 4 5 24
OMCL UW Equity 4 2 4 5 4 1 4 24
RGEN UW Equity 5 1 4 5 4 1 4 24
ANIP UQ Equity 5 1 5 5 1 5 1 23
EBS UN Equity 4 1 3 4 2 4 5 23
PBH UN Equity 3 5 4 3 3 3 2 23
ACET UW Equity 4 5 4 1 3 3 2 22
AFFX UW Equity 3 3 5 5 3 1 2 22
AMRI UW Equity 5 5 3 2 1 5 1 22
CCRN UW Equity 1 2 5 5 2 2 5 22
CMN UN Equity 3 5 4 2 2 2 4 22
CRY UN Equity 3 3 3 3 4 5 1 22
CHE UN Equity 3 4 3 3 4 3 1 21
CNMD UW Equity 4 4 3 3 2 4 1 21
CYNO UW Equity 5 3 3 3 3 2 2 21
KND UN Equity 4 4 4 1 2 4 2 21
LMNX UW Equity 5 4 3 3 4 1 1 21
VASC UW Equity 3 3 2 2 4 4 3 21
AMED UW Equity 5 1 3 5 3 2 1 20
HSTM UW Equity 3 1 4 4 4 1 3 20
HWAY UW Equity 5 1 2 4 5 2 1 20
IART UW Equity 3 3 2 3 5 2 2 20
ICUI UW Equity 1 4 1 1 4 5 4 20
IVC UN Equity 2 1 3 4 5 2 3 20
MGLN UW Equity 2 2 2 4 2 3 5 20
PMC UN Equity 2 5 3 1 4 1 4 20
SEM UN Equity 3 2 3 4 3 3 2 20
CRVL UW Equity 3 2 2 2 4 4 2 19
MDSO UW Equity 1 5 1 1 1 5 5 19
CPSI UW Equity 2 3 1 1 4 5 2 18
MOH UN Equity 3 2 1 1 3 2 5 17
NEOG UW Equity 2 2 2 2 4 4 1 17
QSII UW Equity 1 1 1 2 4 3 5 17
IPCM UW Equity 2 3 1 1 2 3 4 16
LDR UN Equity 1 1 2 2 1 4 5 16
PRSC UW Equity 3 2 1 1 3 2 4 16
AMSG UW Equity 1 3 2 2 2 1 4 15
DEPO UW Equity 1 3 2 2 1 5 1 15
LHCG UW Equity 1 1 1 2 3 2 5 15
MASI UW Equity 2 3 2 3 1 1 3 15
MMSI UW Equity 2 2 2 2 1 2 4 15
SPPI UW Equity 1 5 1 1 1 1 5 15
MNTA UW Equity 1 3 1 1 4 1 3 14
ACOR UW Equity 1 4 1 1 1 2 3 13
AFAM UW Equity 2 1 2 3 2 1 2 13
ANGO UW Equity 2 1 2 3 2 1 2 13
BRLI UW Equity 2 1 1 1 4 3 1 13
HAE UN Equity 1 2 1 2 1 1 4 12
MDCO UW Equity 1 1 1 1 2 1 5 12
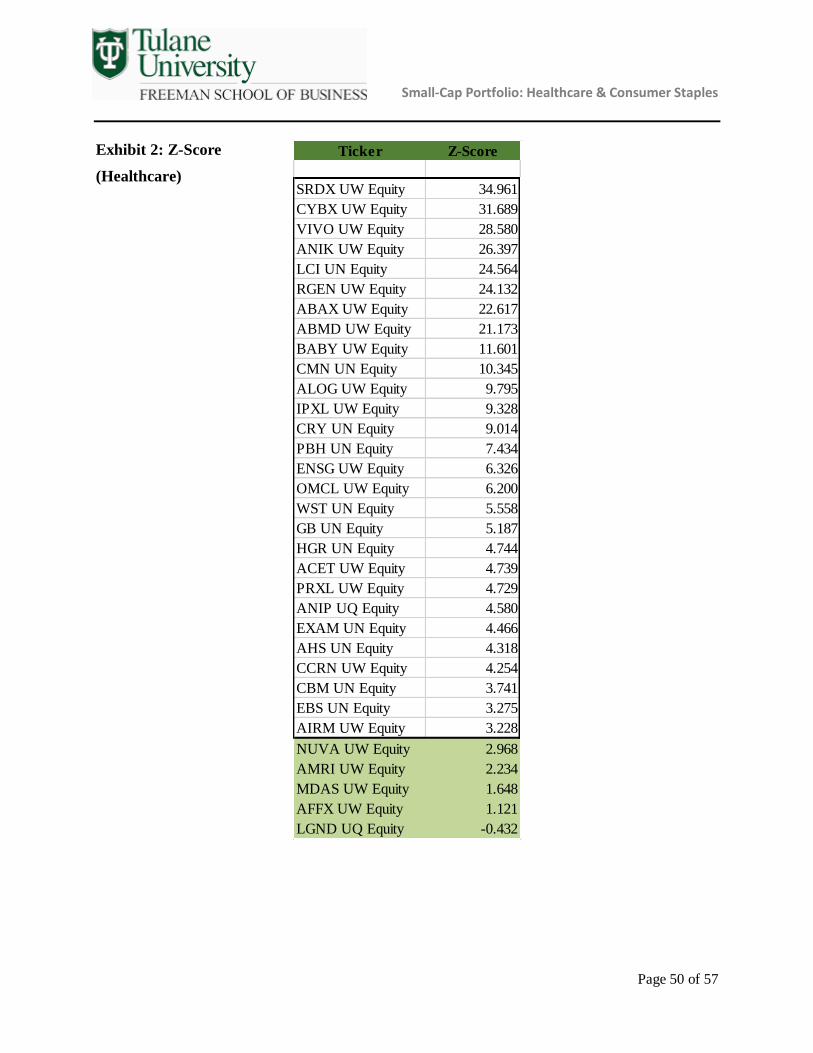
Small-Cap Portfolio: Healthcare & Consumer Staples
Page 50 of 57
Exhibit 2: Z-Score
(Healthcare)
Ticker Z-Score
SRDX UW Equity 34.961
CYBX UW Equity 31.689
VIVO UW Equity 28.580
ANIK UW Equity 26.397
LCI UN Equity 24.564
RGEN UW Equity 24.132
ABAX UW Equity 22.617
ABMD UW Equity 21.173
BABY UW Equity 11.601
CMN UN Equity 10.345
ALOG UW Equity 9.795
IPXL UW Equity 9.328
CRY UN Equity 9.014
PBH UN Equity 7.434
ENSG UW Equity 6.326
OMCL UW Equity 6.200
WST UN Equity 5.558
GB UN Equity 5.187
HGR UN Equity 4.744
ACET UW Equity 4.739
PRXL UW Equity 4.729
ANIP UQ Equity 4.580
EXAM UN Equity 4.466
AHS UN Equity 4.318
CCRN UW Equity 4.254
CBM UN Equity 3.741
EBS UN Equity 3.275
AIRM UW Equity 3.228
NUVA UW Equity 2.968
AMRI UW Equity 2.234
MDAS UW Equity 1.648
AFFX UW Equity 1.121
LGND UQ Equity -0.432
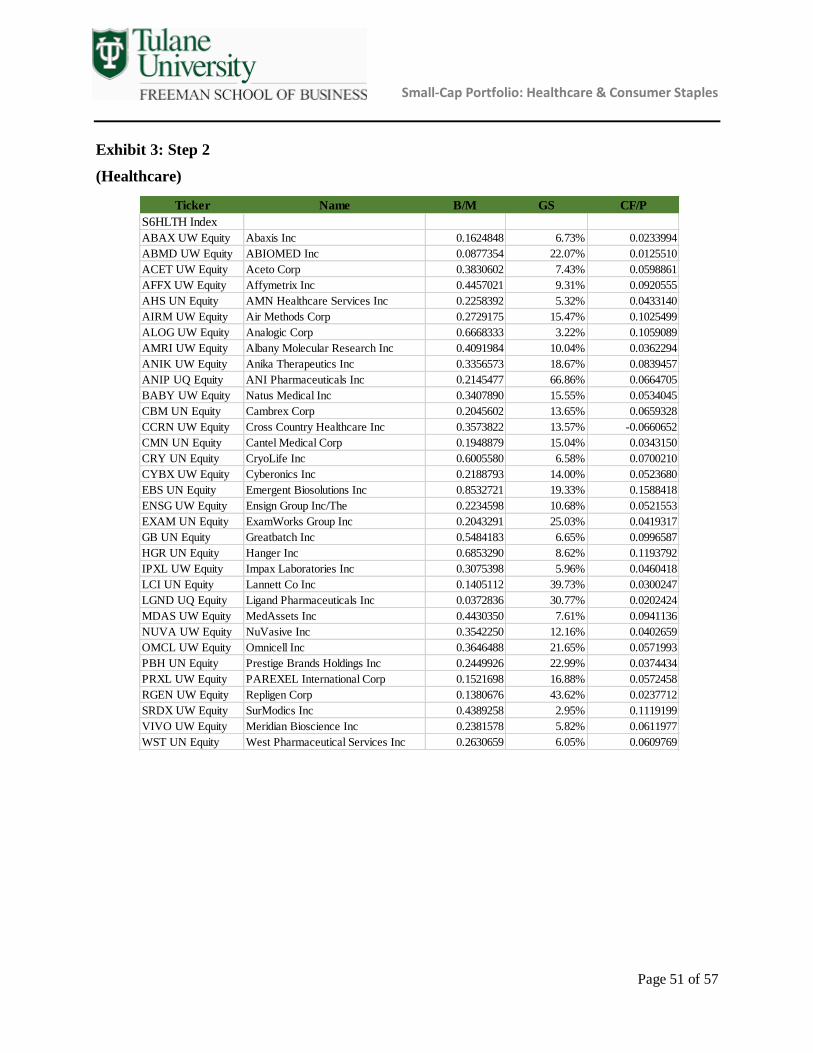
Small-Cap Portfolio: Healthcare & Consumer Staples
Page 51 of 57
Exhibit 3: Step 2
(Healthcare)
Ticker Name B/M GS CF/P
S6HLTH Index
ABAX UW Equity Abaxis Inc 0.1624848 6.73% 0.0233994
ABMD UW Equity ABIOMED Inc 0.0877354 22.07% 0.0125510
ACET UW Equity Aceto Corp 0.3830602 7.43% 0.0598861
AFFX UW Equity Affymetrix Inc 0.4457021 9.31% 0.0920555
AHS UN Equity AMN Healthcare Services Inc 0.2258392 5.32% 0.0433140
AIRM UW Equity Air Methods Corp 0.2729175 15.47% 0.1025499
ALOG UW Equity Analogic Corp 0.6668333 3.22% 0.1059089
AMRI UW Equity Albany Molecular Research Inc 0.4091984 10.04% 0.0362294
ANIK UW Equity Anika Therapeutics Inc 0.3356573 18.67% 0.0839457
ANIP UQ Equity ANI Pharmaceuticals Inc 0.2145477 66.86% 0.0664705
BABY UW Equity Natus Medical Inc 0.3407890 15.55% 0.0534045
CBM UN Equity Cambrex Corp 0.2045602 13.65% 0.0659328
CCRN UW Equity Cross Country Healthcare Inc 0.3573822 13.57% -0.0660652
CMN UN Equity Cantel Medical Corp 0.1948879 15.04% 0.0343150
CRY UN Equity CryoLife Inc 0.6005580 6.58% 0.0700210
CYBX UW Equity Cyberonics Inc 0.2188793 14.00% 0.0523680
EBS UN Equity Emergent Biosolutions Inc 0.8532721 19.33% 0.1588418
ENSG UW Equity Ensign Group Inc/The 0.2234598 10.68% 0.0521553
EXAM UN Equity ExamWorks Group Inc 0.2043291 25.03% 0.0419317
GB UN Equity Greatbatch Inc 0.5484183 6.65% 0.0996587
HGR UN Equity Hanger Inc 0.6853290 8.62% 0.1193792
IPXL UW Equity Impax Laboratories Inc 0.3075398 5.96% 0.0460418
LCI UN Equity Lannett Co Inc 0.1405112 39.73% 0.0300247
LGND UQ Equity Ligand Pharmaceuticals Inc 0.0372836 30.77% 0.0202424
MDAS UW Equity MedAssets Inc 0.4430350 7.61% 0.0941136
NUVA UW Equity NuVasive Inc 0.3542250 12.16% 0.0402659
OMCL UW Equity Omnicell Inc 0.3646488 21.65% 0.0571993
PBH UN Equity Prestige Brands Holdings Inc 0.2449926 22.99% 0.0374434
PRXL UW Equity PAREXEL International Corp 0.1521698 16.88% 0.0572458
RGEN UW Equity Repligen Corp 0.1380676 43.62% 0.0237712
SRDX UW Equity SurModics Inc 0.4389258 2.95% 0.1119199
VIVO UW Equity Meridian Bioscience Inc 0.2381578 5.82% 0.0611977
WST UN Equity West Pharmaceutical Services Inc 0.2630659 6.05% 0.0609769
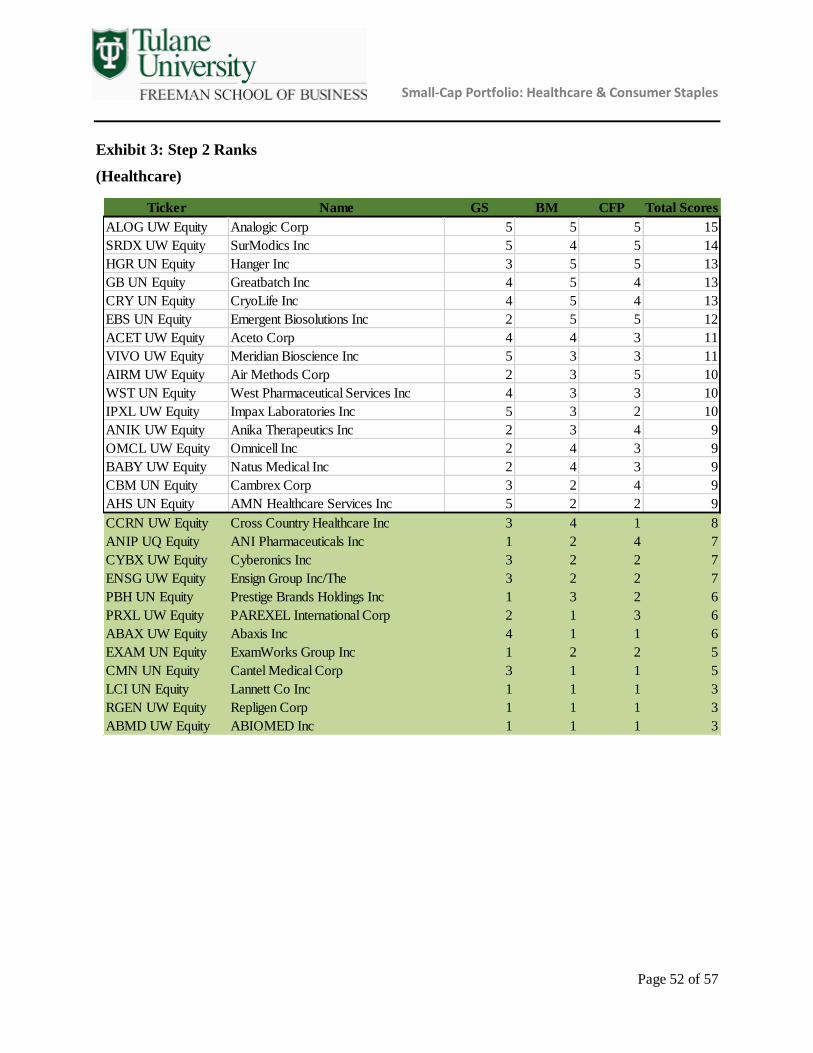
Small-Cap Portfolio: Healthcare & Consumer Staples
Page 52 of 57
Exhibit 3: Step 2 Ranks
(Healthcare)
Ticker Name GS BM CFP Total Scores
ALOG UW Equity Analogic Corp 5 5 5 15
SRDX UW Equity SurModics Inc 5 4 5 14
HGR UN Equity Hanger Inc 3 5 5 13
GB UN Equity Greatbatch Inc 4 5 4 13
CRY UN Equity CryoLife Inc 4 5 4 13
EBS UN Equity Emergent Biosolutions Inc 2 5 5 12
ACET UW Equity Aceto Corp 4 4 3 11
VIVO UW Equity Meridian Bioscience Inc 5 3 3 11
AIRM UW Equity Air Methods Corp 2 3 5 10
WST UN Equity West Pharmaceutical Services Inc 4 3 3 10
IPXL UW Equity Impax Laboratories Inc 5 3 2 10
ANIK UW Equity Anika Therapeutics Inc 2 3 4 9
OMCL UW Equity Omnicell Inc 2 4 3 9
BABY UW Equity Natus Medical Inc 2 4 3 9
CBM UN Equity Cambrex Corp 3 2 4 9
AHS UN Equity AMN Healthcare Services Inc 5 2 2 9
CCRN UW Equity Cross Country Healthcare Inc 3 4 1 8
ANIP UQ Equity ANI Pharmaceuticals Inc 1 2 4 7
CYBX UW Equity Cyberonics Inc 3 2 2 7
ENSG UW Equity Ensign Group Inc/The 3 2 2 7
PBH UN Equity Prestige Brands Holdings Inc 1 3 2 6
PRXL UW Equity PAREXEL International Corp 2 1 3 6
ABAX UW Equity Abaxis Inc 4 1 1 6
EXAM UN Equity ExamWorks Group Inc 1 2 2 5
CMN UN Equity Cantel Medical Corp 3 1 1 5
LCI UN Equity Lannett Co Inc 1 1 1 3
RGEN UW Equity Repligen Corp 1 1 1 3
ABMD UW Equity ABIOMED Inc 1 1 1 3

Small-Cap Portfolio: Healthcare & Consumer Staples
Page 53 of 57
Exhibit 4: Step 3
(Healthcare)
Exhibit 4: Step 3 Ranks
(Healthcare)
Ticker Name ROA
Gross Profit
Over Assets
Gross
Margin
Cash Flow
Over Assets
Accruals Over
Assets
ACET UW Equity Aceto Corp 6.22% 24.12% 22.48% 1.98% -4.49%
AHS UN Equity AMN Healthcare Services Inc 4.87% 46.36% 30.51% 7.89% 0.21%
AIRM UW Equity Air Methods Corp 7.30% 35.25% 47.76% 18.98% 2.88%
ALOG UW Equity Analogic Corp 11.16% 27.16% 42.45% 13.61% 0.29%
ANIK UW Equity Anika Therapeutics Inc 20.97% 39.40% 80.18% 1.66% -20.03%
BABY UW Equity Natus Medical Inc 10.98% 40.86% 60.25% 8.29% -3.49%
CBM UN Equity Cambrex Corp 13.06% 23.78% 33.05% 17.60% 0.06%
CRY UN Equity CryoLife Inc 7.04% 45.66% 63.12% 12.32% 3.12%
EBS UN Equity Emergent Biosolutions Inc 10.70% 24.91% 73.69% 6.22% -6.78%
GB UN Equity Greatbatch Inc 9.17% 20.89% 33.64% 10.16% -1.25%
HGR UN Equity Hanger Inc 5.00% 57.20% 69.51% 9.74% 1.72%
IPXL UW Equity Impax Laboratories Inc 10.20% 23.82% 52.45% 10.05% -2.43%
OMCL UW Equity Omnicell Inc 8.33% 36.62% 53.04% 8.73% -1.47%
SRDX UW Equity SurModics Inc 22.72% 32.13% 86.04% 12.04% -12.16%
VIVO UW Equity Meridian Bioscience Inc 21.10% 55.86% 62.09% 24.11% 0.49%
WST UN Equity West Pharmaceutical Services Inc 8.78% 25.23% 31.50% 20.55% 5.47%
Ticker Name ROA GPOA GM CFOA AOA Total Scores
SRDX UW Equity SurModics Inc 5 3 5 3 5 21
VIVO UW Equity Meridian Bioscience Inc 5 5 4 5 2 21
ANIK UW Equity Anika Therapeutics Inc 5 4 5 1 5 20
BABY UW Equity Natus Medical Inc 4 4 3 2 4 17
EBS UN Equity Emergent Biosolutions Inc 3 2 5 1 5 16
ALOG UW Equity Analogic Corp 4 2 2 4 2 14
CRY UN Equity CryoLife Inc 1 4 4 4 1 14
IPXL UW Equity Impax Laboratories Inc 3 1 3 3 4 14
HGR UN Equity Hanger Inc 1 5 4 2 1 13
AIRM UW Equity Air Methods Corp 2 3 2 5 1 13
OMCL UW Equity Omnicell Inc 2 3 3 2 3 13
CBM UN Equity Cambrex Corp 4 1 1 4 3 13
GB UN Equity Greatbatch Inc 3 1 2 3 3 12
WST UN Equity West Pharmaceutical Services Inc 2 2 1 5 1 11
AHS UN Equity AMN Healthcare Services Inc 1 5 1 1 2 10
ACET UW Equity Aceto Corp 1 1 1 1 4 8

Small-Cap Portfolio: Healthcare & Consumer Staples
Page 54 of 57
Exhibit 5: Step 1
(Consumer Staples)
Exhibit 5: Step 1 Ranks
(Consumer Staples)
Ticker Delta ROA
Delta Gross
Margin
Delta GP
Over Assets
Delta Asset
Turnover
Delta Inventory
Turnover
Delta
Leverage
Delta Current
Ratio
Delta Accruals
Over Assets Total Scores
S6CONS Index
CALM UW Equity 4 4 4 4 3 4 3 3 29
SAFM UW Equity 4 4 4 4 2 4 1 4 27
SENEA UW Equity 2 2 3 4 3 1 4 3 22
DMND UW Equity 1 4 4 3 3 1 3 3 22
CVGW UW Equity 1 3 4 2 1 4 2 4 21
BGS UN Equity 1 1 3 3 4 3 2 3 20
SPTN UW Equity 3 1 1 4 4 1 4 2 20
UVV UN Equity 2 1 2 3 4 3 3 1 19
WDFC UW Equity 4 4 2 3 1 2 1 2 19
CASY UW Equity 3 2 3 2 2 4 2 1 19
CENTA UW Equity 2 2 2 2 1 2 4 4 19
JJSF UW Equity 3 3 3 2 2 2 1 2 18
IPAR UW Equity 1 1 1 1 3 2 4 4 17
MED UN Equity 2 2 1 1 4 3 2 1 16
ANDE UW Equity 3 3 2 1 2 3 1 1 16
LNCE UW Equity 4 3 1 1 1 1 1 1 13
DAR UN Equity 1 1 1 1 1 1 3 2 11

Small-Cap Portfolio: Healthcare & Consumer Staples
Page 55 of 57
Exhibit 6: Step Z
(Consumer Staples)
Ticker Name Altman Z Score
S6CONS Index
JJSF UW Equity J&J Snack Foods Corp 12.81000042
SAFM UW Equity Sanderson Farms Inc 10.39999962
CALM UW Equity Cal-Maine Foods Inc 8.937999725
CVGW UW Equity Calavo Growers Inc 7.474999905
WDFC UW Equity WD-40 Co 7.21600008
SPTN UW Equity SpartanNash Co 6.162000179
CASY UW Equity Casey's General Stores Inc 5.809999943
BGS UN Equity B&G Foods Inc 5.784999847
SENEA UW Equity Seneca Foods Corp 3.634000063
UVV UN Equity Universal Corp/VA 3.236999989
CENTA UW Equity Central Garden & Pet Co 3.154000044
DMND UW Equity Diamond Foods Inc 1.92900002

Small-Cap Portfolio: Healthcare & Consumer Staples
Page 56 of 57
Exhibit 7: Step 2
(Consumer Staples)
Exhibit 7: Step 2 Ranks
(Consumer Staples)
Ticker B/M GS CF/P
S6CONS Index
BGS UN Equity 0.20937 16.0% 0.04236
CALM UW Equity 0.31269 15.3% 0.07729
CASY UW Equity 0.20606 12.0% 0.07605
CENTA UW Equity 0.96885 -0.4% 0.09082
CVGW UW Equity 0.20534 14.7% 0.00767
JJSF UW Equity 0.28002 7.4% 0.05421
SAFM UW Equity 0.49017 12.2% 0.17782
SENEA UW Equity 1.20866 3.9% 0.11379
SPTN UW Equity 0.61670 68.8% 0.12181
UVV UN Equity 1.31045 -0.3% 0.18024
WDFC UW Equity 0.13892 4.4% 0.04068
Ticker B/M GS CF/P Total Scores
S6CONS Index
SPTN UW Equity 3 4 4 11
CALM UW Equity 3 4 3 10
SAFM UW Equity 3 3 4 10
SENEA UW Equity 4 2 3 9
UVV UN Equity 4 1 4 9
BGS UN Equity 2 4 2 8
CENTA UW Equity 4 1 3 8
CASY UW Equity 2 3 2 7
JJSF UW Equity 2 2 2 6
CVGW UW Equity 1 3 1 5
WDFC UW Equity 1 2 1 4

Small-Cap Portfolio: Healthcare & Consumer Staples
Page 57 of 57
Exhibit 8: Step 3
(Consumer Staples)
Exhibit 8: Step 3 Ranks
(Consumer Staples)
Ticker Name ROA
Gross Profit
Over Assets Gross Margin
Cash Flow
Over Assets
Accruals Over
Assets
S6CONS Index
BGS UN Equity B&G Foods Inc 2.48% 15.02% 29.22% 3.61% -0.02%
CALM UW Equity Cal-Maine Foods Inc 13.53% 37.30% 21.01% 20.52% -0.30%
CENTA UW Equity Central Garden & Pet Co 0.85% 39.52% 28.30% 4.76% 2.41%
SAFM UW Equity Sanderson Farms Inc 22.41% 46.88% 18.77% 36.31% -1.54%
SENEA UW Equity Seneca Foods Corp 1.79% 11.83% 6.79% 6.59% 2.26%
SPTN UW Equity SpartanNash Co 3.06% 59.83% 14.60% -9.44% -17.16%
UVV UN Equity Universal Corp/VA 6.83% 19.08% 17.04% 6.39% -2.47%
Ticker Name ROA
Gross Profit
Over Assets
Gross
Margin
Cash Flow
Over Assets
Accruals Over
Assets Total Score
SAFM UW Equity Sanderson Farms Inc 4 3 2 4 3 16
CALM UW Equity Cal-Maine Foods Inc 3 2 3 3 2 13
SPTN UW Equity SpartanNash Co 2 4 1 1 4 12
UVV UN Equity Universal Corp/VA 3 2 2 2 3 12
BGS UN Equity B&G Foods Inc 2 1 4 1 2 10
CENTA UW Equity Central Garden & Pet Co 1 3 3 2 1 10
SENEA UW Equity Seneca Foods Corp 1 1 1 3 1 7
![Final_report-European Common Quality Assurance Framework[1]](https://static.documents.pub/doc/80x56/577cdab61a28ab9e78a65804/finalreport-european-common-quality-assurance-framework1.jpg)


