62
Report Cards 2009 Darwin Harbour Region
Report Cards 2009Darwin Harbour Region

This report was compiled by Julia Fortune and John Drewry, with contributions from Gisela Lamche, Peter Dostine, Julia Schult, Tony Boland, Matt Majid and George Maly.
Aquatic Health Unit. Department of Natural Resources, Environment, The Arts and Sport. Palmerston NT 0831. Website: www.nt.gov.au/nreta/water/aquatic/index.html
���������� ����������������������������������������������������������������������������������monitoring. The reader is advised that some information may be unavailable, incomplete or unable to be applied in ����������������������������������������������������������������������������������������������and/or industry practices.
© 2009 Department of Natural Resources, Environment, The Arts and Sport.Copyright protects this publication. It may be reproduced for study, research or training purposes subject to the inclusion of an acknowledgement of the source and no commercial use or sale.
Annual publicationISBN 978-1-921519-40-6
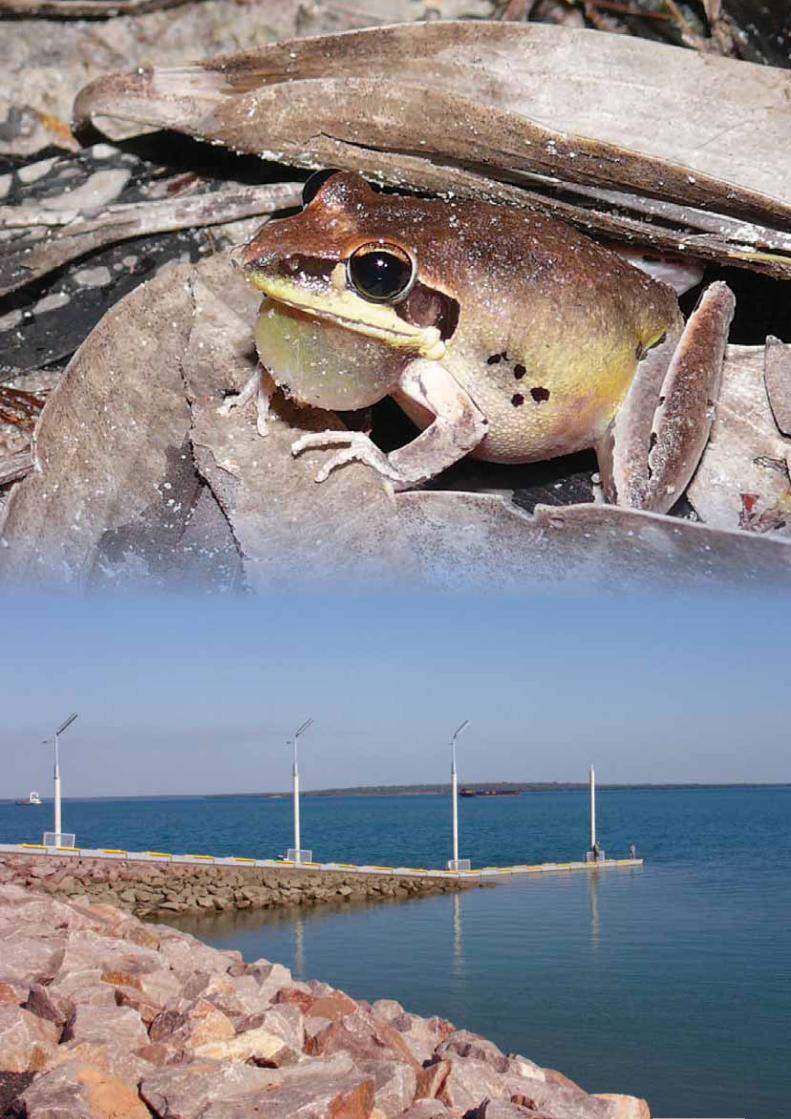
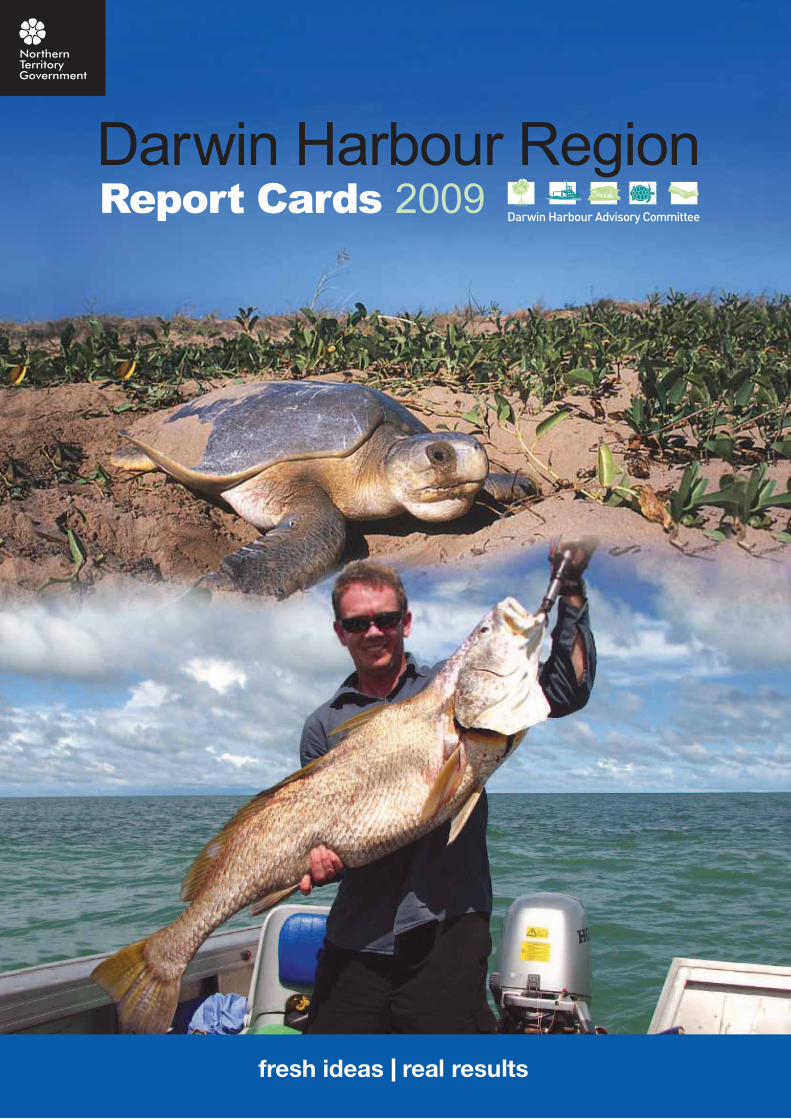
Cover photos ������!�"�����#Protonibea diacanthus)������������� ���$��%��������������� ����&'(����specimen was caught in Shoal Bay. Photo by Mike Welch.)������!������#Natator depressus) in the Darwin Harbour region. Photo by Scott Whiting. ���%��)���#Litoria tornieri) is infrequently encountered throughout the Darwin Harbour region. Photo by Peter Dostine. A new boat ramp at East Arm. Photo by Tony Boland.
AcknowledgementsThis project was made possible through funding support from the Australian Government. The project was supported by the Darwin Harbour Advisory Committee. We acknowledge funding for many projects from which data were collated and used in this publication. Many comments improved previous draft versions of the document.Many previous staff contributed to the data including Mike Welch, Lizzy Skinner, Simon Townsend, Armando Padovan, Rodney Metcalfe, Ian Dixon, Yusuke Fukuda, and Daryl Browne. We thank the hydrographic staff, David Williams and others who have contributed to projects. We thank Leonie Richards for expert help with graphic design.+������������������������������������;�����������<���!�#�����������=symbols/), University of Maryland Centre for Environmental Science, USA. Several conceptual diagrams were adapted from base diagrams from the Integration and Application Network.
Darwin HarbourAdvisory Committee
ii

Message from the Chair of the Darwin Harbour Advisory Committee;�����>����������������������;�?�����>�������#��;>@���������������������������������������������������������������
I believe that better understanding our beautiful Harbour is the responsibility of all of �����������������������!�����������������������������������������Harbour’s health is a important step towards managing this culturally, economically and environmentally vital area for our sustainable use and appreciation, today and in the future. These report cards help make that vision possible.
The Darwin Harbour region report cards are the result of hard work by DHAC’s partners at the Aquatic Health Unit of the Department of Natural Resources, Environment, The Arts and Sport, and I applaud their commitment to share the results of their research and monitoring efforts with the public. DHAC has supported this work, and we see the report cards as advancing the broader goals of the Darwin Harbour Strategy 2009–2015, a strategy that provides guidance for the integrated management of the Harbour.
While the report cards highlight the excellent condition of many parts of the Harbour, there remains much work to be done. Declining water quality in the region has the potential to affect aquatic ecosystems, biodiversity, tourism, aquaculture, Indigenous harvest and ������������������������������K����O�������?�������������������������Q�����improving – the health of our waterways, and the release of these report cards is truly a milestone in our united effort to be good stewards of Darwin Harbour.
Bill StuchberyChairDarwin Harbour Advisory Committee
Minister’s MessageTerritorians and visitors to the Top End place a high value on Darwin Harbour. It is a wonderful natural asset - a special place which encapsulates the tropical character for which �������������������������������������������������������������������������������������������������������������������������������������������?������� ����������������the hub of commercial activity in the region and a major port vital to our regional economic growth. Government and the community play an important role in striking the balance between these competing uses and maintaining the region’s environmental integrity.
Protecting water quality and aquatic health will allow us to continue to enjoy the ecosystem services that Darwin Harbour and its environment provide. Monitoring aquatic health in the face of growing pressures is essential. The report card allows all of us to track water quality and aquatic health for management actions necessary to protect our waterways and their important values.
The Northern Territory Government, through the Department of Natural Resources, Environment, The Arts and Sport and the Darwin Harbour Advisory Committee is committed to supporting actions to maintain and monitor water quality in and around Darwin Harbour.
The Australian Government’s investment in water quality and research effort through the Water Quality Protection Plan in the region will ensure the continued viability of waterways for future generations and lay the foundations for maintaining our waterways as important natural and cultural assets.
Karl HamptonMinister for the Natural Resources, Environment and Heritage.
iii

View across Darwin CBD and city, the Charles Darwin National Park, and the East Arm Port in the background. Photo supplied by Tourism NT
iv

v
Contents
Darwin Harbour region ......................................................................................1 Summary .................................................................................................................... 2
The report cards ......................................................................................................... 2
Our harbour, our life, our future .................................................................................. 3
Culture – land and sea country .................................................................................. 4
The Aquatic Health Unit ............................................................................................. 4
Understanding water quality and pollution sources ......................................5 Introduction ................................................................................................................ 6
Estuarine monitoring sites, pollution sources, and ecology of Darwin Harbour region .....7
Estuary processes in the wet and dry seasons.......................................................... 8
� ������������������������������� ...................................................................... 10
Key indicators for estuarine and freshwater quality ..........................................................10
Interpreting the report cards ..........................................................................11 Introduction .............................................................................................................. 12
Interpreting the report cards ..................................................................................... 13
Darwin Harbour report card 2009...................................................................17Darwin - Palmerston report card 2009 ...........................................................21Elizabeth River and estuary report card 2009...............................................25Blackmore River and estuary report card 2009 ............................................29Shoal Bay and Buffalo Creek report card 2009 ............................................33Rapid Creek report card 2009.........................................................................37Lagoons report card 2009...............................................................................43
Other Aquatic Health Unit Projects ................................................................45 A water quality protection plan ................................................................................. 46
Darwin frog monitoring trial ...................................................................................... 48
Water-bugs .............................................................................................................. 50
Sediment and nutrient loads in Darwin Harbour catchment streams ....................... 51
A framework for river and wetland health – FARWH index ...................................... 53
Further reading ........................................................................................................ 54
Glossary ...........................................................................................................55

Darwin Harbour Region
������\]�������������!���������#Sousa chinensis) is known as a coastal or near-shore dolphin and is typically found in small populations inhabiting shallow, coastal and estuarine waters, usually within about 10 km of land, in water less than 15 m deep and within about 20 !���������������?������������\]�������������!����������������������������������������?��������������������������������������������������?�������^���into the harbour. The harbour and associated estuaries are important areas for foraging, calving and raising young. The dolphin is vulnerable to habitat degradation, boat strikes, �������������������������������������$������������������������_��������������������the Queensland coast indicate that populations are notably small making them particularly vulnerable to human-induced disturbances on coastal ecosystems. The Northern Territory Government’s Coastal Dolphin Research Project is currently undertaking baseline research on this species in Darwin Harbour along with the two other species of coastal dolphins: the ������;����������������#Orcaella heinsohni@������������\]���������������#Tursiops aduncus@�� ��������������������\]�������������!���������������!��������������`�?�area of the Darwin harbour region. Photo by Carol Palmer
vi
Darwin Harbour Region
Darwin Harbour
Region
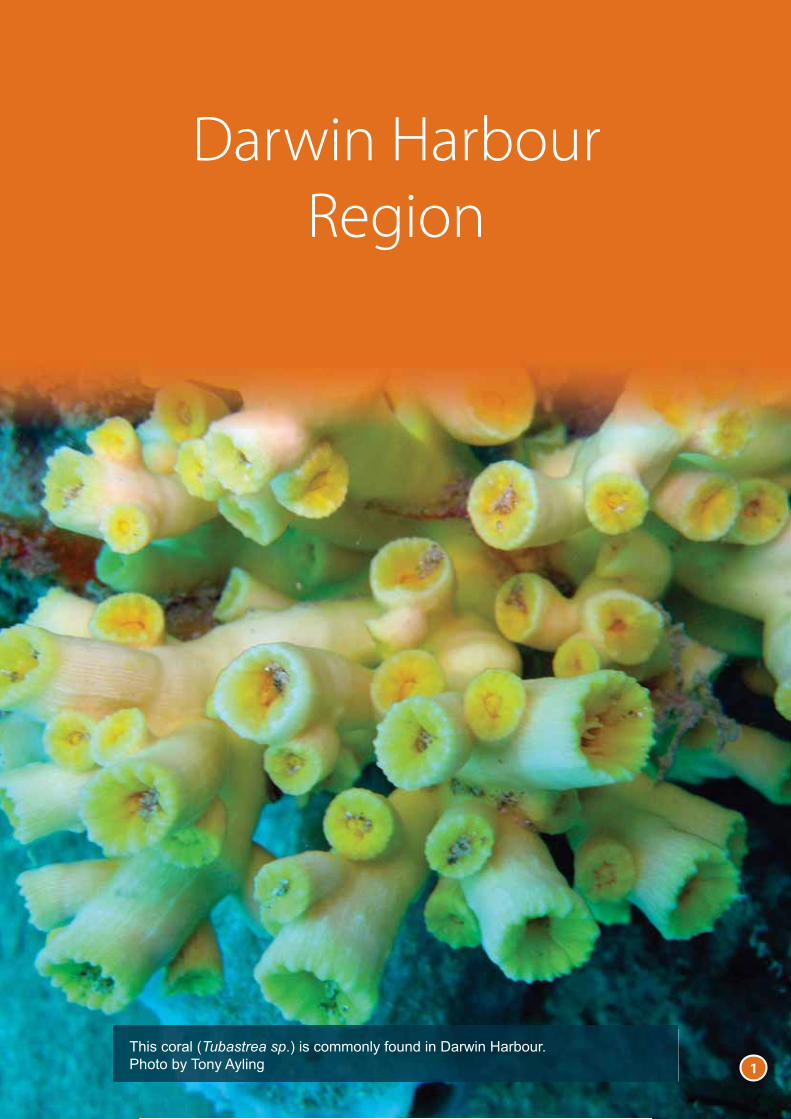
���������#Tubastrea sp.) is commonly found in Darwin Harbour. Photo by Tony Ayling 1
Darwin Harbour Region
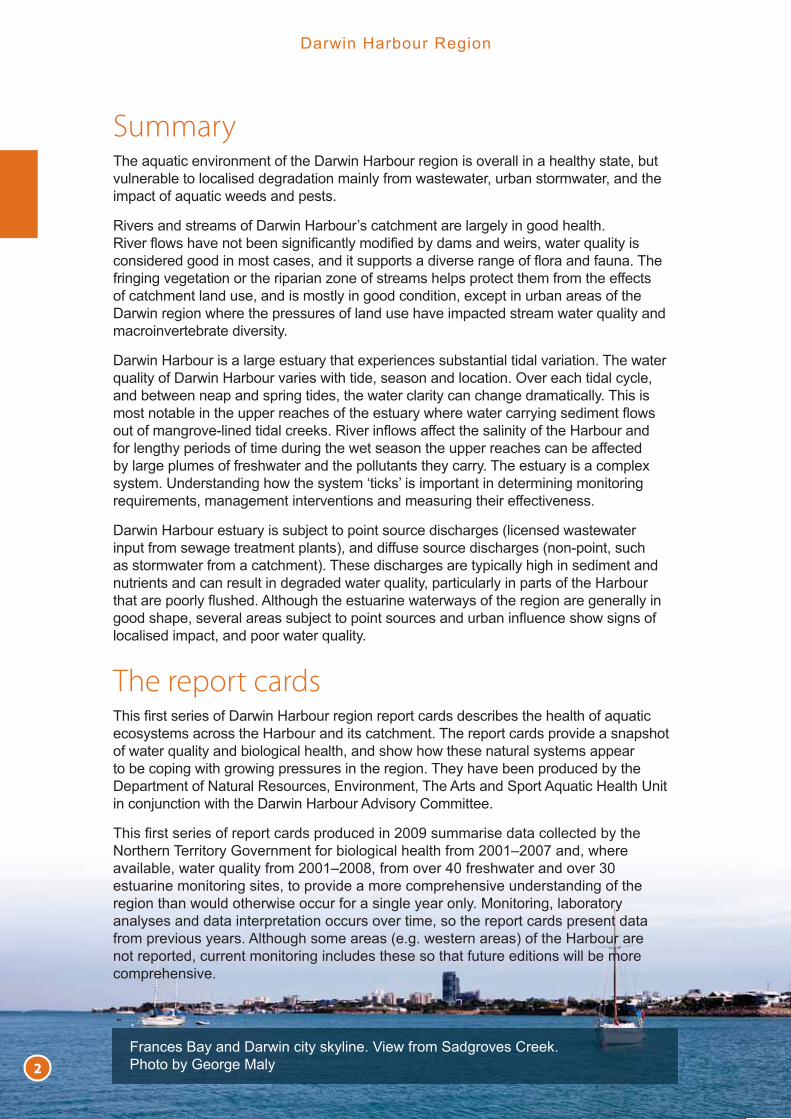
SummaryThe aquatic environment of the Darwin Harbour region is overall in a healthy state, but vulnerable to localised degradation mainly from wastewater, urban stormwater, and the impact of aquatic weeds and pests.
Rivers and streams of Darwin Harbour’s catchment are largely in good health. `�?�^������?�������������������������������������������������{��������������������������������������������������������?���������^�������������� ��fringing vegetation or the riparian zone of streams helps protect them from the effects of catchment land use, and is mostly in good condition, except in urban areas of the Darwin region where the pressures of land use have impacted stream water quality and macroinvertebrate diversity.
Darwin Harbour is a large estuary that experiences substantial tidal variation. The water quality of Darwin Harbour varies with tide, season and location. Over each tidal cycle, and between neap and spring tides, the water clarity can change dramatically. This is ������������������������������������������������������������^����������������?\������������!���`�?���^��������������������������������������for lengthy periods of time during the wet season the upper reaches can be affected by large plumes of freshwater and the pollutants they carry. The estuary is a complex system. Understanding how the system ‘ticks’ is important in determining monitoring requirements, management interventions and measuring their effectiveness.
������������������������K��������������������������#�������������������������������������������@���������������������������#���\������������as stormwater from a catchment). These discharges are typically high in sediment and nutrients and can result in degraded water quality, particularly in parts of the Harbour �������������^������;�������������������������������������������������������������?����������K�����������������������������^������������������localised impact, and poor water quality.
The report cards �������������������������������������������������������������{������ecosystems across the Harbour and its catchment. The report cards provide a snapshot of water quality and biological health, and show how these natural systems appear to be coping with growing pressures in the region. They have been produced by the Department of Natural Resources, Environment, The Arts and Sport Aquatic Health Unit in conjunction with the Darwin Harbour Advisory Committee.
����������������������������������'((|����������������������������Northern Territory Government for biological health from 2001–2007 and, where available, water quality from 2001–2008, from over 40 freshwater and over 30 estuarine monitoring sites, to provide a more comprehensive understanding of the region than would otherwise occur for a single year only. Monitoring, laboratory analyses and data interpretation occurs over time, so the report cards present data �����?����������;����������������#������������@���������������not reported, current monitoring includes these so that future editions will be more comprehensive.
Frances Bay and Darwin city skyline. View from Sadgroves Creek. Photo by George Maly2

Darwin Harbour Region
Our harbour, our life, our futureLife in Darwin and the Top End means being able to live among a variety of unspoilt environments and wildlife. How many other cities can boast of having turtles, dugong, barramundi, sea eagles, magpie geese and agile wallabies in the Harbour and the suburbs?
Compared to other Australian ports and tropical ports around the world, the Darwin ������������������������������������� ��������������������������������������and industrial growth in the near future. This growth will intensify pressure on the Harbour environment and the wildlife it supports.
Our intact natural systems underpin our lifestyle. Many Darwin region residents have an appreciation of the great wealth of natural resources that this region provides. Sustainability demands that our use of the natural resources we so value and derive ��������������������������������������� ���������������������?�����Darwin lifestyle we all enjoy, it will be necessary to match economic growth with sound environmental management.
Water resources in the region support a diverse range of aquatic ecosystems and ��������������������������������������������������������?��������������?���������{����������������>�������#Cabomba caroliniana) in Darwin River, reminds us of the vulnerability of the environment to exotic species. Water ���������������������������������������������^������������������������^������������������������������ ����?���������������������������������and sea managers need to understand them as completely as possible.
The Darwin Harbour region stretches from Gunn Point in the north, to south of the Darwin River Dam. The region has a population of over 120,000 people within the �������������������]����������������~������������>���]�����������������Catchments draining to the Harbour include the Elizabeth River, Blackmore River, Shoal Bay catchments and several smaller urban and rural catchments. The area covers over 3,200 km2 – 65% of which is terrestrial and 35% coastal and marine. Much of the region is undeveloped, with about 20% of the catchment being urban or rural land use.
3

Darwin Harbour Region
Culture – land and sea countryDarwin Harbour has been home to the Larrakia people for thousands of years. For the Larrakia, the region’s environments are ‘cultural landscapes’ that are vital to their well-������~��!����������%�������������������������������� ��������^�������������?������������������������^���������������������������������������������?�������������������������������������������������������?��������������������by Larrakia people. Larrakia people have oral traditions and written documentation of their unbroken relationship to their land, sacred sites, stories and resources. A rich oral history links land, sea and culture from generation to generation.
����������?���������������%�������?������������������������������^����in particular mangroves and aquatic plants, and threatened or rare fauna present immense biological and cultural value to the region. Exploring opportunities to maintain �����������������������������������������������������!��������������������approaches to conservation is important.
The Aquatic Health UnitThe Northern Territory Government’s Department of Natural Resources, Environment, ��;�������+����#<`$ ;+@��������;{������������������ ��<����� �����Government has an established record in monitoring and collaborative research in fresh, marine and estuarine water quality including biological health projects in the Darwin Harbour region and selected catchments in the Top End of the Northern Territory.
The NRETAS Aquatic Health Unit has expertise in aquatic ecology, limnology, estuarine science, catchment water quality modelling and water quality evaluation. Research and projects undertaken by the Northern Territory Government and its collaborators include:
�� �?������������O�����������]��������]�������������������� ������?���������������������������������������������������� ����������������������?��\������������������������������ �������������������������������������� ������������������������������{������������������#�������@
)������!�������#Natator depressus) are endemic to Australia and are listed as vulnerable. They are common nesters in the NT and are the species that nests at Casuarina Beach during the dry season. Juvenile and adults would feed inside the harbour. Unfortunately, like most species of sea turtles, we know very little about their use of habitats when not at the nesting beach. All turtle species are culturally important to Indigenous people along the coast. Photo by Scott Whiting4

Pollution sources and water quality
Understanding water
quality and pollution
sources
Mangroves in Bleesers Creek. Conservation of mangroves helps prevent erosion of land surrounding the harbour. Photo by George Maly
5

Pollution sources and water quality
IntroductionThis section presents some principles of water quality and pollution sources. Key water quality indicators and why they are used are explained.
Pollutant sources
��������������������������������������������������������������������nutrients and, to a lesser degree, heavy metals and other chemical compounds.
Pollutants from land originate from both ‘point’ and ‘diffuse’ sources. Point sources include discharges from sewage treatment plants, aquaculture and other licensed operations. Point source discharges can occur throughout the year, including the dry season, and can have a substantial effect on water quality despite their often relatively small volume. Sewage treatment plants, for instance, are an important source of ����������������������#����K���������@�
Diffuse, or non-point, sources such as urban and rural stormwater, leaching through soil, river bank erosion, and roads mainly enter our waterways during the wet season. The NRETAS Aquatic Health Unit monitors pollutant loads from these diffuse sources during the wet season at several stream gauges, and these are reported in the report cards.
Some of the sources and effects on water quality in the Darwin Harbour region are shown in the diagrams on the following pages.
Estuary processes in the wet and dry seasons
�������������������������������^�����������{����������������������������������^���� �������������{������������������������������������������^��������ecological processes in the upper, mid and outer parts of estuary. Details are explained in the cross-section diagram on the following pages.
Key indicators for estuarine and freshwater quality
The key indicators used in the report cards are explained later in this section. The diagrams on the following pages show water quality indicators and some impacts such as turbidity, oxygen and phytoplankton growth.
Other pollutants
For some pollution indicators little data is currently available for Darwin Harbour. $�������������������\���������������#��������������������������������and chemicals) contained in stormwater, sewage and other licensed discharges, ����������������������������������������������������������������������������
Remember that what we put down the household drain or apply to our backyards and properties could in some form end up in Darwin Harbour and our food chain!
6

Pollution sources and water quality
Estuarine monitoring sites, pollution sources, and ecology of Darwin Harbour regionThe diagram shows the Darwin Harbour catchment, pollutant sources and transport ����������+����������������������������������#�������������@��������natural bushland, agriculture, and urban areas. Sewage treatment plants are a major source of nutrients and toxicants. The upper parts of the harbour estuary have �����������������������������������������������^��������������^����<�����Territory Government monitoring sites are also shown.
Mangroves are an important feature – they are the “lungs” of the harbour. There are 36 species of mangroves in this region. Mangrove sediments generate an important food supply for diverse organisms from microscopic bacteria to leaf-eating crabs. Mangroves also provide an effective natural barrier against waves, storms, and cyclones for coastal stabilisation.
Monitoring sites
Estuarine
Pollution sources
Aquaculture
Sewage treatment plant wastewater
Sediment/nutrient inputs
Nutrient inputs
Toxicant inputs
Grazing
Horticulture
Industry
Process/transport
Deposition Resuspension
)��������^���=������
]�����^����
O���^����
LegendEcological impacts
Diatoms
Phytoplankton
Seagrass
Other
Sandbar
Mangrove
Urban/residential
7
Pollution sources and water quality
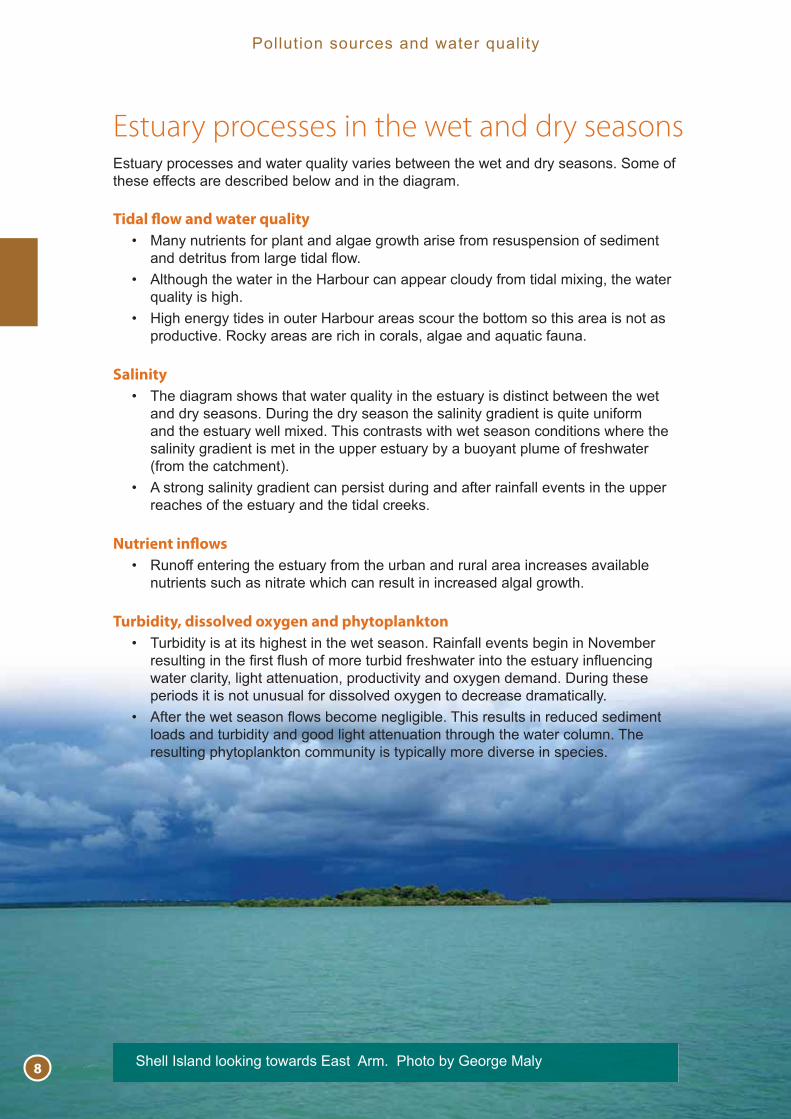
Shell Island looking towards East Arm. Photo by George Maly
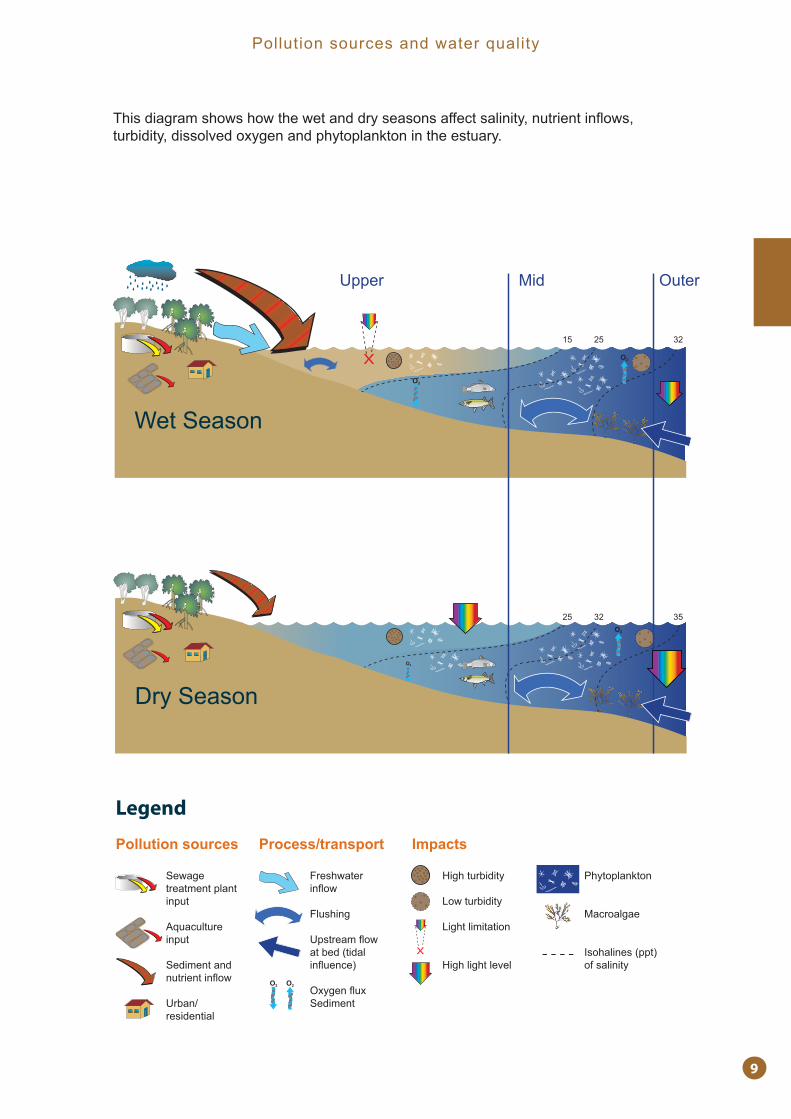
Estuary processes in the wet and dry seasonsEstuary processes and water quality varies between the wet and dry seasons. Some of these effects are described below and in the diagram.
Tidal flow and water quality
�� ������������������������������������������������������������������������������������������^���
�� ;��������������������������������������������������������������������quality is high.
�� �������������������������������������������������������������������productive. Rocky areas are rich in corals, algae and aquatic fauna.
Salinity
�� ������������������������{������������������������������������������and dry seasons. During the dry season the salinity gradient is quite uniform and the estuary well mixed. This contrasts with wet season conditions where the salinity gradient is met in the upper estuary by a buoyant plume of freshwater #���������������@�
�� ;�������������������������������������������������������?��������������reaches of the estuary and the tidal creeks.
Nutrient inflows
�� `����������������������������������������������������?�������nutrients such as nitrate which can result in increased algal growth.
Turbidity, dissolved oxygen and phytoplankton
�� �����������������������������������������`��������?������������<�?���������������������^���������������������������������������^�������water clarity, light attenuation, productivity and oxygen demand. During these periods it is not unusual for dissolved oxygen to decrease dramatically.
�� ;���������������^������������������� �������������������������loads and turbidity and good light attenuation through the water column. The resulting phytoplankton community is typically more diverse in species.
8
Pollution sources and water quality
Sewage treatment plant input
Aquaculture input
Sediment and ���������^��
Urban/residential
25
15
32
25
35
32
MidUpper Outer
Wet Season
Dry Season
Freshwater ��^��
Flushing
�������^���������#��������^���@
������^��Sediment
High turbidity
Low turbidity
Light limitation
High light level
Phytoplankton
Macroalgae
����������#���@�of salinity
������������������������������������������������������������������^�����turbidity, dissolved oxygen and phytoplankton in the estuary.
Legend
Pollution sources Process/transport Impacts
9
Pollution sources and water quality
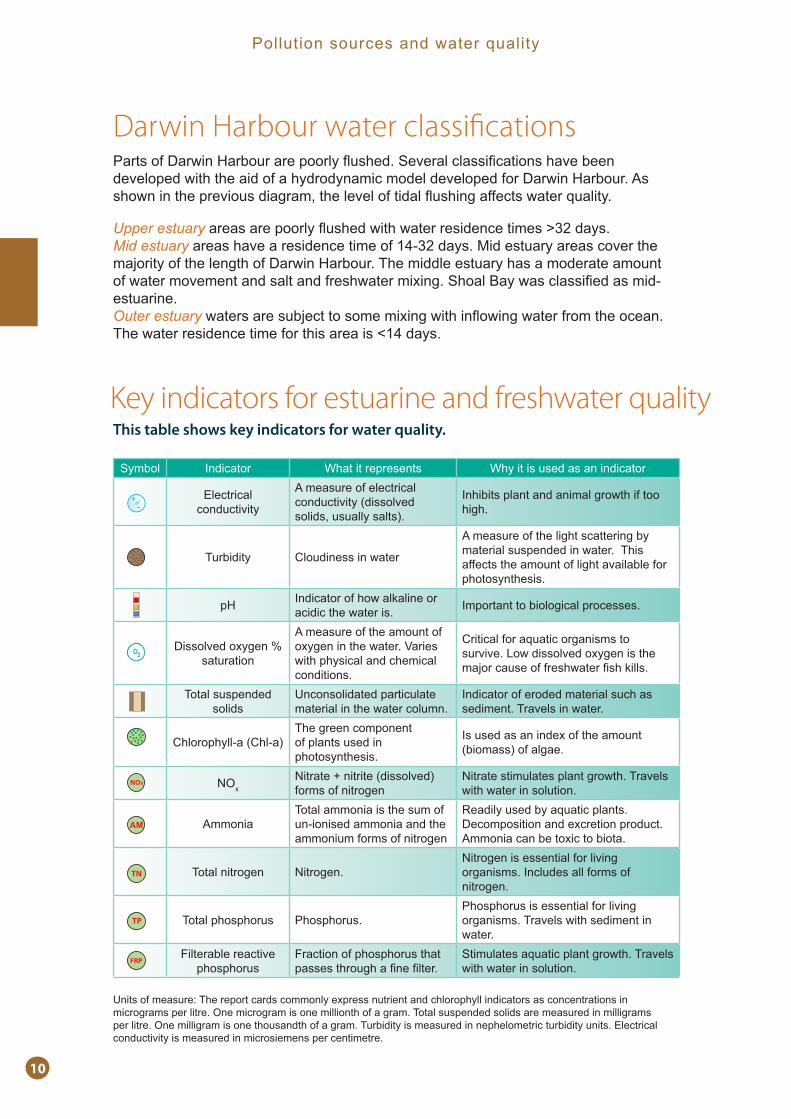
Darwin Harbour water classifications]���������������������������^������+?��������������������?����developed with the aid of a hydrodynamic model developed for Darwin Harbour. As �������������?�����������������?�����������^������������������{�������
Upper estuary ������������^���������������������������'�������Mid estuary areas have a residence time of 14-32 days. Mid estuary areas cover the majority of the length of Darwin Harbour. The middle estuary has a moderate amount ���������?��������������������������������+����������������������������\estuarine.Outer estuary ����������K������������������������^�����������������������The water residence time for this area is <14 days.
This table shows key indicators for water quality.
Symbol Indicator What it represents Why it is used as an indicator
Electrical conductivity
A measure of electrical ��������?����#������?��solids, usually salts).
Inhibits plant and animal growth if too high.
Turbidity Cloudiness in water
A measure of the light scattering by material suspended in water. This affects the amount of light available for photosynthesis.
pH Indicator of how alkaline or acidic the water is. Important to biological processes.
Dissolved oxygen % saturation
A measure of the amount of oxygen in the water. Varies with physical and chemical conditions.
Critical for aquatic organisms to survive. Low dissolved oxygen is the ��K���������������������!�����
Total suspended solids
Unconsolidated particulate material in the water column.
Indicator of eroded material such as sediment. Travels in water.
>���������\��#>��\�@The green component of plants used in photosynthesis.
Is used as an index of the amount #�������@���������
NOx<�������������#������?�@�forms of nitrogen
Nitrate stimulates plant growth. Travels with water in solution.
AmmoniaTotal ammonia is the sum of un-ionised ammonia and the ammonium forms of nitrogen
Readily used by aquatic plants. Decomposition and excretion product. Ammonia can be toxic to biota.
Total nitrogen Nitrogen.Nitrogen is essential for living organisms. Includes all forms of nitrogen.
Total phosphorus Phosphorus.Phosphorus is essential for living organisms. Travels with sediment in water.
Filterable reactive phosphorus
Fraction of phosphorus that ����������������������
Stimulates aquatic plant growth. Travels with water in solution.
Units of measure: The report cards commonly express nutrient and chlorophyll indicators as concentrations in micrograms per litre. One microgram is one millionth of a gram. Total suspended solids are measured in milligrams per litre. One milligram is one thousandth of a gram. Turbidity is measured in nephelometric turbidity units. Electrical conductivity is measured in microsiemens per centimetre.
Key indicators for estuarine and freshwater quality
10

Interpretation
Interpreting the
report cards
��������#Dugong dugon) are sometimes seen in the Channel Island, Elizabeth River estuary and other parts of Darwin Harbour. Better knowledge of habitat use by dugongs and other species in the harbour is a priority area for future research to help protect them from habitat loss, boat strikes and pollution. Darwin is the only known location where dugongs feed off algae and plants that grow on shallow rock reefs rather than seagrass only. Casuarina Coastal Reserve is the only known seagrass habitat in Darwin Harbour, and is a key habitat for dugongs. Seagrasses are highly vulnerable to human impacts such as pollution, and climate change. Dugongs are culturally important to Indigenous people along the coast. Photo by Scott Whiting
11
Interpretation
IntroductionThis section contains information to help interpret the report cards.
Water quality
����������������{�������#���������������@������������������#�������������^�������������@��������������?��\������������������������������methods are presented.
Information on the assessment of water quality using water quality objectives, and the assessment of the current condition of waterways is provided. These techniques are widely used in other regions of Australia. State and regional-scale water quality guidelines, such as water quality objectives, are considered more appropriate than national guidelines. The methods used have been established under a process developed by the National Water Quality Management Strategy. Further details are available in ANZECC guidelines and related publications.
Biological indictors
The interpretation of biological indicators using an assessment system common in Australia is described in this section. The Northern Territory Government has monitored biological health from 2001–2007, so these results in the report cards provide a robust assessment, rather than for one year only.
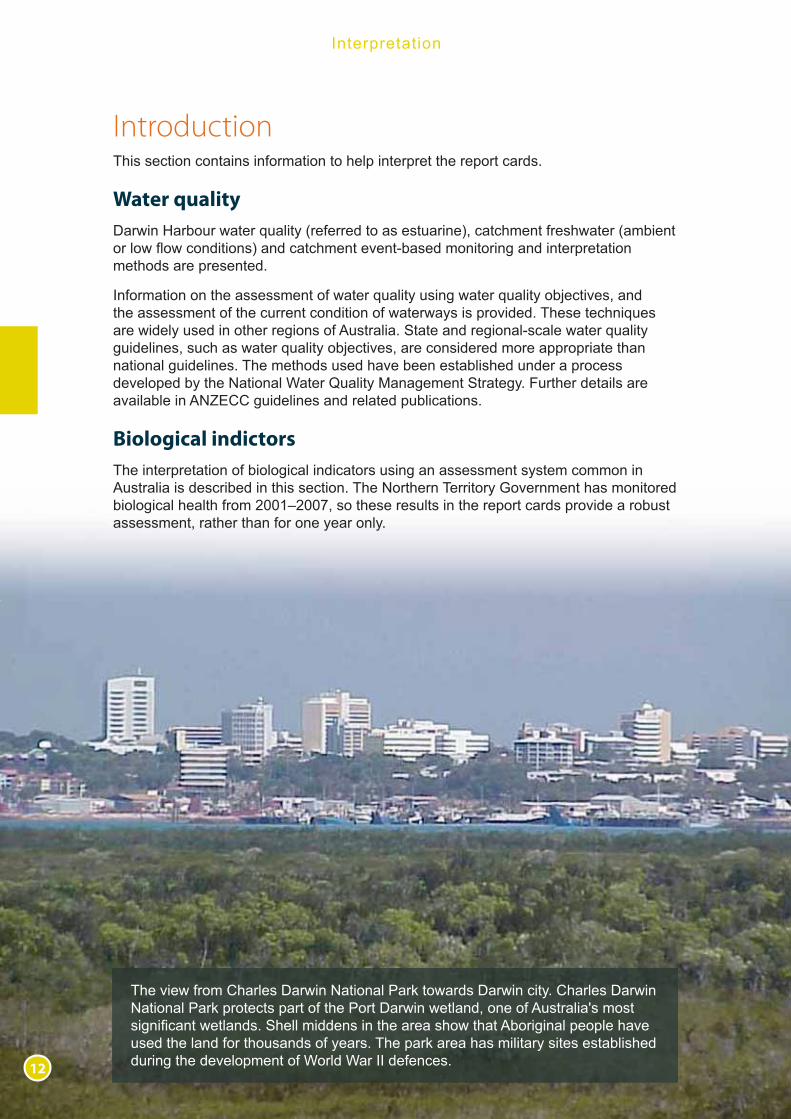
The view from Charles Darwin National Park towards Darwin city. Charles Darwin National Park protects part of the Port Darwin wetland, one of Australia's most ��������������������+������������������������������;����������������?�used the land for thousands of years. The park area has military sites established during the development of World War II defences.
12
Interpretation
Interpreting the report cards
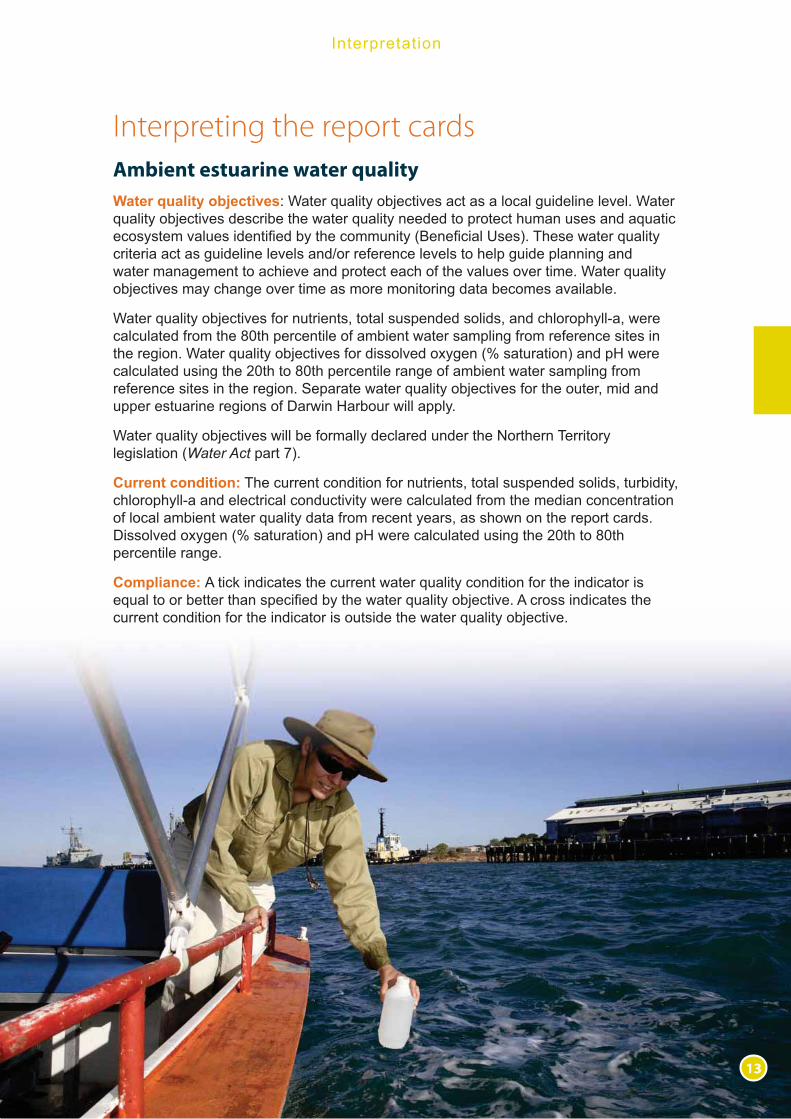
Ambient estuarine water quality
Water quality objectives: Water quality objectives act as a local guideline level. Water quality objectives describe the water quality needed to protect human uses and aquatic ��������?�����������������������������#�����������@�� �������{�������criteria act as guideline levels and/or reference levels to help guide planning and water management to achieve and protect each of the values over time. Water quality objectives may change over time as more monitoring data becomes available.
Water quality objectives for nutrients, total suspended solids, and chlorophyll-a, were calculated from the 80th percentile of ambient water sampling from reference sites in ���������O���{���������K���?�����������?��������#�����������@����������calculated using the 20th to 80th percentile range of ambient water sampling from reference sites in the region. Separate water quality objectives for the outer, mid and upper estuarine regions of Darwin Harbour will apply.
Water quality objectives will be formally declared under the Northern Territory �����������#Water Act part 7).
Current condition: The current condition for nutrients, total suspended solids, turbidity, chlorophyll-a and electrical conductivity were calculated from the median concentration of local ambient water quality data from recent years, as shown on the report cards. ������?��������#�����������@�����������������������������'(�������(���percentile range.
Compliance: A tick indicates the current water quality condition for the indicator is {�����������������������������������{���������K���?��;������������������current condition for the indicator is outside the water quality objective.
13

Interpretation
Ambient freshwater quality
Water quality objectives: The water quality objectives for nutrients, total suspended solids, turbidity, chlorophyll-a, and electrical conductivity were calculated from the 80th �����������������#����^��@��������������������������������������������O���{���������K���?�����������?��������#�����������@��������������������using the 20th to 80th percentile range of ambient water sampling data from reference sites in the region.
Current condition: The current condition for nutrients, total suspended solids, turbidity, chlorophyll-a and electrical conductivity were calculated from the median concentration ��������������������{�����������������������?��������#�����������@����������calculated using the 20th to 80th percentile range. The period of sampling is indicated ���������������� ������������������������������#����^��@�������������;{������Health Unit monitoring sites are shown on the maps.
Compliance: A tick indicates the current condition for the indicator is equal to or better ����������������������{���������K���?��;������������������������������������the indicator is worse than the water quality objective.
Event-based freshwater quality loads and event-mean concentrations
Current condition: The current water quality condition, as event mean concentration #$�>@������������������?��\���������������������������������������������gauge station during storms in the 2006–07 wet season, where available. EMC is useful to help compare concentrations between catchments. Water quality samples ������������������^��\������������������������������{���<����� �����Government monitoring sites are shown on the maps.������������������^��\������������������������������{���<����� ����GoGovevernrnmementnt m mononititororiningg ssites are showownn onon tthehe m mapaps.s
+�����������������?������#���\����@���������������������������������streams in the Darwin Harbour region. Photo by Matt Majid
14
Interpretation
Whole catchment load for an average wet season: In addition, an estimate of the total load in an average wet season for the larger surrounding catchment area was made from �����������������������������������������������������������+!����������#'((|@�
Biological indicators
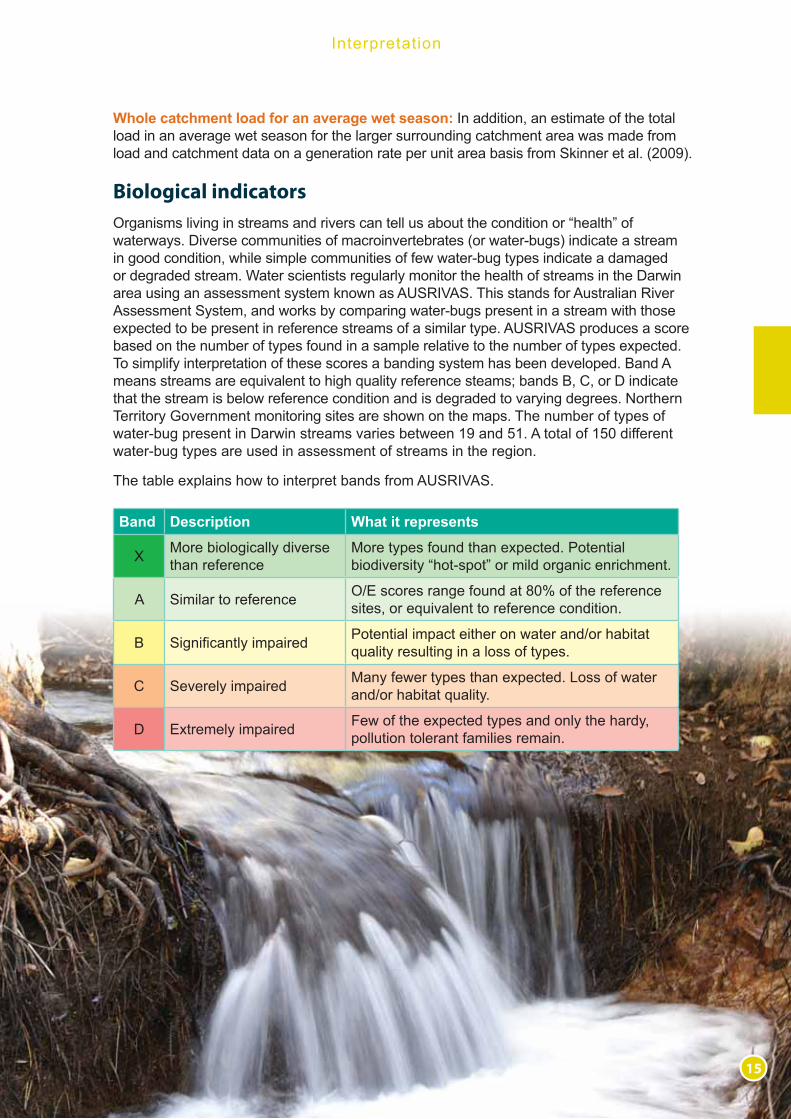
Organisms living in streams and rivers can tell us about the condition or “health” of �����������?����������������������?������#�����\����@����������������in good condition, while simple communities of few water-bug types indicate a damaged or degraded stream. Water scientists regularly monitor the health of streams in the Darwin area using an assessment system known as AUSRIVAS. This stands for Australian River Assessment System, and works by comparing water-bugs present in a stream with those expected to be present in reference streams of a similar type. AUSRIVAS produces a score based on the number of types found in a sample relative to the number of types expected. To simplify interpretation of these scores a banding system has been developed. Band A means streams are equivalent to high quality reference steams; bands B, C, or D indicate that the stream is below reference condition and is degraded to varying degrees. Northern Territory Government monitoring sites are shown on the maps. The number of types of water-bug present in Darwin streams varies between 19 and 51. A total of 150 different water-bug types are used in assessment of streams in the region.
The table explains how to interpret bands from AUSRIVAS.
Band Description What it represents
X More biologically diverse than reference
More types found than expected. Potential biodiversity “hot-spot” or mild organic enrichment.
A Similar to reference O/E scores range found at 80% of the reference sites, or equivalent to reference condition.
B +������������������ Potential impact either on water and/or habitat quality resulting in a loss of types.
C Severely impaired Many fewer types than expected. Loss of water and/or habitat quality.
D Extremely impaired Few of the expected types and only the hardy, pollution tolerant families remain.
15

Interpretation
Water quality rating
A ‘water quality rating’ was developed as an instantly recognisable assessment. Rating A is ‘excellent water quality’, through to E being ‘very poor water quality’.
������{������������������������������������������������������?�����#��previous page) listed for ambient freshwater or marine water. Where available, the rating uses the compliance of 9 indicators for marine water, and 10 indicators for ambient freshwater. Further details are presented below. This rating method may change when other catchment and water quality assessment schemes are further developed.
Water quality rating
What the rating means Compliance and method
Excellent water quality 100% of indicators comply with water quality objectives
Very good water quality85% to <100% of indicators comply with water quality objectives
Good or moderate water quality
50% to <85% of indicators comply with water quality objectives
Poor water quality30% to <50% of indicators comply with water quality objectives
Very poor water quality <30% of indicators comply with water quality objectives
ABCDE
���\���!����\��#Pseudomugil cyanodorsalis) is found in Howard River. Photo by Dave Wilson16

Darwin Harbour
Darwin Harbour
report card 2009
Water quality at the outer and mid Harbour
monitoring sites is in excellent condition and
complies with water quality objectives.
Nature of system
Sources of pollution
The view across Darwin CBD and city with part of the Charles Darwin National Park in the background. 2009 marks 200 years since the birth of Charles Darwin, who the city of Darwin is named after. Photo Tourism NT 17
Darwin Harbour
Darwin
Palmerston
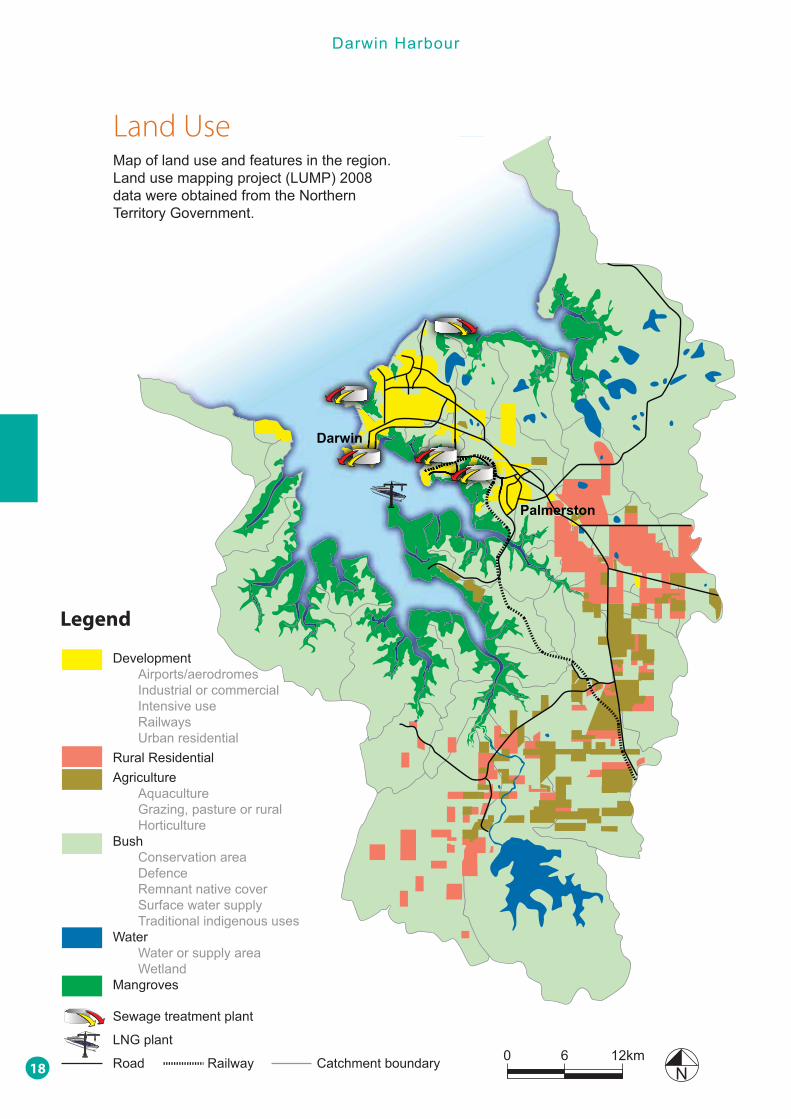
Land Use
Legend
12km60
Development Airports/aerodromes Industrial or commercial Intensive use Railways Urban residentialRural ResidentialAgriculture Aquaculture Grazing, pasture or rural HorticultureBush Conservation area Defence Remnant native cover Surface water supply Traditional indigenous usesWater Water or supply area WetlandMangroves
Sewage treatment plant
LNG plant
Road Railway Catchment boundary
Map of land use and features in the region.~�����������������K���#~��]@�'((��data were obtained from the Northern Territory Government.
18
Darwin Harbour
Symbol Indicator and units Water quality objective
Current condition
Sample number for current condition
Compliance
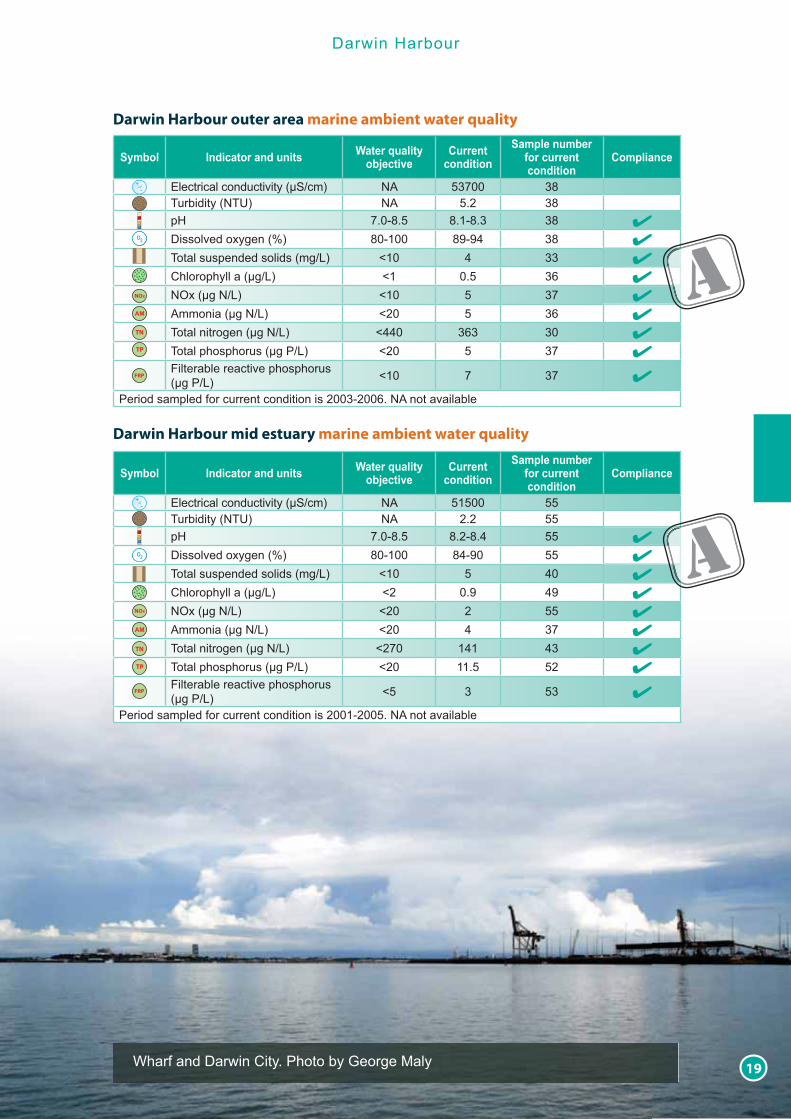
$����������������?����#�+=��@ NA 53700 38 ��������#< �@ NA 5.2 38pH 7.0-8.5 8.1-8.3 38 �������?��������#�@ 80-100 89-94 38 � ��������������������#��=~@ <10 4 33 �>������������#��=~@ <1 0.5 36 �<���#���<=~@ <10 5 37 �;�������#���<=~@ <20 5 36 � ������������#���<=~@ <440 363 30 � ���������������#���]=~@ <20 5 37 �Filterable reactive phosphorus #���]=~@ <10 7 37 �
Period sampled for current condition is 2003-2006. NA not available
Darwin Harbour outer area marine ambient water quality
Symbol Indicator and units Water quality objective
Current condition
Sample number for current condition
Compliance
$����������������?����#�+=��@ NA 51500 55 ��������#< �@ NA 2.2 55pH 7.0-8.5 8.2-8.4 55 �������?��������#�@ 80-100 84-90 55 � ��������������������#��=~@ <10 5 40 �>������������#��=~@ <2 0.9 49 �<���#���<=~@ <20 2 55 �;�������#���<=~@ <20 4 37 � ������������#���<=~@ <270 141 43 � ���������������#���]=~@ <20 11.5 52 �Filterable reactive phosphorus #���]=~@ <5 3 53 �
Period sampled for current condition is 2001-2005. NA not available
Darwin Harbour mid estuary marine ambient water quality
A
A
Wharf and Darwin City. Photo by George Maly19

This photo shows predominantly soft corals found in Darwin Harbour. Hard corals are well represented in the Darwin Harbour region–over 120 species are known. This is surprising ��?������?�������������������Q������������������^������������%��������nature and coral reefs are restricted to hard substrates with strong currents.Coastal development and human activities can affect coral communities through increased sediment and pollution entering the harbour. Pollution can include oil and chemical spills, and contaminants entering waterways from stormwater. Stormwater can increase nutrient, sediment and contaminant levels which in turn can reduce biodiversity. Sewage loads can increase algal growth, which can reduce water quality and biodiversity.NRETAS’ Marine Biodiversity Group has been involved in Darwin Harbour and Northern Territory projects such as marine biodiversity surveys, habitat mapping, ecological studies and conservation planning. Photo by Tony Ayling

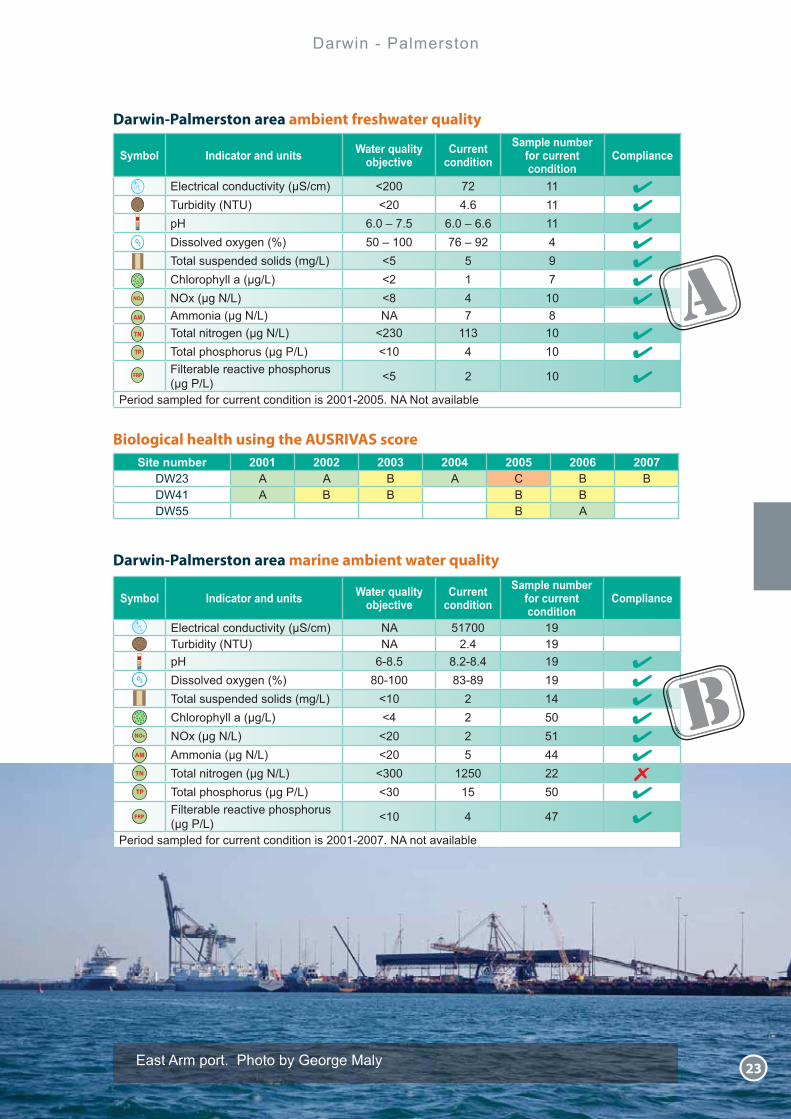
Darwin - Palmerston
Darwin - Palmerston
report card 2009
Water quality at the Darwin - Palmerston upper estuary
monitoring sites is in very good condition and, with
the exception of high total nitrogen, complies with
water quality objectives. Water quality at the ambient
freshwater monitoring sites is in excellent condition, and
complies with water quality objectives. The water-bug
community at the biological monitoring sites is assessed
as similar to reference or significantly impaired. One site
was assessed as severely impaired in 2005.
Nature of system
Sources of pollution
Mitchell Creek is the natural drainage system for the Palmerston escarpment, and residential suburbs in the east of the City of Palmerston. It is the only creek system in Palmerston with ��������������� ����������>!����������������������������������������residential development, such as the proposed suburb of Johnston. Proposed development in Johnston includes initiatives such as protection of much of the main channel. ‘Water sensitive urban design’ features that are being planned will help improve stormwater quality draining from some proposed urban areas to Mitchell Creek. The Northern Territory Government has monitored water quality and water-bugs in Mitchell Creek since 2001. Photo by Gisela Lamche
21

Darwin - Palmerston
DW41DWWW23WWDWWW55W
Darwiwinwinn
ononPPPalmerstoPalmerstoononlm rslP ntt
Darwin - Palmerston area
Estuarine monitoring sites
Freshwater and biological monitoring sites
Catchment area
Mangroves
Darwin-Palmerston area catchment showing subcatchments, features and monitoring sites.
12km60
22
Darwin - Palmerston
Darwin-Palmerston area ambient freshwater quality
Symbol Indicator and units Water quality objective
Current condition
Sample number for current condition
Compliance
$����������������?����#�+=��@ <200 72 11 � ��������#< �@ <20 4.6 11 �pH 6.0 – 7.5 6.0 – 6.6 11 �������?��������#�@ 50 – 100 76 – 92 4 � ��������������������#��=~@ <5 5 9 �>������������#��=~@ <2 1 7 �<���#���<=~@ <8 4 10 �;�������#���<=~@ NA 7 8 ������������#���<=~@ <230 113 10 � ���������������#���]=~@ <10 4 10 �Filterable reactive phosphorus #���]=~@ <5 2 10 �
Period sampled for current condition is 2001-2005. NA Not available
Biological health using the AUSRIVAS score
Site number 2001 2002 2003 2004 2005 2006 2007DW23 A A B A C B BDW41 A B B B BDW55 B A
Darwin-Palmerston area marine ambient water quality
Symbol Indicator and units Water quality objective
Current condition
Sample number for current condition
Compliance
$����������������?����#�+=��@ NA 51700 19 ��������#< �@ NA 2.4 19pH 6-8.5 8.2-8.4 19 �������?��������#�@ 80-100 83-89 19 � ��������������������#��=~@ <10 2 14 �>������������#��=~@ <4 2 50 �<���#���<=~@ <20 2 51 �;�������#���<=~@ <20 5 44 � ������������#���<=~@ <300 1250 22 � ���������������#���]=~@ <30 15 50 �Filterable reactive phosphorus #���]=~@ <10 4 47 �
Period sampled for current condition is 2001-2007. NA not available
B
A
East Arm port. Photo by George Maly23
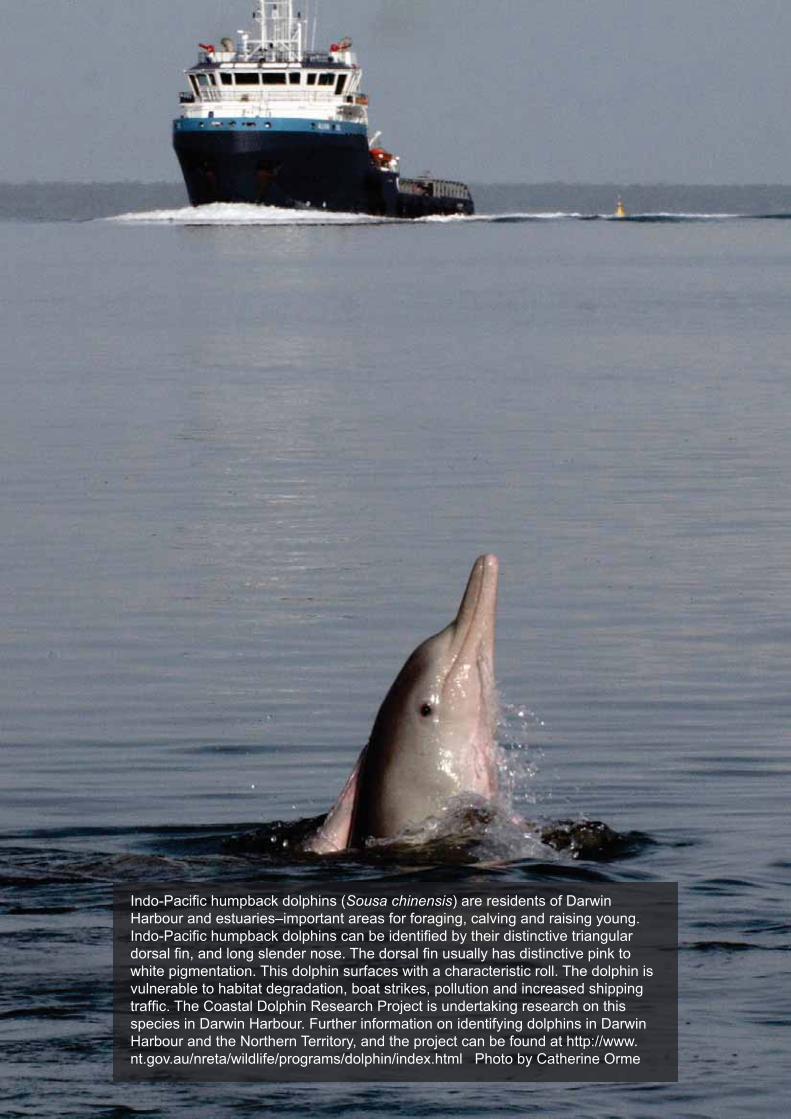
����\]�������������!����������#Sousa chinensis) are residents of Darwin Harbour and estuaries–important areas for foraging, calving and raising young. ����\]�������������!����������������������������������������?��������������������������������������� ��������������������������������?����!����white pigmentation. This dolphin surfaces with a characteristic roll. The dolphin is vulnerable to habitat degradation, boat strikes, pollution and increased shipping ������� ��>���������������`�����]�K�����������!�����������������species in Darwin Harbour. Further information on identifying dolphins in Darwin Harbour and the Northern Territory, and the project can be found at http://www.nt.gov.au/nreta/wildlife/programs/dolphin/index.html Photo by Catherine Orme
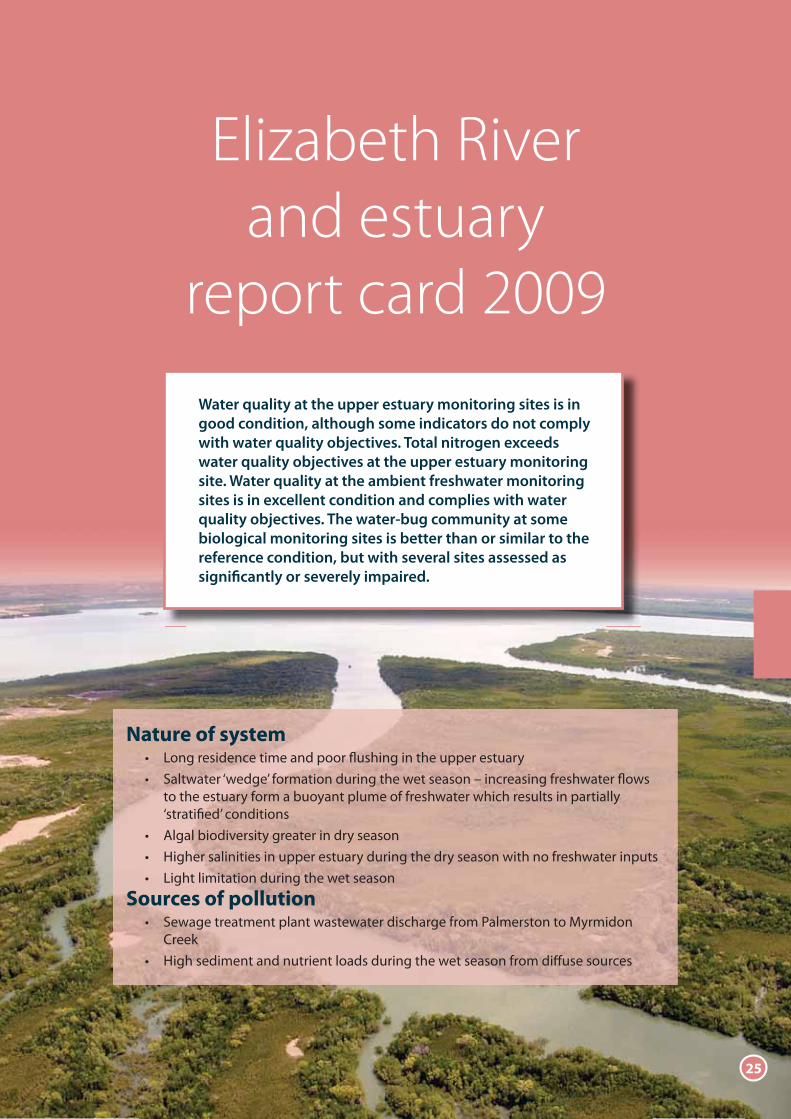
Elizabeth River and estuary
Elizabeth River
and estuary
report card 2009
Water quality at the upper estuary monitoring sites is in
good condition, although some indicators do not comply
with water quality objectives. Total nitrogen exceeds
water quality objectives at the upper estuary monitoring
site. Water quality at the ambient freshwater monitoring
sites is in excellent condition and complies with water
quality objectives. The water-bug community at some
biological monitoring sites is better than or similar to the
reference condition, but with several sites assessed as
significantly or severely impaired.
Nature of system
Sources of pollution
25

Elizabeth River and estuary
DWWW53W5
DWDDW26DW
DWDWDW40DWW40
DW39
DW44
DW52DW
BBBBeeeerrrrrrrryyyyy SSSpppprriiinnngggssBBBBBBB SSSS
Elizabeth River and estuaryElizabeth River catchment showing subcatchments, features and monitoring sites.
Estuarine monitoring sites
Freshwater and biological monitoring sites
Catchment area
Mangroves
Event monitoring site at Bennetts gauge station
Event monitoring site at Elizabeth River gauge station
12km60
26
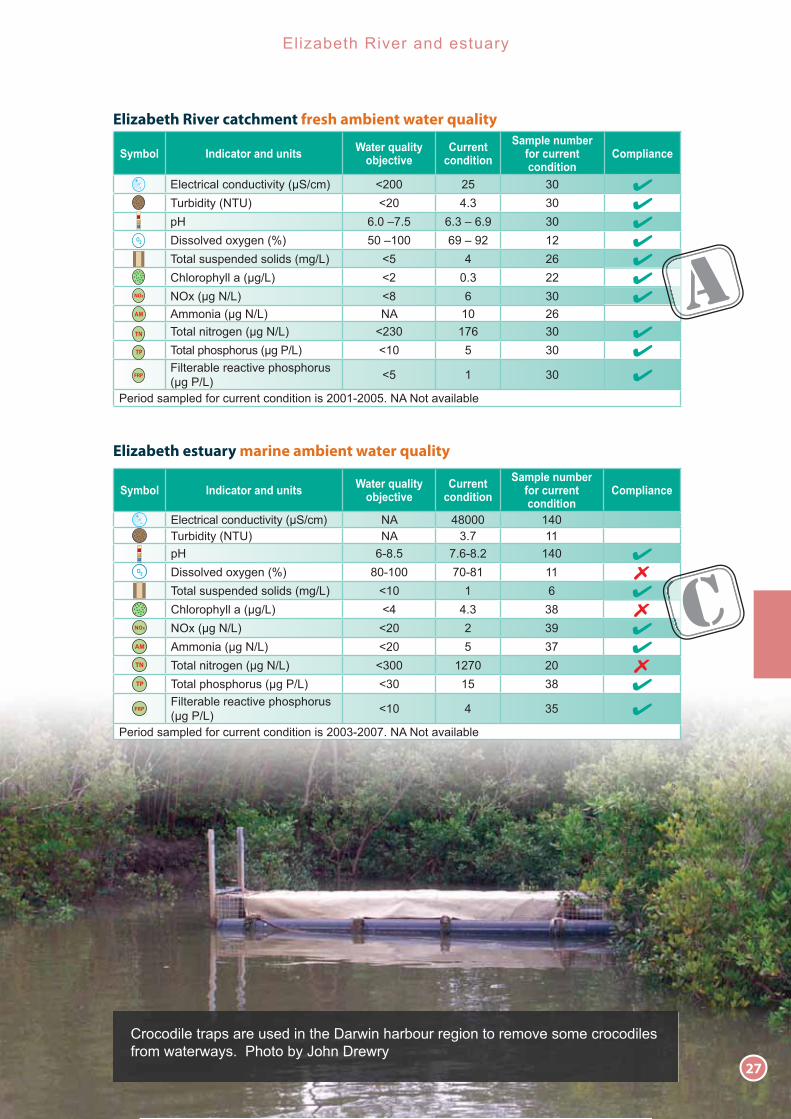
Elizabeth River and estuary
Elizabeth River catchment fresh ambient water quality
Symbol Indicator and units Water quality objective
Current condition
Sample number for current condition
Compliance
$����������������?����#�+=��@ <200 25 30 � ��������#< �@ <20 4.3 30 �pH 6.0 –7.5 6.3 – 6.9 30 �������?��������#�@ 50 –100 69 – 92 12 � ��������������������#��=~@ <5 4 26 �>������������#��=~@ <2 0.3 22 �<���#���<=~@ <8 6 30 �;�������#���<=~@ NA 10 26 ������������#���<=~@ <230 176 30 � ���������������#���]=~@ <10 5 30 �Filterable reactive phosphorus #���]=~@ <5 1 30 �
Period sampled for current condition is 2001-2005. NA Not available
Elizabeth estuary marine ambient water quality
Symbol Indicator and units Water quality objective
Current condition
Sample number for current condition
Compliance
$����������������?����#�+=��@ NA 48000 140 ��������#< �@ NA 3.7 11pH 6-8.5 7.6-8.2 140 �������?��������#�@ 80-100 70-81 11 � ��������������������#��=~@ <10 1 6 �>������������#��=~@ <4 4.3 38 �<���#���<=~@ <20 2 39 �;�������#���<=~@ <20 5 37 � ������������#���<=~@ <300 1270 20 � ���������������#���]=~@ <30 15 38 �Filterable reactive phosphorus #���]=~@ <10 4 35 �
Period sampled for current condition is 2003-2007. NA Not available
C
A
Crocodile traps are used in the Darwin harbour region to remove some crocodiles from waterways. Photo by John Drewry
27
Elizabeth River and estuary
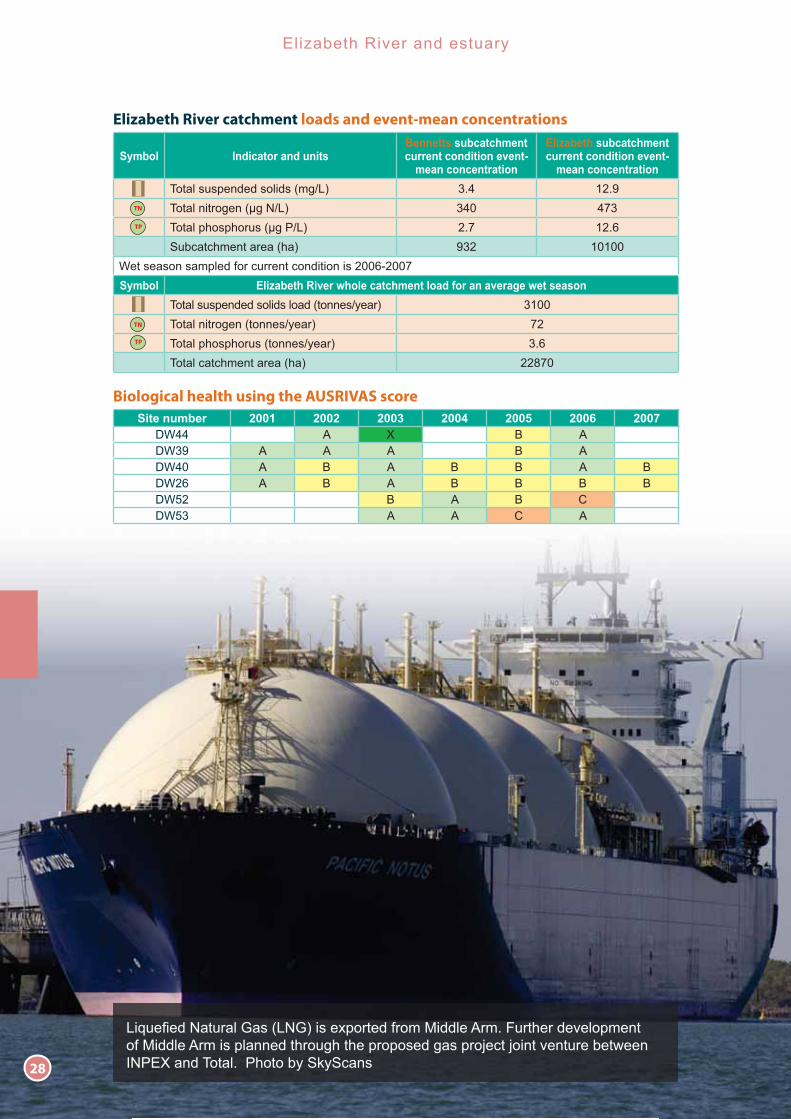
Site number 2001 2002 2003 2004 2005 2006 2007DW44 A X B ADW39 A A A B ADW40 A B A B B A BDW26 A B A B B B BDW52 B A B CDW53 A A C A
Biological health using the AUSRIVAS score
Symbol Indicator and unitsBennetts subcatchment current condition event-
mean concentration
Elizabeth subcatchment current condition event-
mean concentration ��������������������#��=~@ 3.4 12.9 ������������#���<=~@ 340 473 ���������������#���]=~@ 2.7 12.6+��������������#��@ 932 10100
Wet season sampled for current condition is 2006-2007Symbol Elizabeth River whole catchment load for an average wet season
�������������������������#�����=��@ 3100 ������������#�����=��@ 72 ���������������#�����=��@ 3.6 �����������������#��@ 22870
Elizabeth River catchment loads and event-mean concentrations
~�{����<����������#~<�@��������������������;���)�����?�������of Middle Arm is planned through the proposed gas project joint venture between INPEX and Total. Photo by SkyScans28
Blackmore River and estuary
Blackmore River
and estuary
report card 2009
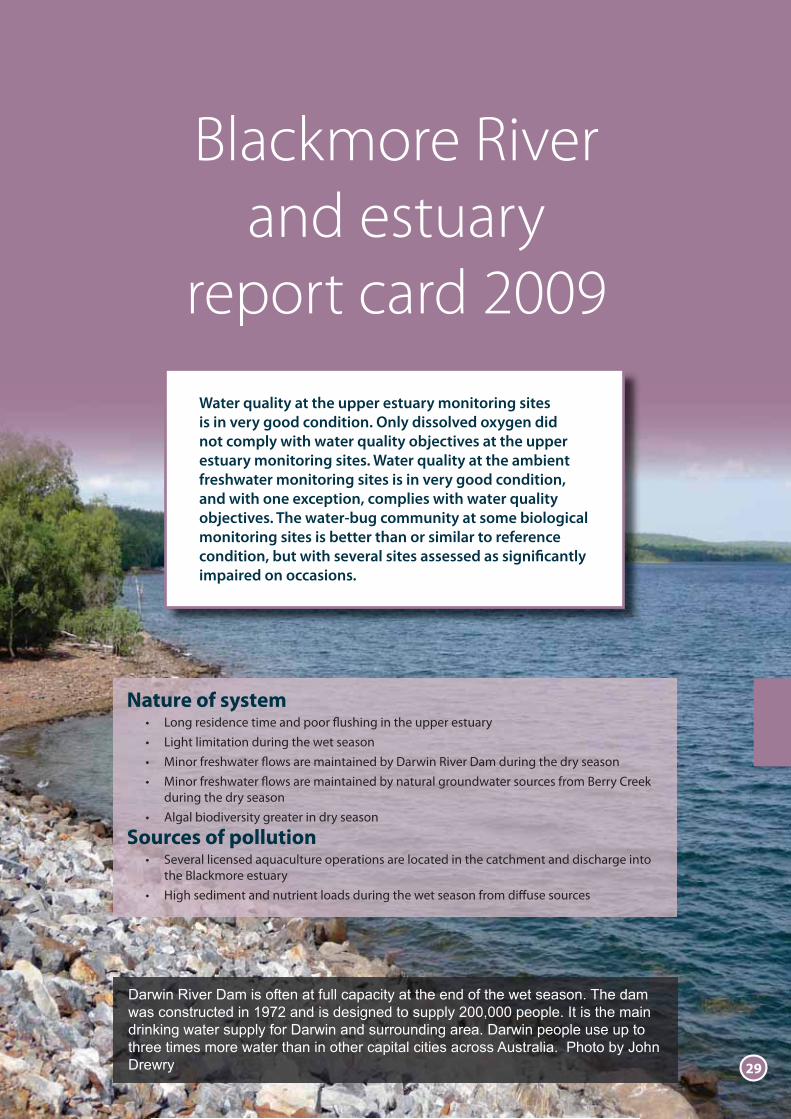
Water quality at the upper estuary monitoring sites
is in very good condition. Only dissolved oxygen did
not comply with water quality objectives at the upper
estuary monitoring sites. Water quality at the ambient
freshwater monitoring sites is in very good condition,
and with one exception, complies with water quality
objectives. The water-bug community at some biological
monitoring sites is better than or similar to reference
condition, but with several sites assessed as significantly
impaired on occasions.
Nature of system
Sources of pollution
Darwin River Dam is often at full capacity at the end of the wet season. The dam was constructed in 1972 and is designed to supply 200,000 people. It is the main drinking water supply for Darwin and surrounding area. Darwin people use up to three times more water than in other capital cities across Australia. Photo by John Drewry 29

Blackmore River and estuary
DW31
DW62
DW46DW47
DW61DW63
DW585
6060DW6060
DW36W
DW37D
Noonnnnaamaahhhnoo hma
Berry SpringsBerryBerryBerry Sp
Blackmore River catchmentBlackmore River catchment showing subcatchments, features and monitoring sites.
Estuarine monitoring sites
Freshwater and biological monitoring sites
Catchment area
Mangroves
Event monitoring site at Peel gauge station
Event monitoring site at Berry gauge station
12km60
30

Blackmore River and estuary
Symbol Indicator and units Water quality objective
Current condition
Sample number for current condition
Compliance
$����������������?����#�+=��@ <200 47 30 � ��������#< �@ <20 3.0 30 �pH 6.0 –7.5 5.8 – 7.0 30 �������?��������#�@ 50 – 100 59 – 72 15 � ��������������������#��=~@ <5 5 27 �>������������#��=~@ <2 1.9 24 �<���#���<=~@ <8 5 29 �;�������#���<=~@ NA 6 26 ������������#���<=~@ <230 204 29 � ���������������#���]=~@ <10 9 29 �Filterable reactive phosphorus #���]=~@ <5 1 29 �
Period sampled for current condition is 2001-2005. NA Not available
Blackmore River catchment fresh ambient water quality
Blackmore marine ambient water quality
Symbol Indicator and units Water quality objective
Current condition
Sample number for current condition
Compliance
$����������������?����#�+=��@ NA 49500 115 ��������#< �@ NA 5.7 118pH 6-8.5 7.9-8.2 118 �������?��������#�@ 80-100 61-82 118 � ��������������������#��=~@ <10 7 42 �>������������#��=~@ <4 2.5 61 �<���#���<=~@ <20 8 77 �;�������#���<=~@ <20 10 61 � ������������#���<=~@ <300 NA NA ���������������#���]=~@ <30 20 69 �Filterable reactive phosphorus #���]=~@ <10 6 76 �
Period sampled for current condition is 2001-2005. NA Not available
B
B
Aerial view of an aquaculture operation in the Blackmore River catchment. ����������#Lates calcarifer@���������������{�������������������������]�����by Jeremy Freeman
31

Blackmore River and estuary
Biological health using the AUSRIVAS score
Blackmore River catchment loads and event-mean concentrations
Symbol Indicator and unitsPeel subcatchment
current condition event-mean concentration
Berry subcatchment current condition event-
mean concentration ��������������������#��=~@ 15.5 13 ������������#���<=~@ 605 316 ���������������#���]=~@ 10 14+��������������#��@ 5680 13700
Wet season sampled for current condition is 2006-2007Symbol Blackmore River whole catchment load for an average wet season
�������������������������#�����=��@ 7740 ������������#�����=��@ 191 ���������������#�����=��@ 8.7 �����������������#��@���������Darwin River dam catchment 63500
Site number 2001 2002 2003 2004 2005 2006 2007DW31 X X X A B A BDW46 A A A ADW47 A B A A ADW36 A A B A BDW37 A A A A B B A
Blackmore River Photo by George Maly32

Shoal Bay and Buffalo Creek
Shoal Bay and
Buffalo Creek
report card 2009
Water quality in outer Shoal Bay is in excellent condition
and complies with water quality objectives. Several water
quality indicators at some Shoal Bay upper estuary and
freshwater monitoring sites do not comply with water
quality objectives. The water-bug community at the Howard
River biological monitoring site is significantly impaired.
Estuarine water quality at the monitoring site in Buffalo
Creek is in very poor condition. Of the sites monitored, this
site has the most degraded water quality in the Darwin
Harbour region.
Nature of system
Sources of pollution
Crocodile in the Hope Inlet, Shoal Bay. Photo by Tony Boland 33

Shoal Bay and Buffalo Creek
DW43
Buffalo ffffCCCCCCCCCrrreek
DW45
42DW4242
DDDDaaa iaaarrrwwwaarwwwrwwwwiinnrwwwiwiin
PPPPPPaalmePP l erstonePPa stssssHowardard
sSpringsgspri
Estuarine monitoring sites
Freshwater and biological monitoring sites
Catchment area
Mangroves
Map of Shoal Bay catchmentShoal Bay catchment showing subcatchments, features and monitoring sites.
Event monitoring site at Howard River gauge station
12km60
34

Shoal Bay and Buffalo Creek
Symbol Indicator and units Water quality objective
Current condition
Sample number for current condition
Compliance
$����������������?����#�+=��@ <200 102 9 � ��������#< �@ <20 2.9 9 �pH 6.0 – 7.5 5.8 – 7.0 9 �������?��������#�@ 50 – 100 33 – 56 5 � ��������������������#��=~@ <5 4 6 �>������������#��=~@ <2 0.3 5 �<���#���<=~@ <8 12 7 �;�������#���<=~@ NA 12 6 ������������#���<=~@ <230 174 7 � ���������������#���]=~@ <10 10 7 �Filterable reactive phosphorus #���]=~@ <5 2 7 �
Period sampled for current condition is 2001-2005. NA Not available
Shoal Bay catchment ambient freshwater quality
Symbol Indicator and units Water quality objective
Current condition
Sample number for current condition
Compliance
$����������������?����#�+=��@ NA 41200 13 ��������#< �@ NA 13.0 13pH 6-8.5 8.1-8.5 13 �������?��������#�@ 80-100 74-92 13 � ��������������������#��=~@ <10 12 3 �>������������#��=~@ <4 8 9 �<���#���<=~@ <20 4 13 �;�������#���<=~@ <20 2 7 � ������������#���<=~@ <300 311 9 � ���������������#���]=~@ <30 30 11 �Filterable reactive phosphorus #���]=~@ <10 3 13 �
Period sampled for current condition is 2004-2005. NA Not available
Shoal Bay upper area marine ambient water quality
C
Symbol Indicator and units Water quality objective
Current condition
Sample number for current condition
Compliance
$����������������?����#�+=��@ NA 51200 13 ��������#< �@ NA 2.7 13pH 7.0-8.5 8.3-8.5 13 �������?��������#�@ 80-100 86-95 13 � ��������������������#��=~@ <10 3 3 �>������������#��=~@ <2 0.8 9 �<���#���<=~@ <20 2 13 �;�������#���<=~@ <20 2 7 � ������������#���<=~@ <270 166 8 � ���������������#���]=~@ <20 10 11 �Filterable reactive phosphorus #���]=~@ <5 3 11 �
Period sampled for current condition is 2004-2005. NA Not available
Shoal Bay outer area marine ambient water quality
A
C
35

Shoal Bay and Buffalo Creek
Symbol Indicator and units Howard subcatchment current condition event-mean concentration
��������������������#��=~@ 9.3 ������������#���<=~@ 432 ���������������#���]=~@ 9.6+��������������#��@ 14960
Wet season sampled for current condition is 2006-2007
Symbol Shoal Bay whole catchment load for an average wet season �������������������������#�����=��@ 15200 ������������#�����=��@ 288 ���������������#�����=��@ 18.6 �����������������#��@ 76170
Shoal Bay catchment loads and event-mean concentrations
Biological health using the AUSRIVAS score
Site number 2001 2002 2003 2004 2005 2006 2007DW43 B B B B B B
Symbol Indicator and units Water quality objective
Current condition
Sample number for current condition
Compliance
$����������������?����#�+=��@ NA 37400 7 ��������#< �@ NA 29.5 7pH 6-8.5 8.0-8.4 7 �������?��������#�@ 80-100 39-112 7 � ��������������������#��=~@ <10 30 2 �>������������#��=~@ <4 146 5 �<���#���<=~@ <20 17 7 �;�������#���<=~@ <20 15 4 � ������������#���<=~@ <300 1630 5 � ���������������#���]=~@ <30 600 6 �Filterable reactive phosphorus #���]=~@ <10 187 7 �
Period sampled for current condition is 2004-2005. NA Not available
Buffalo Creek marine ambient water quality
The Buffalo Creek monitoring site is in the estuary and is subject to wastewater discharge from the Leanyer-Sanderson sewage treatment plant. The licensed mixing zone is yet to be fully determined. Water quality objectives will not apply within a licensed discharge mixing zone.
E
Water quality sampling in Buffalo Creek. Buffalo Creek receives treated wastewater discharge from the Leanyer/Sanderson sewage treatment plant. Water quality is poor, with very high chlorophyll levels – hence the noticeable green colour of the water during this sampling. Photo by Julia Fortune36

Rapid Creek
Rapid Creek
report card 2009
Water quality at the monitoring sites is in very good
condition and in most cases complies with water quality
objectives. Event-mean concentrations in the Moil
subcatchment were greater than for the other sites in the
region, indicating greater pollutant loads. The water-bug
community at the biological monitoring sites is significantly
or severely impaired.
Nature of system
Sources of pollution
37

Rapid Creek
2111DDDWWW221121
00400DDDWW00000WWW22222WDDWW
Estuarine monitoring sites
Freshwater and biological monitoring sites
Catchment area
Mangroves
Airport
Rapid Creek catchmentRapid Creek catchment showing catchment boundary, features and monitoring sites.
Event monitoring site at Moil gauge station
6 km30
38

Rapid Creek
Rapid Creek catchment loads and event-mean concentrations
Symbol Indicator and units Moil subcatchment current condition event-mean concentration
��������������������#��=~@ 56 ������������#���<=~@ 821 ���������������#���]=~@ 87+��������������#��@ 36
Wet season sampled for current condition is 2006-2007Symbol Rapid Creek whole catchment load for an average wet season
�������������������������#�����=��@ 1680 ������������#�����=��@ 21.7 ���������������#�����=��@ 2.2 �����������������#��@ 2770
Symbol Indicator and units Water quality objective
Current condition
Sample number for current condition
Compliance
$����������������?����#�+=��@ <200 42 24 � ��������#< �@ <20 2.5 24 �pH 6.0 –7.5 4.9 – 6.0 24 �������?��������#�@ 50 –100 54 – 83 21 � ��������������������#��=~@ <5 NA NA NA>������������#��=~@ <2 0.3 20 �<���#���<=~@ <8 6 17 �;�������#���<=~@ NA 5 17 ������������#���<=~@ <230 71 17 � ���������������#���]=~@ <10 2.5 17 �Filterable reactive phosphorus #���]=~@ <5 0.5 17 �
Period sampled for current condition is 2005-2008. NA Not available
Rapid Creek ambient freshwater quality
Biological health using the AUSRIVAS scoreSite number 2001 2002 2003 2004 2005 2006 2007
DW04 C BDW21 C C B B C C CDW22 C
B
Community planting day at Darwin International Airport, Rapid Creek. Acknowledgement - Darwin International Airport. Copyright David Silva 39

Rapid Creek
Electrofishing in Rapid Creek)������?������`�����>!���?������������������������������������������������������!������������������������������������<���?�������������?������'((������2007 are shown in the Rapid Creek report card.
$�������������������\��������������������������������������������������������������$����������������������recognised research method for all ��������������������;���������as well as turtles and freshwater crustaceans. Data collected include ��������������������_��������#������and juvenile) and relative abundance of captured and observed species.
The process applies an electric current through a waterbody to create an ����������������������������������������������������������������and results in temporary stunning. Fish are then released back into the water unharmed. Data collection is undertaken on a ‘shot by shot’ basis, where a habitat �����������?����?������������#&�����@��)�����������������������������habitat data are collected. A total of 10 shots per stream reach are undertaken, which �����������������������������������������������������^�������������
����%��>������#Neosilurus hyrtlii) is found in Howard River and Rapid Creek Photo by Dave Wilson��� ���%�%� >>����� ��� ##NNeosililurus hhyrtltliiii)) iis ffou dnd iin HHowa drd RRiiver
$��������������`�����>!��]��������"�����)����40

Rapid Creek
Fish survey results
July 2007 survey Site DW22 Site DW21
Species Mean length #��@
CountMean length #��@
Count
Hypseleotris compressa #$����������@ 33 18 30 17Lates calcarifer #��������@� - - 310 1Leiopotherapon unicolor #+�������]��@� 43 14 106 2Melanotaenia australis #O����`���������@� 45 10 30 14Melanotaenia nigrans�#����!������`���������@� 28 1199 25 626
Mogurnda mogurnda�#<����� ����Gudgeon) 61 222 27 24
Neosilurus hyrtlii #����%��>�������������\���>�����@ 72 40 60 16
Megalops cyrinoides�# ����@� - 12 - -<����+�?�������!���?��������#&(�������������������(����@����������������counts include visual observations.
August 2006 survey Site DW22 Site DW21 Site DW04
Species Mean length #��@
CountMean length #��@
CountMean length #��@
Count
Hypseleotris compressa�#$����������@ 48 2 44 3 44 5Leiopotherapon unicolor�#+�������]��@� 72 23 61 26 59 16Melanotaenia australis�#O����`���������@� 51 1 53 2 - -Melanotaenia nigrans�#����!������`���������@� 40 217 37 204 34 3
Mogurnda mogurnda�#<����� ����Gudgeon) 71 219 49 7 74 85
Neosilurus hyrtlii #����%��>�������������\���>�����@ 97 23 85 24 96 85
Ophisternon gutturale�#;���������+�����$�@ - - 280 1 300 1<����+�?�������!���?������������#&((��@�������������������������������������?������observations.
Rapid Creek is the largest freshwater stream in the Darwin city area.41

;����?��������������������~���������������������#)�����'((�@����������large areas of different aquatic macrophyte communities. Photo by Jeremy Freeman

Lagoons
Lagoons
report card 2009
Water quality in the region’s lagoons is mostly in very
good condition. Water quality indicators at lagoon
freshwater monitoring sites complies with water quality
objectives. Water quality objectives have not been
developed for all indicators.
Nature of systemThe Darwin region has a large number of freshwater lagoons or wetlands. O��������������������������?��^��������������;�����������������!�����about bird life, amphibians, and plant communities of the local lagoons, systematic �����������������������?���������������������������������������������frogs and water plants as part of a project to gather information on the biological health of the lagoons. These data are being evaluated to establish objectives for wetland health assessment when using these biological indicators.
������~���������������������������������#;������'((�@��������������of Nymphaea violacea. Photo by Gisela Lamche 43

Lagoons
Symbol Indicator and units Water quality objective
Current condition
Sample number for current condition
Compliance*
$����������������?����#�+=��@ NA 16.8 102 Good ��������#< �@ <5 1.4 102 �pH NA 5.4-6.0 102 Good>������������#��=~@ <10 3.5 102 � ������������#���<=~@ NA 450 102 Good ���������������#���]=~@ NA 11 102 Good
Period sampled is 2004-2005. NA Not available
Symbol Indicator and units Water quality objective Current condition Compliance*$����������������?����#�+=��@ NA 13.9 Good ��������#< �@ <5 1.8 �pH NA 5.5-5.7 Good>����������\����=~ <10 2 � ������������#���<=~@ NA 310 Good ���������������#���]=~@ NA 5 Good
NA Not available
Girraween Lagoon
* Where water quality objective is not available, a ‘good’ or ‘poor’ ranking is assessed.Sample numbers were: Girraween Lagoon 11; Knuckey Lagoon 7; McMinns Lagoon 10.
Symbol Indicator and units Water quality objective Current condition Compliance*$����������������?����#�+=��@ NA 16.6 Good ��������#< �@ <5 2.4 �pH NA 5.6-5.8 Good>����������\����=~ <10 4 � ������������#���<=~@ NA 730 Poor ���������������#���]=~@ NA 22 Poor
NA Not available
Knuckey Lagoon
Symbol Indicator and units Water quality objective Current condition Compliance*$����������������?����#�+=��@ NA 13.8 Good ��������#< �@ <5 1.4 �pH NA 5.9-6.3 Good>����������\����=~ <10 3.5 � ������������#���<=~@ NA 440 Good ���������������#���]=~@ NA 8.5 Good
NA Not available
McMinns Lagoon
Darwin region lagoonsLagoons in the region are shown on the land use map of the Darwin Harbour region report card. The water quality of standing water bodies such as lagoons is in many ways similar to that of streams. A few of the measurements can have different values from freshwater streams but are still considered healthy. For example, dissolved oxygen in a healthy ^���������������?���������_���������?��������?�������������_�������?��healthy wetland early in the morning or at the bottom of the water body.
Water quality objectives are available for chlorophyll-a and turbidity. Others have not yet been determined. Median values for ambient water quality of 12 lagoons in the Darwin region are shown below.
Median values for 12 lagoons
44

Projects
Other Aquatic Health
Unit projects
This section provides a snapshot of projects to protect
water quality, investigate biological health of the region’s
ecosystems, and monitoring programs.
Rural residential and horticulture are two of many land uses that contribute to sediment, nutrient and pesticide loads to local waterways. Palmerston and Darwin Harbour in background, April 2008. The Northern Territory Government monitors water quality in rural areas of the region. Photo by George Maly 45
Projects
A water quality protection planThe water quality of Darwin Harbour is regarded as being in a near-pristine or slightly ���������������������?����������������������������������������������the region will have a negative impact on the quality of waterways particularly around urban areas.
While the population residing in the Darwin Harbour catchment currently totals over 120,000 people, by 2026 it is expected to increase to 165,000 people. Population increase often leads to urban and rural growth which can lead to increased erosion and increased loads of pollutants entering waterways. High pollutant loads can compromise ����{����������������������������������^�������������������������������������������������������������^����
;�O�����������]��������]�������������������#O�]]@���������?�����to ensure that the quality of the region’s water resources is maintained and that the community’s values and uses of waterways are protected from the adverse effects of urbanisation and other polluting activities.
]���������������{���������K���?��#����{��������������������������������@�is a key component of the WQPP. Water quality objectives describe the water quality needed to protect values and uses of regional water resources. These water quality criteria act as guideline levels and/or reference levels to help guide planning and water management to achieve and protect each of the values over time.
The water quality objectives also are:�� �������������������������������������������������{����������������� ����������������?������������������{��������� ���������?���������������������������� ������������������?�������������� �����?���������������������������!��������������������������
waters; and�� ������������������?��������������������%�������������������������������������
�������������������^�����������������������������������������������
46
Projects
A hazard of sampling waterways in the Darwin Harbour region. Photo by Mike Welch
Water quality objectives for the Darwin Harbour catchment are intended for the community, local councils and government agencies to use in catchment management and land use planning activities. They are a tool for strategic planning and development assessment processes. Water quality objectives are agreed to by stakeholders.
Water quality objectives will be formally declared under the Northern Territory �����������#Water Act part 7). Formalisation of the water quality objectives will ensure �������������������������������������������������������?�����������������������������������������������
$�?���������?�����#���������������������������Northern Territory Water Act 1992) are particular values or uses of water that are conducive to a healthy �����������=�������������������������������������������������� ���environmental values require protection from the effects of pollution. The Northern Territory Water Act 1992����������?���������������������������$�������include recreational and aesthetic values and maintaining aquatic ecosystem health. ;������������������������������������!�����'(( ����?����������������������Uses originally declared in 1996. The community’s preference was for existing uses to �������������������?���������������������������!����������������������Uses.
Water quality objectives provide appropriate criteria to assess whether a designated �����������������������������Q�����������������������<�����������������������������������������������������������������������������������region and selected as key water quality indicators. Further information can be found at website http://www.nt.gov.au/nreta.
AAAAAA AA A AA AAA A AAAAAAAAAAAAAAAAAAAAAA A A hahahahahahahahahahahahahahahahhahahahhhhhahahhhahaahahahhhhhhhahahahhhhhhhhhhahahahhhhhhhhhahhhahahhhahaahahhaahahaaahahahhhahhhahaaahhhahahhhaaaaaahhhhhahaaaaaaaahahhhhhaaaaahhhaaaaahaaaaaaaaahhhaaaaaahhaaaaaahahahahhaaaaahhhhaaaaaaaahhhaaaaaaahhhhaaaaaaaaaahhaaaaaaaaaaaaaaahhhaaaaaaaaaahhhaaaaaaahhhhhaaaaaaaaaaaazzzzaaaaazzzzaaaaaaaaazzzzzzzzzzzzzaazaazaaazazaaaaazzzzzzazaaaaaazzzzzzzzzzzzaaaaaaaazaaaaaaazzzzzzzzzzaaaaaaaaazazzzzzzzzzzzzzaaaazazazazazazzzzzzzaazazaaaaaazzzzzzzzaazazaaazzzzzzzzzazaazzzzazaazzzazzzzzzzzzazazazzzzzzzaaaazzzaaazzzzzzaazzzzaazaaaazzzzzzzzzaaaaaaaa ddrddddddrddrrdrdrrrdrrddrrdrdddddddddddddrrdrrrrrrdrrrddddrddddrrrrdrrrrrrdddddrddddddrrrrrrrrdrddddrdrdddrdddrrrrrrrrrrdrddddddddddrrrrrrrrrdrdddddrdddddrrrrrrrdrdddrdrdrdddddddrrrrdrddrdddddddrrrrdddddddrrdrdrrdrddddddrdddddrrrrdddddddrddddrrrrrdrddddrrrrdddddddddddrrddddddddddrrrrrddddddddddddddrrrdrdddrdddddrddddddddrrdrddrdddrrrrrddd oooooooooooooooooooooooooooooooooooooooooooooo o ooooooo o ooooooooo ooo ooooooooooo ooooooooooo ooooooooooooooooooooooooooo ffffffffffffffffffffffffffffffffffffffffffffffffffffffffffffffffffffffffffffffffffffffffffffffffffffff fffffffffffffffffffffffffffffffffffffff ffffffff fffffff fffffffffffff fffff fffff sassasassasaasasaasassssasssassssaaaaaaasssssssssassssssssaasasssssssaaaaasssssasassasassssaaaaaaassssssssaaaaaasssssssssssaaaaaaaaaasasasasasasssssssaaaasasassssaaaaaasssssaaaaaasassassassaaaaaaaasassasasasssssaaaaaaaasasssaaaaasassaasasssssaaaaaassaaasssaaampmpmpmpmpmpmpmpmpmpmppppmmmmmmpmpmpmpmmppmmmmpmmmmmppppppppppmmmmpmpmmmppmpmmmmmmpmpmmppppppmmmmmpmpmmpmppmpmppmmmpmpppppppmppmpmppppppmmmpppmmmmpmpppppppmmpmmppmpmppmmmmmmmmpppmppmppmpmmmpmpmpmppppmpmpmmmpmmmmmpppmppmpppppppmpppmpmpmmpmmmmmmmmppppmpmpppmppppppmmmmmmmmmmmmmmpmpmpmppppppmmmpmpmpmmmmmmppppppppppmppmpmpppppppppppppppppppppppppppppppppppppppppppplilililliliililllililiillilillilliliilliiliiilillllilllllilillliillilliliiiiliililllliiiiillllliiillliiiilliliiiiillliiiiilllllllliliiiiiiinngngnngngggnggnnngggggggggnnggggngggggnnnnggnggggggggggnnnggggggggggnnggggggggggngggggggggggggggnnggggggggggnngggngngnggggggggnggggggggngggngggggggnnnnngggggggggngggggggggggnngggggggggggnnnnngggggggggggggngnnnnngggggggggggnnnnggggggggggggngngngngngngggggggggggggggggggggggggggggggggggggggggggggggg wwwwwwwwwwwwwwwwwwwwwwwwwwwwwwwwwwwwwwwwwwwwwwwwwwwwwwwwwwwwwwwwwwwwwwwwwwwwwwwwwwwwwwwwwwwwwwwwwwww wwwwwwwwwww wwwwwwwwwww tttattttatttttttttttttttattttaatttttttattataaatttttttttttaaaaaaaaatttatatttaaatatattttatatttaaattttttaattattttttaaaaattttttttaaaaatttaaaaaaatttttaaaaaattatttttttaaaaattttttttaaattttttaaaaaaaatttttttttaaaaaaatttaaaaaaaaaaattttttttttaaaaaaaattttttaaaaaaaaatttttttaaaaaaaaaataaaaaaaataaaaaaaaaaatteeeeeeerrrerrreeeeerrerreeeeeeeeeerrrrrrrrrreeeeeeeeerrrrrrrreeeeeeeeeeeeeerrrrrrrerreeeeeeeeeeeeeerrrrrrrrrerreeeeeeeeeeeeeerrererererereeeeeeeeeeeerrereeeeeeereererereeeeeeereereeeererrrreeerrereererreeeeeereereeeeeeeeeeeeeeeeeeeeeeeeeeeeeeeeeeeeeeeererreeeeeeerreeeeeeeeeererrwwwwwawawwawawaaaaawwwwwwwwawwawwawwwwwwwwwwwwwawwawwwwawawaaaaaawwwwwwwwwwawawwwwwwawaaaaawwwwwwwwawwwwwwwwawaaaaaaaaaawwwwwwwwwwwwwawaaaaawwwwwwwwwwwawawawawaaaaaaaaawwwwwwawaaaaaaaawwwwaaaaaawawwwwawwawaawawaawwaaaaawawwwwaawaaaawwwawwwawwaawaawwwawwaaawwwaawawwawawwaaaawwwwwaawawawawaawwaaysysyssysysysysyyyssyyssysssyyyyyssyyyyyyyyyyyysyyyyyyysyyssyysyyyyyyyyyyyyyyyyyyyyyyyyyyyyyyyyyyyyyyyyyyy iii i iiiii iii i innnnnnnnnnnnnnnnnnnnnnnnnnnnnnnnnnnnnnnnnnnnnnnnnn nnnnnnnnnnnnnnnnnnnnnnnnnnnnnnnnnnnnnnnnnnnnnnnnn thhthththhthhhhthtttthththhthtththhhhthttththhhthttthhththtththhththththththhttthhhhtthhttttttttththhhtthtttttttthhhhtttttththhhhhhttttttthhhhhhtthhhttttthhhhtttttthheee e eeee eee DaDaDaDaDDDDDDDDDaaaaDaDDDaDDDaaaaDaDDDDDaaDDaDaDDDDDaDDDDDDDDDDaDaDaDDDDDDaaaDDDDaDDaDDDDDaDDDDDaaDaDaDDDaaDDDaaaDDaaaDDDDaaDDDDDDDDDDaaaaDDaarwrwrwrwrwwwwwwwwrwwwwwwinininii HHHHHHHHHHHHHHHHHHHHHHHHHHHHHHHHHHHHHHaarararararaaaaaaaaaaaraaaaaaaaaaaaaaaaaaaaaaaaaaaraaaaaaaaaaaaaaaaaaaaaaaaaaaaaaaaaaraaaaaaaaaraaaaaaaaaaaaaararaaaaaaraaaaaaraaaaaaaaaaaarbobobobobooboboboboobobouuurururururururuurururrurururu rrrr rrrrrr rrr rrrrrrrrrrrrrrrrrrrrrrrrreeegegegegeeegegeeeeggggegegegegggeegeggggeggeeeeegeeegeeegeggggegggggeegeegggeggggeeeeggggggggggggegggeggggggeeeegggggggggggegeeggggggggggeggggggggggeeegggggggggggggeeegggegggggggggggggeeggggggggeggggggggggeeegeeggggggeeeggggggggeeeeegggegggggeeeggggegggggggggggggggggggggggggg ooooioioiooiioioioioioioiiiiiiiioioioioioiiiioiooooioiiiooiiiioiooiooiiiiioioooioioooooiiiioiooioiooiiiioooiiiiioioooooiiiiiiiooooooiiiiooiiioiiiiooooiiiiiiooooooiiiiiooiiiiiioooiiooooiiiiiiioooooooooiiiiioooiiiiiiioooooiioooiiooiiioonnnnnnnnnnnnnnnnnn.nnnnnn.nnnnnnnnnnnnnnnnnnnnnnnnnnnnnnnnnnnn.nn.nnnnnnnnn..nnnnnnnnnnnnnnnnnnnnnnnnnn hPhPhPhPhPhhhhhhhhhhhPhPPhPhhhhhhhhhPhPhPPPhPPhPhPPhhhPhhhhhhhhPhPPhPhPPhPhPhPPPhhhhhhhhPPPPhPPPhhPhhhhhhhhPhPhPPPhPPhPhhhhhhPhPPPPPhhhhhhPhPhPPhPPhPhPhhhhhhhhPhhPhPhPhPhPhPPhPhhhhPPhPPhhhPhhPhhhPhhPhhhhPhhhPhhPPhPPhhPhhoototototootototototototoootototototooooooototototottottotttoottotoottooooottoootttooooooooooootttotttooooooooottttttooooooooooooottttttttottoooooootttttttooooooooottttttttooooooooooootttttttooooooo ooooooooooo oooooo oooooooooooooo oooooooooooooooooooooooooooooooooooo o oooooooooooooooooooooooooooooooooooooooooooooooooooooo ooooooooooo bbbybybybybybybybybybybybbybybyybbbybbbybybybybybybbybbybbybbbybbybbybbbyybybbybybybybbbbybbbbbbbbbybbbybbbbbbbbbybbybbbyyyyyyyyyyyyyyyyyyyyyyyyyyyy MMMMMMMMMMMM MMMMMMMMM MMMMMMMMM MMMMMMMMMMMMMMMM MMMMMMMMMMMMMMMMMMMMMMMMMMMMMMMMMMMMMMMMMMMMMMMMM ikikiikikkikkikkkkkikikikkkkkkkkkkikikkkkkkkkkkkkkkikkkiikikkkikkikkkkiikkkkikikkkkiiikkikkkkikikkkkkkeeeeeeeeeeeeeeeeeeeeee e eeeeeeeeeeeeeeeeeeeeeeeeeeeeeeeeeeeeeeeeee eeeeeeeeeeee eee eeee eeeeeeeeeeeeeeeee WeWWeWWWeWeWeWeWeWeWWeWWWeWeeWWWWeWeWeWeWeWWeWeWeWeWeWWeWeWeWWeWWWWeWeWeWWWWWWeWWWeWWWWeWeWWeWWWWWWeWeWWWWWWWWWWWeWeWeWWWWWWWWWWWWWWeWWeWWWeWWeWWWWWWWWWWeeeWWWWWWWeWWWWWWeWWWWeWeeWWWWWWWWWeWWWWWWWWeWWelclclclclclclcclclclcclclclclcllclclcclcccclcllclclclcccclllllccllclchhhhhhhhhhhhhhhhhhhhhhhhhhhhhhhhhhhhhhhhhhhhhhhhhhhhhhhhhhhhhhhhhhhhhh
47

Projects
Darwin frog monitoring trialFrogs are useful indicators of environmental quality. Their eggs and larvae are fully aquatic and therefore potentially exposed to water-borne contaminants. Elsewhere in the world there are concerns about declines in frog populations and loss of species. The causes are not always clear but involve change in habitat quality, habitat fragmentation and disease.
The frog fauna of northern Australia has not suffered the same patterns of decline that are evident elsewhere. There are 29 frog species present in the Top End of the Northern Territory. None are considered to be endangered. Twenty-one species have been recorded in the Darwin area. Species that have not been recorded, but which are present elsewhere in the Top End, are mostly rock habitat specialists.
In the wet season of 2008–09 the NRETAS Aquatic Health Unit, together with staff from the NRETAS Biodiversity Unit conducted surveys of frog species present at sites throughout the suburban and rural areas of the Darwin Harbour catchment. The aim of the surveys was to catalogue the number of species present at each site, and to provide data to design an ongoing monitoring program. Thirty sites were visited on 10 ����������������������������������������������������������������������������\�����������������������?\��������?�������
<�����������������'&�����������������������������?�������������remaining species, Dahl’s Aquatic Frog was seen at survey sites but does not call; the other was found at non-survey sites. For most sites, between seven and nine species were detected, and at one site, 12 species were detected. Common species include ���"�?����)���#Litoria microbelos) and the Northern Dwarf Tree Frog #Litoria bicolor).
���������?��������������������������^���������������������������������������water temperature. This information will assist in the design of a monitoring program to detect long-term changes in the occurrence of frog species throughout the Darwin area. A rigorous monitoring program is required to document amphibian responses to �����������������������������������������������������������������������������Cane Toad. The continuation of this work will be dependent on available funds and resources.
<���������� �)����#Litoria bicolor), is a very common species, usually associated with Pandanus. It was found at many sites during the recent survey. Photo by Leonie Richards48

Projects
Common names and species of frogs recorded during surveys in the Darwin region, �����������������?�������#����(@������!��#���&(@�����������������������
Common name Species Number of sites Number of weeks detected
Species recorded in surveysGiant Frog Cyclorana australis 7 4Long-footed Frog Cyclorana longipes 2 2Green Tree Frog Litoria caerulea 14 8Northern Dwarf Tree Frog Litoria bicolor 25 10Javelin Frog Litoria microbelos 26 10Red Tree Frog Litoria rubella 15 10Red-eyed Tree Frog Litoria rothii 14 10Rocket Frog Litoria nasuta 26 10Peter’s Frog Litoria inermis 2 2Tornier’s Frog Litoria tornieri 7 10Wotjulum Frog Litoria wotjulumensis 2 3Ratchet Frog Crinia remota 26 10Marbled Frog Limnodynastes
convexiusculus24 10
Ornate Burrowing Frog Limnodynastes ornatus 1 1Golfball Frog Notaden melanoscaphus 1 2Stonemason Toadlet Uperoleia lithomoda 4 10Floodplain Toadlet Uperoleia inundata 17 10Howard River Toadlet Uperoleia daviesae 1 10Cane Toad Bufo marinus 12 9Known to occur in region but not recorded at a survey sitePale Frog Litoria pallida - -Known to occur but does not callDahl’s Aquatic Frog Litoria dahlii observed -
���%��)���#Litoria tornieri) is infrequently encountered throughout the Darwin Harbour region. Photo by Peter Dostine
49
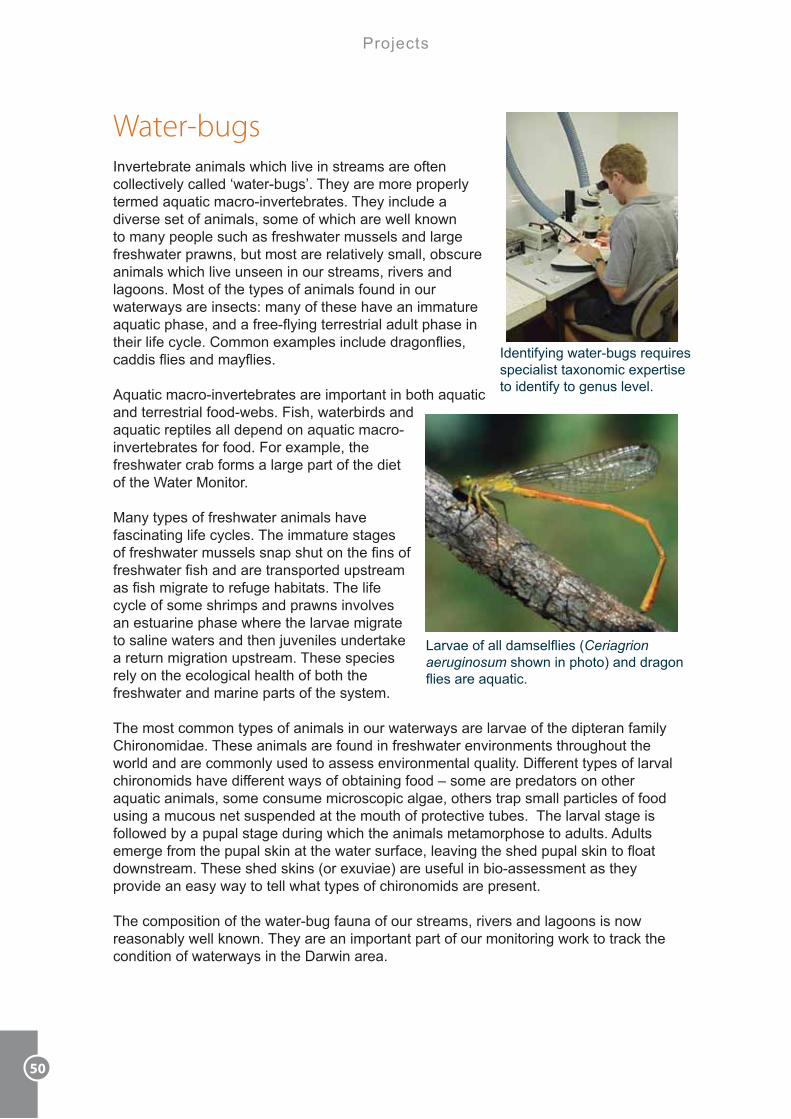
Projects
Water-bugsInvertebrate animals which live in streams are often collectively called ‘water-bugs’. They are more properly termed aquatic macro-invertebrates. They include a diverse set of animals, some of which are well known to many people such as freshwater mussels and large freshwater prawns, but most are relatively small, obscure animals which live unseen in our streams, rivers and lagoons. Most of the types of animals found in our waterways are insects: many of these have an immature �{�������������������\^����������������������������������������>�������������������������^�����������^����������^����
Aquatic macro-invertebrates are important in both aquatic and terrestrial food-webs. Fish, waterbirds and aquatic reptiles all depend on aquatic macro-invertebrates for food. For example, the freshwater crab forms a large part of the diet of the Water Monitor.
Many types of freshwater animals have fascinating life cycles. The immature stages ������������������������������������������������������������������������������������������������������� ������cycle of some shrimps and prawns involves an estuarine phase where the larvae migrate to saline waters and then juveniles undertake a return migration upstream. These species rely on the ecological health of both the freshwater and marine parts of the system.
The most common types of animals in our waterways are larvae of the dipteran family Chironomidae. These animals are found in freshwater environments throughout the world and are commonly used to assess environmental quality. Different types of larval chironomids have different ways of obtaining food – some are predators on other aquatic animals, some consume microscopic algae, others trap small particles of food using a mucous net suspended at the mouth of protective tubes. The larval stage is followed by a pupal stage during which the animals metamorphose to adults. Adults �����������������!����������������������?������������������!������^�������������� ��������!����#����?��@���������������\����������������provide an easy way to tell what types of chironomids are present.
The composition of the water-bug fauna of our streams, rivers and lagoons is now reasonably well known. They are an important part of our monitoring work to track the condition of waterways in the Darwin area.
Identifying water-bugs requires specialist taxonomic expertise to identify to genus level.
~�?��������������^���#Ceriagrion aeruginosum shown in photo) and dragon ^������{������
50

Projects
Sediment and nutrient loads in Darwin Harbour catchment streamsIn areas with highly variable rainfall such as in the wet-dry tropical north, it is important to use storm event-based sampling for pollutant load estimation, as this is when most sediment and nutrients are transported. In the Darwin region, the climate is tropical with distinct wet and dry seasons. The monsoonal wet brings rainfall averaging 1,700 mm ������������������(�����������������������������������������?�#�����from Bureau of Meteorology, 2009). The period from May to October is much drier.
Event-based water quality monitoring is being used to increase our understanding of catchment pollutant sources and help identify sources for management actions to protect the water quality in the region. The transfer of pollutants such as sediment and �������������������������������������������������#���\������������������������������@�����������#���������������������@��������
$?��\���������������������������?���������������������������^���data from the Department of Natural Resources, Environment, The Arts and Sport #<`$ ;+@����������������#�������@��������������������?����������������Water quality samples were collected by the NRETAS Aquatic Health Unit at Peel, Bennett, Berry, Howard, Elizabeth, Celia, Karama and Moil catchment gauge stations, and loads determined. Urban land use contributes greater diffuse source pollutant loads per hectare than non-urban land use. Some metal loads per hectare are greater for urban areas than non-urban areas due to metals associated with building materials. Other pollutants are from vehicle emissions, construction, manufacturing industry and roads.
The table shows average wet season load per hectare for urban and non-urban land ������������������������������#�����������+!����������'((|@¡�
Pollutant������������� ���� �
Non-urban Urban �������������������� ++�#!�=��@ 110 730;���������;��#!�=��@ 3.8 50 ������������ <�#!�=��@ 3.2 9.9 ��������������� ]�#!�=��@ 0.12 1
¢����¢��#�=��@ 71 890>����>��#�=��@ 13 200>�������>�#�=��@ 8.5 44<��!��<��#�=��@ 4.3 13~���]��#�=��@ 4.1 270;�����;��#�=��@ 2.2 11>�������>��#�=��@ 0.93 1.9
¡�+!�����~���+�� ������������"��)������#'((|@�� ��������������������������������������������������������������Harbour, Department of Natural Resources, Environment, the Arts and Sport, Report 06/2008D, Darwin.
51

Projects
�������?����������������������(((�������������������������^��������Darwin Harbour from catchments – that is about 36,000 ute loads. Most of this is from soil erosion.
About 1,000 tonnes of nitrogen enter Darwin Harbour per year. Diffuse sources from catchments are an important source of nitrogen. The Blackmore River and Shoal Bay catchments are large in area and contribute about 18 per cent and 28 per cent of average annual loads, respectively. About 140 tonnes of phosphorus enter Darwin Harbour in an average year. The graph shows sewage treatment plants are currently an important source of phosphorus to the harbour from land-based activities. Much of the remaining phosphorus is from diffuse sources in the catchment.
Contribution of catchment land-based diffuse and point source loads to Darwin Harbour in an average wet season.
Peel gauge station in the Department of Natural Resources, Environment, The ;�������+�������������������!��O���{������������������^����������collected to determine pollutant loads.
Urban sewage treatment plant point sourcesWestern catchments diffuse sourcesUrban catchments diffuse sourcesShoal Bay catchments diffuse sourcesElizabeth catchment diffuse sourcesBlackmore catchment diffuse sourcesNitrogen
loadPhosphorus
loadSuspended sediment
load
Per
cent
age
of p
ollu
tant
load
100%
80%
60%
40%
20%
0%
52

Projects
A framework for river and wetland health – FARWH indexThe Framework for River and Wetland Health has been developed as a monitoring system to guide the national assessment of river and wetland health to determine if there is long-term change in condition. The aim of the framework is to allow for national comparability of assessments of river and wetland condition based on the impacts of resource use.
The FARWH for river health has six components or sub-indices which are appropriate for the assessment of river and wetland health, as they evaluate ecological integrity. The components for river health are shown below.
For wetland health, the FARWH includes similar components and water and soil quality. Each index component may comprise more than one sub-index. The catchment �����������������������?�����������������������������������������\indices. In the FARWH system, water quality assessment focuses on ecosystem health. The water quality component for rivers has several water quality parameters affecting ecosystem health. The water quality component for rivers is being trialled, including total and dissolved nutrients, dissolved oxygen, total suspended solids, electrical conductivity and pH.
���{��������������������������������\��?����������������{������������ ��macro-invertebrate sub-index for streams is based on the AUSRIVAS system shown in some of the report cards. The indices, including the FARWH index, are scored between 0 and 1. A score of 1 refers to minimally disturbed reference condition. The scoring system is associated with condition bands A to E.
Catchment
Disturbance
(0-1)
Hydrological
Disturbance
(0-1)
Water
Quality
(0-1)
Physical
Form
(0-1)
Fringing
Zone
(0-1)
Aquatic
Biota
(0-1)
FARWH
(0-1)
*This colour coding is used in the FARWH system for wetlands.
FARWH indicator scores and banding system for wetlands
Band* Indicator score
Description
A 0.8 – 1 ~�������������B 0.6 – <0.8 +��������������C 0.4 – <0.6 ��������������D 0.2 – <0.4 +�������������������E 0 – <0.2 +?���������
53

Projects
The FARWH index is currently being trialled on the streams of the Darwin Harbour region. Trials of the FARWH index on wetlands in the Darwin Harbour region has been completed. Results revealed more than a third of the 92 natural lagoon complexes ��������������������������%������������;�{����������������������������������%����������������������������������������������%��������������������������������������%��<������������������������������������������?���������%�� ���?�����������������������������������������(� ��������������������������������������
Further reading For further reading, various reports on water quality and biological health from the AHU can be found at: http://www.nt.gov.au/nreta/water/aquatic/publications/index.html
For further information on water quality and biological indicators in the region, see the NRETAS website http://www.nt.gov.au/nreta/water/aquatic/ausrivas/index.html
For further information on water quality, see ANZECC guidelines and publications http://www.environment.gov.au/about/councils/anzecc/index.html#reportshttp://www.mincos.gov.au/publications/national_water_quality_management_strategy
Num
ber o
f lag
oon
com
plex
es
40
35
30
25
20
25
10
5
0A B C D E
Condition of natural lagoons in the Darwin Harbour region, using the FARWH system
Horticulture is an important industry in the region. Photo by George Maly54

Projects
Glossary
Explanations of water quality and biological indicators (e.g. chlorophyll-a) are
presented separately in the Interpretation section.
Terms ��� � �
Ambient water quality
Background water quality levels in waterways. In freshwater ������������������������������^���#����?��@������������
Diffuse source`��������������#����������\���@��������\�����������������as urban paved or non-paved areas, hillslopes, agricultural land and forest.
Event-mean concentration
A measure of total load in an event such as a storm divided by ������^���
FlushingThe capacity of tidal movement to dilute a body of water. In the Darwin Harbour region, upper estuaries and tidal creeks are �������������^�����
Macroinvertebrate #������\���%@
Aquatic macroinvertebrates are animals that have no backbone, are visible with the naked eye and spend all or part of their life in water. This diverse group includes insects, crustaceans, worms, and molluscs.
Mixing zone
An agreed area of receiving waters where water quality objectives may not be met. Mixing zones are at licensed wastewater discharge outfalls. The mixing zone should be determined �����������������������������������������>�������#��������<`$ ;+@��������?�����������������������
Phytoplankton Microscopic aquatic plants.
Point source Discharge from a single point, such as an outlet pipe. Can refer to runoff or wastewater discharges.
Sewage treatment plant
A facility that processes wastewater and partially removes materials that damage water quality.
Water quality objective
Water quality objectives act as local waterbody guideline levels and/or reference levels to help guide planning and water management. Water quality objectives describe the water quality �������������������������������������������������
O����`����������#Melanotaenia australis) is found in Rapid Creek. Photo by Dave Wilson
55