38
Dashboard of the future Amstelveen, 1 October 2013 Vision
| Date post: | 03-Apr-2018 |
| Category: |
Documents |
| Upload: | vuongtuyen |
| View: | 219 times |
| Download: | 1 times |
Dashboard of the future
Amstelveen, 1 October 2013
Vision
© 2013 Deloitte The Netherlands
Contents
Introduction
Event 1. Wake-up
Event 2. Management by exception
Event 3. Weekly management meeting
Event 4. Quarterly management meeting
Encore. End of day
Appendix. Overview of functionality
Dashboard of the future 1

Introduction
© 2013 Deloitte The Netherlands
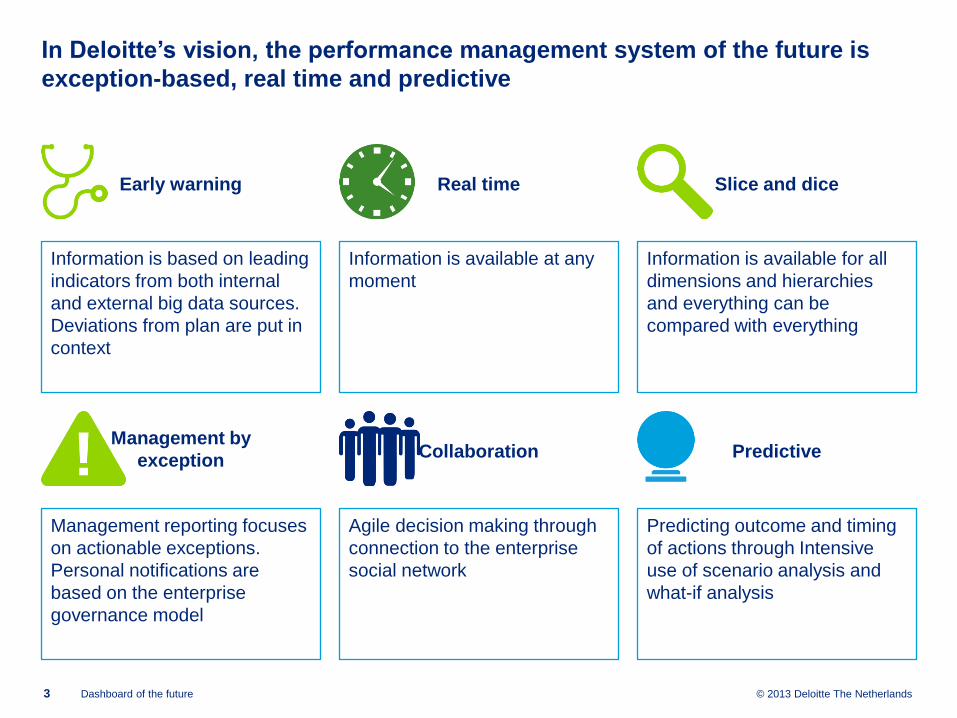
In Deloitte’s vision, the performance management system of the future is
exception-based, real time and predictive
3 Dashboard of the future
Information is based on leading
indicators from both internal
and external big data sources.
Deviations from plan are put in
context
Management reporting focuses
on actionable exceptions.
Personal notifications are
based on the enterprise
governance model
Information is available for all
dimensions and hierarchies
and everything can be
compared with everything
Information is available at any
moment
Agile decision making through
connection to the enterprise
social network
Predicting outcome and timing
of actions through Intensive
use of scenario analysis and
what-if analysis
Early warning Slice and dice
Management by
exception Collaboration Predictive
Real time

© 2013 Deloitte The Netherlands
We present the dashboard of the future in four sample events
In the future performance management is a way of living. Independent from time, location and device the
performance management system fulfills all performance information needs. To illustrate this we present
four sample future events:
4 Dashboard of the future
Sample future event Early
warning Real time
Slice and
dice
Management
by exception Collaboration Predictive
Wake-up
Management by
Exception
Weekly management
meeting
Quarterly
management meeting

Event 1. Wake-up

© 2013 Deloitte The Netherlands
Manager X wakes up and checks his phone for important notifications.
During breakfast he/she further analyses the latest real time performance
information
6 Dashboard of the future
Manager X wakes up ...
Manufacturing order
lead time turned to red Previous status: Green
Details...
... and analyses latest notifications during breakfast
Manufacturing order lead
time turned to red Previous status: Green
Details...

© 2013 Deloitte The Netherlands
He/she checks for details on the notification – integrating both internal and
external big data sources – and decides that further discussion is necessary
7 Dashboard of the future
• By using the touch
screen more detailed
information is available
any moment
• Internal information
(such as leading
indicators) and
external information
(such as news articles)
is combined to provide
a comprehensive
overview of the
situation
Note: See Appendix for explanation of the menu options

© 2013 Deloitte The Netherlands
On his/her way to the office Manager X contacts Manager Y and shares
his/her screen to facilitate the conversation
8 Dashboard of the future
© 2013 Deloitte The Netherlands
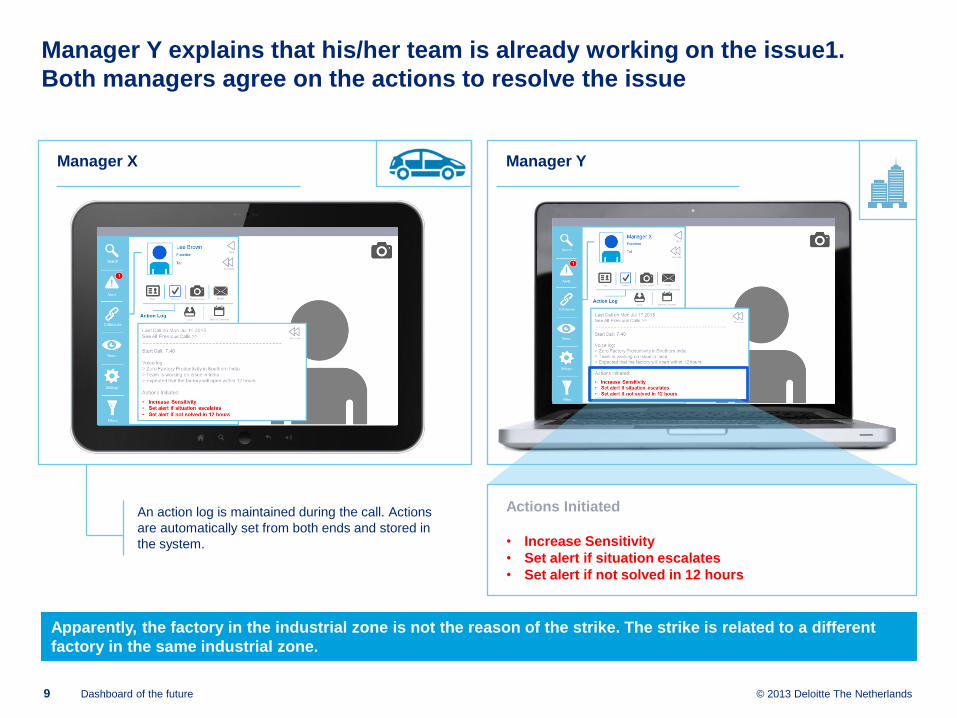
Manager Y explains that his/her team is already working on the issue1.
Both managers agree on the actions to resolve the issue
9 Dashboard of the future
Manager X Manager Y
Actions Initiated
• Increase Sensitivity
• Set alert if situation escalates
• Set alert if not solved in 12 hours
An action log is maintained during the call. Actions
are automatically set from both ends and stored in
the system.
Apparently, the factory in the industrial zone is not the reason of the strike. The strike is related to a different
factory in the same industrial zone.

Event 2. Management by exception

© 2013 Deloitte The Netherlands
In between two meetings Manager X receives a notification for a class 1
issue. Immediate action is required
11 Dashboard of the future
Funnel health is
outside of bandwith
Details...
Strategy Meeting – Project Atlanta
Video Meeting / War Room
Weekly management meeting
Quarterly management meeting
Video Meeting
Prepare for quarterly mgt meeting
Reply on E-mail
now
Agenda

© 2013 Deloitte The Netherlands
Active Filters:
1
Search
Alerts
Collaborate
Views
Settings
Filters
Maximize
Graphs Maximize
Context
All
Red
Amber
Restore
Show:
Green
82 %
Plan: 78
Order intake forecast
accuracy
3.2 mio
Plan: 3.2
Weighted distribution
24
Funnel Health
Plan: 35
45 %
Plan: 43
Win rate
Volume Price Realization
Acquire New
Customers
Marketing & Sales
now 04-2017 05-2017 06-2017 07-2017 08-2017 09-2017 02-2017 01-2017 12-2016 10-2017
Years = 2017 | Months = Jan – Dec
The personal dashboard shows that the ‘Funnel Health’ KPI is outside the
acceptable bandwidth
12 Dashboard of the future
Product & Service
Innovation Account Management Cross-Sell / Up-Sell Retention
Retain and Grow
Current Customers

© 2013 Deloitte The Netherlands
Active Filters:
1
Search
Alerts
Collaborate
Views
Settings
Filters
Maximize
Graphs Maximize
Context
All
Red
Amber
Restore
Show:
Green
82 %
Plan: 78
Order intake forecast
accuracy
3.2 mio
Plan: 3.2
Weighted distribution
24
Funnel Health
Plan: 35
45 %
Plan: 43
Win rate
now 04-2017 05-2017 06-2017 07-2017 08-2017 09-2017 02-2017 01-2017 12-2016 10-2017
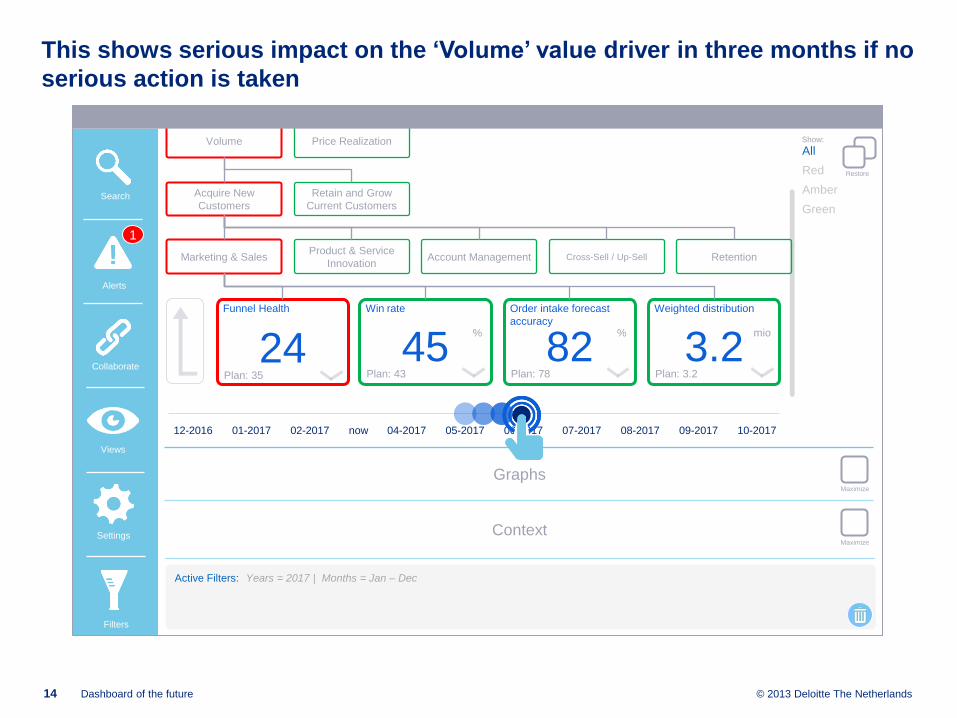
He/she uses the predictive time slider to asses the impact of the issue on
the value drivers
13 Dashboard of the future
Volume Price Realization
Acquire New
Customers
Marketing & Sales Product & Service
Innovation Account Management Cross-Sell / Up-Sell Retention
Retain and Grow
Current Customers
Years = 2017 | Months = Jan – Dec
© 2013 Deloitte The Netherlands
Active Filters:
1
Search
Alerts
Collaborate
Views
Settings
Filters
Maximize
Graphs Maximize
Context
All
Red
Amber
Restore
Show:
Green
82 %
Plan: 78
Order intake forecast
accuracy
3.2 mio
Plan: 3.2
Weighted distribution
24
Funnel Health
Plan: 35
45 %
Plan: 43
Win rate
now 04-2017 05-2017 06-2017 07-2017 08-2017 09-2017 02-2017 01-2017 12-2016 10-2017
This shows serious impact on the ‘Volume’ value driver in three months if no
serious action is taken
14 Dashboard of the future
Volume Price Realization
Acquire New
Customers
Marketing & Sales Product & Service
Innovation Account Management Cross-Sell / Up-Sell Retention
Retain and Grow
Current Customers
Years = 2017 | Months = Jan – Dec

© 2013 Deloitte The Netherlands
To gain additional understanding Manager X looks for details on the KPI
‘Funnel Health’. This shows the opportunities that are the cause of the issue
15 Dashboard of the future
• Step 1. By touching
the KPI ‘Funnel Health’
two graphs with more
details are displayed
• Step 2. By touching a
specific opportunity in
the graph on the right
more information
regarding this
opportunity is provided
below the graphs
Note: See Appendix for explanation of the menu options
1
2

© 2013 Deloitte The Netherlands
Based on a pre-populated list of contacts Manager X decides to collaborate
with the Account Manager to either accelerate or kill the deal
16 Dashboard of the future
Minimize
Screen share Email Chat
Jim Warner Function:
Account Manager
Tel:
Back
Subject:
Jim,
Sales funnel bandwidth is unacceptable.
Please choose
1) push the deal e.g. plan private meeting
with CEO hospital & me, or
2) kill the deal, too much effort is put in it
already
Manager X
Acme International
Actions
Minimize
Suggested Contacts for Opportunity
All Contacts
1
2

Event 3. Weekly management meeting

© 2013 Deloitte The Netherlands
During the weekly management meeting, the view option is used. Different
views with real time information are available
18 Dashboard of the future
1
2 3

© 2013 Deloitte The Netherlands
A heatmap shows the most important KPIs
19 Dashboard of the future

© 2013 Deloitte The Netherlands
The heatmap is easily customized by filtering on dimensions and
hierarchies...
20 Dashboard of the future
• Each column represents a
dimension.
• The grey scrollbar at the
bottom indicates that there
are additional
columns/dimensions
• Hierarchies are displayed
under each dimension
(vertically in the column): • At the top the currently
applicable hierarchies are
shown (multiple selections
are possible)
• At the bottom the other
hierarchies are shown
• The grey inverted triangle
at the bottom of a column
indicates that there are
additional hierarchies
Product Market Business Units Customers
Widgets
Gadgets
North America
Europe BU 1
BU 3
BU 4
BU 5
Filters Swipe through the dimensions and drag the values you want to filter on to the top i
Customer 1
Customer 2
Customer 3
Customer 4
Customer 5
Customer 6
1
BU 2
2
Asia
Australia

© 2013 Deloitte The Netherlands
...and actuals and plan versions
21 Dashboard of the future
• Base values (e.g. actuals)
are confronted with
comparison values (e.g.
AOP)
• At the top the currently
applicable values are shown
(only one selection is
possible). At the bottom the
other values are shown
• The grey scrollbar at the
bottom indicates that there
are additional values that can
be selected (e.g. benchmark)
Base values Comparison values
Actual
Forecast
Budget Budget
Latest View
Filters Drag the values you want to compare to the top i
1
Forecast
2
Active Filters: Widgets; North America; BU 2; 2017; Feb; Actual versus Forecast
C
Analyst Consensus
Latest View
Analyst Consensus
© 2013 Deloitte The Netherlands
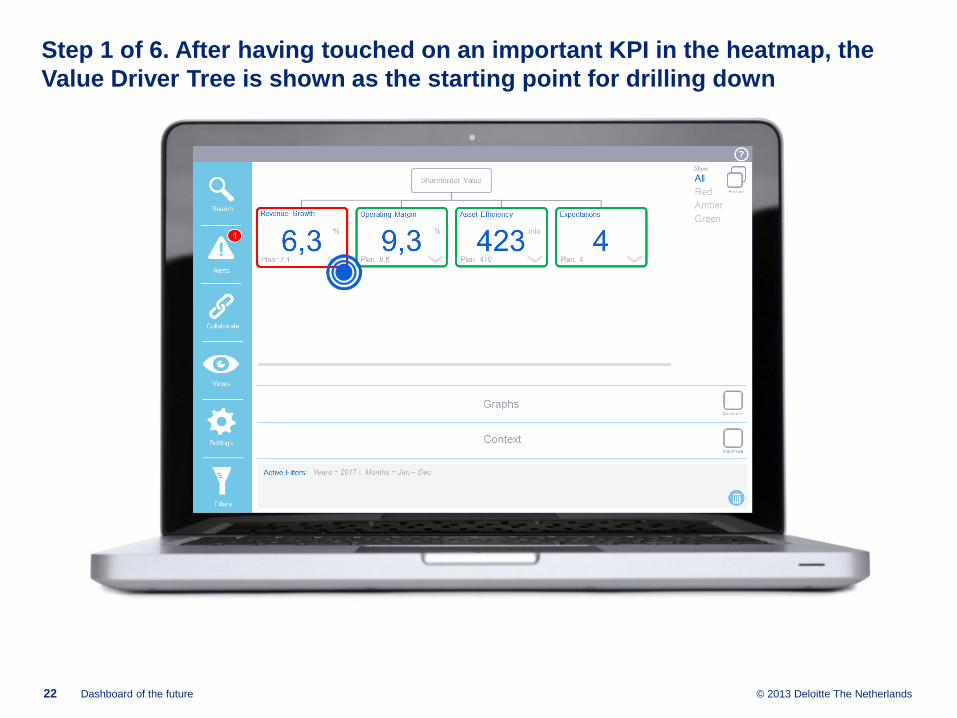
Step 1 of 6. After having touched on an important KPI in the heatmap, the
Value Driver Tree is shown as the starting point for drilling down
22 Dashboard of the future

© 2013 Deloitte The Netherlands
Step 2 of 6. Drill-down from ‘Revenue Growth’ to ‘Volume’
23 Dashboard of the future

© 2013 Deloitte The Netherlands
Step 3 of 6. Drill-down from ‘Volume’ to ‘Acquire New Customers’
24 Dashboard of the future

© 2013 Deloitte The Netherlands
Step 4 of 6. Drill-down from ‘Acquire New Customers’ to ‘Product & Service
Innovation’
25 Dashboard of the future
© 2013 Deloitte The Netherlands
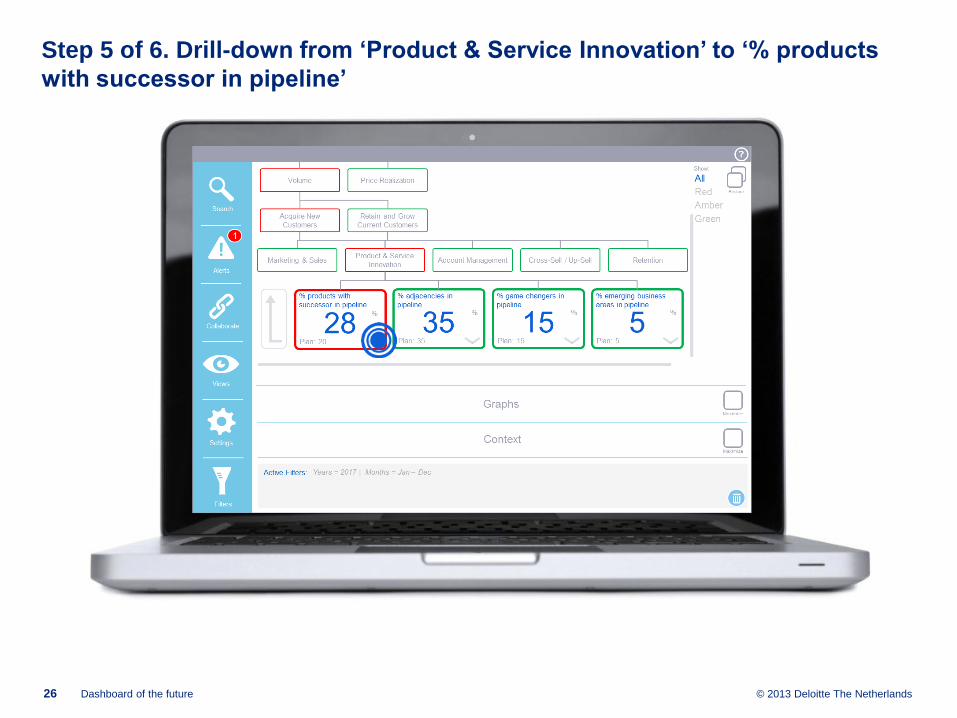
Step 5 of 6. Drill-down from ‘Product & Service Innovation’ to ‘% products
with successor in pipeline’
26 Dashboard of the future
© 2013 Deloitte The Netherlands
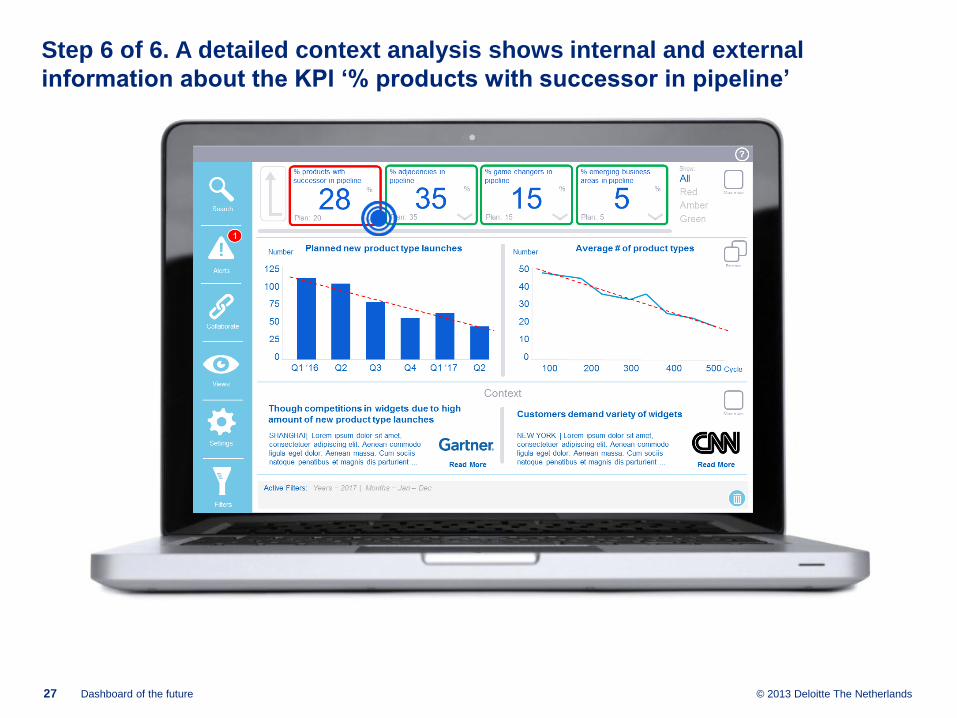
Step 6 of 6. A detailed context analysis shows internal and external
information about the KPI ‘% products with successor in pipeline’
27 Dashboard of the future
Event 4. Quarterly management meeting

© 2013 Deloitte The Netherlands
Manager X enters the company war room for the quarterly management
meeting with the management team in Asia
29 Dashboard of the future
Video Wall – New York
Shanghai office
© 2013 Deloitte The Netherlands
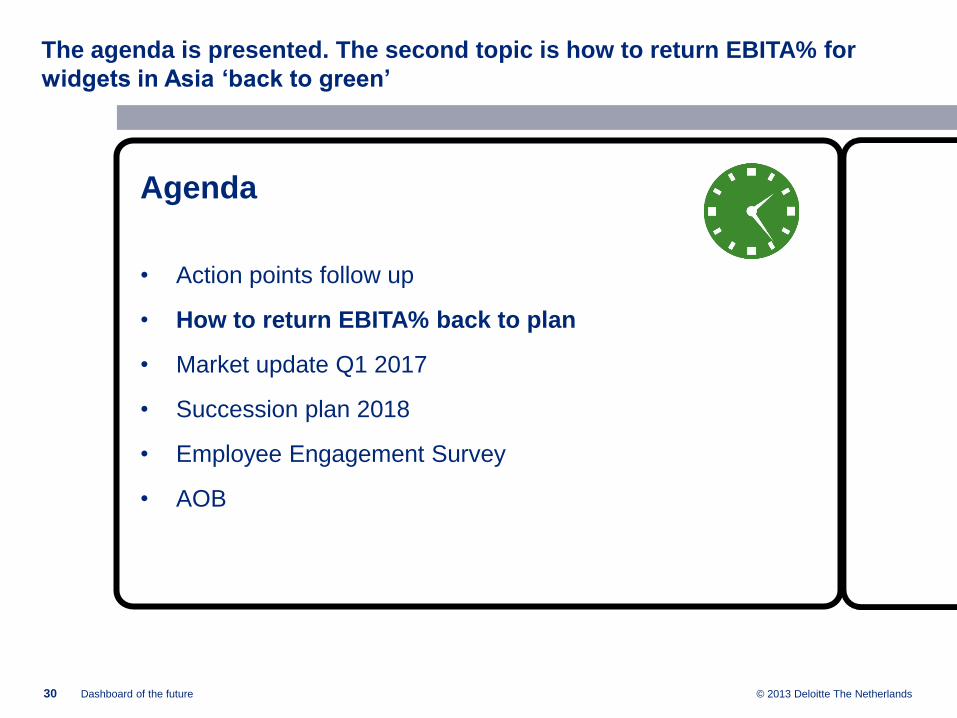
The agenda is presented. The second topic is how to return EBITA% for
widgets in Asia ‘back to green’
30 Dashboard of the future
Agenda
• Action points follow up
• How to return EBITA% back to plan
• Market update Q1 2017
• Succession plan 2018
• Employee Engagement Survey
• AOB
© 2013 Deloitte The Netherlands
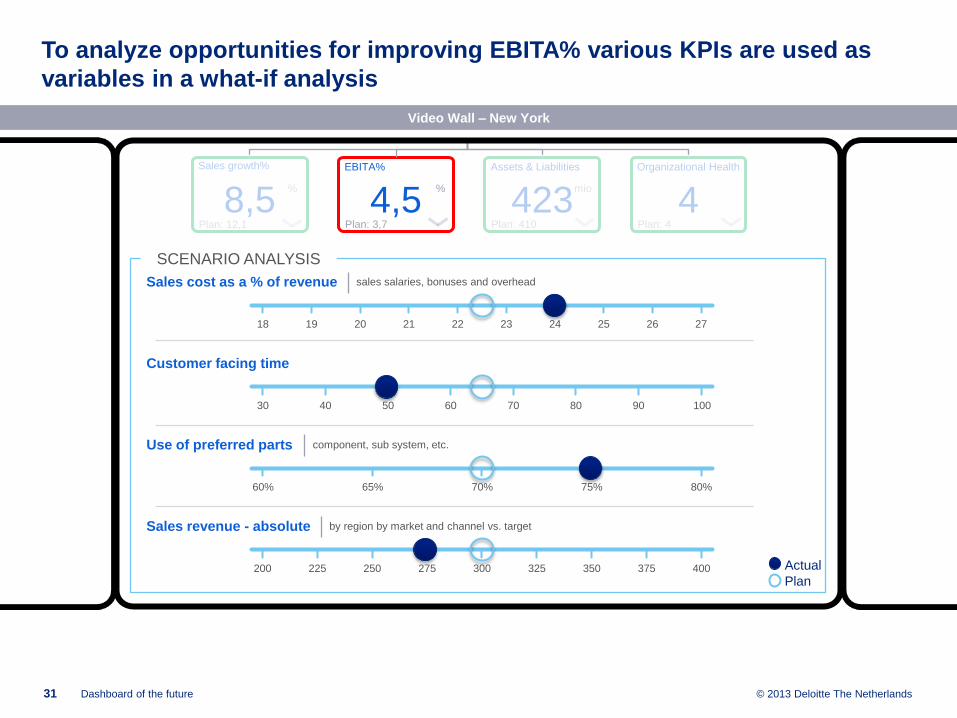
To analyze opportunities for improving EBITA% various KPIs are used as
variables in a what-if analysis
31 Dashboard of the future
Video Wall – New York
%
Sales growth%
Plan: 12,1
4,5 %
Plan: 3,7
EBITA%
423 mio
Plan: 410
Assets & Liabilities
4 Plan: 4
Organizational Health
SCENARIO ANALYSIS
Use of preferred parts component, sub system, etc.
60% 80% 65% 70% 75%
Sales revenue - absolute by region by market and channel vs. target
200 400 225 250 275 300 325 350 375
30 100 40 50 60 70 80 90
Customer facing time
Sales cost as a % of revenue sales salaries, bonuses and overhead
18 27 19 20 21 22 23 24 25 26
8,5
Actual
Plan
© 2013 Deloitte The Netherlands
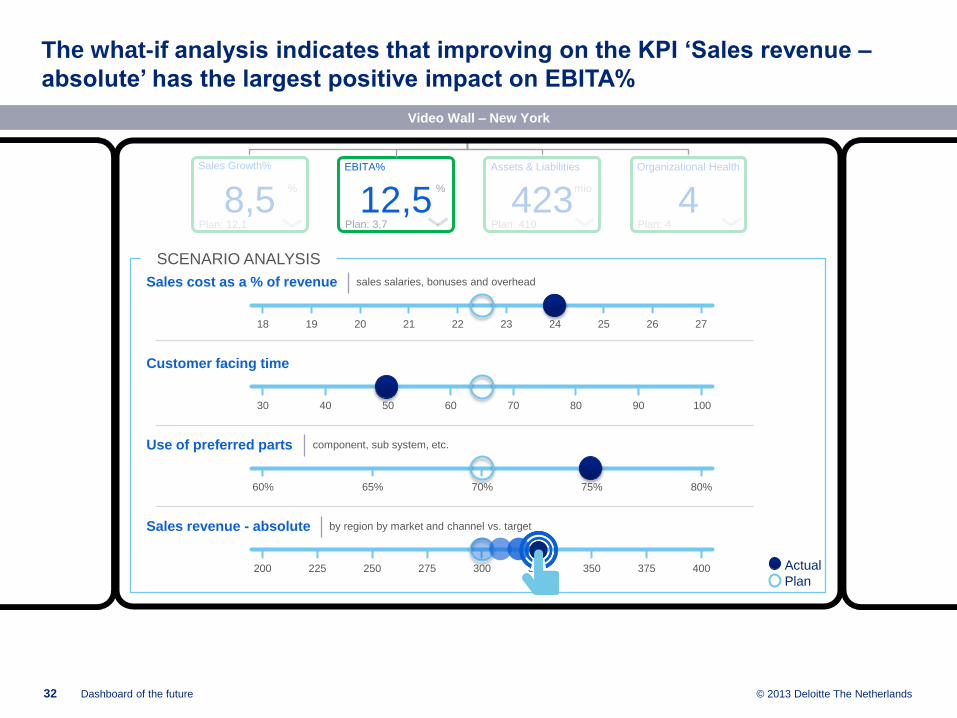
The what-if analysis indicates that improving on the KPI ‘Sales revenue –
absolute’ has the largest positive impact on EBITA%
32 Dashboard of the future
Video Wall – New York
8,5 %
Sales Growth%
Plan: 12,1
12,5 %
Plan: 3,7
EBITA%
SCENARIO ANALYSIS
Sales cost as a % of revenue sales salaries, bonuses and overhead
18 27 19 20 21 22 23 24 25 26
Use of preferred parts component, sub system, etc.
60% 80% 65% 70% 75%
Sales revenue - absolute by region by market and channel vs. target
200 400 225 250 275 300 325 350 375
30 100 40 50 60 70 80 90
Customer facing time
Actual
Plan
423 mio
Plan: 410
Assets & Liabilities
4 Plan: 4
Organizational Health

© 2013 Deloitte The Netherlands
Next Manager X discusses geographical expansion in Asia. Myanmar is
selected based on GDP growth
33 Dashboard of the future
Video Wall – New York
GDP Growth
15%
10 %
-5 %
0 %
2.5 %
5 %
© 2013 Deloitte The Netherlands
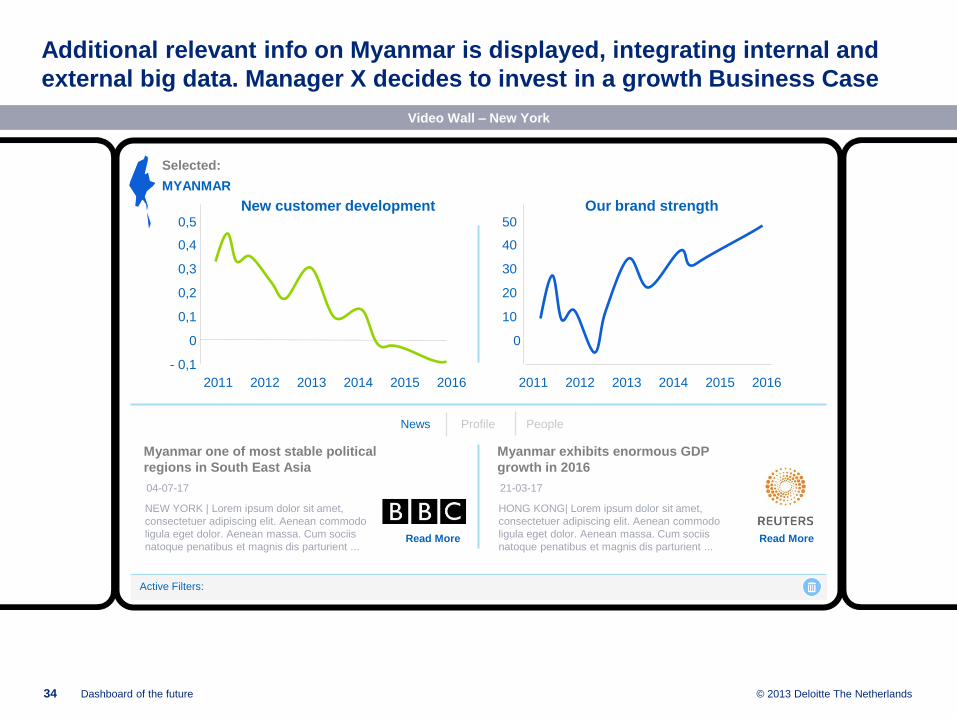
Additional relevant info on Myanmar is displayed, integrating internal and
external big data. Manager X decides to invest in a growth Business Case
34 Dashboard of the future
Video Wall – New York
New customer development
2011 2012 2013 2014 2015 2016
- 0,1
0,1
0,3
0,4
0
0,2
Active Filters:
0,5
MYANMAR
Selected:
News Profile People
Myanmar one of most stable political
regions in South East Asia
NEW YORK | Lorem ipsum dolor sit amet,
consectetuer adipiscing elit. Aenean commodo
ligula eget dolor. Aenean massa. Cum sociis
natoque penatibus et magnis dis parturient ... Read More
04-07-17
Myanmar exhibits enormous GDP
growth in 2016
HONG KONG| Lorem ipsum dolor sit amet,
consectetuer adipiscing elit. Aenean commodo
ligula eget dolor. Aenean massa. Cum sociis
natoque penatibus et magnis dis parturient ... Read More
21-03-17
10
30
40
0
20
50
Our brand strength
2011 2012 2013 2014 2015 2016

Encore. End of day
© 2013 Deloitte The Netherlands
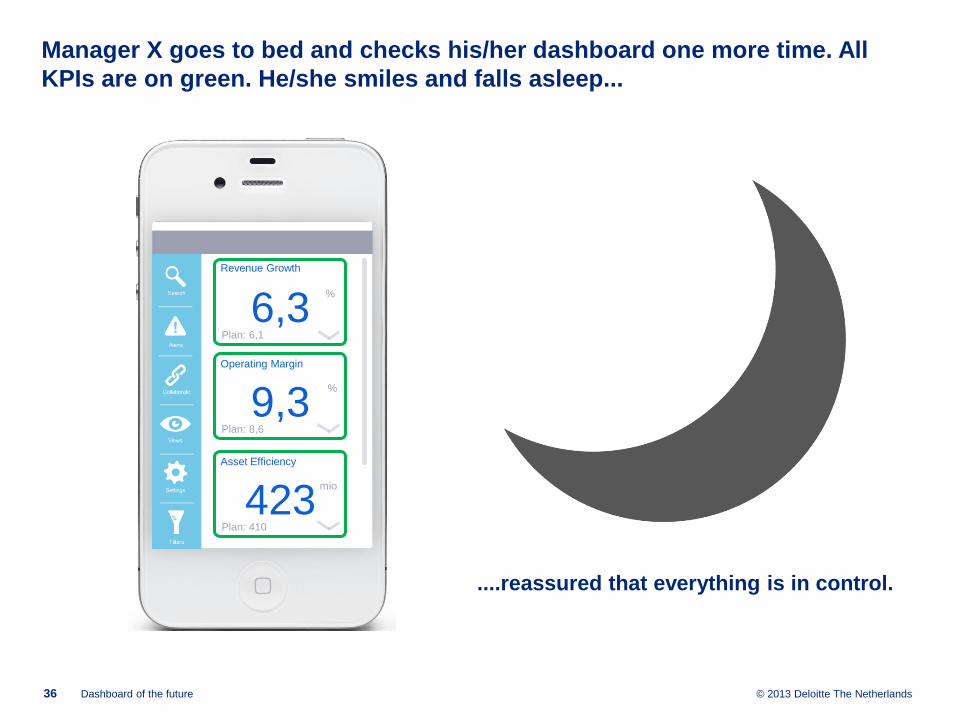
Manager X goes to bed and checks his/her dashboard one more time. All
KPIs are on green. He/she smiles and falls asleep...
36 Dashboard of the future
....reassured that everything is in control.
6,3 %
Revenue Growth
Plan: 6,1
9,3 %
Plan: 8,6
Operating Margin
423 mio
Plan: 410
Asset Efficiency

© 2013 Deloitte The Netherlands
Deloitte refers to one or more of Deloitte Touche Tohmatsu Limited, a UK private company limited by guarantee, and its network of member firms,
each of which is a legally separate and independent entity. Please see www.deloitte.nl/about for a detailed description of the legal structure of
Deloitte Touche Tohmatsu Limited and its member firms.
Deloitte provides audit, tax, consulting, and financial advisory services to public and private clients spanning multiple industries. With a globally
connected network of member firms in more than 150 countries, Deloitte brings world-class capabilities and high-quality service to clients,
delivering the insights they need to address their most complex business challenges. Deloitte has in the region of 200,000 professionals, all
committed to becoming the standard of excellence.
This communication contains general information only, and none of Deloitte Touche Tohmatsu Limited, its member firms, or their related entities
(collectively, the “Deloitte Network”) is, by means of this publication, rendering professional advice or services. Before making any decision or
taking any action that may affect your finances or your business, you should consult a qualified professional adviser. No entity in the Deloitte
Network shall be responsible for any loss whatsoever sustained by any person who relies on this communication .


