66
B1X1-0106-03ENZ0(00) February 2014 Windows/Linux FUJITSU Software Interstage Business Process Manager Analytics V12.2 Dashboard / Output Guide
B1X1-0106-03ENZ0(00)February 2014
Windows/Linux
FUJITSU SoftwareInterstage Business Process Manager Analytics V12.2
Dashboard / Output Guide

About this ManualThis section explains summary, chapter overview, abbreviations, and provides useful information.
The contents in this section are as follows:
- Purpose
- Intended Audience
- Chapter Overview
- Typographical Conventions
- Reference Materials
- Abbreviations
- Export Regulations
- Trademarks
- Requests
- Copyright
Purpose
This document describes how to use the Dashboard to display Analytical data.
Intended Audience
This manual is intended for use bysystem administrators.. It assumes that the reader has a working knowledge of the following topics:
- Web Browser operation
Chapter Overview
Chapter Title Description
1 Analytics Dashboard Overview Summary of Interstage BPM Analytics presentation capabilities.
2 Analytics Dashboard Prerequisites Explains how to start Dashboard.
3 Operating the Analytics Dashboard Explains how to operating Dashboard.
4 Other Functions Explains other functions.
Typographical Conventions
The following conventions are used throughout this manual:
Example Meaning
command Text, which you are required to type at a command line, isidentified by Courier font.
screen text Text, which is visible in the user interface, is bold.
Reference Reference material is in italics.
Parameter A command parameter is identified by Courier font.
Reference Materials
The following reference materials for this software are also available:
- i -
Release Notes
Contains an overview of the Analytics software and late-breaking information that could not be included in the manuals
Overview
Describes the architecture and features of the Analytics software
Installation Guide
Explains how to install the software.
Administration Guide
Covers administration tools and tips, message references, and troubleshooting
Analytics Studio Guide
Explains how to use the Analytics Studio to configure parameters that enforce Analytics features
Management Console Guide
Explains how to use the Management Console and Management Commands to configure key parameters, such as how to start/stop the Analytics software service or how to display the software status
Process Discovery Guide
Explains how to use Process Discovery that generates process diagrams using historical data
Migration Guide
Explains how to migrate from previous version of the product
Handbook for the Process Discovery
Explains how to operate the Process Discovery briefly
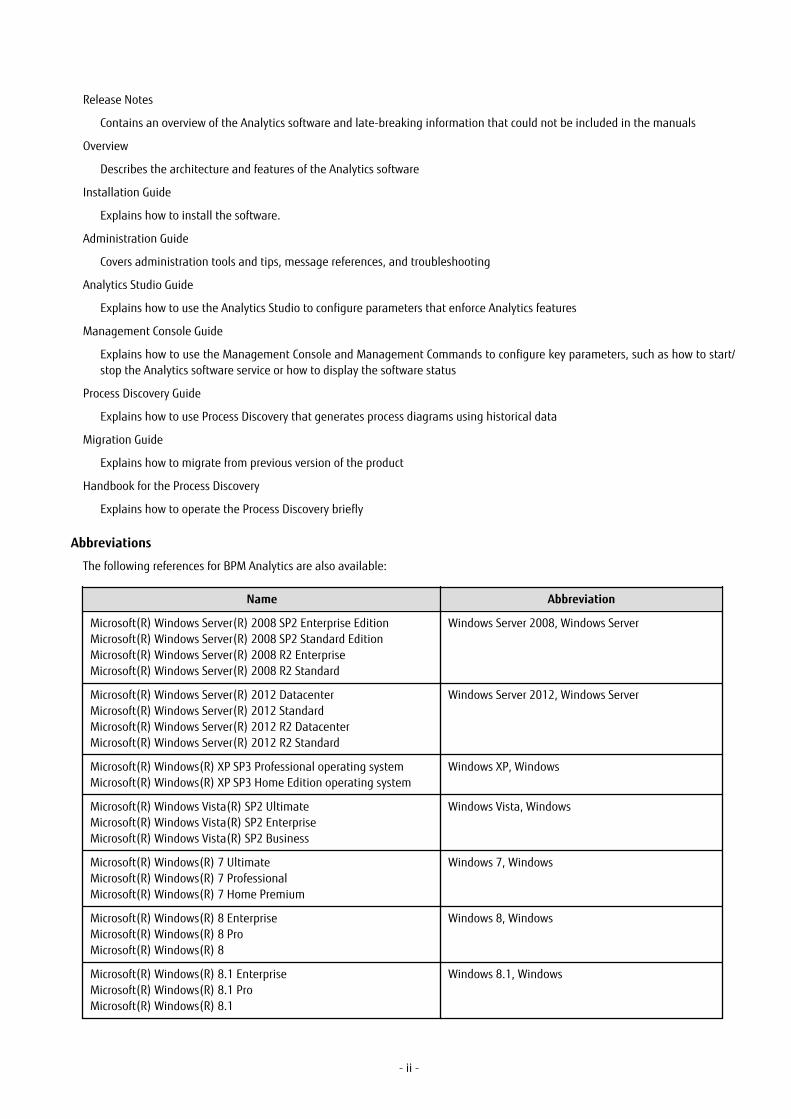
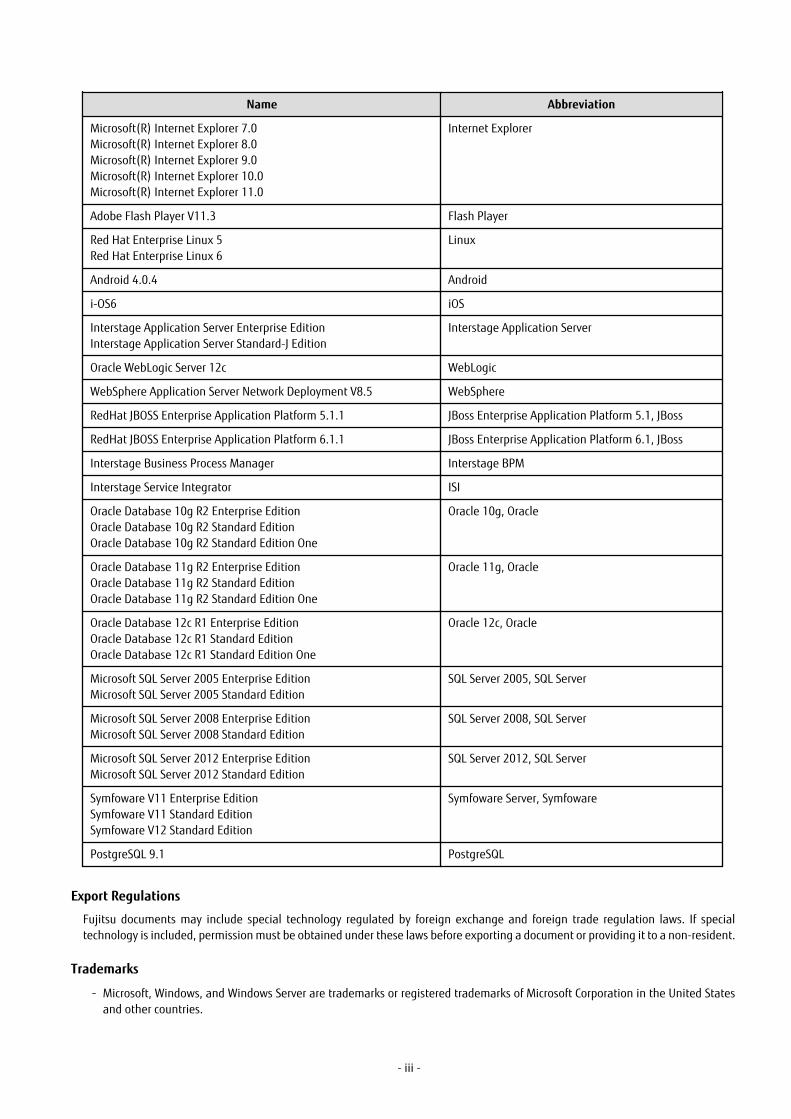
Abbreviations
The following references for BPM Analytics are also available:
Name Abbreviation
Microsoft(R) Windows Server(R) 2008 SP2 Enterprise EditionMicrosoft(R) Windows Server(R) 2008 SP2 Standard EditionMicrosoft(R) Windows Server(R) 2008 R2 EnterpriseMicrosoft(R) Windows Server(R) 2008 R2 Standard
Windows Server 2008, Windows Server
Microsoft(R) Windows Server(R) 2012 DatacenterMicrosoft(R) Windows Server(R) 2012 StandardMicrosoft(R) Windows Server(R) 2012 R2 DatacenterMicrosoft(R) Windows Server(R) 2012 R2 Standard
Windows Server 2012, Windows Server
Microsoft(R) Windows(R) XP SP3 Professional operating systemMicrosoft(R) Windows(R) XP SP3 Home Edition operating system
Windows XP, Windows
Microsoft(R) Windows Vista(R) SP2 UltimateMicrosoft(R) Windows Vista(R) SP2 EnterpriseMicrosoft(R) Windows Vista(R) SP2 Business
Windows Vista, Windows
Microsoft(R) Windows(R) 7 UltimateMicrosoft(R) Windows(R) 7 ProfessionalMicrosoft(R) Windows(R) 7 Home Premium
Windows 7, Windows
Microsoft(R) Windows(R) 8 EnterpriseMicrosoft(R) Windows(R) 8 ProMicrosoft(R) Windows(R) 8
Windows 8, Windows
Microsoft(R) Windows(R) 8.1 EnterpriseMicrosoft(R) Windows(R) 8.1 ProMicrosoft(R) Windows(R) 8.1
Windows 8.1, Windows
- ii -
Name Abbreviation
Microsoft(R) Internet Explorer 7.0Microsoft(R) Internet Explorer 8.0Microsoft(R) Internet Explorer 9.0Microsoft(R) Internet Explorer 10.0Microsoft(R) Internet Explorer 11.0
Internet Explorer
Adobe Flash Player V11.3 Flash Player
Red Hat Enterprise Linux 5Red Hat Enterprise Linux 6
Linux
Android 4.0.4 Android
i-OS6 iOS
Interstage Application Server Enterprise EditionInterstage Application Server Standard-J Edition
Interstage Application Server
Oracle WebLogic Server 12c WebLogic
WebSphere Application Server Network Deployment V8.5 WebSphere
RedHat JBOSS Enterprise Application Platform 5.1.1 JBoss Enterprise Application Platform 5.1, JBoss
RedHat JBOSS Enterprise Application Platform 6.1.1 JBoss Enterprise Application Platform 6.1, JBoss
Interstage Business Process Manager Interstage BPM
Interstage Service Integrator ISI
Oracle Database 10g R2 Enterprise EditionOracle Database 10g R2 Standard EditionOracle Database 10g R2 Standard Edition One
Oracle 10g, Oracle
Oracle Database 11g R2 Enterprise EditionOracle Database 11g R2 Standard EditionOracle Database 11g R2 Standard Edition One
Oracle 11g, Oracle
Oracle Database 12c R1 Enterprise EditionOracle Database 12c R1 Standard EditionOracle Database 12c R1 Standard Edition One
Oracle 12c, Oracle
Microsoft SQL Server 2005 Enterprise EditionMicrosoft SQL Server 2005 Standard Edition
SQL Server 2005, SQL Server
Microsoft SQL Server 2008 Enterprise EditionMicrosoft SQL Server 2008 Standard Edition
SQL Server 2008, SQL Server
Microsoft SQL Server 2012 Enterprise EditionMicrosoft SQL Server 2012 Standard Edition
SQL Server 2012, SQL Server
Symfoware V11 Enterprise EditionSymfoware V11 Standard EditionSymfoware V12 Standard Edition
Symfoware Server, Symfoware
PostgreSQL 9.1 PostgreSQL
Export Regulations
Fujitsu documents may include special technology regulated by foreign exchange and foreign trade regulation laws. If specialtechnology is included, permission must be obtained under these laws before exporting a document or providing it to a non-resident.
Trademarks
- Microsoft, Windows, and Windows Server are trademarks or registered trademarks of Microsoft Corporation in the United Statesand other countries.
- iii -

- Oracle and Java are registered trademarks of Oracle and/or affiliates. Other names may be trademarks of their respective owners.
- Linux is a registered trademark or trademark of Linus Torvalds in the United States and other countries.
- Red Hat is a trademark or registered trademark of Red Hat Inc. in the United States and other countries.
- SQL Server is a Microsoft Corporation (USA) product.
- All other company and product names referred to in this document are general trademarks or registered trademarks of theirrespective owners.
Requests
- This document may be revised without notice.
- Do not pass on this document to other parties without permission.
- Our company bears no responsibility for third-party infringements of patent or other rights arising out of use of the data containedin this document.
Copyright
Copyright 2014 FUJITSU LIMITED
February 2014 First Edition
- iv -
ContentsChapter 1 Analytics Dashboard Overview.............................................................................................................................................1
Chapter 2 Analytics Dashboard Prerequisites...................................................................................................................................... 22.1 Preparing Dashboard.................................................................................................................................................................22.2 Accessing Analytics Dashboard.................................................................................................................................................. 2
Chapter 3 Operating the Analytics Dashboard for PC........................................................................................................................... 43.1 Overview....................................................................................................................................................................................4
3.1.1 User Preferences................................................................................................................................................................. 63.2 Operations in the Overview........................................................................................................................................................73.3 Operations in the Alert View.................................................................................................................................................... 10
3.3.1 Alert List Display............................................................................................................................................................... 103.3.2 Drilled-down display......................................................................................................................................................... 13
3.4 Operations in the Search View................................................................................................................................................. 153.4.1 Alert search.......................................................................................................................................................................153.4.2 Comment search............................................................................................................................................................... 163.4.3 Process search...................................................................................................................................................................17
3.5 Operations in the Business Reports View................................................................................................................................. 223.5.1 Layout...............................................................................................................................................................................223.5.2 Charts................................................................................................................................................................................233.5.3 Alert list............................................................................................................................................................................ 323.5.4 External URL..................................................................................................................................................................... 32
3.6 Operations in the Process Performance View........................................................................................................................... 323.6.1 Process Performance.........................................................................................................................................................353.6.2 Process Analysis Details.................................................................................................................................................... 363.6.3 Activity analysis................................................................................................................................................................ 373.6.4 Activity Analysis Details.................................................................................................................................................... 38
Chapter 4 Operating the Analytics Dashboard for Smart devices....................................................................................................... 394.1 Overview..................................................................................................................................................................................39
4.1.1 Display.............................................................................................................................................................................. 394.1.1.1 Global header.............................................................................................................................................................394.1.1.2 Slide menu................................................................................................................................................................. 394.1.1.3 Navigation tree.......................................................................................................................................................... 40
4.2 Operations in the Overview......................................................................................................................................................414.3 Operations in the Alert View.................................................................................................................................................... 43
4.3.1 Alert List Display............................................................................................................................................................... 434.3.2 Drilled-down display......................................................................................................................................................... 46
4.4 Operations in the Business Reports View................................................................................................................................. 494.4.1 Layout...............................................................................................................................................................................494.4.2 Charts................................................................................................................................................................................51
Chapter 5 Other Functions................................................................................................................................................................. 555.1 Direct Display...........................................................................................................................................................................55
5.1.1 Relationship to the Dashboard Group............................................................................................................................... 555.1.2 External Filtering.............................................................................................................................................................. 55
5.2 Label Substitution................................................................................................................................................................... 565.2.1 Creating label substitution definition............................................................................................................................... 565.2.2 Mapping Attribute and a label substitution definition...................................................................................................... 575.2.3 Enable label substitution in Dashboard group definition..................................................................................................575.2.4 Enable label substitution in Report definition.................................................................................................................. 57
- v -

Appendix A Appendix........................................................................................................................................................................ 58A.1 Calculation of the Values in the Performance View..................................................................................................................58
A.1.1 Lead time......................................................................................................................................................................... 58A.1.2 Wait Time......................................................................................................................................................................... 58A.1.3 Work time......................................................................................................................................................................... 59
- vi -

Chapter 1 Analytics Dashboard OverviewThis section provides an overview of the Interstage Business Process Manager Analytics (BPMA) Dashboard.
As shown above, there are functionalities like Business Dashboard, E-Mail Notification, Launch Services and Export Analytical dataas front service. This document explains about presentation of Dashboard.
Analytics Dashboard
Analytics Dashboard is an important feature of BPMA. It presents analysis information in a user-friendly manner. Analytics Dashboardcan display charts, graphs, key performance indicators (KPIs), process diagrams, and data tables.
Analytics Dashboard is a flexible browser-based interface that can be configured to suit individual user requirements.
Other Output Options
Other output options perform event-triggered actions, such as sending notifications by e-mail and starting other applications anddata output in a range of formats.
- 1 -
Chapter 2 Analytics Dashboard PrerequisitesBefore using Dashboard, environment setting is required. These setting can be done on Management Console and Analytics Studio.
2.1 Preparing DashboardThis section describes those tasks, namely:
- Configuring the authentication method
- Creating user accounts and granting permissions
- Creating Analytics Dashboard profiles and Dashboard groups
This section also describes how to access Analytics Dashboard.
Configuring the Authentication Method
In Management Console, set the authentication method for using Analytics Dashboard.
Refer to the Interstage Business Process Manager Analytics Management Console Guide for details.
Creating user accounts and granting permissions
Create user accounts and grant permissions in the Management Console. Granting of permissions allows access to the various featuresavailable in Analytics Dashboard.
Refer to the Interstage Business Process Manager Analytics Management Console Guide for details.
Creating Analytics Dashboard Profiles and Dashboard Groups
To use Dashboard functionalities, creating Dashboard Profile and Dashboard Group in Analytics Studio is required.
In Dashboard Profile, define contents to be displayed in Dashboard.
Then map the relation between Dashboard Profile and user account during Dashboard Group creation. User can be assigned to multipleDashboard Group.
Refer to the Interstage Business Process Manager Analytics Studio Guide for details.
Note
In case user is assigned to multiple Dashboard Group and each of the parameters of Dashboard Group is different, Dashboard behavesbased on following rules:
- When one of the parameters of all groups is enabled, the parameter of all groups is enabled.
- Dashboard Menu Settings
- Permissions
- When one of the parameters of all groups is disabled, the parameter of all groups is disabled.
- Allow label substitution
- No influence
- User(s)
- Dashboard Profile(s)
2.2 Accessing Analytics DashboardAnalytics Dashboard is accessed by using a Web browser.
- 2 -

For PC:
http://server:port/ibpmm/dashboard/Welcome
For Smart devices:
http://server:port/ibpmm/mobile/Welcome
In the above URL, server is the host name or IP address of the Analytics Server and port is the port number used by the Web server.The default port number for the built-in application server is 40330. For other application servers, confirm and specify their respectiveport number. If omitted, the default value of 80 is used.
On the BPMA login page, specify your user ID, password, and click Log In. Note that you will not be able to log into the AnalyticsDashboard if your user ID does not have the required permissions for accessing the application.
Note
Adobe Flash Player is required for displaying Analytics Dashboard for PC.
- 3 -
Chapter 3 Operating the Analytics Dashboard for PCThis chapter describes the operation of the Interstage Business Process Manager Analytics (BPMA) Dashboard for PC.
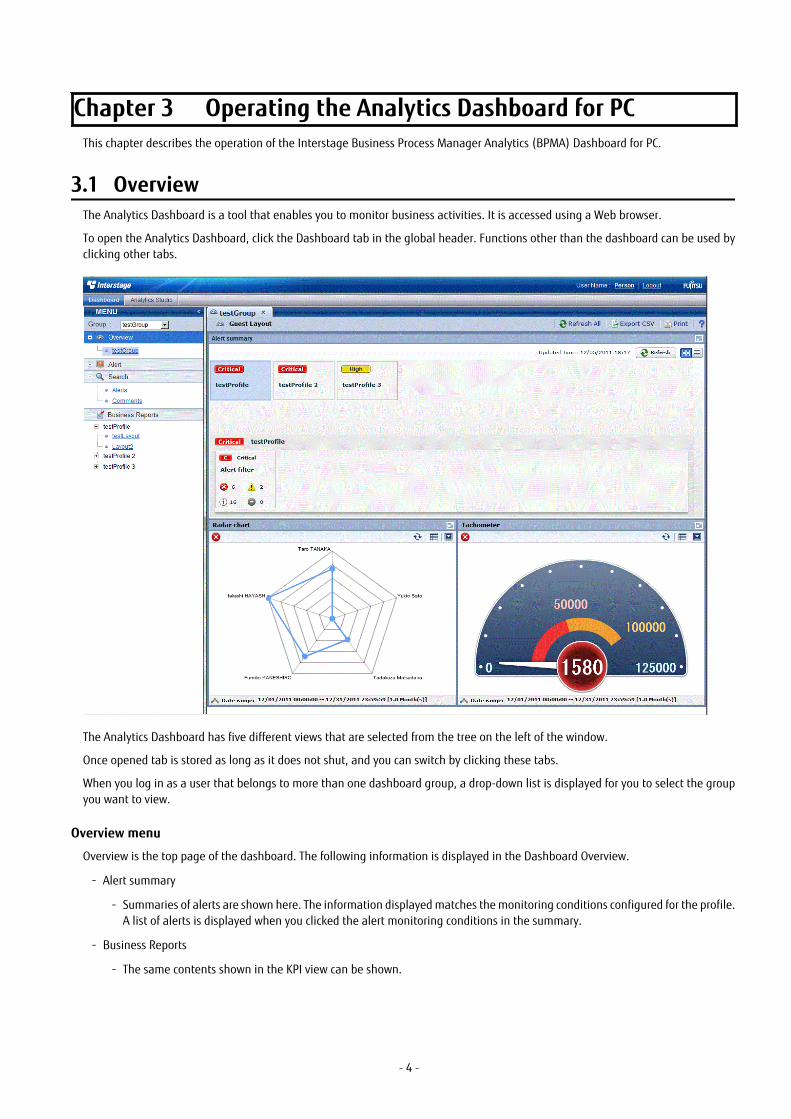
3.1 OverviewThe Analytics Dashboard is a tool that enables you to monitor business activities. It is accessed using a Web browser.
To open the Analytics Dashboard, click the Dashboard tab in the global header. Functions other than the dashboard can be used byclicking other tabs.
The Analytics Dashboard has five different views that are selected from the tree on the left of the window.
Once opened tab is stored as long as it does not shut, and you can switch by clicking these tabs.
When you log in as a user that belongs to more than one dashboard group, a drop-down list is displayed for you to select the groupyou want to view.
Overview menu
Overview is the top page of the dashboard. The following information is displayed in the Dashboard Overview.
- Alert summary
- Summaries of alerts are shown here. The information displayed matches the monitoring conditions configured for the profile.A list of alerts is displayed when you clicked the alert monitoring conditions in the summary.
- Business Reports
- The same contents shown in the KPI view can be shown.
- 4 -
Alert view menu
The following features are available in Alert menu:
- Display Alerts
Displays list of the alerts detected.
- Alert details and escalation results
Details about the alerts selected in the list of alerts are shown here. The results of escalation are also shown if applicable.
- Alert list display and possible actions
Alerts matching the monitoring conditions are shown in a list. There are a number of actions that can be taken.
- Related URL display
This shows URLs configured beforehand in Interstage Business Process Manager Analytics (BPMA) Studio. By jumping to theselinks from the list of alerts, related operations can be accessed. Alert values can be embedded in the URL links.
- Related KPI display
This shows charts and layouts as alert-related information configured beforehand in Analytics Studio.
- Display history of comment
The comment that has been provided before can be displayed by the time series for the action of the alert.
Search menu
The following features are available in Search menu:
- Alert search
Search for alerts with specified conditions.
- Comment search
Search in the content of the comments attached to alerts, charts, and processes.
- Process search
Search for a process instance based on specific criteria such as alert status in case of BPM integration.
Business Reports menu
The following features are available in Business Reports menu:
- Chart display
This displays a chart showing business activities in real-time. Icons are displayed on events if alerts have occurred in an event.
- Drill Down
Detailed information can be displayed about charts that have been set up in Analytics Studio.
- Output to CSV
Allows output of the current chart to a comma-separated value (CSV) file.
- History display
Shows charts for the periods specified by the slider.
- Alert list display
Alerts matching the monitoring conditions are shown in a list.
- External URL display
This shows Web pages configured beforehand in Analytics Studio.
- 5 -

Process Performance menu
The following features are available in Process Performance menu:
- Performance display of the most recent status of the process
Displays performance trends for the process currently being monitored. Indicators such as lead-time and delays are used.
- Process trend analysis display
Displays performance trends for processes started in a specified period.
Note
The process search part of the Search menu and the Process Performance menu are only available from integrated Interstage BPMConsole. Please refer to "Installation guide" for the cooperation method with Interstage BPM.
3.1.1 User PreferencesThis section explains the operations about user preferences setting which is displayed in the global header. User Preference screenis displayed when click the User Name or User ID area on the global header.
You can update user preferences from this screen and specified parameters are activated when you click [Apply] button in the eachtab.
Descriptions of the features:
Tab name Feature name Description
Permission Permission Displays the user permission about Login user.
- 6 -
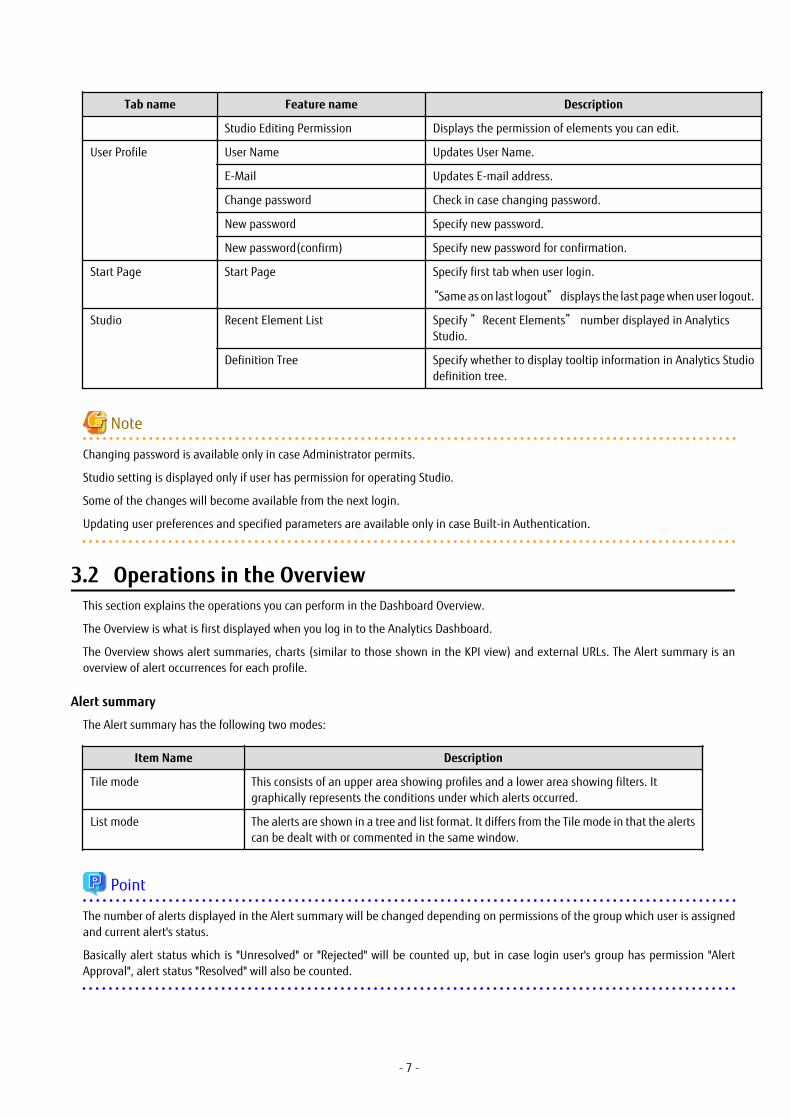
Tab name Feature name Description
Studio Editing Permission Displays the permission of elements you can edit.
User Profile User Name Updates User Name.
E-Mail Updates E-mail address.
Change password Check in case changing password.
New password Specify new password.
New password(confirm) Specify new password for confirmation.
Start Page Start Page Specify first tab when user login.
“Same as on last logout” displays the last page when user logout.
Studio Recent Element List Specify ”Recent Elements” number displayed in AnalyticsStudio.
Definition Tree Specify whether to display tooltip information in Analytics Studiodefinition tree.
Note
Changing password is available only in case Administrator permits.
Studio setting is displayed only if user has permission for operating Studio.
Some of the changes will become available from the next login.
Updating user preferences and specified parameters are available only in case Built-in Authentication.
3.2 Operations in the OverviewThis section explains the operations you can perform in the Dashboard Overview.
The Overview is what is first displayed when you log in to the Analytics Dashboard.
The Overview shows alert summaries, charts (similar to those shown in the KPI view) and external URLs. The Alert summary is anoverview of alert occurrences for each profile.
Alert summary
The Alert summary has the following two modes:
Item Name Description
Tile mode This consists of an upper area showing profiles and a lower area showing filters. Itgraphically represents the conditions under which alerts occurred.
List mode The alerts are shown in a tree and list format. It differs from the Tile mode in that the alertscan be dealt with or commented in the same window.
Point
The number of alerts displayed in the Alert summary will be changed depending on permissions of the group which user is assignedand current alert's status.
Basically alert status which is "Unresolved" or "Rejected" will be counted up, but in case login user's group has permission "AlertApproval", alert status "Resolved" will also be counted.
- 7 -

Alert summary toolbar
Descriptions of the features:
Feature name Description
Refresh Updates the content of the Alert summary.
Change view mode Switches the display mode. The mode chosen here is also shown whenever you return to thiswindow after closing it or logging out.
Tile mode
The features available in the Tile mode are as follows.
- Upper area
The panel shows signals that indicate the status of filters within profiles.
Signals show three status levels, depending on thresholds.
-
-
-
Refer to “Analytics Studio Guide” for information about setting thresholds.
- 8 -

- Lower area
The lower area shows the alert status panel for filters belonging to the profiles selected in the panel.
As with the filter panel, signals show the status in three levels.
-
-
-
To open an alert view in a separate tab, click on the filter panel.
List mode
The features available in the List mode are as follows.
- The tree format shows the following three levels.
- Level 1: Profiles
- Level 2: Filters
- Level 3: Alerts
The first and second levels show the same signals as the Tile mode.
- To display the signal and title of the filter clicked in the upper section, click on the level 2 filter.
- The following operations are available with level 3 alerts:
Feature name Description
Details A new tab opens that has details about the selected alert.
Handle An action/comment dialog is displayed. Actions relating to alerts can be checked or executedand comments can be checked or added.
- 9 -

3.3 Operations in the Alert ViewThis section explains the operations you can perform in the Alert view.
3.3.1 Alert List DisplayTo display information about an alert, click listed name in the alert tree in the pane on the left of the Dashboard.
In case there are number of alerts which cannot be displayed in a list, message "Could not show all alerts." will be shown.
Handling alert status
The displayed alert list can be filtered according to the alert status by using the Filtering list located at the top of the alert list. Youcan select multiple alerts and process them collectively.
After filtering, if Reset is selected in the Filtering list, the display will revert to its previous state.
Alert toolbar
The following items are available on the Alert toolbar: Item name Description
Refresh Updates the content of the Alert list.
- 10 -
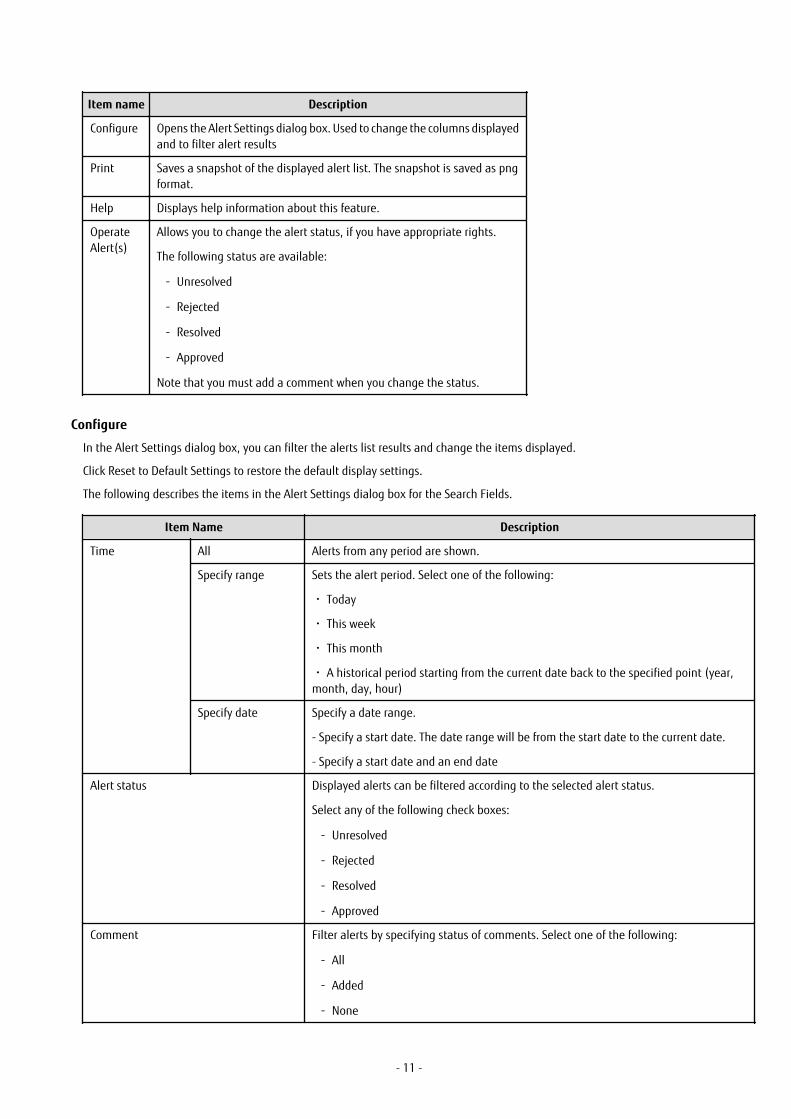
Item name Description
Configure Opens the Alert Settings dialog box. Used to change the columns displayedand to filter alert results
Print Saves a snapshot of the displayed alert list. The snapshot is saved as pngformat.
Help Displays help information about this feature.
OperateAlert(s)
Allows you to change the alert status, if you have appropriate rights.
The following status are available:
- Unresolved
- Rejected
- Resolved
- Approved
Note that you must add a comment when you change the status.
Configure
In the Alert Settings dialog box, you can filter the alerts list results and change the items displayed.
Click Reset to Default Settings to restore the default display settings.
The following describes the items in the Alert Settings dialog box for the Search Fields.
Item Name Description
Time All Alerts from any period are shown.
Specify range Sets the alert period. Select one of the following:
・ Today
・ This week
・ This month
・ A historical period starting from the current date back to the specified point (year,month, day, hour)
Specify date Specify a date range.
- Specify a start date. The date range will be from the start date to the current date.
- Specify a start date and an end date
Alert status Displayed alerts can be filtered according to the selected alert status.
Select any of the following check boxes:
- Unresolved
- Rejected
- Resolved
- Approved
Comment Filter alerts by specifying status of comments. Select one of the following:
- All
- Added
- None
- 11 -

Item Name Description
Message Filter by Message.
Alert type Filter by Alert type.
Target Events Filter by event.
Displays events with alerts that are included in the alert filter set in the profile definition.
Alert Name Filter by Alert Name.
Displays alerts that are included in the alert filter set in the profile definition.
Alert level Filter by alert level.
The following describes the items in the Alert Settings dialog box for the Custom Columns.
Item Name Description
Auto Refresh Specify the alert list refresh frequency. Specify '0' if the window is not to be refreshed.
Number of results Specify the maximum number of items to be displayed at a time.
Select 10、50、100、300、500
Custom Columns Specify the columns to be displayed in the alert list.
The following describes the items in the Alert Settings dialog box for the Personal Filter.
This option will be shown when the Personal Filter was enabled.
Item Name Description
Filtering Rule Showing how to combine if multiple conditions were set.
- AND
Show data which matches all condition.
- OR
Show data which matches any one of condition.
Filtering Condition List of filter conditions of this alert.
If user has permissions to remove conditions, the condition's checkbox can be controlled.If the checkbox was unchecked and applied the changes, those conditions will betemporarily removed.
Operate Alert(s)
Take the following points into consideration for processing alerts using Operate Alert(s).
- After rectifying the problems associated with an alert, set its status as Resolved.
- If there are no problems with a resolved alert, set its status as Approved.
- If there is a problem with a resolved or approved alert, set its status as Rejected.
- Comments can be added to alerts.
- Only the person who added the comment can cancel the added. As for the canceled comment, the cancellation line is added.
To change alert status, select the check box next to the alert and click Operate Alert(s) or double click the Status or Commentfield. Note that the dialog box that is displayed is different depending on the current status of the selected alert.
- If you selected one alert:
The processing details of alert operations and the comment history is displayed. Comments that have been added can also bedeleted.
- 12 -

When a process is executed, its details are recorded in the history and the next process can be executed.
- If multiple alerts are selected:
The comment history is not displayed.
When processes are executed, the execution results message is displayed.
In the Operate Alert(s) dialog box, type a comment and click the displayed status button to change the alert status.
Note, by selecting the Can resolve Alerts and Can approve Alerts check boxes for a dashboard group definition in the Analytics Studio,you can control who can process alerts using the Analytics Dashboard.
For details, refer to "Editing Dashboard Groups" in Chapter 3, "Using the Analytics Studio" of the Interstage Business Process ManagerAnalytics Studio Guide.
3.3.2 Drilled-down displayTo show detailed information about an alert, click the alert in the alert list. This will show a panel with details in the lower part of thewindow.
Details tab
In "Details" tab, detail parameters such as alert dates, parameter which causes the alert, or related URL are displayed.
Panel size can be changed by dragging the tabs.
The following describes the items in the Details tab.
- 13 -

Item Name Description
Event attribute Date and time of the event Displays the time and date the event occurred.
Event Attribute Name(UDA)
Displays the attribute value of the target event when the alert occurred. The UDAis shown if the alert is related to a process.
Alert attribute Type Displays the alert type.
Status Displays the alert status.
Date Displays the time and date the alert occurred.
Alert level Displays the alert level.
Message Displays the alert message.
Event Group Displays the name of the event group to which the event where the alert happenedbelongs.
Chart tab
The Chart tab shows preset charts and layouts.
A vertical red line appears in time line charts to indicate the date when an alert occurred.
Process tab
The Process tab shows business process diagrams.
This tab is displayed if the alert is related to business processes.
Comment history tab
The comment provided when dealing with the alert can sequentially be displayed from the new one by the time series in the historytab of the comment.
The history of the latest comment can be displayed by pushing the update button.
- 14 -

Result of Actions tab
The Result of Actions tab shows the results of escalation.
You can execute the action again by specifying Action ID in case the result was failure. Refer to "Management Console Guide" for moredetails.
3.4 Operations in the Search ViewThis section explains the operations you can perform in the Search view.
3.4.1 Alert searchSearch for alerts that match specified conditions.
To display details for an alert, click on the alert in the list of results.
The results screen is similar to the Alert view. Click the link at the top of the list of alerts to return to the Search view.
- 15 -
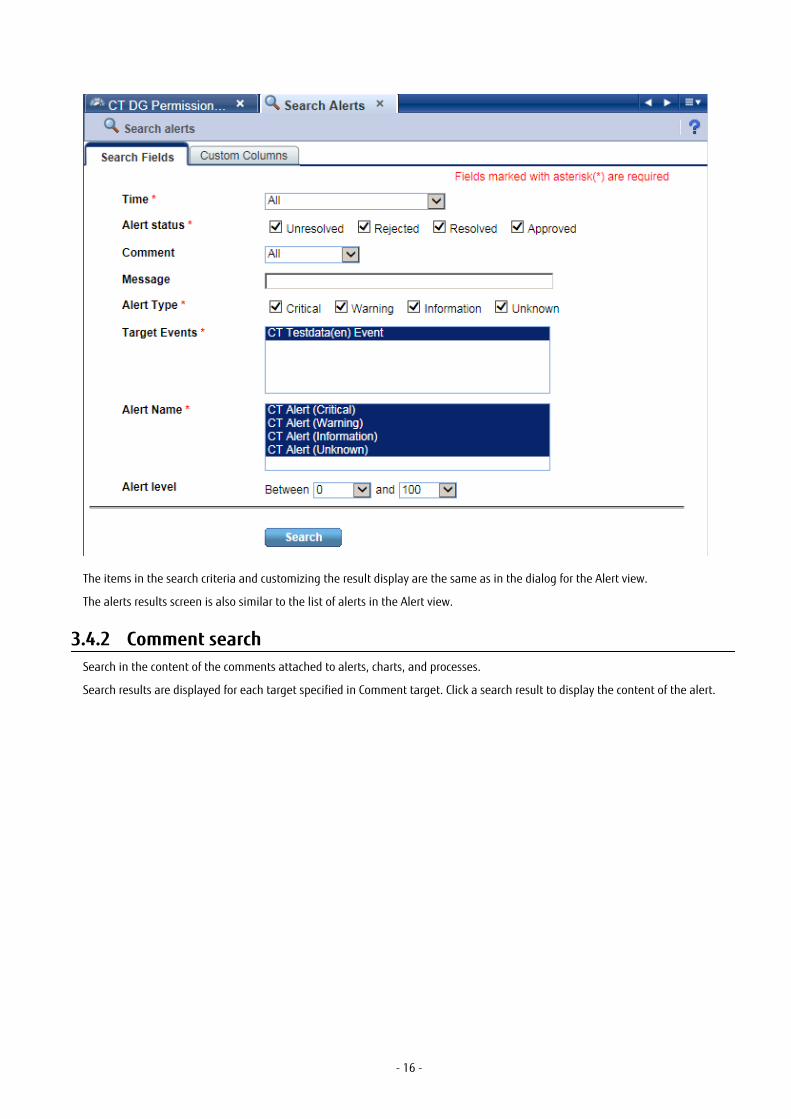
The items in the search criteria and customizing the result display are the same as in the dialog for the Alert view.
The alerts results screen is also similar to the list of alerts in the Alert view.
3.4.2 Comment searchSearch in the content of the comments attached to alerts, charts, and processes.
Search results are displayed for each target specified in Comment target. Click a search result to display the content of the alert.
- 16 -

The following describes the items in the tab.
Item Name Description
View profile Filter by profile.
Comment target Filter by Comment target. There are three types.
- Alert
- KPI
- Process (In case Interstage BPM)
Comment date Filter by the day the comment was made.
The latest or oldest period is made as a range for the blank.
Number of results Specify the number of results to display.
3.4.3 Process searchSearch for a process instance based on specific criteria such as alert status.
To display the details for a process instance, click on the process instance in the list of search results.
This feature is only available only from integrated Interstage BPM Console.
- 17 -
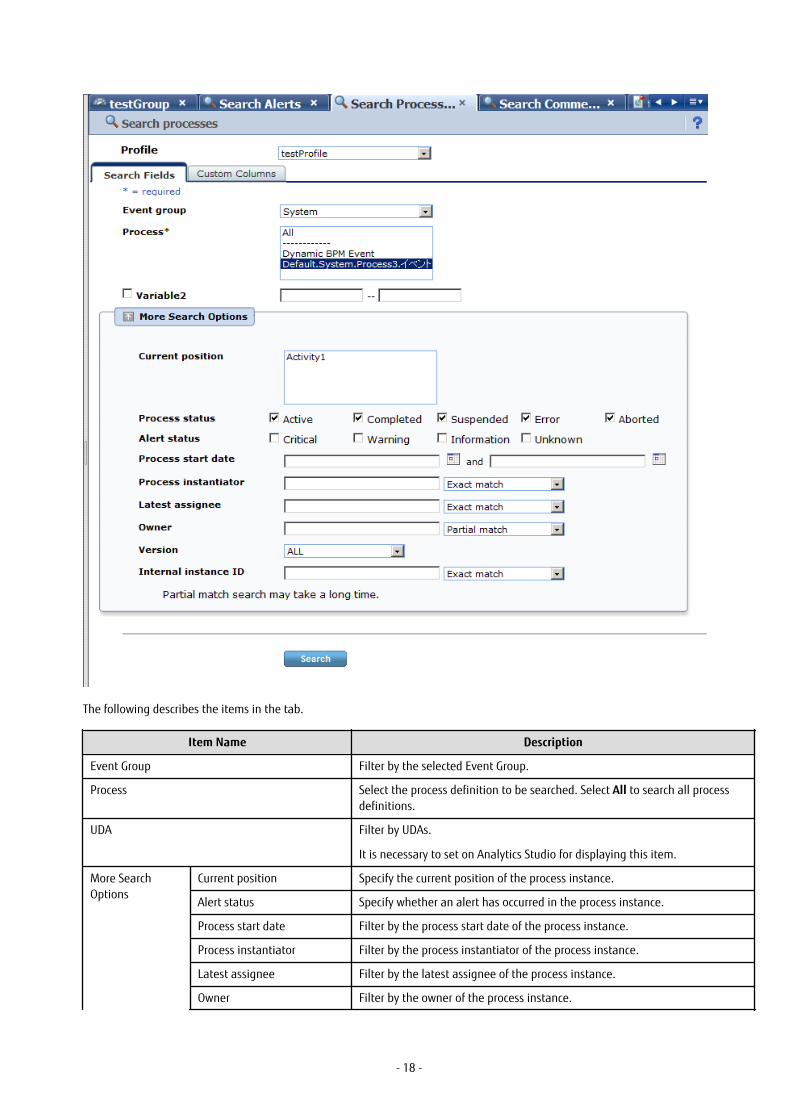
The following describes the items in the tab.
Item Name Description
Event Group Filter by the selected Event Group.
Process Select the process definition to be searched. Select All to search all processdefinitions.
UDA Filter by UDAs.
It is necessary to set on Analytics Studio for displaying this item.
More SearchOptions
Current position Specify the current position of the process instance.
Alert status Specify whether an alert has occurred in the process instance.
Process start date Filter by the process start date of the process instance.
Process instantiator Filter by the process instantiator of the process instance.
Latest assignee Filter by the latest assignee of the process instance.
Owner Filter by the owner of the process instance.
- 18 -

Item Name Description
Version Filter by the version of the process instance.
Internal instance ID Filter by the internal instance ID of process instance.
Search Results
This screen shows a list of the process instances found with the filtering conditions.
The following functions are available:
Feature name Description
Refresh Updates the listed process list.
Print Saves a snapshot of the displayed process list.
Comment Comments can be added for each process.
Results tab
The Results tab shows details about the process instances.
- 19 -
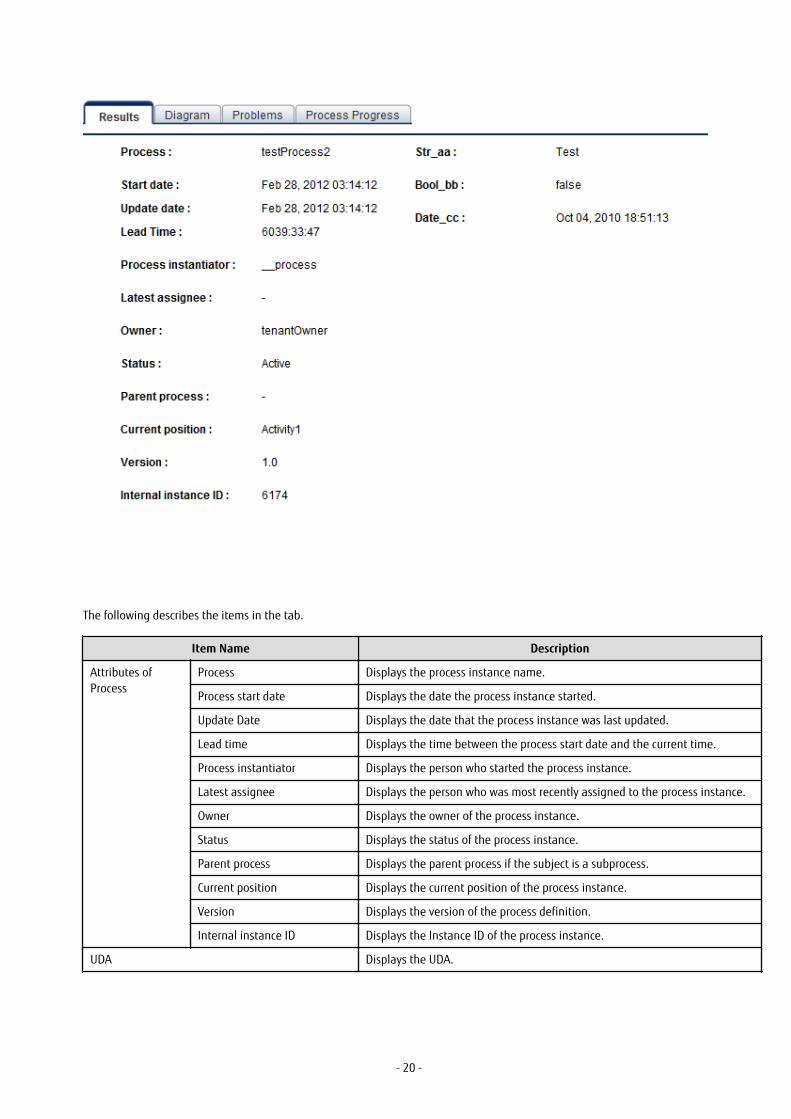
The following describes the items in the tab.
Item Name Description
Attributes ofProcess
Process Displays the process instance name.
Process start date Displays the date the process instance started.
Update Date Displays the date that the process instance was last updated.
Lead time Displays the time between the process start date and the current time.
Process instantiator Displays the person who started the process instance.
Latest assignee Displays the person who was most recently assigned to the process instance.
Owner Displays the owner of the process instance.
Status Displays the status of the process instance.
Parent process Displays the parent process if the subject is a subprocess.
Current position Displays the current position of the process instance.
Version Displays the version of the process definition.
Internal instance ID Displays the Instance ID of the process instance.
UDA Displays the UDA.
- 20 -

Process diagram tab
The Process diagram tab displays a process chart that shows the positions of alerts and the statuses of activities.
Only standard processes are displayed in this tab.
Problems tab
The Problems tab displays a list of the alerts that have occurred in the process instance.
Process progress table tab
The Process progress table tab contains the following information:
- Details about the tasks (activities) in a process
- Gantt chart showing the relative length of the lead time
Icons are displayed at the start, current (or end), and due positions. Move the pointer over each icon to view time details.
- 21 -

3.5 Operations in the Business Reports ViewThis section explains the operations you can perform in the Business Report view.
3.5.1 LayoutThe KPI Layout view is displayed when you log into the Analytics Dashboard and click on the item you wants to display in the KPI treein the left pane. The number of bricks and each brick's sizes, locations and contents displayed in the Business Reports View are dependson which layout was selected.
- 22 -

Layout toolbar
Descriptions of the features:
Feature name Description
Refresh All Refresh all panels except the one for external URLs.
Export CSV All the charts in the layout are output to one CSV file.
Print Saves a snapshot of the displayed layout.
External URLs is not saved.
Help Displays help information about this feature.
3.5.2 ChartsThe following shows the structure of the brick window.
- 23 -

Descriptions of the features:
Feature name Description
Refresh Updates the chart to the latest status.
Change table/graph Switches between table and graph display.
Comments Comments (associated with KPI charts) can be registered and viewed.
History You can arrange KPI charts for viewing that have been divided up into periods according tothe chart's display period settings.
Show relational alerts Displays a list of the alerts associated with the chart.
Export CSV Outputs the content of the chart to a CSV file.
Period slider Historical periods can be shown according to the period set for the chart.
Configure Change the chart settings. These settings are effective only during the current login session.
Drill Down Click on an item in the chart to show details about it. This must be configured beforehand inAnalytics Studio.
Drill Up If the current chart is after drill-down, then a chart of the parent level is displayed.
Related Chart Displays charts associated with the chart. This must be configured in Analytics Studiobeforehand.
- 24 -
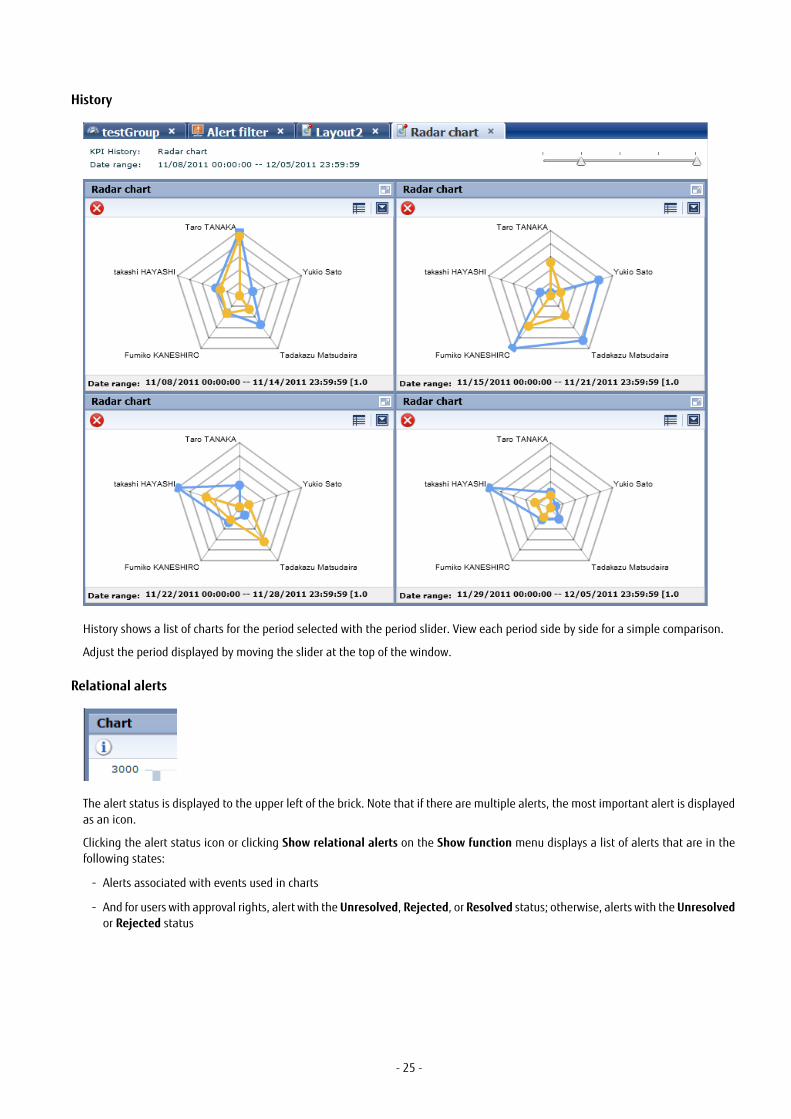
History
History shows a list of charts for the period selected with the period slider. View each period side by side for a simple comparison.
Adjust the period displayed by moving the slider at the top of the window.
Relational alerts
The alert status is displayed to the upper left of the brick. Note that if there are multiple alerts, the most important alert is displayedas an icon.
Clicking the alert status icon or clicking Show relational alerts on the Show function menu displays a list of alerts that are in thefollowing states:
- Alerts associated with events used in charts
- And for users with approval rights, alert with the Unresolved, Rejected, or Resolved status; otherwise, alerts with the Unresolvedor Rejected status
- 25 -
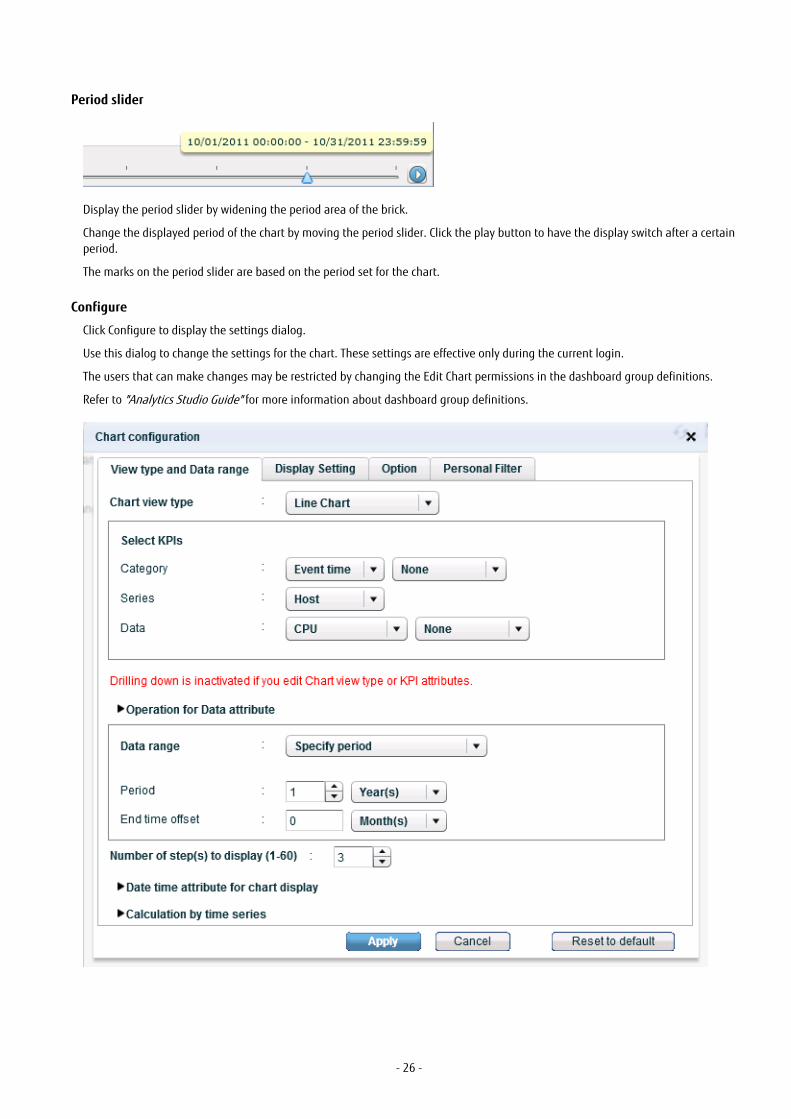
Period slider
Display the period slider by widening the period area of the brick.
Change the displayed period of the chart by moving the period slider. Click the play button to have the display switch after a certainperiod.
The marks on the period slider are based on the period set for the chart.
Configure
Click Configure to display the settings dialog.
Use this dialog to change the settings for the chart. These settings are effective only during the current login.
The users that can make changes may be restricted by changing the Edit Chart permissions in the dashboard group definitions.
Refer to "Analytics Studio Guide" for more information about dashboard group definitions.
- 26 -

Feature name Description
View type and Datarange
Chart view type Set the type of display for the chart.
The settings for properties depend on the type of display.
Select KPIs For all charts other than the Event table, you can set either the Category,Series, or Data, depending on the type of chart.
The settings are in the list format for Event tables.
The drilldown is disabled when individual parameters are changed. ClickReset to default to enable drilldown again.
You can specify display format for particular data type.
- Number format
In case data type is as read or integer, you can specify number format.
- none
Display the value as it is without format.
If data type is Real, Decimal number of digits defined in Eventdefinition is displayed.
- Integer
Cut off decimal and display in integer.
- Percent
Display with % multiplying by 100.
- Time
Display hh:mm:ss format considering number to be Second.
- Custom
Display by user defined format.
Enabled character:0, #, .
0 means displays its digit always and 0 is added if value does notexist.
# means display value if value exists in its digit.
. means decimal point.
Ex)
When the format is 0.0# and the input is 45.10, the label is 45.1.
- Datetime format
In case data type is as datetime format, you can specify datetimeformat.
- none
Display the value as it is without format.
- Date
Display as date format.
- Time
Display as time format.
- 27 -
Feature name Description
- Custom
Display by user defined format.
Enabled character: YYYY, MM, DD, EEE, hh, mm, ss
Operation for data attribute Run operations on data attributes.
- Operation for data attribute
Run one of the four arithmetic operations on data attributes. This isdone for each of the data attributes.
- Operation type
This operation is run if there are duplicated item values.
Calculation is performed according to the specified method.
Data range Set the display period for the chart.
- Latest data
The newest data is displayed.
- Past point data
The newest data is displayed with the specified date as the start point.
- Grid range
The data for the specified display period is displayed starting with thestart point.
- Specify period
The data for the specified display period is displayed starting with thecurrent date.
- Specify start
Displays the data in the period between the start date and the currentdate.
- Specify start and end
Displays the data in the period between the start date and the enddate.
Number of step(s) to display Set Marks of Period slider.
Select from 1 to 60.
Date time attribute for chartdisplay
The date and time attributes used in Data range
Calculation by time series Calculates data values that duplicate across dates when a non-time serieschart.
Display Settings Title: Set a title. Select the checkbox to display it.
Title color Change the color of the title.
Constants size Fixes the size of the brick.
Refresh Interval Set the interval between chart refreshes. The chart is not refreshedautomatically if you select 0.
Select from 0 to 60.
- 28 -

Feature name Description
Legend Select whether to show a legend.
Available with the pie chart, bar chart, stacked bar chart, and histogram.
Display data value Select whether to display data values.
Available with the pie chart, bar chart, stacked bar chart, histogram, andsignals.
Direction of plot Set the direction of the plotting of the data axis of the graph.
Available with the bar chart and stacked bar chart.
Horizontal labels Set the labels on the horizontal axis.
Available with the bar chart, stacked bar chart, line chart, and histogram.
Horizontal axis labels Set the labels for the marks on the horizontal axis.
Available with the bar chart, stacked bar chart, line chart, and histogram.
Vertical labels Set the labels on the vertical axis.
Available with the bar chart, stacked bar chart, line chart, and histogram.
Vertical axis bound Set the data range for the vertical axis.
Available with the bar chart, stacked bar chart, line chart, and histogram.
Line type Set the type of line to use in line charts.
- Solid
- Dashed
Line width Set the line width in line charts.
Select 1, 2, 3, 4, 5.
Number of Partition inhistogram
Set the granularity of data distribution in the histogram.
Change row and column Switch rows and columns in the data table.
Row Background color Set the background color of the column labels in the data table.
Row Foreground color Set the font color of the column labels in the data table.
Col Background color Set the background color of the row labels in the data table.
Col Foreground color Set the font color of the row labels in the data table.
Data Background color Set the background color of the data cells in the data table.
Data Foreground color Set the font color of the data cells in the data table.
Vertical axis bound Set the data range in the tachometer.
Low Threshold Set the low-end threshold.
Values lower than this threshold will appear in yellow.
Available with the tachometer and signal charts.
High Threshold Set the high-end threshold.
Values higher than this threshold will appear in red.
Available with the tachometer and signal charts.
Display a before data Shows the value before the most recent refresh of the tachometer.
The tachometer is displayed after a refresh.
- 29 -
Feature name Description
Signal view type Change the appearance of the signal.
- One light
- Three lights
Threshold - Checkbox
Select whether to display threshold values.
- Value
Set the threshold value.
- Line type
Set the type of line.
- Solid line
- Dashed Line 1
- Dashed Line 2
- Dashed Line 3
- Dashed Line 4
- Dot Line
- Line width
Set the line width. Select 1, 2, 3, 4, or 5.
- Line color
Set the color.
Sub-Graph Share vertical axis Select whether to share the vertical axis with the base graph.
Display Select whether to display sub-graphs. The marks on the vertical graph willalso be hidden if you choose not to display sub-graphs.
Vertical labels Set the labels on the vertical axis.
Display data value Displays data values.
Available with the bar chart and stacked bar chart.
Line type Set the type of line to use in line charts.
- Solid
- Dashed
Line width Set the line width in line charts.
Select 1, 2, 3, 4, or 5.
Options Sort Sort the charts.
- Event tables
It is possible to sort it by two or more attributes. Invisible attributes canalso be sorted.
- Index
The sorting order is specified. It sequentially sorts it from one withsmall number.
- 30 -

Feature name Description
- Attribute
Select target attribute name.
- Sort Order
Select the direction of the values.
- Action
Delete selected item.
- Others
Specify the axis of the chart for any other kind of chart.
* Data cannot be used for sorting if a series has been specified.
- Sort Key
Select target attribute name.
- Sort Order
Select the direction of the values.
Control Plot Volume Displays the rankings for categories and series. Data outside the rankingsare calculated under Others. Others can be calculated by summing or byaverage.
- Maximum number of category plots
- If the category value is a date or time
The number of plots is adjusted to stay below the specifiedmaximum.
- If the category value is a string or numerical value
Only the higher data value items are displayed.
- Maximum number of series plots
- If the series value is a date or time
Plot volume cannot be adjusted.
- If the series values is a string or numerical value
Only the higher data value series are displayed.
Compare by Time Series If the category attribute is Event time, specify whether to have the timeseries data split into multiple series according to a certain cycle.
- Comparison cycle
Specify a time cycle when dividing a series.
- Display scope
Specify the range displayed on the horizontal axis of a chart.
Personal Filter Filtering Rule Showing how to combine if multiple conditions were set.
- AND
Show data which matches all condition.
- OR
Show data which matches any one of condition.
- 31 -

Feature name Description
Filtering Condition List of filter conditions of this chart.
If user has permissions to remove conditions, the condition's checkbox canbe controlled. If the checkbox was unchecked and applied the changes,those conditions will be temporarily removed.
Drill Down
Parameters can be passed from parent chart to a child chart to delve deeper into a data column.
Some examples are shown below.
For example:
In this example, the parent chart is "Sales results for each shop" and a child chart for "Sales results for each category" is created underit, with "Shop-C" set as the drilling parameter to pass between them.
You can therefore show a chart for "Sales results for each category" for branch C by clicking on the "Shop-C" data column and selectingthe "Sales results for each category" chart.
Related Chart
If parameters are not set for passing between parent and child charts, then the child chart will just be an associated chart.
The child chart is shown in the chart area by clicking on the parent chart icon and selecting the child chart.
The drilldown slider is displayed after you drilldown or display an associated chart at the first time. You can thereafter control chartdisplays with this slider.
3.5.3 Alert listAlerts matching the monitoring conditions are shown in a list, as in the Alert view.
Select an alert and click Open in the menu to show details about the alert.
3.5.4 External URLYou can display any Web page in this section.
3.6 Operations in the Process Performance ViewThe following explains the operations you can perform in the Process Performance view. This feature is only available from integratedInterstage BPM Console.
The Process Performance view is displayed when you log into the dashboard and click on a Monitor or on an analysis in the ProcessPerformance tree in the left pane.
- 32 -
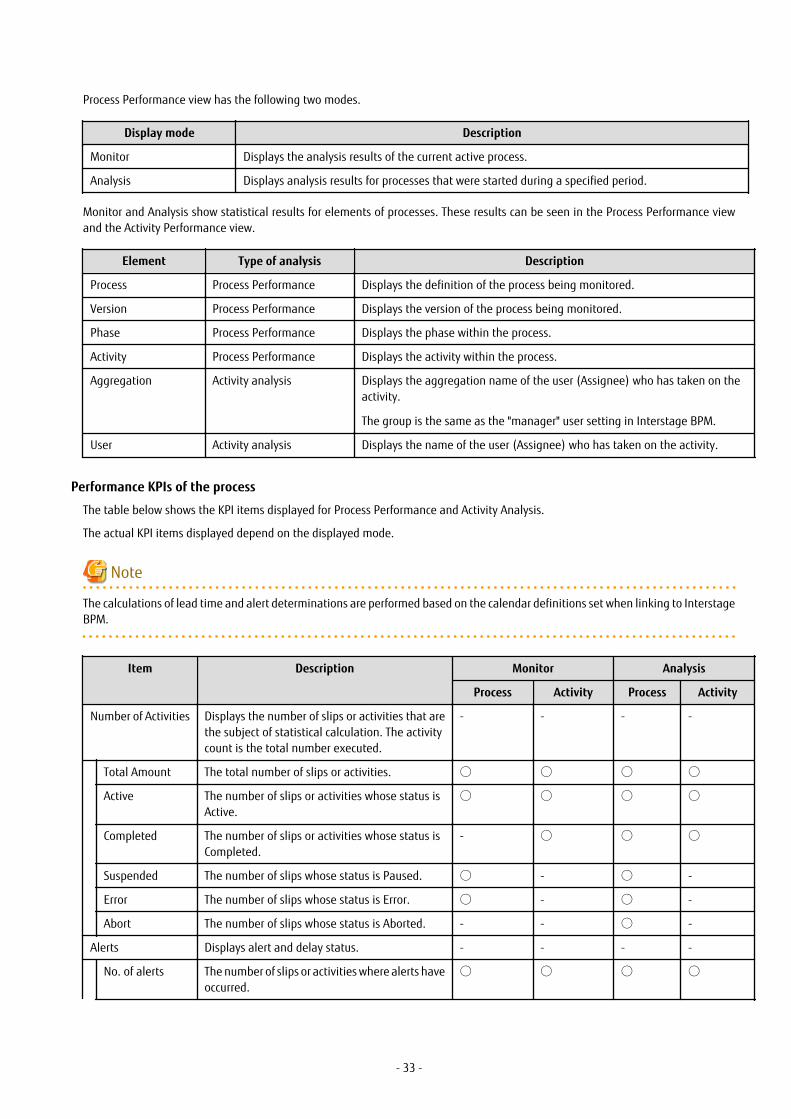
Process Performance view has the following two modes.
Display mode Description
Monitor Displays the analysis results of the current active process.
Analysis Displays analysis results for processes that were started during a specified period.
Monitor and Analysis show statistical results for elements of processes. These results can be seen in the Process Performance viewand the Activity Performance view.
Element Type of analysis Description
Process Process Performance Displays the definition of the process being monitored.
Version Process Performance Displays the version of the process being monitored.
Phase Process Performance Displays the phase within the process.
Activity Process Performance Displays the activity within the process.
Aggregation Activity analysis Displays the aggregation name of the user (Assignee) who has taken on theactivity.
The group is the same as the "manager" user setting in Interstage BPM.
User Activity analysis Displays the name of the user (Assignee) who has taken on the activity.
Performance KPIs of the process
The table below shows the KPI items displayed for Process Performance and Activity Analysis.
The actual KPI items displayed depend on the displayed mode.
Note
The calculations of lead time and alert determinations are performed based on the calendar definitions set when linking to InterstageBPM.
Item Description Monitor Analysis
Process Activity Process Activity
Number of Activities Displays the number of slips or activities that arethe subject of statistical calculation. The activitycount is the total number executed.
- - - -
Total Amount The total number of slips or activities. ○ ○ ○ ○
Active The number of slips or activities whose status isActive.
○ ○ ○ ○
Completed The number of slips or activities whose status isCompleted.
- ○ ○ ○
Suspended The number of slips whose status is Paused. ○ - ○ -
Error The number of slips whose status is Error. ○ - ○ -
Abort The number of slips whose status is Aborted. - - ○ -
Alerts Displays alert and delay status. - - - -
No. of alerts The number of slips or activities where alerts haveoccurred.
○ ○ ○ ○
- 33 -
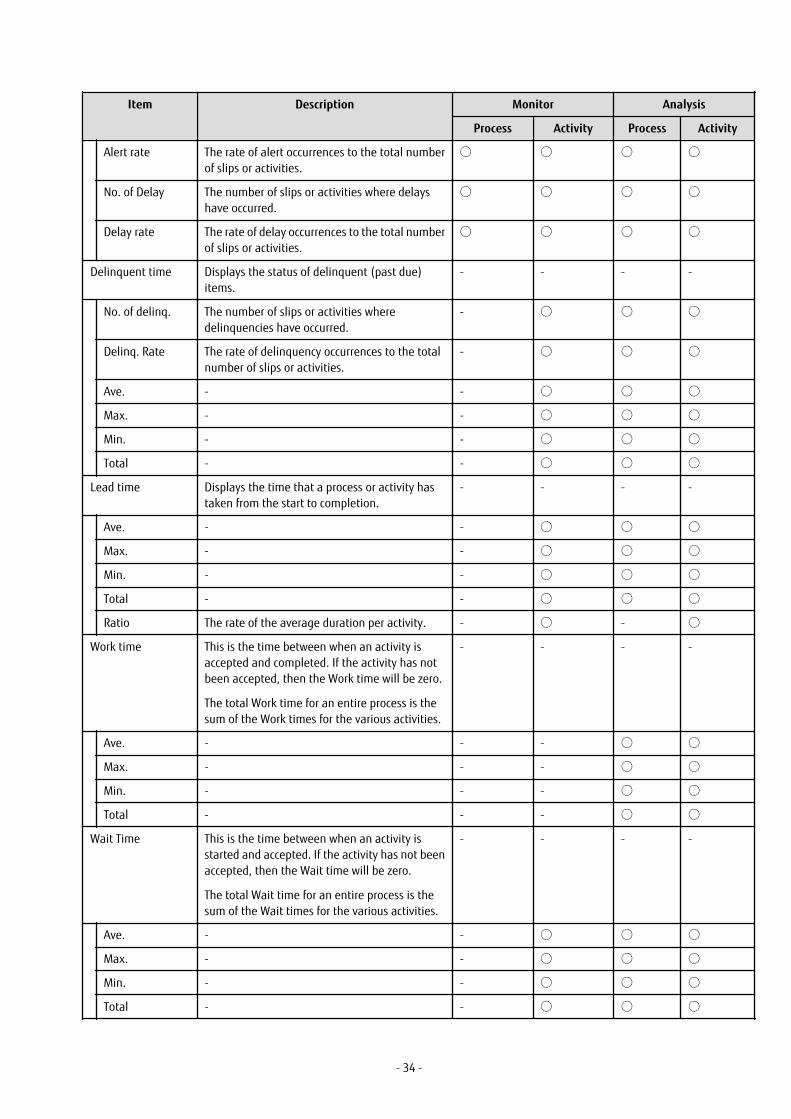
Item Description Monitor Analysis
Process Activity Process Activity
Alert rate The rate of alert occurrences to the total numberof slips or activities.
○ ○ ○ ○
No. of Delay The number of slips or activities where delayshave occurred.
○ ○ ○ ○
Delay rate The rate of delay occurrences to the total numberof slips or activities.
○ ○ ○ ○
Delinquent time Displays the status of delinquent (past due)items.
- - - -
No. of delinq. The number of slips or activities wheredelinquencies have occurred.
- ○ ○ ○
Delinq. Rate The rate of delinquency occurrences to the totalnumber of slips or activities.
- ○ ○ ○
Ave. - - ○ ○ ○
Max. - - ○ ○ ○
Min. - - ○ ○ ○
Total - - ○ ○ ○
Lead time Displays the time that a process or activity hastaken from the start to completion.
- - - -
Ave. - - ○ ○ ○
Max. - - ○ ○ ○
Min. - - ○ ○ ○
Total - - ○ ○ ○
Ratio The rate of the average duration per activity. - ○ - ○
Work time This is the time between when an activity isaccepted and completed. If the activity has notbeen accepted, then the Work time will be zero.
The total Work time for an entire process is thesum of the Work times for the various activities.
- - - -
Ave. - - - ○ ○
Max. - - - ○ ○
Min. - - - ○ ○
Total - - - ○ ○
Wait Time This is the time between when an activity isstarted and accepted. If the activity has not beenaccepted, then the Wait time will be zero.
The total Wait time for an entire process is thesum of the Wait times for the various activities.
- - - -
Ave. - - ○ ○ ○
Max. - - ○ ○ ○
Min. - - ○ ○ ○
Total - - ○ ○ ○
- 34 -

Item Description Monitor Analysis
Process Activity Process Activity
Others - - - - -
Recalls Displays the number of recalls. - ○ - ○
3.6.1 Process PerformanceThis is an example of when Monitor is clicked.
Process Performance shows KPIs for each process, phase, or activity.
Process Performance toolbar
The following table describes Process Performance features.
Feature name Description
Version selection Latest version Displays only the most recent of all processes linked.
All versions Displays all processes linked.
View report Opens the KPI chart for Process Performance. This need to be configured in Studiobeforehand.
View activity Displays the statistical results of selected activities for each group and user.
- 35 -
Feature name Description
Displayed if an activity in the process analysis table is selected.
View sub processes Displays the statistical results of the selected subprocess.
Displayed if a subprocess exists in an activity is selected in the process analysistable.
Analyze Process Patterns Displayed when a process is selected (or when a route task is selected in the caseof an irregular type). The Web Flow Viewer is displayed when you click this.
The Analysis Layout for analysis must be on and Process Discovery must be linkedfor this to work.
Refresh Refreshes the process analysis table.
Configure Opens the settings dialog box.
Use this dialog box to change the column items in the process analysis table.
Print Saves a snapshot of the process analysis window.
Help Displays help articles about this feature.
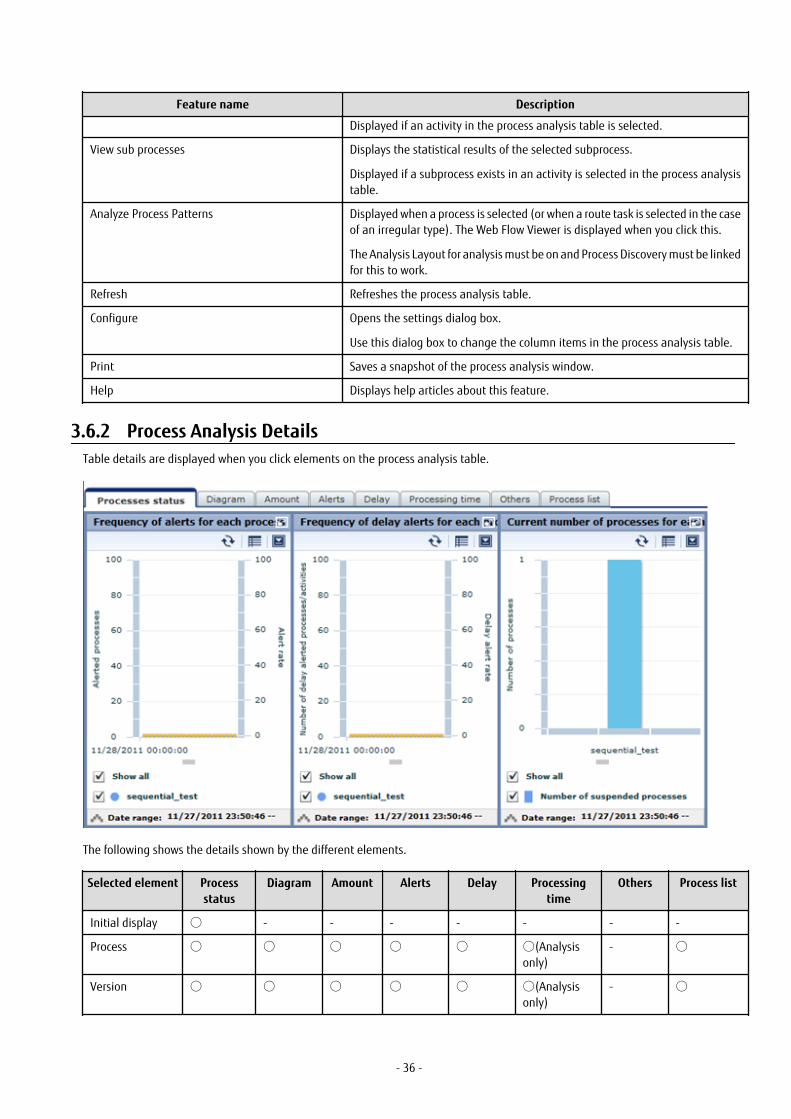
3.6.2 Process Analysis DetailsTable details are displayed when you click elements on the process analysis table.
The following shows the details shown by the different elements. Selected element Process
statusDiagram Amount Alerts Delay Processing
timeOthers Process list
Initial display ○ - - - - - - -
Process ○ ○ ○ ○ ○ ○(Analysisonly)
- ○
Version ○ ○ ○ ○ ○ ○(Analysisonly)
- ○
- 36 -

Selected element Processstatus
Diagram Amount Alerts Delay Processingtime
Others Process list
Phase ○ ○ ○ ○ ○ ○ ○ ○
Activity ○ ○ ○ ○ ○ ○ ○ ○
3.6.3 Activity analysisThis is an example of when latest status activities are displayed. In this display, KPIs are shown for the user that has accepted theselected activity and the organization they belong to.
The following table shows the features available with activity analysis.
Feature name Description
Refresh Refreshes the process analysis table.
Configure Opens the settings dialog box.
Use this dialog box to change the column items in the activity analysis table.
Print Saves a snapshot of the process analysis window.
Help Displays help information about this feature.
- 37 -
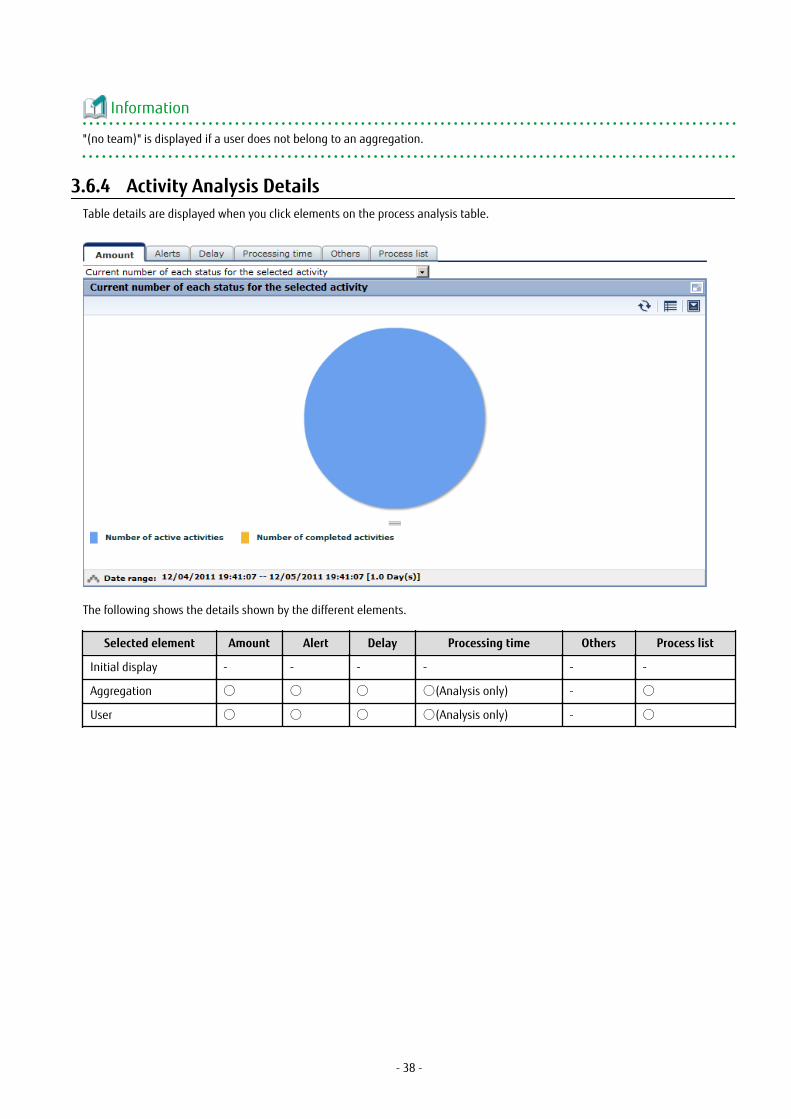
Information
"(no team)" is displayed if a user does not belong to an aggregation.
3.6.4 Activity Analysis DetailsTable details are displayed when you click elements on the process analysis table.
The following shows the details shown by the different elements.
Selected element Amount Alert Delay Processing time Others Process list
Initial display - - - - - -
Aggregation ○ ○ ○ ○(Analysis only) - ○
User ○ ○ ○ ○(Analysis only) - ○
- 38 -

Chapter 4 Operating the Analytics Dashboard for Smartdevices
This chapter describes the operation of the Interstage Business Process Manager Analytics (BPMA) Dashboard for Smart devices.
4.1 OverviewThe Analytics Dashboard is a tool to monitor business activities with a Web browser.
4.1.1 DisplayThe following view is displayed after you log in to Dashboard.
4.1.1.1 Global header
Refresh
Refresh the contents.
Refreshed date will be displayed next to the Update label.
History
The history of the selected contents from navigation tree is displayed in History.
Up to latest 10 contents are shown.
4.1.1.2 Slide menuThis is displayed when the button on left side of Global header is selected.
- 39 -

User Preferences
User Preference screen is displayed when select the User Name or User ID area on the global header.
You can update user preferences from this screen and specified parameters are activated when you select [Apply] button in each tab.
Descriptions of the features:
Tab name Feature name Description
User Profile User Name Updates User Name.
E-Mail Updates E-mail address.
Change password Check in case changing password.
New password Specify new password.
New password(confirm) Specify new password for confirmation.
Note
Changing password is available only in case Administrator permits.
Some of the changes will be activated during next login.
User Preference screen is available only in case Built-in Authentication.
Log out
Log out from Dashboard.
4.1.1.3 Navigation tree
Overview menu
Overview is the top page of the dashboard. The following information is displayed in the Dashboard Overview.
- Alert summary
- Summaries of alerts are shown here. The information displayed matches the monitoring conditions configured for theDashboard Profile. A list of alerts is displayed when you select the alert monitoring conditions in the summary.
- 40 -

- Business Reports
- The same contents shown in the KPI view can get shown.
Alert view menu
The following features are available in Alert menu:
- Display Alerts
Displays list of the alerts which were detected.
- Alert details and escalation results
Details of the alerts selected in the list of alerts are shown here. The results of escalation are also shown if applicable.
- Alert list display and available actions
Alerts matching the monitoring conditions are shown in a list. There are a number of actions that can be taken.
- Related URL display
This shows URLs configured beforehand in Interstage Business Process Manager Analytics (BPMA) Studio. By jumping to theselinks from the list of alerts, related operations can be accessed. Alert values can be embedded in the URL links.
- Related KPI display
This shows charts and layouts as alert-related information configured beforehand in Analytics Studio.
- Display history of comment
Earlier comments and actions are displayed in time series.
Business Reports menu
The following features are available in Business Reports menu:
- Chart display
This displays a chart showing business activities in real-time. Icons are displayed on events if alerts have occurred in an event.
- Drill Down
More detailed chart can be set by selecting attribute set in Analytics Studio.
4.2 Operations in the OverviewThis section explains the operations you can perform in the Dashboard Overview.
The Overview is displayed first after you logged in to the Analytics Dashboard.
The Overview shows alert summaries, charts (similar to those shown in the KPI view). The Alert summary is an overview of alertoccurrences for each profile.
Alert summary
The Alert summary has the following two modes:
Item Name Description
Summary mode It graphically represents the conditions under which alerts occurred.
List mode The alerts are shown in a tree and list format. It differs from the Summary mode in that theselected alerts list can be displayed.
Point
The number of alerts displayed in the Alert summary depends on access permissions of the login user's group and current alert status.
- 41 -
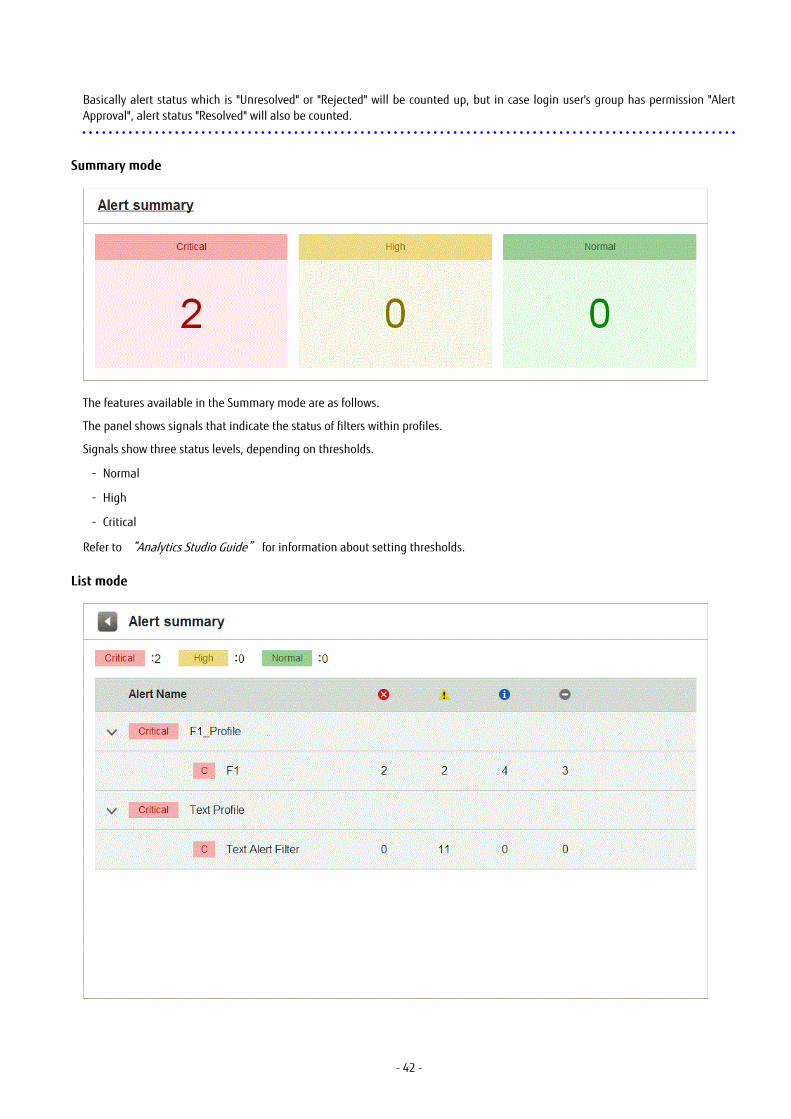
Basically alert status which is "Unresolved" or "Rejected" will be counted up, but in case login user's group has permission "AlertApproval", alert status "Resolved" will also be counted.
Summary mode
The features available in the Summary mode are as follows.
The panel shows signals that indicate the status of filters within profiles.
Signals show three status levels, depending on thresholds.
- Normal
- High
- Critical
Refer to “Analytics Studio Guide” for information about setting thresholds.
List mode
- 42 -
The features available in the List mode are as follows.
- The tree format shows the following two levels.
- Level 1: Profiles
- Level 2: Alert Filters
The first and second levels show the same signals as the Summary mode.
- To display the signal and title of the filter selected in the upper section, select on the level 2 filter.
4.3 Operations in the Alert ViewThis section explains the operations you can perform in the Alert view.
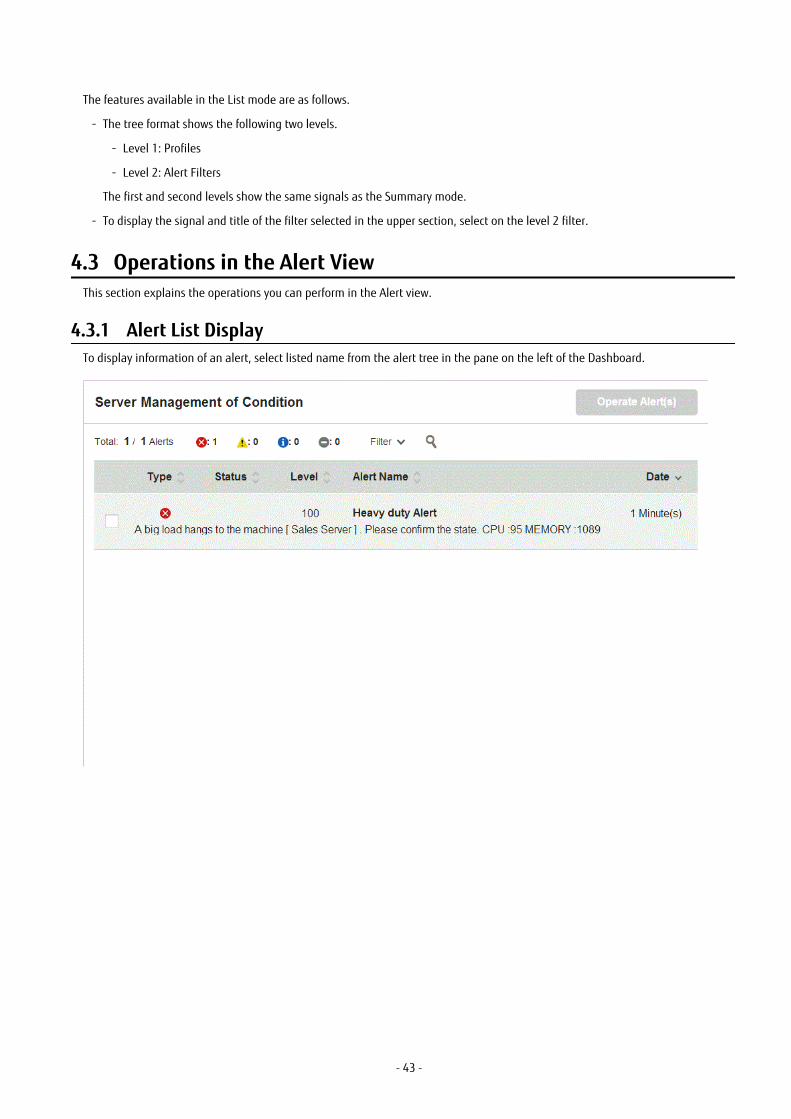
4.3.1 Alert List DisplayTo display information of an alert, select listed name from the alert tree in the pane on the left of the Dashboard.
- 43 -

Handling alert status
The displayed alert list can be filtered according to the alert status by using the Filtering list located at the top of the alert list. Youcan select multiple alerts and process them collectively.
After filtering, if Reset is selected in the Filter list, the display will revert to before filtered.
Alert search
In the Alert Settings dialog box, you can filter the alerts list results and change the items displayed.
The following describes the items in the Alert Settings dialog box.
Item Name Description
Time All Alerts from any period are shown.
Specify range Sets the alert period. Select one of the following:
・ Today
・ This week
・ This month
・ A historical period starting from the current date back to the specified point (year,month, day, hour)
Specify date Specify a date range.
- Specify a start date. The date range will be from the start date to the current date.
- Specify a start date and an end date
Alert status Displayed alerts can be filtered according to the selected alert status.
Select any of the following check boxes:
- Unresolved
- Rejected
- Resolved
- Approved
- 44 -

Item Name Description
Message Filter by Message.
Alert type Displayed alerts can be filtered according to the selected alert type.
Select any of the following check boxes:
- Critical
- Warning
- Information
- Unknown
Alert level Filter by alert level.
Alert Name Filter by Alert Name.
Displays alerts that are included in the alert filter set in the profile definition.
Operate Alert(s)
Take the following points into consideration for processing alerts using Operate Alert(s).
- After rectifying the problems associated with an alert, set its status as Resolved.
- If there are no problems with a resolved alert, set its status as Approved.
- If there is a problem with a resolved or approved alert, set its status as Rejected.
- Comments can be added to alerts.
- Only the person who added the comment can cancel. Canceled comments are shown with strike-through.
To change an alert's status, select the check box next to the alert and select Operate Alert(s). Note that the dialog box that is displayedis different depending on the current status of the selected alert.
- If you selected one alert:
The processing details of alert operations and the comment history is displayed. Comments that have been added can also bedeleted.
When a process is executed, its details are recorded in the history and the next process can be executed.
- If multiple alerts are selected:
The comment history is not displayed.
When processes are executed, the execution results message is displayed.
In the Operate Alert(s) dialog box, type a comment and select the displayed status button to change the alert status.
Note, by selecting the Can resolve Alerts and Can approve Alerts check boxes for a dashboard group definition in the Analytics Studio,you can control who can process alerts using the Analytics Dashboard.
For details, refer to "Editing Dashboard Groups" in Chapter 3, "Using the Analytics Studio" of the Interstage Business Process ManagerAnalytics Studio Guide.
- 45 -

4.3.2 Drilled-down displayTo show detailed information of an alert, select the alert in the alert list. This will show a panel with details in the lower part of thewindow.
Details tab
In "Details" tab, detail parameters such as alert dates, parameter which causes the alert, or related URL are displayed.
- 46 -

The following describes the items in the Details tab.
Item Name Description
Attribute Details Date and time of theevent
Displays the time and date the event occurred.
Event Attribute Name Displays the attribute value of the target event when the alert occurred.
Alert attribute Type Displays the alert type.
Status Displays the alert status.
Date Displays the time and date the alert occurred.
Alert level Displays the alert level.
Message Displays the alert message.
Event Group Displays the name of the event group to which the event where the alert happenedbelongs.
Chart tab
The Chart tab shows preset charts and layouts.
A vertical red line appears in time line charts to indicate the date when an alert occurred.
- 47 -
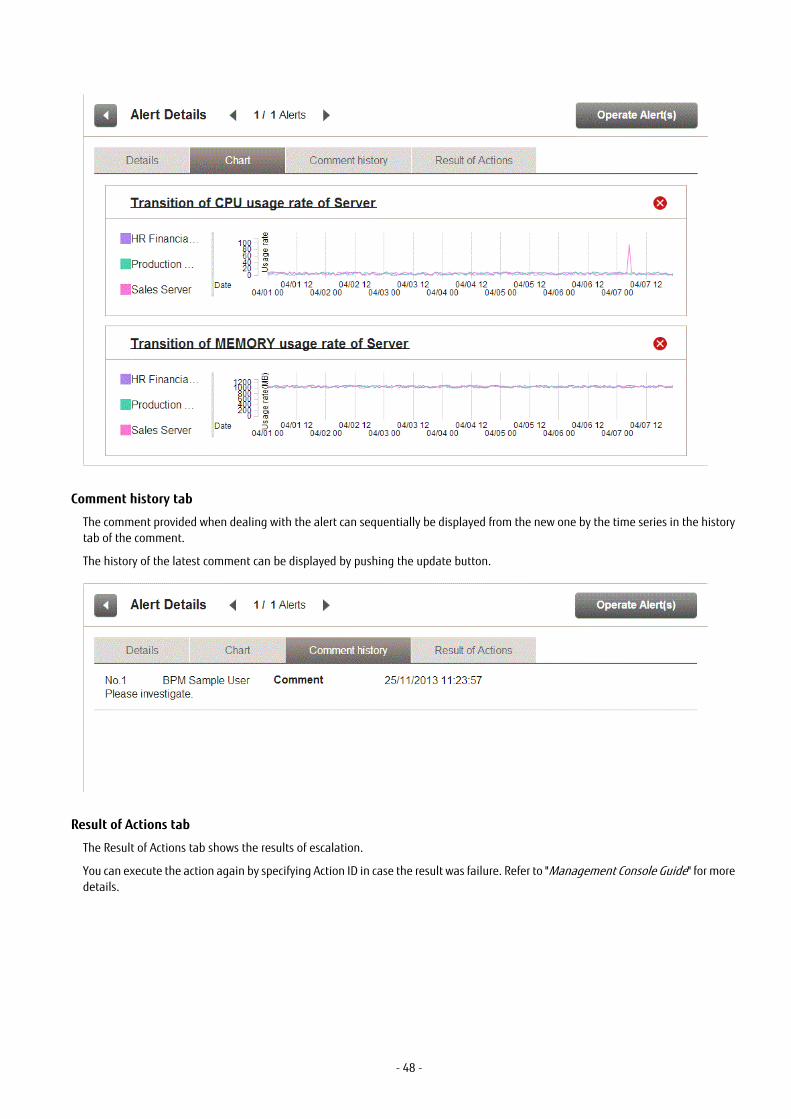
Comment history tab
The comment provided when dealing with the alert can sequentially be displayed from the new one by the time series in the historytab of the comment.
The history of the latest comment can be displayed by pushing the update button.
Result of Actions tab
The Result of Actions tab shows the results of escalation.
You can execute the action again by specifying Action ID in case the result was failure. Refer to "Management Console Guide" for moredetails.
- 48 -

4.4 Operations in the Business Reports ViewThis section explains the operations you can perform in the Business Report view.
4.4.1 LayoutThe KPI Layout view is displayed when you log into the Analytics Dashboard and select on the item you want to display in the KPItree. The number of bricks and each bricks sizes, locations and contents displayed in the Business Reports view are depends on whichlayout is selected.
- 49 -

Displaying mode of bricks
Displaying mode for bricks has 2 modes. These modes can be switched by selecting the title.
- Summary mode
This mode is able to refer two or more charts in the bird's-eye view. Each chart can be easily confirmed by scrolling.
- Detailed mode
This mode is for operating a chart. You can do the operations of Settings and Drill down, etc.
Optimization of display
The display of chart is optimized by the direction of the device and the number of bricks.
- Portrait
When you set the device in portrait orientation, each brick are displayed up to a full width of the display area in a row.
When the brick number is one, it is always displayed as detailed mode.
- Landscape
When you set the device in landscape orientation, each brick are displayed as below by the number of bricks.
When the brick number is one, it is always displayed as detailed mode.
- Brick number is 2
These bricks are displayed a row as Portrait.
- Brick number is 3 or more
These bricks are displayed two rows.
- 50 -

Point
To rotate the smart device, you can change the display mode of bricks. Set device in portrait orientation when you want to see thechart that crowds the data. And set device in landscape orientation when you want to see two or more charts.
4.4.2 ChartsThe following shows the structure of the brick window.
Descriptions of the features:
Feature name Description
Summary mode Show related alerts Displays a list of the alerts associated with the chart.
Detailed mode Change table Switches between table and graph display.
Period slider Historical periods can be shown according to the period set for the chart.
Configure Change the chart settings. These settings are effective only during the current loginsession.
Drill Down Select on an item in the chart to show details about it. This must be configuredbeforehand in Analytics Studio.
Drill Up If the current chart is after drill-down, then a chart of the parent level is displayed.
Related Chart Displays charts associated with the chart. This must be configured in Analytics Studiobeforehand.
- 51 -
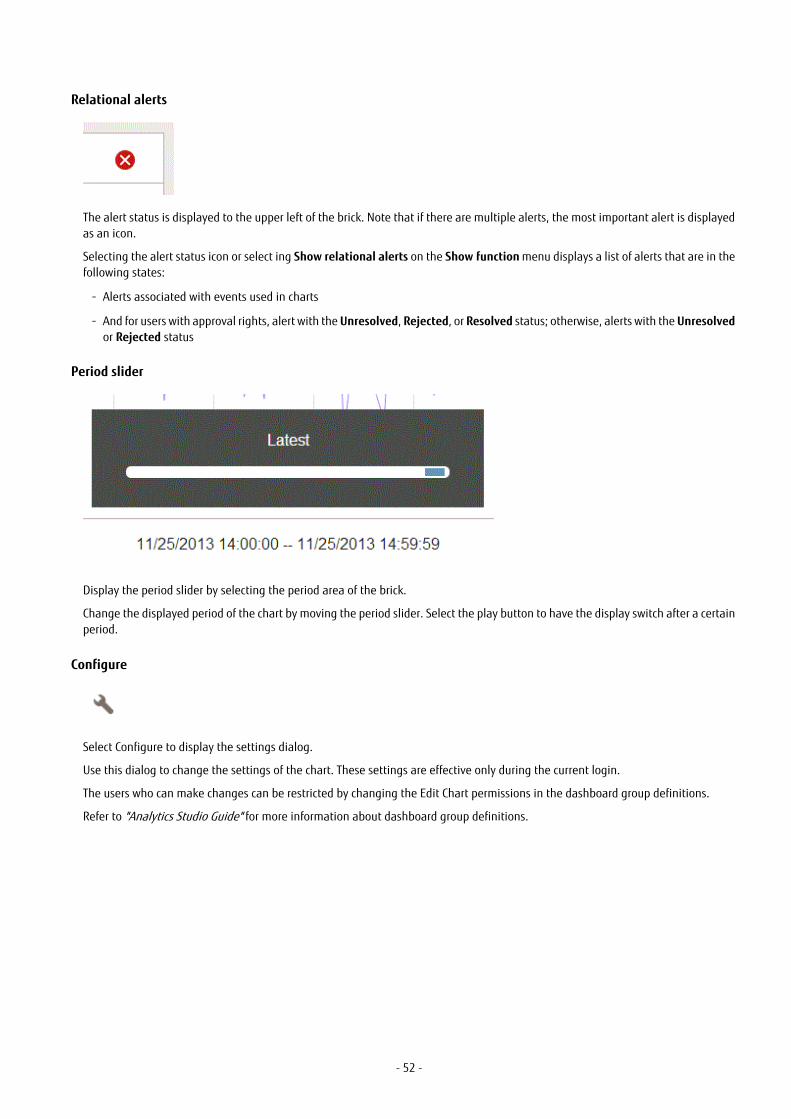
Relational alerts
The alert status is displayed to the upper left of the brick. Note that if there are multiple alerts, the most important alert is displayedas an icon.
Selecting the alert status icon or select ing Show relational alerts on the Show function menu displays a list of alerts that are in thefollowing states:
- Alerts associated with events used in charts
- And for users with approval rights, alert with the Unresolved, Rejected, or Resolved status; otherwise, alerts with the Unresolvedor Rejected status
Period slider
Display the period slider by selecting the period area of the brick.
Change the displayed period of the chart by moving the period slider. Select the play button to have the display switch after a certainperiod.
Configure
Select Configure to display the settings dialog.
Use this dialog to change the settings of the chart. These settings are effective only during the current login.
The users who can make changes can be restricted by changing the Edit Chart permissions in the dashboard group definitions.
Refer to "Analytics Studio Guide" for more information about dashboard group definitions.
- 52 -
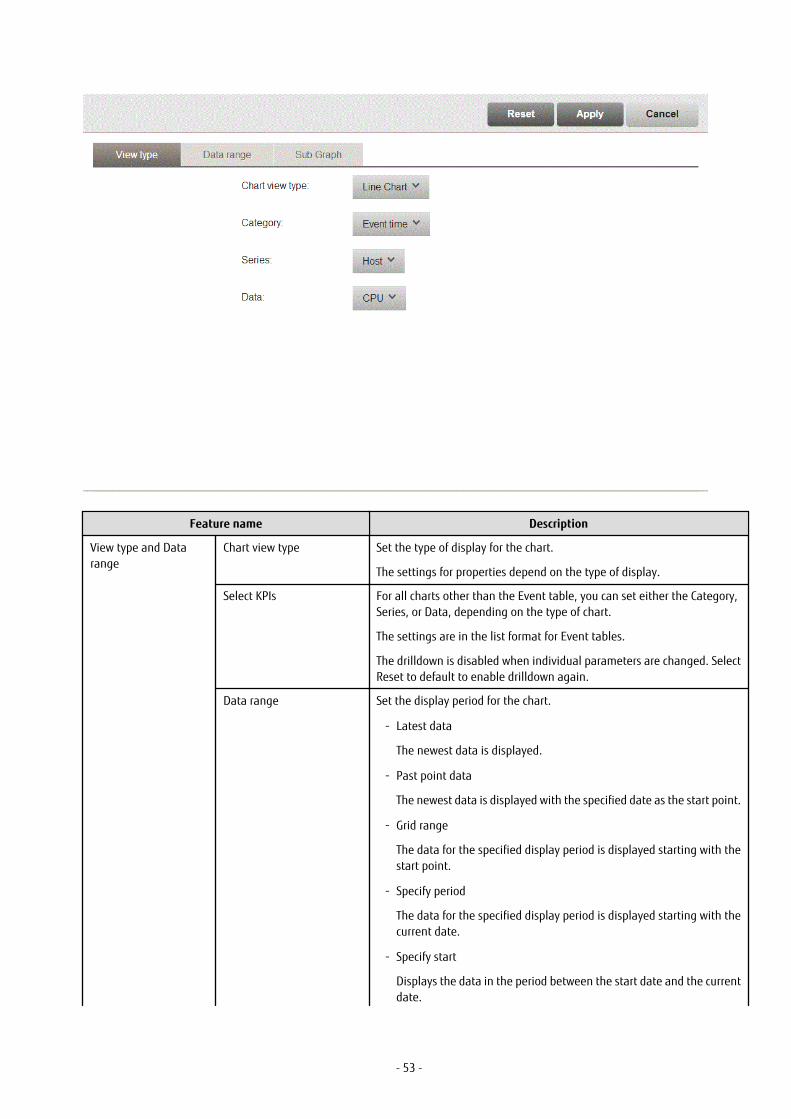
Feature name Description
View type and Datarange
Chart view type Set the type of display for the chart.
The settings for properties depend on the type of display.
Select KPIs For all charts other than the Event table, you can set either the Category,Series, or Data, depending on the type of chart.
The settings are in the list format for Event tables.
The drilldown is disabled when individual parameters are changed. SelectReset to default to enable drilldown again.
Data range Set the display period for the chart.
- Latest data
The newest data is displayed.
- Past point data
The newest data is displayed with the specified date as the start point.
- Grid range
The data for the specified display period is displayed starting with thestart point.
- Specify period
The data for the specified display period is displayed starting with thecurrent date.
- Specify start
Displays the data in the period between the start date and the currentdate.
- 53 -

Feature name Description
- Specify start and end
Displays the data in the period between the start date and the enddate.
Sub-Graph Share vertical axis Select whether to share the vertical axis with the base graph.
Drill Down
Parameters can be passed from parent chart to a child chart to delve deeper into a data column.
Some examples are shown below.
For example:
In this example, the parent chart is "Sales results for each shop" and a child chart for "Sales results for each category" is created underit, with "Shop-C" set as the drilling parameter to pass between them.
You can therefore show a chart for "Sales results for each category" for branch C by selecting on the "Shop-C" data column and selectingthe "Sales results for each category" chart.
Related Chart
If parameters are not set for passing between parent and child charts, then the child chart will just be an associated chart.
The child chart is shown in the chart area by selecting on the parent chart's icon and selecting the child chart.
Drill Up
After Drill down or Related chart is operated once, the chart can be switched by the bread crumb.
- 54 -

Chapter 5 Other Functions
5.1 Direct DisplayThe direct display of the Interstage Business Process Manager Analytics (BPMA) Dashboard allows display of the Business Report viewand Alert view function.
Only the views themselves are shown the global header and navigation tree aren't shown. There is also an option to hide the headermenus when showing the Business Reports view.
Refer to the “Analytics Studio Guide” for details.
Note
Note that URL value of Direct Display URL would be changed when elements are migrated by using "Importing Elements". Followingelement types have impact.
- Layout
- Alert Filter
- Dashboard Profile
Note
This function is only for PC.
5.1.1 Relationship to the Dashboard GroupThe behavior of the direct view depends on the associated dashboard group.
Access to the direct view is controlled by the dashboard group setting.
Associated Dashboard Group Action
Guest View displayed without authentication
Not Guest View appears after authentication by the user
Both Guest and not Guest View appears after authentication by the user
Not associated with any Dashboard Group View is not displayed
5.1.2 External FilteringYou can display the chart with filtered data when accessing Business Report view by setting some of the parameters.
The following items can be used:
Item Value
Method GET, POST
Concatenation conditions AND, OR
Comparison operator Equal
The following request parameters can be specified:
- 55 -

Parameters Value Description
conditionType name, id Type of value specified in condKey
condKey* Attribute name or ID Specify the property to be filtered
(* is a sequence number)
condValue* Attribute values Set the value to be filtered
(* is a sequence number)
Creating conditional expressions
- Use the same sequence numbers for condKey and condValue in the conditional expression.
- In the condition expression, concatenate different condKeys with AND, and the same condKeys with OR.
- If a condValue corresponding to the sequence number of the condKey does not exist, the condKey is invalid.
For example:
Specify following URL in case setting the condition (AAA = PPP) AND ((BBB = QQQ) OR (BBB = RRR)).
URL: condKey0=AAA&condValue0=PPP&condKey1=BBB&condValue1=QQQ&condValue1=RRR
5.2 Label SubstitutionTo replace attriute values, create and modify following definitions.
- Creating label substitution definition
- Mapping attributes and label substitution definitions
- Enable label substitution in Dashboard group definition
- Enable label substitution in Report definition
During the label substitution is enabled, following will be replaced.
- Each value of Category/Series/Data for Graph and Data table
- Data value of Event table
- The message of Alert
- Details of Alert
- Detail of Process
- Subject and Body of E-mail Action
- Report
Note
When Label substitution is enabled, all alert messages including past messages are displayed in current format.
If you don't want to replace past alert messages, disable label substitution in Dashboard group definition and Report definition.
If event attributes are mapped with label substitution definition, Attribute values of E-mail action are always replaced.
5.2.1 Creating label substitution definitionLabel substitution definition is created in Management console.
Refer to the "Management Console" for details.
- 56 -

5.2.2 Mapping Attribute and a label substitution definitionAttributes and label substitutions are mapped in Event definition.
Refer to the "Studio Guide" for details.
5.2.3 Enable label substitution in Dashboard group definitionTo enable label substitution in Dashboard, modify Dashboard group definition.
Refer to the "Studio Guide" for details.
Note
Label substitution becomes invalid for the user who belongs to both valid group and invalid group.
5.2.4 Enable label substitution in Report definitionTo enable label substitution in Report, modify Report definition.
Refer to the "Studio Guide" for details.
- 57 -

Appendix A AppendixThis appendix provides additional information about the Interstage Business Process Manager Analytics (BPMA) Dashboard ProcessPerformance view.
A.1 Calculation of the Values in the Performance ViewThis section explains how the values in the Process Performance view are calculated.
The following values are found in the Process Performance view:
- Lead time
- Wait Time
- Work time
Information
The times of the business days in the business calendar are used in the calculation of these values. The times from non-business daysare not used in the calculations.
The 'business calendar' referred to is that held by the Process Definitions of Business Process Manager (BPM).
This diagram shows the relationship between the values.
A.1.1 Lead timeCalculations of lead time are based on the following:
- The time between the date and time of the start of the process and the date and time of the completion of the process is used.
- The times of the business days in the business calendar are used in the calculation.
- The Start Event of a process and the most recent End Event of a process are considered as a pair.
- Errors and pauses in the execution of the process are included as part of the lead time.
- Calculation is not performed if the process was cancelled.
A.1.2 Wait TimeCalculations of wait time are based on the following:
- The calculation starts at the Start Event and ends at the first Accepted Event.
- Times are not calculated if an Accepted Event has not occurred. This is because there can be no distinction made between waitingand working if an Accepted Event is not recorded. In this case, the time will be recorded as work time.
- 58 -

A.1.3 Work timeCalculations of work time are based on the following:
- If an Accepted Event has occurred, the time is calculated as between the Accepted Event and the End Event.
- If an Accepted Event has not occurred, the time is calculated as between the Start Event and the End Event.
- 59 -


