135 Transportation Research Record: Journal of the Transportation Research Board, No. 2285, Transportation Research Board of the National Academies, Washington, D.C., 2012, pp. 135–144. DOI: 10.3141/2285-16 R. Rajbhandari and S. Saman, Center for International Intelligent Transporta- tion Research, El Paso Office, Texas A&M Transportation Institute, Texas A&M University, 4050 Rio Bravo, Suite 151, El Paso, TX 79902. S. Vadali and D. Kang, Texas A&M Transportation Institute, Texas A&M University, 3135 TAMU, College Station, TX 77843-3135. Corresponding author: R. Rajbhandari, [email protected]. mance measures (KPMs). Dashboards have made their way into the transportation arena as a way to show progress of projects, traveler information systems, and congestion monitoring. RECENT TRANSPORTATION DASHBOARDS Some examples of recent dashboards in the transportation arena are briefly reviewed in this section. Freeway Travel Times Dashboard for Nevada Region The freeway and arterial system of the transportation travel times dashboard of the Regional Transportation Commission of Southern Nevada measures travel delay as a key metric to communicate its impact on mobility (1). The following objectives guide this dashboard: • To demonstrate the use of archived data to communicate to state and local agencies; • To monitor, track, and report freeway traffic congestion levels and travel reliability trends on a regional scale; • To extract and identify congestion, both temporally and spa- tially (as well as together); and • To extract and characterize normal traffic flow at different times of the day and days of the week. FHWA’s Congestion Dashboard FHWA supports a national traffic-monitoring program that incorpo- rates reliability measures such as the buffer index and planning time index in more than 30 cities (2). The FHWA congestion dashboard is designed to communicate reliability through an assessment of congestion reduction via color-coded arrows showing magnitude and direction of change for three measures: (a) hours of congested travel per day, (b) travel time index, and (c) planning time index on a quarterly basis. Oregon Department of Transportation Performance Dashboard The dashboard of the Oregon Department of Transportation (DOT) communicates information on five agency goals and related mea- sures (3). The Oregon DOT tracks several measures for each goal Dashboard Tool to Communicate Delays and Economic Cost of Delays at International Border Crossings Rajat Rajbhandari, Swapnil Saman, Sharada Vadali, and Don Kang The development of a dashboard tool to communicate key performance measures related to the cost of delay incurred by U.S.-bound commercial vehicles at international border crossings is discussed. Various frame- work and implementation aspects of such a dashboard are covered. These aspects include collection and processing of delay and economic cost data, design of the dashboard interface, calculations of performance measures, and finally its intended use for stakeholders. Two sets of metrics or key performance measures are discussed within the context of international land border crossings, the first pertaining to delay measures and the second to economic costs of delay. Definitions of “true delay” at border crossings and several delay measures are given, and the development of the same at varying temporal resolutions is reviewed. On the basis of a review of previously developed dashboards, the authors believe that the current effort is the first in which highly granular delay-related intelligent transportation system data have been integrated with economic components of delay in the arena of performance measurement. Nevertheless, the research focuses on delay incurred by the freight community at international land border crossings. Finally, data gaps and other theoretical issues that need addressing in the future to advance the discussion of a delay measure and its con- sequences at international land border crossings are treated. Regard- less of challenges concerning data, the authors believe that a significant potential exists for dashboards to enhance the planning process among stakeholders and to optimize their decision-making processes. Dashboards are portals for reporting performance of an organiza- tion. They are also management information system–type tools that facilitate and support information and decision-making needs of policy and decision makers by providing them with easy access to both internal and external information relevant to meeting the stra- tegic goals of the organization or company. Dashboards made their advent in the corporate world back in the 1980s and 1990s and have proved to be of great value in corporate performance and decision making. Dashboards typically include visualization components such as traffic lights, arrows, gauges, and dials for tracking key perfor-
Transcript
135
Transportation Research Record: Journal of the Transportation Research Board, No. 2285, Transportation Research Board of the National Academies, Washington, D.C., 2012, pp. 135–144.DOI: 10.3141/2285-16
R. Rajbhandari and S. Saman, Center for International Intelligent Transporta-tion Research, El Paso Office, Texas A&M Transportation Institute, Texas A&M University, 4050 Rio Bravo, Suite 151, El Paso, TX 79902. S. Vadali and D. Kang, Texas A&M Transportation Institute, Texas A&M University, 3135 TAMU, College Station, TX 77843-3135. Corresponding author: R. Rajbhandari, [email protected].
mance measures (KPMs). Dashboards have made their way into the transportation arena as a way to show progress of projects, traveler information systems, and congestion monitoring.
Recent tRanspoRtation DashboaRDs
Some examples of recent dashboards in the transportation arena are briefly reviewed in this section.
Freeway travel times Dashboard for nevada Region
The freeway and arterial system of the transportation travel times dashboard of the Regional Transportation Commission of Southern Nevada measures travel delay as a key metric to communicate its impact on mobility (1). The following objectives guide this dashboard:
• To demonstrate the use of archived data to communicate to state and local agencies;• To monitor, track, and report freeway traffic congestion levels
and travel reliability trends on a regional scale;• To extract and identify congestion, both temporally and spa-
tially (as well as together); and• To extract and characterize normal traffic flow at different
times of the day and days of the week.
FhWa’s congestion Dashboard
FHWA supports a national traffic-monitoring program that incorpo-rates reliability measures such as the buffer index and planning time index in more than 30 cities (2). The FHWA congestion dashboard is designed to communicate reliability through an assessment of congestion reduction via color-coded arrows showing magnitude and direction of change for three measures: (a) hours of congested travel per day, (b) travel time index, and (c) planning time index on a quarterly basis.
oregon Department of transportation performance Dashboard
The dashboard of the Oregon Department of Transportation (DOT) communicates information on five agency goals and related mea-sures (3). The Oregon DOT tracks several measures for each goal
Dashboard Tool to Communicate Delays and Economic Cost of Delays at International Border Crossings
Rajat Rajbhandari, Swapnil Saman, Sharada Vadali, and Don Kang
The development of a dashboard tool to communicate key performance measures related to the cost of delay incurred by U.S.-bound commercial vehicles at international border crossings is discussed. Various frame-work and implementation aspects of such a dashboard are covered. These aspects include collection and processing of delay and economic cost data, design of the dashboard interface, calculations of performance measures, and finally its intended use for stakeholders. Two sets of metrics or key performance measures are discussed within the context of international land border crossings, the first pertaining to delay measures and the second to economic costs of delay. Definitions of “true delay” at border crossings and several delay measures are given, and the development of the same at varying temporal resolutions is reviewed. On the basis of a review of previously developed dashboards, the authors believe that the current effort is the first in which highly granular delay-related intelligent transportation system data have been integrated with economic components of delay in the arena of performance measurement. Nevertheless, the research focuses on delay incurred by the freight community at international land border crossings. Finally, data gaps and other theoretical issues that need addressing in the future to advance the discussion of a delay measure and its con-sequences at international land border crossings are treated. Regard-less of challenges concerning data, the authors believe that a significant potential exists for dashboards to enhance the planning process among stakeholders and to optimize their decision-making processes.
Dashboards are portals for reporting performance of an organiza-tion. They are also management information system–type tools that facilitate and support information and decision-making needs of policy and decision makers by providing them with easy access to both internal and external information relevant to meeting the stra-tegic goals of the organization or company. Dashboards made their advent in the corporate world back in the 1980s and 1990s and have proved to be of great value in corporate performance and decision making. Dashboards typically include visualization components such as traffic lights, arrows, gauges, and dials for tracking key perfor-
136 Transportation Research Record 2285
set. However, only the ones shown on the dashboard graphically are displayed. In addition to those on the dashboard, several other measures are tracked and benchmarked annually:
• Annual traffic fatalities per 100 million vehicle miles traveled (VMT),• Annual hours of travel delay per capita per year in urban areas,• Annual construction jobs,• Yearly pavement condition,• Annual fish passage, and• Annual engineering and construction jobs from construction
spending.
Washington state Dot Gray notebook performance Dashboard
The Gray Notebook of the Washington State DOT (4) provides congestion-related information and performance measures pertaining to five goals similar to those of the Oregon DOT. The Washington State DOT goals align with statewide strategic goals. Much like the Oregon DOT, the Washington State DOT uses several annually assessed measures, for example, safety, preservation, environment, mobility, and stewardship.
cascade Gateway corridor
With regard to international land border crossings, the Whatcom Council of Governments, in Washington State, has deployed a dashboard as part of its Cascade Gateway border data warehouse project (5). The dashboard includes archived information related to border wait times, exchange rates, truck volume, and freight value by border crossing and direction.
overview of Recent Dashboards
The foregoing review suggests two components of dashboards: a visual display mode and a reporting mode. The visual display mode is typically simpler than the reporting mode and keeps information to a bare minimum while at the same time showcasing progress to an established target (which may be established by statewide strategic goals or other means), deviance from a previous period, or both. If used merely for reporting purposes, visual displays typi-cally document historical trends. In that case, a dashboard remains a near-passive communication device much like a research report.
Another point brought out in the review is that congestion and travel time dashboards like the Nevada dashboard typically have temporal reporting capabilities and have a secondary purpose aimed at targeting behavioral outcomes of users (1). The temporal and spa-tial granularity of data repositories allow this latter goal to be met. In this case, the contents of the dashboard are processed in real time with predictive capability one period ahead.
The third point noted from the review is that economic compo-nents are key elements of dashboards; however, most of the metrics reported in the review use delay as a direct proxy for costs (hence the terms “mobility” or “economic”) or use economic aspects for measuring goal progress (jobs as noted). Finally, only the Cascade Gateway dashboard (border-related) reports historical information for several trade-related economic data since international trade movements are an integral part of a border crossing.
In connection with border-related data, some empirical work on economic costs and delay measures has been conducted. The study by Vadali and Kang (6) links reliability concepts like 95th percentile time-based measures to potential economic costs.
The specific contributions of the current research study, however, are in the operationalization of various elements of crossing times like delay and costs and the introduction of temporal granularity and visual display via the dashboard tool. Eventually, dashboards such as the one developed in this research could easily integrate delay-related information for passenger vehicles and information from other ports of entry and consider predictive elements. The dashboard could then show economic components such as delay and costs of delay at other border crossings where crossing time information will be available through similar implementations.
objective oF ReseaRch
The research described here includes development of a dashboard for a land border crossing in El Paso, Texas, at the Bridge of the Americas on the U.S.–Mexico border. This border crossing is where the radio frequency identification (RFID)–based system to mea-sure crossing times of U.S.-bound commercial vehicles was first deployed. A similar system was implemented at the Pharr–Reynosa international border crossing. By continuously measuring crossing times of commercial vehicles, the two system continuously esti-mates delay-related performance measures. The specific objectives of this research were to discuss
• The framework aspects of a dashboard tool,• The development of related KPMs at a variety of temporal
granularities based on crossing time data measured by an RFID system within the dashboard,• The economic elements of the dashboard in addition to eco-
nomic costs experienced by commercial vehicles at land border crossings and to showcase them visually, and• Some of the significant challenges associated with bringing
performance measures together to provide stakeholders with useful information.
The remainder of this paper covers the potential use of dash-boards by freight and other potential stakeholders in border regions; the dashboard framework, including meaningful and pertinent data sources; dashboard design and implementation aspects, including the key components of the dashboard as well as conversion of raw data (crossing times of commercial vehicles) into the delay measures; and the user interface of the dashboard.
stakeholDeRs oF DashboaRDs
Dashboards implemented by the agencies mentioned previously were designed to serve as communication and information tools for stake-holders. The actual content of a dashboard is important in deciding who the target audience is and how the information may be used.
Similarly, stakeholders themselves may be able to help define KPMs valuable for them. Relevant stakeholders of the proposed dashboard include the following:
• Freight community in the border region: shippers, carriers, and maquila industries (manufacturing plants in Mexico with the parent company’s administration facility in the United States) and
Rajbhandari, Saman, Vadali, and Kang 137
• Policy makers (DOTs, metropolitan planning organizations, and other governmental agencies involved in border planning or operations).
The freight community can use the information provided by the dashboard to optimize their trip-planning decisions. For instance, in a subsequent section, the use of buffer times to aid trip planning is discussed. By combining delay metrics with costs, the dashboard provides a measure of the economic and financial impact of strate-gies and actions taken by stakeholders regarding operation of bor-der crossings. Costs typically trickle down the industry linkages to affect other indicators. For instance, it is a well-known fact that maquila employment is a significant economic development and growth driver for areas in binational regions, a measure monitored by the Federal Reserve Bank. Policy makers, however, can use the dashboard to monitor performance of border crossings over time for planning and operational changes and improvements over time based on historical patterns and anticipated future conditions affecting border crossings.
DesiGn FRameWoRk oF pRoposeD DashboaRD
The design framework of the dashboard proposed here is driven by a need to relay KPMs related to delay incurred by commercial vehicles at land border crossings and the fact that such delay is intri-cately tied to economic costs. These KPMs were identified on the basis of stakeholders’ needs. From the review of both previously developed roadway congestion-related dashboards and stakeholder feedback, the proposed dashboard includes the following four broad categories of information:
• Delay-related KPMs;• Commercial vehicle volumes;• Economic information, such as freight value and volume trends
(to monitor trade activity), and exchange rates; and• Delay-related direct costs to shippers and carriers.
Delay-Related performance measures
Haralambides and Kent noted that although delays at border cross-ings are often known and expected, understanding what to mea-sure and how to measure and implement the measurement process all remain somewhat debatable (7). This critique is rather general and applies not just to border delays but also to any framework focusing on delays in general. In the case of borders, delay may be measured in the transiting process (while crossing the border) as well as within a full supply chain. This research focuses only on the transiting process. Basic questions one must ask when delay-related performance measures at border crossings are developed include how, in what form, and why such information is of value to stake-holders. For example, for freight carriers significant variations in the crossing time at border crossings can affect efficient use of their physical capital and their profit margins. Hence, providing informa-tion related to reliability and other statistics of crossing time with the cost of delay would be valuable.
Delay experienced by commercial vehicles at land border cross-ings is defined as the difference between actual crossing time and the optimal crossing, which is set as a base value since it represents
the case in which there is minimal queuing at the border. This value is necessary to isolate pure excess delay, or delay that exceeds the optimal crossing time. Arguments can be made as to what other values can represent optimal crossing times since many factors are known to influence the border crossing process. For the purposes of this dashboard, delay values for crossing times were estimated with the use of
• Additional time over mean crossing time,• Additional time over median crossing time or 50th percentile
time, and• Additional time over the 95th percentile crossing time to rep-
resent conditions associated with greater uncertainty and economic costs.
Delay measures calculated by using these three definitions of optimal crossing time vary substantially in value. In a case in which mean crossing time equals optimal crossing time, delay is determined by taking the average of all instances of crossing times experienced by individual commercial vehicles. The same process applies to the median and the 95th percentile crossing times. Even though only vehicles fitted with RFID transponders report crossing times, average delay per vehicle may be applied across the entire population since a large number of trucks crossing the border carry such transponders.
Except at a few border crossings (e.g., the Mariposa border cross-ing in Arizona), the vast majority of land border crossings have significantly high transponder penetration. An estimate provided by U.S. Customs and Border Protection suggests that the penetra-tion rate can exceed 80% at some border crossings. However, for determining crossing times it is important to identify transponders at two locations (one on the U.S. side and another on the Mexican side). Experience has shown that not all transponders are read at both locations because of the speed of vehicles, placement of antennas, and so on.
One concern put forth by stakeholders during the course of this and other related research was that recurring delays are a source of significant frustration, whereas infrequent delays are seen as unavoidable. Another factor noted by shippers is that a 1-h buffer window is budgeted for the crossing process. However, only a few maquilas indicated that this buffer was available. In addition, the perception among shippers and carriers is that changes perceived to be low in cost to implement, such as increasing the level of staff-ing (inspectors) at border crossings, could distinctly improve border delays.
Freight shippers and carriers are also concerned about the variation in travel time and about reliability (which relates to reaching destina-tions at expected times) because these factors are sometimes beyond their control. Longer travel times are an important issue, but the ship-pers and carriers can adjust their assembly process to accommodate them; it is more difficult to accommodate uncertainty in crossing times. Hence, for this research and on the basis of discussions with stakeholders, the researchers identified the following performance measures related to variability of delay. These measures are not new and have been discussed in the literature. For instance, Lyman and Bertini (8) and Cambridge Systematics et al. (9) provide an excellent discussion of delay measures in transportation planning.
The 95th percentile travel time is the simplest measure of reli-ability indicating how crossing time can vary over time. The buffer time represents the extra time that a shipper or carrier must budget to cross the border in the average time with 95% certainty. Increas-ing buffer times reduces the possibility that the trucker will arrive
138 Transportation Research Record 2285
late for an appointment. Buffer time can also be reported in different temporal granularities such as time of day, day of week, month, and so on. This time is a measure that is most useful in comparing per-formance of border crossings on an annual basis and also between two different border crossings, since it standardizes the measure by adjusting for crossing length. The buffer index is a measure of trip reliability that expresses the amount of extra buffer time needed to be on time for 95% of the trips (e.g., a late shipment on one day per month):
buffer index
th percentile crossing time a
%( )
= −95 vverage crossing time
average crossing time
( )× 1000%
All performance measures can be customized on the basis of the nature and granularity of the data that are ultimately collected and processed.
estimated Delay-Related costs to shippers and carriers
Costs refer to economic costs associated with delay to commercial vehicles in the context of cross-border trade. Costs typically include direct costs to users, indirect costs to the economy, welfare and social costs, and administrative costs. In the context of this dash-board, only direct and time-dependent variable costs to freight users are considered since inclusion of other types of cost is significantly complex and could be a subject of future work.
The dashboard includes the following direct costs to shipper and carriers based on specific type of shipper [manufacturing just-in-time (JIT); manufacturing non-JIT; agricultural perishable; agricultural other; and other shippers]:
• Shipper costs. Inventory carrying costs including capital, inven-tory damage costs for perishables, and schedule delay-related logistics costs for JIT shippers.• Carrier costs. Operating costs including fuel costs, maintenance
costs, and driver wages.
Another key point regarding delay costs is that they do not neces-sarily run in tandem with crossing times. In fact, several factors lead to a nonlinear relationship between delay cost and crossing times. To facilitate the discussion on potential nonlinearities, these factors are as follows:
• Trade cargo composition. Trade flows and their composition in terms of volume (trucks), value, and weight of JIT goods. Border crossings at El Paso are important entry points of trucks in the cen-tral west corridor and process large volumes of finished JIT cargo flowing northbound to distribution centers in El Paso and beyond.• Temporal factors (e.g., peak and off-peak times, seasonal).• Loaded or empty trucks. Empty trucks are part of the binational
drayage operation; they typically have the least direct costs but have significantly high social costs pertaining to carbon emissions.• Free and secure trade (FAST) or non–FAST classified ship-
ments. This breakdown affects both crossing times and costs; at this time, however, inability of the RFID system to differentiate between shipment types limits the ability to address the differences in delays and costs on this basis.
All of the cost calculations are based on the factor cost method and focus on time-dependent aspects of shipper and carrier costs (6). This approach attempts to evaluate the cost consequences of delay mea-sures based on time-dependent rates or values of input factors. Ojah et al. provide another example of the use of this approach in connec-tion with borders (10). A reduction of delay could lead to a release of input factors like labor or trucks to be used elsewhere. Many studies adopt this approach, and it is typically included in benefit–cost methods. The use of the factor cost approach was adopted to enhance the transparency of the process used to obtain costs and at the same time allow external inputs of factors and constants that may be changed (either because annual values are not reflective of periodic rates or because there are better sources of information).
volume of trucks and other economic information
Carrier and shipper costs are developed as time-dependent cost equations and valued by using factor prices (e.g., wages for labor, fuel prices for fuel, and interest rates for capital). Logistics costs associated with excess delays over the 95th percentile are valued by using values of reliability. The cost equations link time, volume of trucks, and cargo value. Vadali and Kang note that although delay measures may vary temporally, the valuation of all of these factors may be based on factors that do not necessarily vary temporally largely because of data availability (6). For example, fuel prices vary at most on a seasonal basis and may be easily accommodated within the framework by considering typical ranges for the duration. Fuel costs, however, vary temporally because fuel consumption itself is time varying and related to speed. Also fuel costs are treated as analogous to being stuck in traffic. Wage factors, however, rarely vary temporally, but labor usage itself is variable.
Similarly, shipper-related capital costs are time varying but val-ued at annual interest rates in much the same fashion as wage costs. Variability, uncertainty, and delay would most heavily affect the valuation of shipper-based logistics costs. This connection identi-fies the gap in value-of-reliability factors that would be sensitive to both cargo and time dependency. Furthermore, there is little to no evidence to facilitate production processes at U.S. border regions (United States–Canada or United States–Mexico) where significant volumes of trade cross. Hence, shipper-based logistics costs are cur-rently valued by using annual factors for lack of better data sources. Recognizing these factorization limitations, the authors continue to propose the use of annual factors for analyzing temporal variations as part of the framework. At the same time, availability of factors at other resolutions may be easily accommodated within the frame-work for reporting purposes. The transition to real-time reporting may then still have to contend with annual factors while attempting to capture residual variability though time-dependent cost equa-tions. This difficulty is a small price to pay since there are much larger concerns pertaining to a fuller understanding of reliability and its value in the United States, including border regions, that may be useful for enhancing an understanding of economic cost reliability.
In addition to costs, the dashboard also showcases freight value trends throughout different border crossings and border regions. In the future the dashboard could include delay-related performance measures and the economic cost of delay at border crossings where RFID systems are being implemented at the Texas–Mexico and Arizona–Mexico borders.
Rajbhandari, Saman, Vadali, and Kang 139
souRces oF Data
crossing times of u.s.-bound commercial vehicles
The Texas A&M Transportation Institute, with funding from FHWA and the Texas DOT, completed installation of RFID-based systems to measure crossing times of U.S.-bound commercial vehicles at two major ports of entry on the Texas–Mexico border. Similar systems are being installed at several other international border crossings along the Texas–Mexico and Arizona–Mexico borders. These sys-tems provide a continuous stream of crossing time data from north-bound trucks fitted with transponders issued by various agencies such as U.S. customs and tolling agencies. Data from the RFID-based system are archived in a centralized data warehouse where crossing times of trucks are aggregated into different temporal gran-ularities and converted into different delay performance measures. The data are not able to provide lane-by-lane assessments, as some studies are, or breakdowns by FAST and non–FAST status at this time [as discussed by Goodchild et al. (11)].
volume of commercial vehicles
The Bureau of Transportation Statistics compiles the cross-border volume of commercial vehicles as part of the transborder statis-tics. The primary problem with this source is that the data are not provided at the level of individual border crossings and are aggre-gated into monthly volumes. However, the Texas DOT also pro-vides monthly volume information for individual ports of entry. The lowest resolution of this data from any source is monthly.
binational economic Data
The Bureau of Transportation Statistics also compiles cross-border trade volume and value aggregated by type of commodity, trading partner, and so on as part of the transborder statistics. The Texas Center for Border Enterprise and Economic Development also maintains historical data on the top 25 traded commodities between the United States and Mexico. Exchangerate.com provides histori-cal data on U.S.–Mexican monetary exchange rates on a daily and monthly basis. Exchange rates seem to have a consistent impact on binational trade, volume of trade, and truck volume. These trade-related data are only available at annual levels, with the exception of exchange rates, which are available daily. The daily variation of exchange rates will allow for the possibility of presenting costs in daily peso-equivalent values.
DashboaRD DesiGn anD implementation
The following guiding principles were used in the design of the dashboard:
• Consultation with the stakeholders. A consultative process is necessary to obtain stakeholder input as to the usefulness of the dashboard (and its contents) as well as validity of cost components.• Scalability. The dashboard was designed so it could be inte-
grated with more than one border crossing. Stakeholder agencies such as federal and state governments on both sides of the border monitor and compare the performance of border crossings.
• Current and future technologies. The dashboard considered current and future technologies in addition to RFID.• Accessibility. Accessibility of the dashboard to stakeholders on
both sides of the border is important. The Internet provides a perfect platform for binational information sharing and exchange.
The dashboard was designed as a web-based user interface to access the static and dynamically updated charts and graphs of KPMs. The dashboard is integrated with the system to collect cross-ing times of commercial vehicles at the Bridge of the Americas, in El Paso, and can also be integrated with similar systems imple-mented at other border crossings. Procedures and algorithms are implemented in a server-based database environment and con-stantly fetch aggregated data from the archive that stores crossing time data originating from the RFID deployment at other border crossings.
Design Requirements
The dashboard was envisioned to relay the cost of delay and other delay-related performance measures by using static reports (repre-sented by charts and graphs). However, the data in the charts and graphs are dynamically updated with precoded algorithms. It was proposed that the dashboard would also serve as an early warn-ing mechanism that may be acted upon when a choice is actively possible or to evaluate the effectiveness of policy actions already adopted by the users and policy makers. The following predefined temporal granularities represent these charts and graphs:
• Annual trends,• Monthly trends,• Weekly trends,• Day-of-the-week trends,• Most recent week or month, and• User-specified time periods.
By using charts and reports related to delays and the cost of delay, users and policy makers will be able to make more informed planning and policy decisions for border crossings by being able to track, evaluate effects of changes made, and monitor changes. The dashboard will also provide users with a robust source of key performance indicators and associated data to make such decisions regarding border crossings.
high- and low-level architecture
The dashboard was designed to act as a human interface to access KPMs and the economic cost of delay at select border crossings on the U.S.–Mexican border. The dashboard is fully web-implemented in a client-server architecture in which all data processing requests from clients or users will be performed by one or more servers. This setup will allow faster transfer of results to users and will not force users to have high-speed, powerful computers or mobile devices.
The design of the dashboard essentially consists of the following physical (hardware and software) components (Figure 1):
1. The database server houses the data warehouse, which includes relational database tables, stored procedures, triggers, and algo-rithms to retrieve data from intelligent transportation systems (ITS) field devices; the server then processes and manages the archived
140 Transportation Research Record 2285
data to convert to different performance measures, which form the dashboard.
2. The web server houses the web pages and other programming modules to request data from the database server and interact with the end users.
3. The report server is a virtual server and houses charts and graphs from precoded queries. The virtual server typically resides within the database server and includes charts and graphs that are linked with tables in the database based on the user’s requests. These charts and graphs are embedded within web pages; users retrieve those charts and graphics by using precoded queries but can modify parameters in the query.
4. Web pages reside within the web server and are published on the Internet. End users interact with the dashboard content via these web pages.
5. End users are individuals who request data from the server while accessing the dashboard.
The functional components of the prototype consist of the following:
1. Data extractors receive data from ITS field devices such as RFID stations and vehicle detectors. The extractors filter the received data and send them to predefined tables in the data warehouse. They
Internet
Database Server Web Server
RFID Field Devices
Internet
End Users
End Users Archived Data
Pre-definedReports
Web Pages
Data Warehouse
Data Extractors
DASHBOARD(Illustrated in
Figures 2 and 3)
FIGURE 1 Physical and functional components of dashboard tool.
Rajbhandari, Saman, Vadali, and Kang 141
also include programs that read data from other agency websites and sources and send the data to the data warehouse.
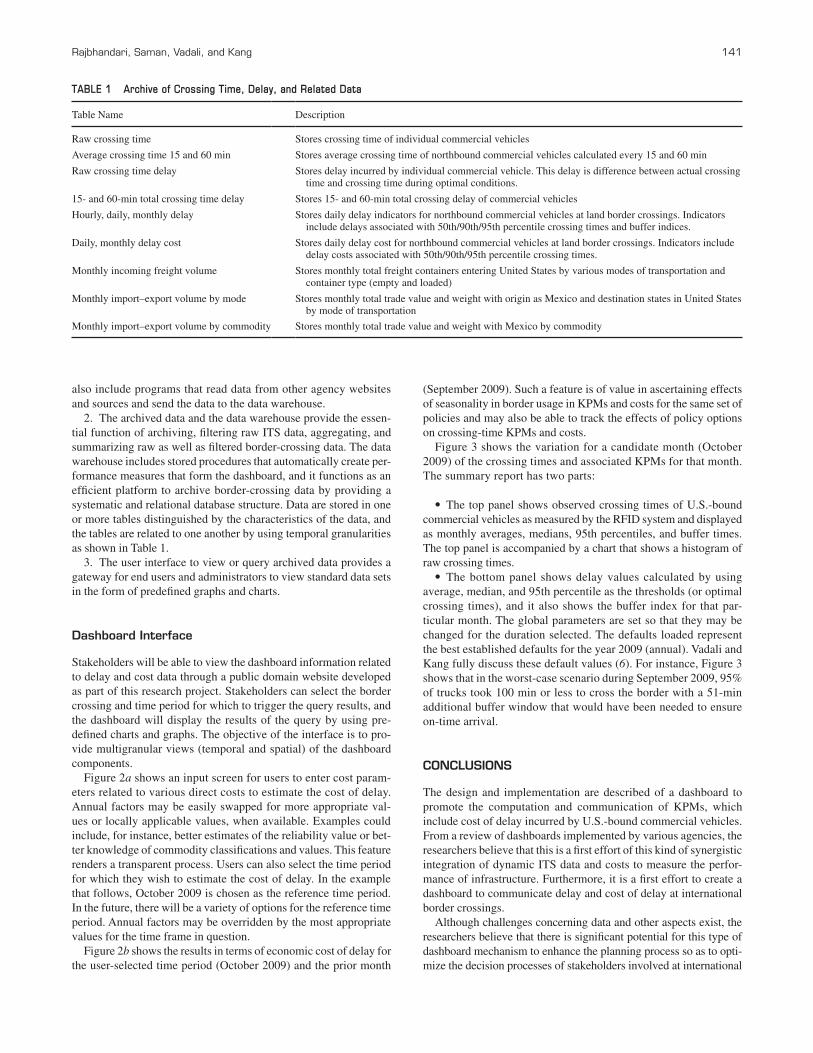
2. The archived data and the data warehouse provide the essen-tial function of archiving, filtering raw ITS data, aggregating, and summarizing raw as well as filtered border-crossing data. The data warehouse includes stored procedures that automatically create per-formance measures that form the dashboard, and it functions as an efficient platform to archive border-crossing data by providing a systematic and relational database structure. Data are stored in one or more tables distinguished by the characteristics of the data, and the tables are related to one another by using temporal granularities as shown in Table 1.
3. The user interface to view or query archived data provides a gateway for end users and administrators to view standard data sets in the form of predefined graphs and charts.
Dashboard interface
Stakeholders will be able to view the dashboard information related to delay and cost data through a public domain website developed as part of this research project. Stakeholders can select the border crossing and time period for which to trigger the query results, and the dashboard will display the results of the query by using pre-defined charts and graphs. The objective of the interface is to pro-vide multigranular views (temporal and spatial) of the dashboard components.
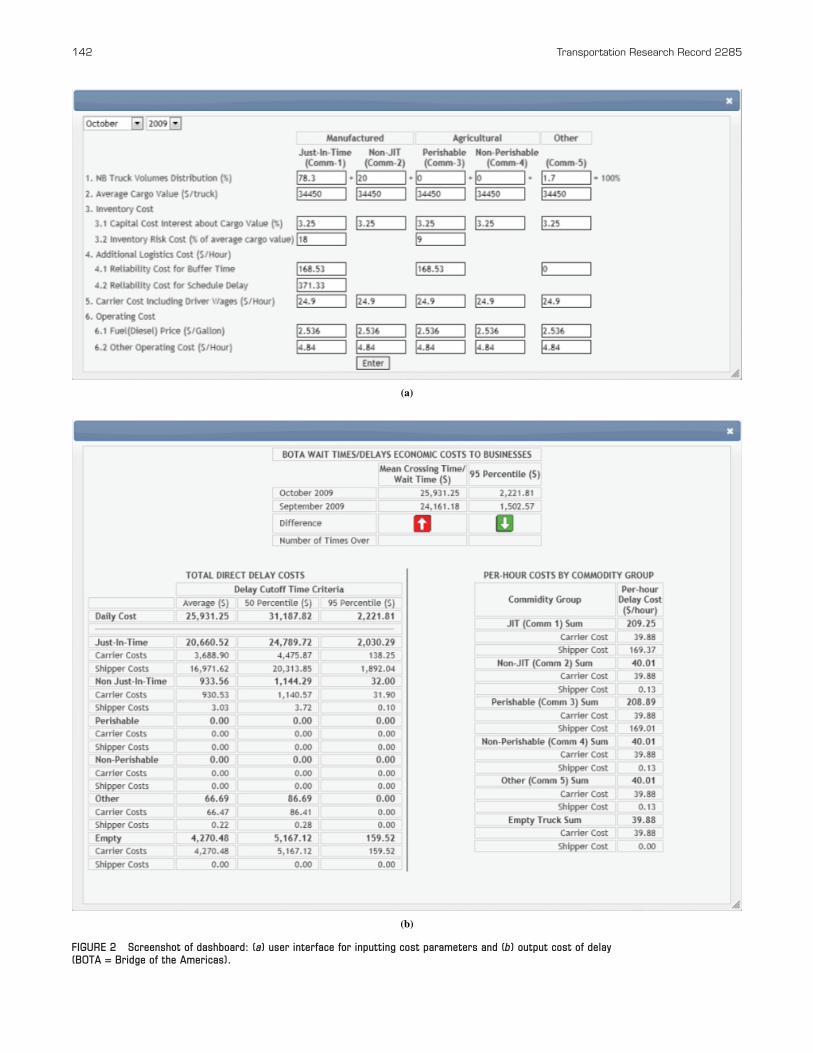
Figure 2a shows an input screen for users to enter cost param-eters related to various direct costs to estimate the cost of delay. Annual factors may be easily swapped for more appropriate val-ues or locally applicable values, when available. Examples could include, for instance, better estimates of the reliability value or bet-ter knowledge of commodity classifications and values. This feature renders a transparent process. Users can also select the time period for which they wish to estimate the cost of delay. In the example that follows, October 2009 is chosen as the reference time period. In the future, there will be a variety of options for the reference time period. Annual factors may be overridden by the most appropriate values for the time frame in question.
Figure 2b shows the results in terms of economic cost of delay for the user-selected time period (October 2009) and the prior month
(September 2009). Such a feature is of value in ascertaining effects of seasonality in border usage in KPMs and costs for the same set of policies and may also be able to track the effects of policy options on crossing-time KPMs and costs.
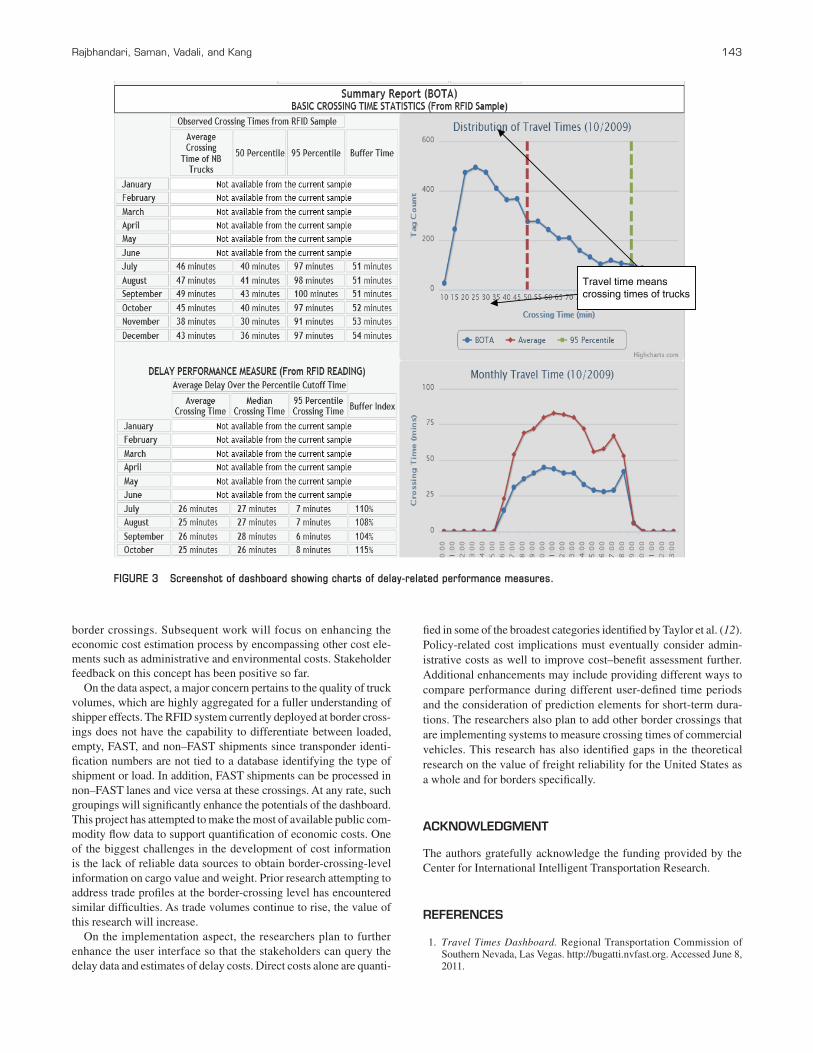
Figure 3 shows the variation for a candidate month (October 2009) of the crossing times and associated KPMs for that month. The summary report has two parts:
• The top panel shows observed crossing times of U.S.-bound commercial vehicles as measured by the RFID system and displayed as monthly averages, medians, 95th percentiles, and buffer times. The top panel is accompanied by a chart that shows a histogram of raw crossing times.• The bottom panel shows delay values calculated by using
average, median, and 95th percentile as the thresholds (or optimal crossing times), and it also shows the buffer index for that par-ticular month. The global parameters are set so that they may be changed for the duration selected. The defaults loaded represent the best established defaults for the year 2009 (annual). Vadali and Kang fully discuss these default values (6). For instance, Figure 3 shows that in the worst-case scenario during September 2009, 95% of trucks took 100 min or less to cross the border with a 51-min additional buffer window that would have been needed to ensure on-time arrival.
conclusions
The design and implementation are described of a dashboard to promote the computation and communication of KPMs, which include cost of delay incurred by U.S.-bound commercial vehicles. From a review of dashboards implemented by various agencies, the researchers believe that this is a first effort of this kind of synergistic integration of dynamic ITS data and costs to measure the perfor-mance of infrastructure. Furthermore, it is a first effort to create a dashboard to communicate delay and cost of delay at international border crossings.
Although challenges concerning data and other aspects exist, the researchers believe that there is significant potential for this type of dashboard mechanism to enhance the planning process so as to opti-mize the decision processes of stakeholders involved at international
TABLE 1 Archive of Crossing Time, Delay, and Related Data
Table Name Description
Raw crossing time Stores crossing time of individual commercial vehicles
Average crossing time 15 and 60 min Stores average crossing time of northbound commercial vehicles calculated every 15 and 60 min
Raw crossing time delay Stores delay incurred by individual commercial vehicle. This delay is difference between actual crossing time and crossing time during optimal conditions.
15- and 60-min total crossing time delay Stores 15- and 60-min total crossing delay of commercial vehicles
Hourly, daily, monthly delay Stores daily delay indicators for northbound commercial vehicles at land border crossings. Indicators include delays associated with 50th/90th/95th percentile crossing times and buffer indices.
Daily, monthly delay cost Stores daily delay cost for northbound commercial vehicles at land border crossings. Indicators include delay costs associated with 50th/90th/95th percentile crossing times.
Monthly incoming freight volume Stores monthly total freight containers entering United States by various modes of transportation and container type (empty and loaded)
Monthly import–export volume by mode Stores monthly total trade value and weight with origin as Mexico and destination states in United States by mode of transportation
Monthly import–export volume by commodity Stores monthly total trade value and weight with Mexico by commodity
142 Transportation Research Record 2285
(a)
(b)
FIGURE 2 Screenshot of dashboard: (a) user interface for inputting cost parameters and (b) output cost of delay (BOTA = Bridge of the Americas).
Rajbhandari, Saman, Vadali, and Kang 143
border crossings. Subsequent work will focus on enhancing the economic cost estimation process by encompassing other cost ele-ments such as administrative and environmental costs. Stakeholder feedback on this concept has been positive so far.
On the data aspect, a major concern pertains to the quality of truck volumes, which are highly aggregated for a fuller understanding of shipper effects. The RFID system currently deployed at border cross-ings does not have the capability to differentiate between loaded, empty, FAST, and non–FAST shipments since transponder identi-fication numbers are not tied to a database identifying the type of shipment or load. In addition, FAST shipments can be processed in non–FAST lanes and vice versa at these crossings. At any rate, such groupings will significantly enhance the potentials of the dashboard. This project has attempted to make the most of available public com-modity flow data to support quantification of economic costs. One of the biggest challenges in the development of cost information is the lack of reliable data sources to obtain border-crossing-level information on cargo value and weight. Prior research attempting to address trade profiles at the border-crossing level has encountered similar difficulties. As trade volumes continue to rise, the value of this research will increase.
On the implementation aspect, the researchers plan to further enhance the user interface so that the stakeholders can query the delay data and estimates of delay costs. Direct costs alone are quanti-
fied in some of the broadest categories identified by Taylor et al. (12). Policy-related cost implications must eventually consider admin-istrative costs as well to improve cost–benefit assessment further. Additional enhancements may include providing different ways to compare performance during different user-defined time periods and the consideration of prediction elements for short-term dura-tions. The researchers also plan to add other border crossings that are implementing systems to measure crossing times of commercial vehicles. This research has also identified gaps in the theoretical research on the value of freight reliability for the United States as a whole and for borders specifically.
acknoWleDGment
The authors gratefully acknowledge the funding provided by the Center for International Intelligent Transportation Research.
ReFeRences
1. Travel Times Dashboard. Regional Transportation Commission of Southern Nevada, Las Vegas. http://bugatti.nvfast.org. Accessed June 8, 2011.
FIGURE 3 Screenshot of dashboard showing charts of delay-related performance measures.
Travel time meanscrossing times of trucks
144 Transportation Research Record 2285
2. Congestion Dashboard. FHWA, U.S. Department of Transportation. http://ops.fhwa.dot.gov/publications/tt_reliability/brochure. Accessed June 8, 2011.
3. Oregon Department of Transportation Performance Dashboard. Oregon Department of Transportation, Salem. http://www.oregon.gov/Oregon DOT/CS/PERFORMANCE/2010Dashboard.swf. Accessed June 8, 2011.
4. Gray Notebook. Washington State Department of Transportation, Olym-pia. http://www.wsdot.wa.gov/NR/rdonlyres/8B4A860F-B9AF-4B09-A545-FEF1E9414BED/0/GNB_Dashboard_Dec10.pdf. Accessed June 8, 2011.
5. Cascade Gateway Dashboard. Whatcom Council of Governments, Bellingham, Wash. www.CascadeGatewayData.com. Accessed June 9, 2011.
6. Vadali, S., and D. Kang. Border Delays and Economic Impact to the Freight Sector: An Exploration of the El Paso Ports of Entry. Texas Transportation Institute Report. Center for International Intelligent Transportation Research, College Station, Tex., 2011.
7. Haralambides, H., and M. P. Kent. Supply Chain Bottlenecks: Border Crossing Inefficiencies between United States and Mexico. International Journal of Transport Economics, Vol. XXXI, No. 2, 2004, pp. 171–183.
8. Lyman, K., and R. L. Bertini. Using Travel Time Reliability Measures to Improve Regional Transportation Planning and Operations. In Transpor-
tation Research Record: Journal of the Transportation Research Board, No. 2046, Transportation Research Board of the National Academies, Washington, D.C., 2008, pp. 1–10.
9. Cambridge Systematics, Dowling Associates, System Metrics Group, and Texas Transportation Institute. NCHRP Report 168: Cost-Effective Performance Measures for Travel Time Delay, Variations, and Reli-ability. Transportation Research Board of the National Academies, Washington, D.C., 2008.
10. Ojah, M., J. Villa, W. Stockton, D. Luskin, and R. Harrison. Truck Transportation through Border Ports of Entry: Analysis of Coordi-nation Systems. Texas Transportation Institute, College Station, 2002. http://www.borderplanning.fhwa.dot.gov/TTIstudy/FOA_english.htm. Accessed June 8, 2010.
11. Goodchild, A., S. Globerman, and S. Albrecht. Service Time Variability at Blaine, Washington, Border Crossing and Impact on Regional Supply Chains. In Transportation Research Record: Journal of the Transporta-tion Research Board, No. 2066, Transportation Research Board of the National Academies, Washington, D.C., 2008, pp. 71–78.
12. Taylor, J., D. Robideaux, and G. Jackson. US-Canada Transportation and Logistics: Border Impacts and Costs, Causes, and Possible Solutions. Transportation Journal, Vol. 43, 2004.
The Freight Transportation Data Committee peer-reviewed this paper.