Page 1
Dat is What the PM Said: A Quantitative Analysis of Prime Minister
Chrétien’s Pronunciation of English Voiced Dental Fricatives
Geoffrey Stewart Morrison
University of Ottawa1
A sociolinguistic–variationist type analysis was applied to the pronunciation of
the English voiced dental fricative by one Francophone Canadian, Prime
Minister Jean Chrétien. Fricative –realisations were favoured in an interview
setting, and plosive –realisations were favoured in formal speeches, attributable
to difficulties associated with the task of reading aloud. –realisations were
favoured following fricatives, and realisations were favoured following voiceless
but not voiced plosives; the latter result is proposed to be due to differences in
intra–oral pressure. realisations were favoured preceding mid–high vowels, but –
realisations were favoured preceding , explainable in terms of an articulatory
effect that also produces affrication in Canadian–French preceding high–front
vowels. Statistical analyses were conducted using GoldVarb and SPSS software.
The latter allows for tests of the significance of individual factors and of factor
group interactions.
La prononciation de la fricative dentale voisée anglaise chez un locuteur
canadien francophone, le Premier ministre Jean Chrétien, a été soumise à une
analyse variationniste sociolinguistique. Les réalisations fricatives ont été
favorisées en contexte d’entrevue et les réalisations plosives dans les discours
formels, ce qui peut être attribué aux difficultés associées à la lecture à voix
haute. Les réalisations ont été favorisées après des fricatives et les réalisations
ont été favorisées après des occlusives sourdes, mais non voisées; nous
proposons que ce dernier résultat est relié à la pression intra–buccale. Les
réalisations ont été favorisées devant les voyelles mi-hautes, alors que les
réalisations ont été favorisées devant , ce qui peut être expliqué par un effet
articulatoire qui produit également l’affrication en français canadien de devant
les voyelles antérieures hautes. Des analyses statistiques ont été réalisées avec
les logiciels GoldVarb et SPSS, ce dernier permettant de tester la significativité
des facteurs individuels et des interactions entre groupes de facteurs.
1. Introduction
Francophone Canadians have difficulty discriminating perceptually between
English and (Polka, Colantonio, and Sundara 2001). When speaking English,
Francophone Canadians often substitute dental plosives for English dental
fricatives (Rvachew and Jamieson 1995, Teasdale 1997, Brannen 2002), and this
is one of the most noticeable features of a Franco–Canadian accent (Gatbonton
1978). The substitution is not unexpected given that French lacks dental fricatives
but has coronal plosives that are generally realised as apicolaminal and dental
1Now at University of Alberta. Correspondence relating to this paper should be addressed to
[email protected]
Page 2
Geoffrey Stewart Morrison
2
(Charbonneau and Jacques 1972, Dart 1991)2 Canadian–French speakers, who
substitute French and for English and respectively, differ from European–
French speakers, who substitute and . The difference has been attributed to the
fact that whilst European–French tends to be dental (Dart 1991), Canadian–
French is alveolar (Teasdale 1997, Brannen 2002). For Canadians the dental
plosive is the closest L1 sound to the English dental fricative, but for Europeans
the strident dental fricative is the closest.
Gatbonton (1978) found that, in a read-aloud task, the percentage of
English produced by native Canadian French speakers that were correctly
perceived by native Canadian English listeners (i.e., not perceived as English )
was dependent on phonological context: The correct identification rates were 43%
following vowels, 38% following liquids, 27% following voiced plosives and
nasals, 35% following voiceless fricatives 35%, and 14% following voiceless
plosives.
This paper reports on a case study of the production of L2–English voiced
dental fricatives, , by one prominent L1–Canadian–French speaker, The Right
Honourable Jean Chrétien, Prime Minister of Canada from 1993 to 2003. A
comparison is made of Mr. Chrétien’s –productions in two different social
settings: a television interview and speeches in the House of Commons. The
linguistic variables considered are the preceding and following phonetic segments.
The study is quantitative, using a variationist style of analysis common in
sociolinguistic research. The paper is also intended to introduce students of
variationist sociolinguistics to some of the advantages of software packages
providing options beyond those available in VARBRUL and GoldVarb.
Mr. Chrétien’s use of both French and English has been a matter of public
comment in Canada for many years. Mr. Chrétien’s French has been observed to
vary from highly informal française populaire to a much more formal style,
2Dart (1991) found that, for and , French speakers from northern France and Belgium produced
more dento-laminal and dento-apicolaminal realisations than did English speakers from the west
coast of the United States, who primarily produced apical realisations that were further back.
However, there was considerable variation and overlap between the two groups, and it was not true
that French speakers always produced dental plosives or that English speakers always produced
alveolar plosives.
Page 3
Dat is What the PM Said
3
although this style would not be classed as international standard French (P.
Balcom, personal communication, August 29, 2003). Whilst Mr. Chrétien trained
as a lawyer and practised law, a profession in which speaking eloquently and
clearly is essential, as a politician he has portrayed himself as “the little guy from
Shawinigan,” a down to earth man of the people, and some commentators have
suggested that his folksy speaking style is a deliberate attempt to project this
image. Mr. Chrétien is renowned in the Canadian Anglophone population for his
peculiar use of the English language. Despite this, Mr. Chrétien is also capable of
producing quite eloquent English which, although accented, deviates little from
the syntactic norms of educated Anglophone Canadian usage. Again, there has
been speculation that Mr. Chrétien use of “poor” English is at least in part
deliberate.3 The public interest in this particular individual and his speech
warrants case studies on Mr. Chrétien’s use of language. The goal of the present
study is therefore to describe stylistic variation of a phonetic variable in Mr.
Chrétien’s English in particular. The study is limited in scope and only considers
articulatory and processing constraints, rather than political motivation, as
possible causes for variation found. The degree to which findings of the present
study are generalisable to a larger population may be limited due to the fact that
Mr. Chrétien is a rather unique individual. It should be noted that Mr. Chrétien
learnt English relatively late in life: he was born in 1934 and claims to have
spoken hardly any English as late as the early 1980s. Mr. Chrétien has also
suffered from a partial facial paralysis since childhood, and this may act as a
speech impedement.
The paper proceeds first with a description of the interview and speeches
used as a source of data. This is followed by a description of the method and
criteria used to extract and code the dependent variable and independent
linguistic variables preceding and following segments. Results of statistical
analyses are followed by a discussion of possible causes for the variation observed
in Mr. Chrétien’s .
3
Rampton (1987) suggests that non–native speakers may deliberately emphasise their status as non–native speakers for
social effect, although the motivation of the participants in Rampton’s study may have differed from potential motivations
in the case of Mr. Chrétien.
Page 4
Geoffrey Stewart Morrison
4
2. Method
All instances of Mr. Chrétien’s variants were extracted from the recordings of the
interview and speeches. The –tokens and their social setting and phonetic contexts
were coded and subjected to binary logistic regression analyses (Sankoff 1988,
Young and Bayley 1996, Hosmer and Lemeshow 2000, Pampel 2000, Menard
2002; Paolillo 2002). The data sources and each of the steps in the analysis are
discussed in detail below.
2.1 Sources
Samples of Mr. Chrétien speaking were taken from two social settings: One
setting was an interview broadcast on the CBC television news programme The
National on December 18, 2002. Topics discussed were Iraq, health care, and the
leadership of the Liberal party. The other setting consisted of two speeches given
in the House of Commons on September 17 and October 15, 2001, on the subjects
of the terrorist attacks in the United States and the international campaign against
terror. The interview and speeches were obtained from the internet where they
were available as streaming audio–video files with more–or–less accurate
transcripts. Sources of sufficient length but closer in time were not available. It
was unfortunately not possible to obtain sources of sufficient length which would
have represented Mr. Chrétien’s truly extemporaneous speech, such as when
asked unexpected questions during a media scrum. Whereas the Prime Minister
appeared to be speaking extemporaneously during the interview, it is more than
likely that he received the questions beforehand and had an opportunity to
compose his answers prior to the actual recording of the interview. There was,
however, no sign that he was reading from a Teleprompter or other notes. In
contrast, the House of Commons speeches were clearly read from papers which
were visible in the video images.
To facilitate identification of potential –tokens, all occurrences of “th” in the
transcripts were highlighted. The streaming audio–video files were rerecorded as
audio files and saved on the local hard–drive (only the English portions of the
Page 5
Dat is What the PM Said
5
speeches were included in the new audio files). Locally stored files in audio
format were more amenable to finding and listening multiple times to relevant
parts of the recording. The length of the interview was 22 minutes (including the
interviewer’s questions and comments), and the combined length of the speeches
(excluding the French portions) was 29½ minutes.
2.2 Coders
Coders were two native English speakers. The first coder (the author) was raised
in the UK, but had lived in Anglophone regions of Canada (Ontario, Nova Scotia,
and British Columbia) for a total of eight years, and had not lived in any other
English–speaking country for over twelve years. The second coder was raised in
British Columbia and had moved to Ontario three years prior to his participation
in the study. Both participants were in their early thirties and reported no hearing
difficulties.
2.3 –token extraction and coding
The two coders listened to the recordings over headphones, and independently
coded every occurrence of as either or .4 Coding was based on the coders’
perception of whether the phoneme was realised as a fricative or a plosive.
Native–speaker perception was deemed the relevant factor for determining
whether an apparent English – substitution had been made. Square brackets are
used in this paper to indicate particular realisations of the phoneme; however, the
symbols in square brackets represent perceived phonemes rather than articulatory
or acoustic phonetic detail. Brannen (2002) found that Canadian Anglophones
performed poorly on an AXB discrimination test for dental versus alveolar , so it
was considered safe to assume that the coders in the present study would identify
dental as English alveolar . Cases of disagreement between the two coders were
recoded and the outstanding cases of disagreement (6.7% of total) were deemed to
be ambiguous and were not included in the statistical analysis. There were a
number of false starts where the same word was repeated, sometimes with the
same and sometimes with a different variant of ; since repetitions are clearly not
independent observations, none of the repetitions were included in the coding.
4
The first coder also corrected the transcripts where they deviated from the audio files.
Page 6
Geoffrey Stewart Morrison
6
The potential linguistic cause of variation in –production that was of
interest in the present study was coarticulation with the immediately adjacent
segments. Therefore, the first coder also phonetically transcribed the segments
preceding and following each –token and they were then coded for inclusion in
the statistical analyses.
2.4 Preceding–segment coding
The dependent variable, the –variant, was crosstabulated with the independent
variables preceding–segment and social–setting to help determine a coding system
for the preceding segment. Certain segments resulted in a small or zero count in
some cells, and so for statistical analysis it was desirable to combine these into
larger groupings. Groupings considered were those that combined segments with
similar trends in their distribution, e.g., could potentially be combined with
because both corresponded with a greater number of –realisations than –
realisations, but could not be combined with since the latter corresponded with a
greater number of –realisations. Groupings considered were also required to have
some phonetic basis, e.g., and could potentially be combined into a fricative
class, or and could potentially be combined into an alveolar class.
The coding scheme for the preceding segment5 was based on aerodynamic
considerations: Ceteris paribus, higher intraoral pressure during a closure would
result in a faster more plosive–like release. Since intraoral pressure is greater
during voiceless than voiced plosives (Malécot 1966, Stevens 1998: 469), a
greater number of plosive –realisations of are predicted following a voiceless
plosive. It was hypothesised that intraoral pressure or degree of opening may also
be a relevant factor in other manners of articulation. The preceding segment was
therefore coded into manner classes in order of decreasing intraoral pressure:
voiceless plosive, fricative6 (and affricate), voiced plosive, nasal, liquid, and
5
It was decided to group consonant clusters preceding the –variant according to the last member of the cluster. For
example, (“and the” was a common sequence) was grouped with , on the assumption that the last member of the cluster
would have the principle coarticulatory influence on the , i.e., relative to the onset of the , velar closure was assumed to
occur earlier for than for and therefore the transition into following was expected to be more similar to the transition
following than that following . This decision also had a practical motivation, namely the difficulty of deciding whether
was present of not in an sequence especially when the could be realised as . 6
Voiceless fricatives have a higher intraoral pressure than voiced fricatives (Malécot 1968, Stevens 1998: 380–383, 477–
480); however, since there were only nine instances of voiced fricatives in the data, they were coded together with
Page 7
Dat is What the PM Said
7
vowel, plus pause. This coding scheme is hereafter referred to as the preceding–
segment factor group. The resulting groupings are almost identical to those
identified by Gatbonton (1978) and the group ordering (apart from being listed in
reverse) is the same (see §1 above).
Other coding schemes such as presence of preceding coronal closure were
considered and tested by not found to produce statistically significant results and
for sake of brevity will not be reported here.
2.5 Following–vowel coding
Segments following the were all vowels and were coded as high , mid–high ,
mid–low , or schwa . This coding scheme is hereafter referred to as the following–
vowel factor group. Schwa was included as a distinct category since it accounted
for a large proportion (approximately 45%) of the following vowels in the data.
Since requires a high fronted tongue position, relatively close to the tongue
position for , the tongue may move relatively slowly towards the target compared
to other vowel targets and may remain close to the roof of the mouth resulting in
affricated release (Ohala 1983). In Canadian French, and are realised as affricates
before and (Charbonneau and Jaques 1972, Marchal 1980).7 Gatbonton (1978)
found that Francophone Canadians’ affricated realisations of English were
perceived as by native English speakers. It was therefore predicted that
following– would favour realisations of English that would be perceived as by
the Anglophone coders in the present study. This hypothesis is discussed at
greater length in section 4.3 below.
3. Results
A total of 552 tokens were extracted from the raw data, 272 from the speeches
voiceless fricatives as the fricative factor, to which were also added the four affricates in the data. 7
Although the laxed allophone of Canadian French also triggers affrication of and (Charbonneau and Jaques 1972), in
crosstablulations with preceding–segment and social–setting Mr. Chrétien’e English clearly patterned with and not with .
The fact that French and English are represented using the same phonetic symbol does not imply that they are articulated
in the same way, and in fact Escudero and Polka (2003) found that Canadian French and are more similar acoustically
than are Canadian English and . Their data suggests that English is lower than French and therefore English would be
less likely to cause affrication than French . Mr. Chrétien’s French has not been analysed to determine whether he
affricates before , nor whether he produces his English in the same way as his French .
Page 8
Geoffrey Stewart Morrison
8
and 280 from the interview. The vast majority of occurrences of were word initial
in words such as “the,” “these,” “that,” “their,” “there,” and “they,” with only 11
occurrences of word medial in words such as “other.” The coders failed to agree
on 37 tokens (6.7% of the total extracted), 17 from the speeches and 20 from the
interview. This left a total of 515 tokens for statistical analysis, 255 from the
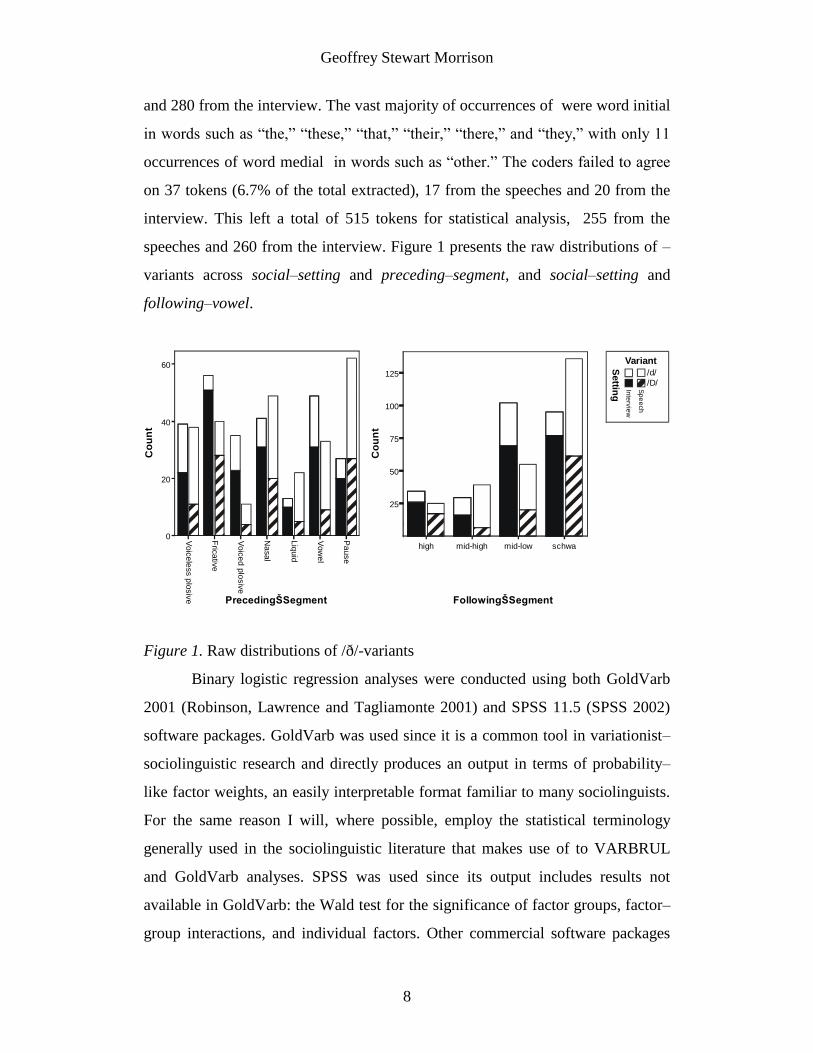
speeches and 260 from the interview. Figure 1 presents the raw distributions of –
variants across social–setting and preceding–segment, and social–setting and
following–vowel.
Figure 1. Raw distributions of /ð/-variants
Binary logistic regression analyses were conducted using both GoldVarb
2001 (Robinson, Lawrence and Tagliamonte 2001) and SPSS 11.5 (SPSS 2002)
software packages. GoldVarb was used since it is a common tool in variationist–
sociolinguistic research and directly produces an output in terms of probability–
like factor weights, an easily interpretable format familiar to many sociolinguists.
For the same reason I will, where possible, employ the statistical terminology
generally used in the sociolinguistic literature that makes use of to VARBRUL
and GoldVarb analyses. SPSS was used since its output includes results not
available in GoldVarb: the Wald test for the significance of factor groups, factor–
group interactions, and individual factors. Other commercial software packages
high mid-high mid-low schwa
25
50
75
100
125C
ou
nt
PrecedingŠSegment
0
20
40
60
Co
un
t
/d/
/D/
Variant
Sp
ee
ch
Inte
rvie
w
Settin
g
Voic
ele
ss p
losiv
e
Fric
ativ
e
Voic
ed
plo
siv
e
Na
sal
Liq
uid
Vow
el
Pa
use
FollowingŠSegment
Page 9
Dat is What the PM Said
9
provide the same options,8 and SPSS was chosen because of its availability to the
author. Apart from possible rounding errors, SPSS and GoldVarb can produce
identical factor weights and log likelihoods. The Appendix describes how to
obtain GoldVarb–like output using SPSS.
Step–up and step–down factor–group entry in GoldVarb (more accurate
method, averaging by centering factors, step–up/down threshold .05001) and
SPSS (stepwise entry and removal of .05 for probability of likelihood–ratio
statistic based on maximum partial likelihood estimates) converged on a model
including all of the factor groups social–setting, preceding–segment, and
following–vowel. All factor groups also reached significance on the Wald statistic
in a simple effects model in SPSS, see Table 1. A model including all two–way
interactions, and a model including all two–way interactions and the three–way
interaction failed to find any interactions that reached significance on the Wald
statistic.
8
SAS is comparable to SPSS with a few extra options for logistic regression, STATA will perform certain types of logistic
regression analysis that are not available in SPSS or SAS.
Page 10
Geoffrey Stewart Morrison
10
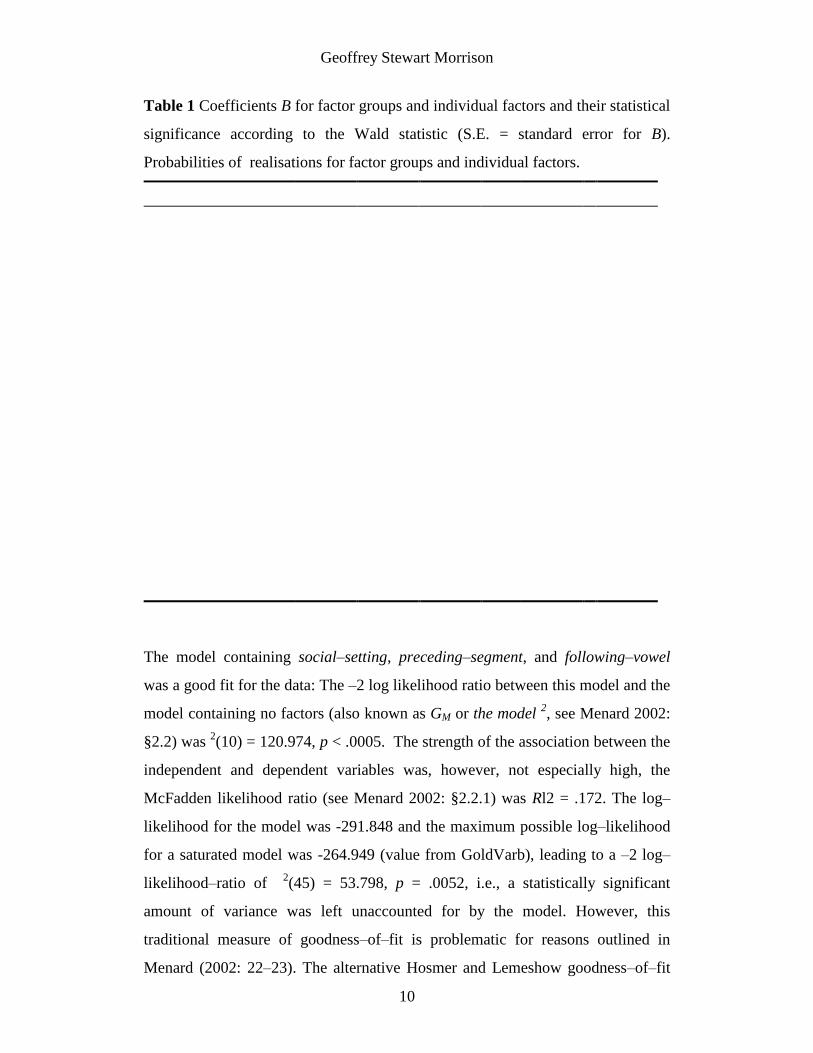
Table 1 Coefficients B for factor groups and individual factors and their statistical
significance according to the Wald statistic (S.E. = standard error for B).
Probabilities of realisations for factor groups and individual factors.
The model containing social–setting, preceding–segment, and following–vowel
was a good fit for the data: The –2 log likelihood ratio between this model and the
model containing no factors (also known as GM or the model 2, see Menard 2002:
§2.2) was 2(10) = 120.974, p < .0005. The strength of the association between the
independent and dependent variables was, however, not especially high, the
McFadden likelihood ratio (see Menard 2002: §2.2.1) was Rl2 = .172. The log–
likelihood for the model was -291.848 and the maximum possible log–likelihood
for a saturated model was -264.949 (value from GoldVarb), leading to a –2 log–
likelihood–ratio of 2(45) = 53.798, p = .0052, i.e., a statistically significant
amount of variance was left unaccounted for by the model. However, this
traditional measure of goodness–of–fit is problematic for reasons outlined in
Menard (2002: 22–23). The alternative Hosmer and Lemeshow goodness–of–fit
Page 11
Dat is What the PM Said
11
index, 2(8) = 6.20, p = .624 (values from SPSS), indicated that the model was a
good fit (the p value was high). In GoldVarb only 5 of the 55 cell–error values
exceeded the 2.0 criterion suggested by Young and Bayley (1996) and none
exceeded the 3.84 criterion suggested by Paolillo (2002: 82), and the cell total
chi–squared was 2(10) = 43.679, p < .001.
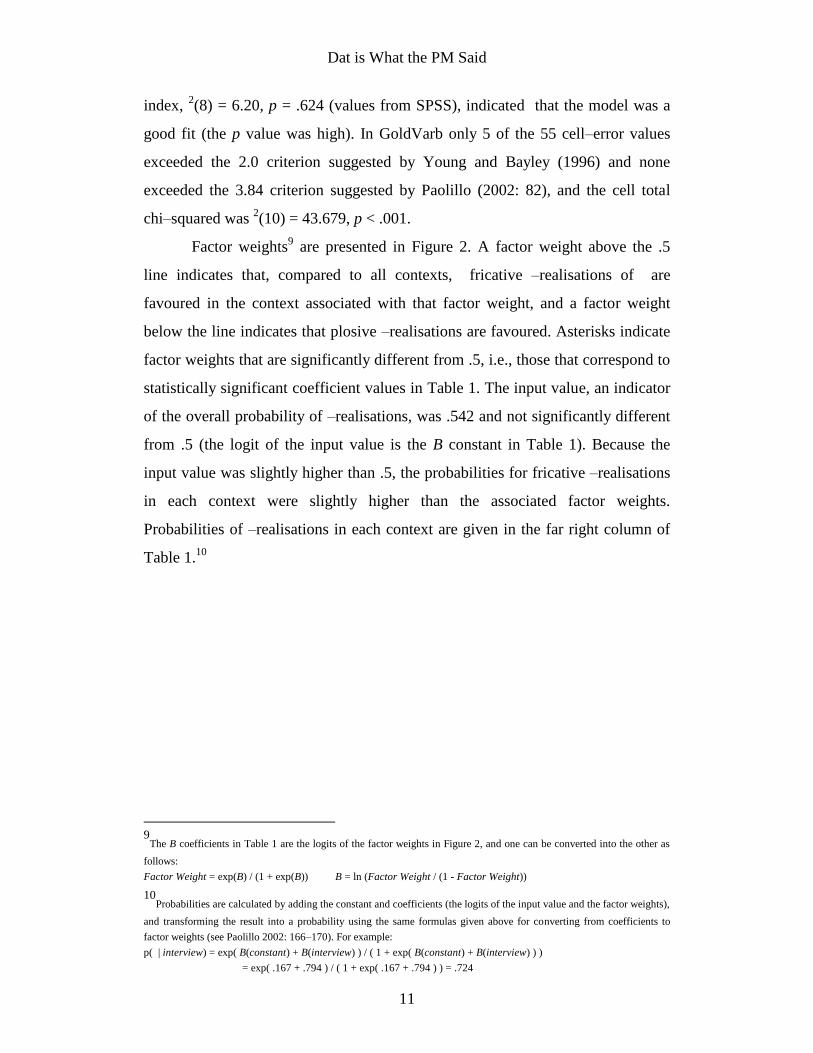
Factor weights9 are presented in Figure 2. A factor weight above the .5
line indicates that, compared to all contexts, fricative –realisations of are
favoured in the context associated with that factor weight, and a factor weight
below the line indicates that plosive –realisations are favoured. Asterisks indicate
factor weights that are significantly different from .5, i.e., those that correspond to
statistically significant coefficient values in Table 1. The input value, an indicator
of the overall probability of –realisations, was .542 and not significantly different
from .5 (the logit of the input value is the B constant in Table 1). Because the
input value was slightly higher than .5, the probabilities for fricative –realisations
in each context were slightly higher than the associated factor weights.
Probabilities of –realisations in each context are given in the far right column of
Table 1.10
9
The B coefficients in Table 1 are the logits of the factor weights in Figure 2, and one can be converted into the other as
follows:
Factor Weight = exp(B) / (1 + exp(B)) B = ln (Factor Weight / (1 - Factor Weight))
10Probabilities are calculated by adding the constant and coefficients (the logits of the input value and the factor weights),
and transforming the result into a probability using the same formulas given above for converting from coefficients to
factor weights (see Paolillo 2002: 166–170). For example:
p( | interview) = exp( B(constant) + B(interview) ) / ( 1 + exp( B(constant) + B(interview) ) )
= exp( .167 + .794 ) / ( 1 + exp( .167 + .794 ) ) = .724
Page 12
Geoffrey Stewart Morrison
12
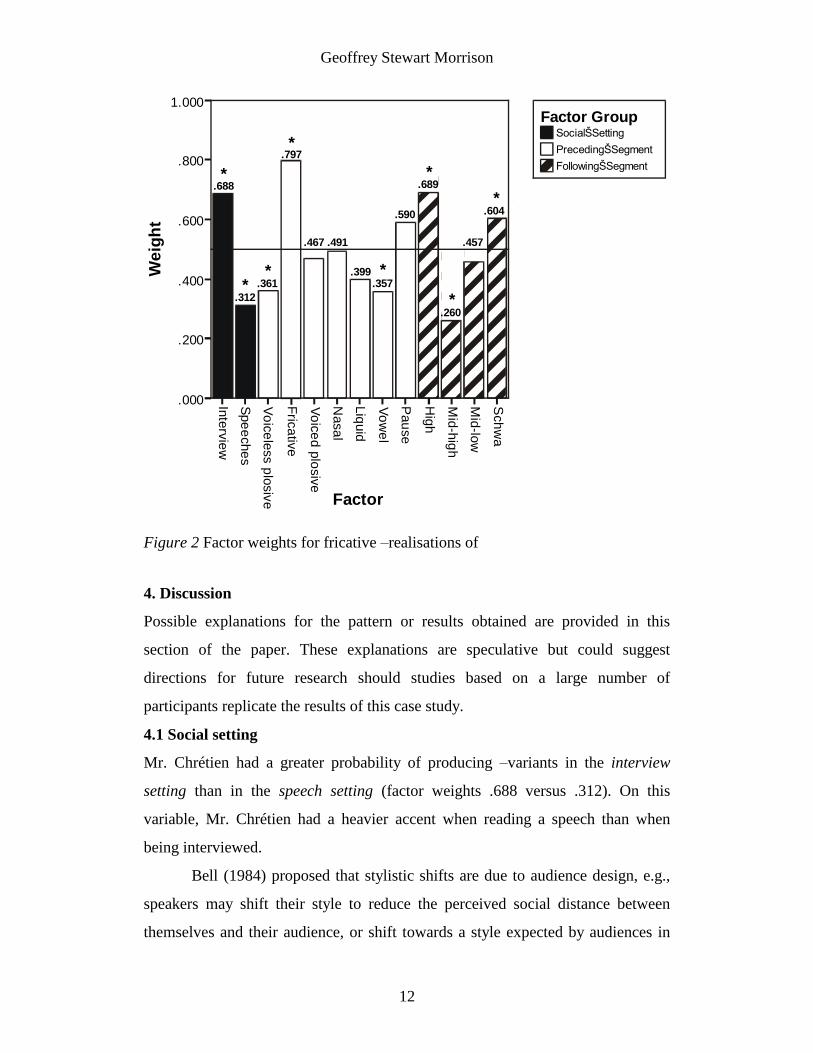
Figure 2 Factor weights for fricative –realisations of
4. Discussion
Possible explanations for the pattern or results obtained are provided in this
section of the paper. These explanations are speculative but could suggest
directions for future research should studies based on a large number of
participants replicate the results of this case study.
4.1 Social setting
Mr. Chrétien had a greater probability of producing –variants in the interview
setting than in the speech setting (factor weights .688 versus .312). On this
variable, Mr. Chrétien had a heavier accent when reading a speech than when
being interviewed.
Bell (1984) proposed that stylistic shifts are due to audience design, e.g.,
speakers may shift their style to reduce the perceived social distance between
themselves and their audience, or shift towards a style expected by audiences in
SocialŠSetting
PrecedingŠSegment
Factor Group
Factor
.000
.200
.400
.600
.800
1.000
.688
.312
.361
.467 .491
.399.357
.590
.689
.260
.457
.604
.797W
eig
ht
Inte
rvie
w
Spe
eche
s
Vo
ice
less p
losiv
e
FollowingŠSegment
Fric
ativ
e
Vo
ice
d p
losiv
e
Nasa
l
Liq
uid
Vo
we
l
Pau
se
Hig
h
Mid
-hig
h
Mid
-low
Sch
wa
*
*
**
*
*
*
*
Page 13
Dat is What the PM Said
13
particular social settings. The difference in pronunciation between the interview
and speech settings may be attributable to audience differences. Whilst in both
settings the true audience may arguably have been the Canadian public, the
ostensive audience for the speeches were the members of the House of Commons,
and the ostensive audience for the interview was the interviewer, Peter
Mansbridge. However, given the topic and ostensive audience, a more formal
style might have been expected in the speeches given in the House of Commons,
which might be expected to require better, more careful, or more prestigious
pronunciation. Style shifting due to audience does not therefore appear to be a
likely explanation for the variation in Mr. Chrétien’s pronunciation.
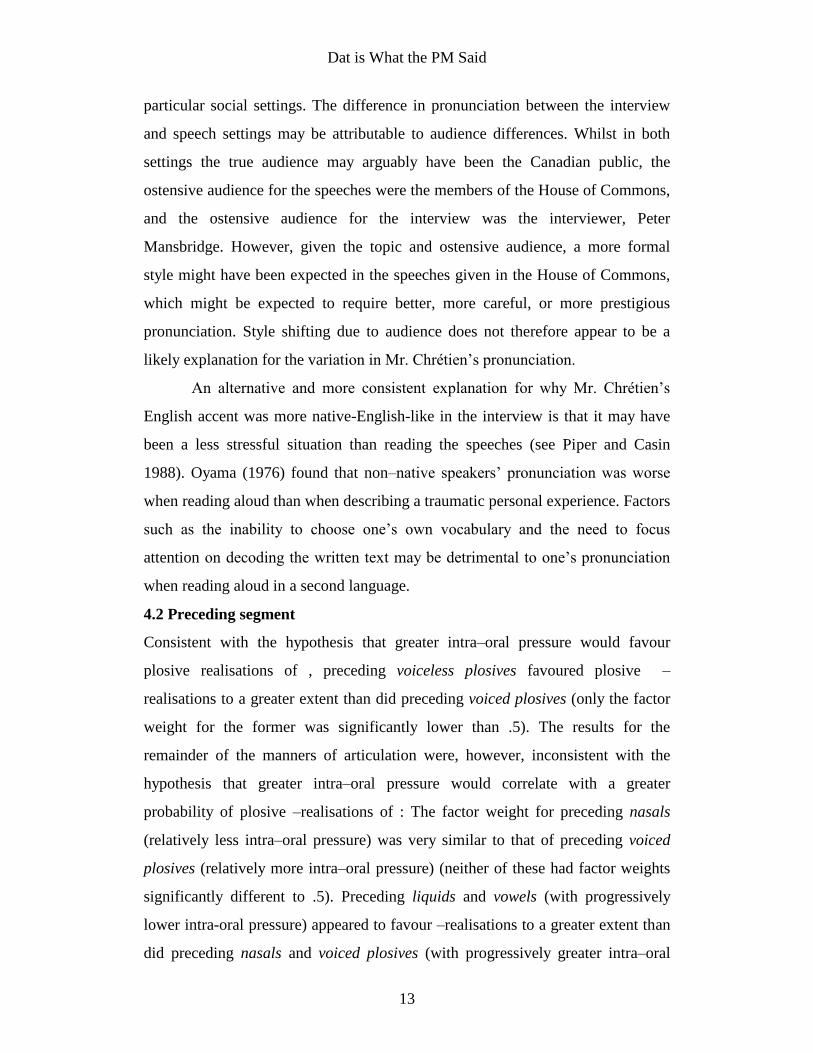
An alternative and more consistent explanation for why Mr. Chrétien’s
English accent was more native-English-like in the interview is that it may have
been a less stressful situation than reading the speeches (see Piper and Casin
1988). Oyama (1976) found that non–native speakers’ pronunciation was worse
when reading aloud than when describing a traumatic personal experience. Factors
such as the inability to choose one’s own vocabulary and the need to focus
attention on decoding the written text may be detrimental to one’s pronunciation
when reading aloud in a second language.
4.2 Preceding segment
Consistent with the hypothesis that greater intra–oral pressure would favour
plosive realisations of , preceding voiceless plosives favoured plosive –
realisations to a greater extent than did preceding voiced plosives (only the factor
weight for the former was significantly lower than .5). The results for the
remainder of the manners of articulation were, however, inconsistent with the
hypothesis that greater intra–oral pressure would correlate with a greater
probability of plosive –realisations of : The factor weight for preceding nasals
(relatively less intra–oral pressure) was very similar to that of preceding voiced
plosives (relatively more intra–oral pressure) (neither of these had factor weights
significantly different to .5). Preceding liquids and vowels (with progressively
lower intra-oral pressure) appeared to favour –realisations to a greater extent than
did preceding nasals and voiced plosives (with progressively greater intra–oral
Page 14
Geoffrey Stewart Morrison
14
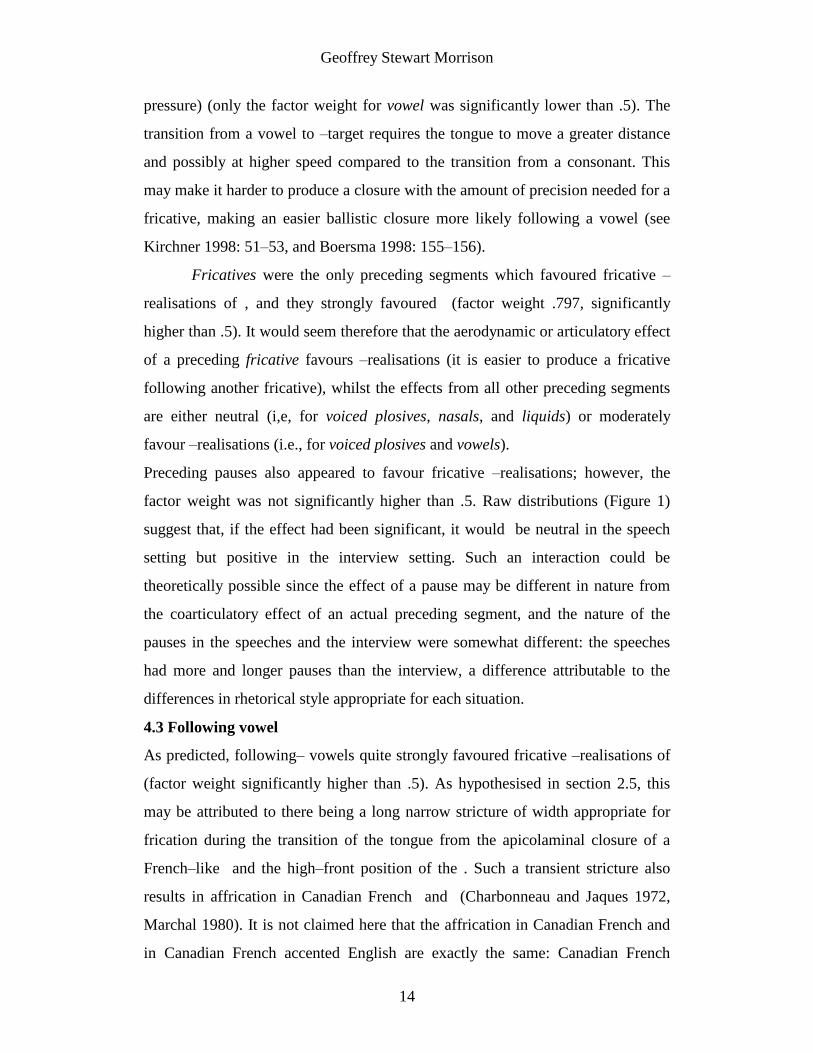
pressure) (only the factor weight for vowel was significantly lower than .5). The
transition from a vowel to –target requires the tongue to move a greater distance
and possibly at higher speed compared to the transition from a consonant. This
may make it harder to produce a closure with the amount of precision needed for a
fricative, making an easier ballistic closure more likely following a vowel (see
Kirchner 1998: 51–53, and Boersma 1998: 155–156).
Fricatives were the only preceding segments which favoured fricative –
realisations of , and they strongly favoured (factor weight .797, significantly
higher than .5). It would seem therefore that the aerodynamic or articulatory effect
of a preceding fricative favours –realisations (it is easier to produce a fricative
following another fricative), whilst the effects from all other preceding segments
are either neutral (i,e, for voiced plosives, nasals, and liquids) or moderately
favour –realisations (i.e., for voiced plosives and vowels).
Preceding pauses also appeared to favour fricative –realisations; however, the
factor weight was not significantly higher than .5. Raw distributions (Figure 1)
suggest that, if the effect had been significant, it would be neutral in the speech
setting but positive in the interview setting. Such an interaction could be
theoretically possible since the effect of a pause may be different in nature from
the coarticulatory effect of an actual preceding segment, and the nature of the
pauses in the speeches and the interview were somewhat different: the speeches
had more and longer pauses than the interview, a difference attributable to the
differences in rhetorical style appropriate for each situation.
4.3 Following vowel
As predicted, following– vowels quite strongly favoured fricative –realisations of
(factor weight significantly higher than .5). As hypothesised in section 2.5, this
may be attributed to there being a long narrow stricture of width appropriate for
frication during the transition of the tongue from the apicolaminal closure of a
French–like and the high–front position of the . Such a transient stricture also
results in affrication in Canadian French and (Charbonneau and Jaques 1972,
Marchal 1980). It is not claimed here that the affrication in Canadian French and
in Canadian French accented English are exactly the same: Canadian French
Page 15
Dat is What the PM Said
15
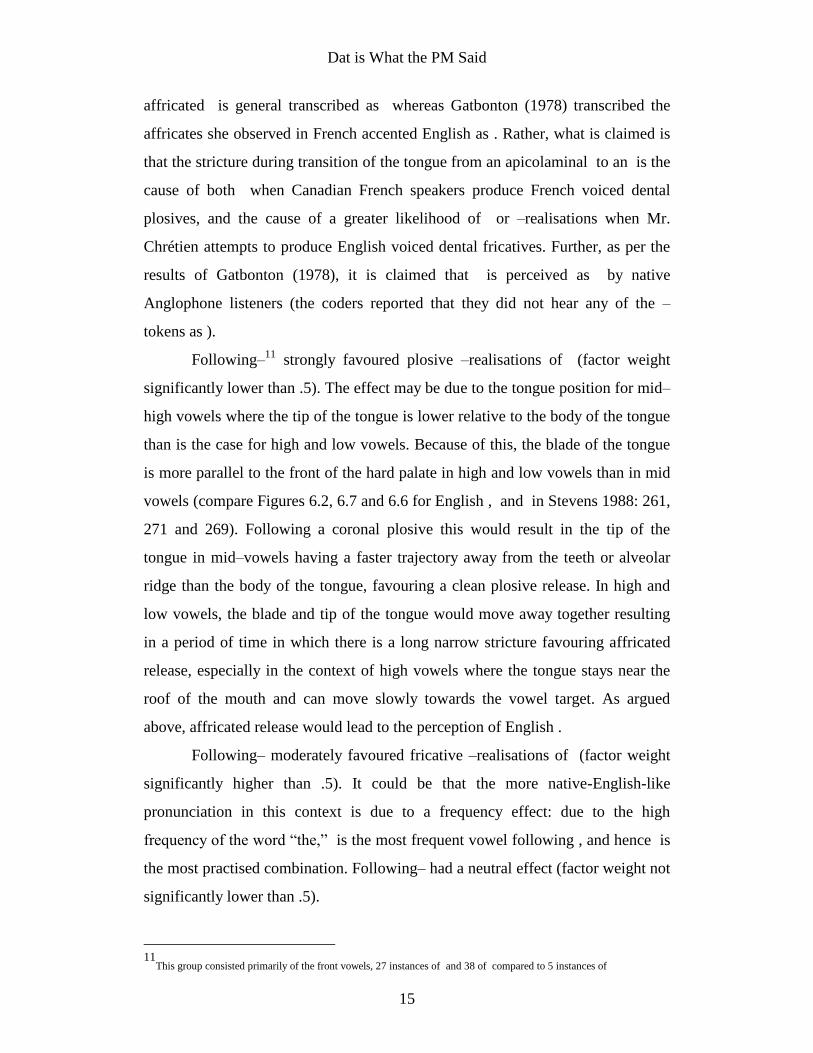
affricated is general transcribed as whereas Gatbonton (1978) transcribed the
affricates she observed in French accented English as . Rather, what is claimed is
that the stricture during transition of the tongue from an apicolaminal to an is the
cause of both when Canadian French speakers produce French voiced dental
plosives, and the cause of a greater likelihood of or –realisations when Mr.
Chrétien attempts to produce English voiced dental fricatives. Further, as per the
results of Gatbonton (1978), it is claimed that is perceived as by native
Anglophone listeners (the coders reported that they did not hear any of the –
tokens as ).
Following–11
strongly favoured plosive –realisations of (factor weight
significantly lower than .5). The effect may be due to the tongue position for mid–
high vowels where the tip of the tongue is lower relative to the body of the tongue
than is the case for high and low vowels. Because of this, the blade of the tongue
is more parallel to the front of the hard palate in high and low vowels than in mid
vowels (compare Figures 6.2, 6.7 and 6.6 for English , and in Stevens 1988: 261,
271 and 269). Following a coronal plosive this would result in the tip of the
tongue in mid–vowels having a faster trajectory away from the teeth or alveolar
ridge than the body of the tongue, favouring a clean plosive release. In high and
low vowels, the blade and tip of the tongue would move away together resulting
in a period of time in which there is a long narrow stricture favouring affricated
release, especially in the context of high vowels where the tongue stays near the
roof of the mouth and can move slowly towards the vowel target. As argued
above, affricated release would lead to the perception of English .
Following– moderately favoured fricative –realisations of (factor weight
significantly higher than .5). It could be that the more native-English-like
pronunciation in this context is due to a frequency effect: due to the high
frequency of the word “the,” is the most frequent vowel following , and hence is
the most practised combination. Following– had a neutral effect (factor weight not
significantly lower than .5).
11
This group consisted primarily of the front vowels, 27 instances of and 38 of compared to 5 instances of
Page 16
Geoffrey Stewart Morrison
16
4.4 Tests for interactions
No interactions between factor groups were found. Whilst interactions between
linguistic factor groups would not have been theoretically problematic,
interactions between the social–setting factor group and the linguistic factor
groups would have been: Interaction between linguistic and stylistic variables
would have indicated that the probability of fricative realisations of in different
social settings was subject to different coarticulatory effects rather than an across
the board scaling of the same coarticulatory effects, a highly unlikely intra–
speaker effect. (As noted above a preceding pause may be exempted from this
logic since it is not an actual segment which could coarticulate with the .) Theory
and results therefore support the conclusion that only simple contextual effects
were relevant in the probability of fricative realisations of in Mr. Chrétien’s
pronunciation.
5. Summary
A variationist style quantitative analysis was conducted on the English
pronunciation of a notable Francophone Canadian, Prime Minister Jean Chrétien.
Tokens were coded into fricative and plosive –realisations according to native
Anglophones’ perception. Productions of perceived as fricatives by native
Anglophone listeners may be considered to be “correctly” pronounced. Social
settings was found to have a large effect, with a greater probability of fricative
realisations during a television interview than during speeches in the House of
Commons. This may be due to that fact that the speeches were read out loud, a
task which has been found to be deleterious for the pronunciation of non–native
speakers. Fricative realisations of were favoured if the preceding segment was a
fricative, likely attributable to the ease of transition from an aerodynamically or
articulatorily similar segment. Preceding voiceless plosives favoured plosive
realisations of to a greater extent than did preceding voiced plosives. This is
consistent with the hypothesis that greater intraoral pressure (as found in voiceless
compared to voiced plosives) would cause the tongue to lower faster, resulting in
less likelihood of transitional frication. Following– also favoured fricative
Page 17
Dat is What the PM Said
17
realisations of , which is likely attributable to a similar coarticulatory effect to that
which results in affricated release of and in Canadian French.
Appendix: Obtaining GoldVarb–like output from SPSS
Commercial and some freeware statistics packages may have certain advantages
over the freeware packages such as GoldVarb and VARBRUL commonly used in
sociolinguistic research. Paolillo (2002, §1.3.3) discusses the advantages and
disadvantages of the two types of software. The current paper made use of SPSS
to test for the statistical significance for factor–group interactions and for
individual factors. Whilst such tests are technically possible in GoldVarb, e.g., via
manually dummy coding interactions (Paolillo 2002: §3.3.5 and 4.3.2), and
comparing models with and without individual factors (Guy 1988), conducting
these tests manually is labourious and time consuming.
One of the strengths of a commercial package such as SPSS is the
flexibility it provides in allowing the researcher to conduct different analyses
using different options. This flexibility has a disadvantage in that it requires the
researcher to be familiar enough with the various options in order to know which
he or she should choose on a given occasion. I would encourage readers
unfamiliar with the workings of logistic regression and the effect of options
available to read further in this area. Good introductions for applied researchers
include Pampel (2000) and Menard (2002), a somewhat more advanced but
accessible text is Hosmer and Lemeshow (2000).
My purpose here is to set out the options needed to produce GoldVarb–
like output using SPSS. I will assume that the reader has some familiarity with
SPSS, if not, they are advised to work through the relevant paper and online
material packaged with the software. The following instructions are valid for
version 11.5 of SPSS with base, regression, and advanced modules.
1. Create or open an appropriately formatted data file.
2. From the menu bar, select Analyze > Regression > Binary Logistic...
3. Place the dependent variable into the box labelled Dependant, and the independent variable
into the box labelled Covariates.
4. Press the Categorical... button.
a. Place all the independent variables into the box labelled Categorical Covariates.
Page 18
Geoffrey Stewart Morrison
18
b. In the Contrast drop–down list, select Deviation.
c. By default, the Last radio button is checked for Reference Category.
d. Select all of the independent variables and press Change.
e. Press Continue.
5. Press OK. An output window will open containing the logistic regression output.
6. Repeat steps 2 through 5, but at step 4c change the checked radio button to First for Reference
Category.
7. Two logistic regression outputs will now be visible in the output window. Compare the
Variables in the Equation tables under Block 1: Method = Enter of the top and the bottom
output. The two will be identical except for:
a. Data for the last factor in each factor group will be missing in the top output and
data for the first factor in each factor group will be missing in the bottom output.
Data from both outputs must be combined in order to obtain data for all individual
factors.
b. Labels for each individual factor, in the form VARIABLE(1), VARIABLE(2), etc.,
will not agree between the top and bottom outputs, VARIABLE(2) in the top output
will correspond to VARIABLE(1) in the bottom output. For the references of these
labels, see the Categorical Variables Coding tables in the respective outputs.
8. Model coefficients are given as logits in the column labelled B, and their odds ratios are given
in the column labelled Exp(B). Factor weights are obtained via the following formula:
Factor Weight = Exp(B) / (1 + Exp(B))
To conduct a step–up and step–down analyses, before step 5:
a. Press the Options... button.
i. Change the Probability for Stepwise Removal to .05.
ii. Press Continue.
b. Change the Method drop–down option to Forward:LR (for step–up).
c. Press OK. An output window will open containing the logistic regression output.
d. Repeat, but change the Method drop–down option to Backward:LR (for step–down).
References
Boersma, P. (1998). Functional Phonology: Formalising the Interaction Between
Articulatory and Perceptual Drives. Doctoral dissertation, University of
Amsterdam. The Hague: Holland Academic Graphics.
Brannen, K. (2002) The role of perception in differential substitution. Canadian
Journal of Linguistics 47: 1–46.
Charbonneau, R., & Jacques, B. (1972). [ts] et [dz] en français canadien. In A.
Page 19
Dat is What the PM Said
19
Valdman (Ed.), Papers in Linguistics and Phonetics to the Memory of
Pierre Delattre (pp. 77–90). The Hague: Mouton.
Dart, S. (1991). Articulatory and acoustic properties of apical and laminal
articulations. UCLA Working Papers in Phonetics 79.
Escudero, P., and Polka, L. (2003). A cross-language study of vowel
categorization and vowel acoustics: Canadian English versus Canadian
French. In M. J. Solé, D. Recansens, and J. Romero (Eds.), Proceedings of
the 15th
International Congress of Phonetic Sciences: Barcelona 2003 (pp.
861–864). Adelaide, Australia: Causal Productions.
Gatbonton, E. (1978). Patterned phonetic variability in second-language speech: a
gradual diffusion model. The Canadian Modern Language Review 34:
335–347.
Guy, G. R. (1988). Advanced VARBRUL analysis. In K. Ferrara et al (Eds.),
Linguistic contact and change: Proceedings of the 16th
Annual Conference
on New Ways of Analyzing Variation, (pp. 124–136). Austin, TX:
University of Texas, Department of Linguistics.
Hosmer, D. W., and Lemeshow, S. (2000). Applied Logistic Regression (2nd
Ed.).
New York: John Wiley & Sons.
Kirchner, R. M. (1998). An Effort-based Approach to Consonant Lenition.
Unpublished doctoral dissertation, University of California at Los
Angeles.
Malécot, A. (1968). The force of articulation of American stops and fricatives as a
function of position. Phonetica 18: 95–102.
Malécot, A. (1966). The effectiveness of intra-oral air-pressure-pulse parameters
in distinguishing between stop cognates. Phonetica 14: 65–1.
Marchal, A. (1980). L’affrication de /t/ at /d/ en français de Montréal. Travaux de
l’Institut de Phonétique d’Aix 7: 79–99.
Menard, S. (2002). Applied Logistic Regression Analysis. (Sage university papers
series on quantitative applications in the social sciences, 07–106).
Thousand Oaks, CA: Sage.
Ohala, J. J. (1983). The origin of sound patterns in vocal tract constraints. In P. F.
Page 20
Geoffrey Stewart Morrison
20
MacNeilage (Ed.) The Production of Speech (pp. 189–216). New York:
Springer-Verlag.
Oyama, S. (1976). A sensitive period for the acquisition of a non-native
phonological system. Journal of Psycholinguistic Research 5: 261–285.
Paolillo, John C. (2002). Analyzing Linguistic Variation: Statistical Models and
Methods. Stanford, CA: CSLI.
Piper, T., and Cansin, D. (1988). Factors influencing the foreign accent. The
Canadian Modern Language Review 44: 334–342.
Polka, L., Colantonio, C., & Sundara, M. (2001). A cross-language comparison of
/d/-/ð/ discrimination: evidence for a new developmental pattern. Journal
of the Acoustical Society of America 109: 2190–2201.
Pampel, F. C. (2000). Logistic Regression: A Primer. (Sage university papers
series on quantitative applications in the social sciences, 07–132).
Thousand Oaks, CA: Sage.
Rampton, B. (1987). Stylistic variability and not speaking “normal” English:
Some post-Labovian approaches and their implications for the study of
interlanguage. In R. Ellis (Ed.), Second Language Acquisition in Context
(pp. 47–58). Englewood Cliffs, NJ: Prentice-Hall International.
Robinson, J. S., Lawrence, H. & Tagliamonte S. (2001) Goldvarb 2001: A
multivariate analysis application for Windows [Computer software].
York, UK: Department of Language and Linguistic Science, University of
York.
Rvachew, S., and Jamieson, D. G. (1995). Learning new speech contrasts:
Evidence from adults learning a second language and children with speech
disorders. In W. Strange (Ed.), Speech Perception and Linguistic
Experience: Issues in Cross-language Research (pp. 411–432). Baltimore:
York Press.
Sankoff, D. (1988). Variable rules. In U. Ammon, N. Dittmar, and K. J. Matthier
(Eds.), Sociolinguistics: An International Handbook of the Science of
Language and Society (Vol. 2, pp. 984–997). Berlin and New York:
Walter de Gruyeter.
Page 21
Dat is What the PM Said
21
SPSS Inc. (2002). SPSS 11.5 [Computer software]. Chicago: Author.
Stevens, K. N. (1998). Acoustic Phonetics. Cambridge, MA: MIT Press.
Teasdale, A. (1997). On the differential substitution of English [T]: A phonetic
approach. Calgary Working Papers in Linguisitcs 19: 71–85.
Young, R., and Bayley, R. (1996). VARBRUL analysis for second language
acquisition research. In K. de Bot & T. Huebner (Series Eds.) and R.
Bayley and D. R. Preston (Vol. Eds.), Studies in Bilingualism (SiBil): Vol.
10. Second Language Acquisition and Linguistic Variation. Amsterdam
and Philadelphia: John Benjamins.
Resources
(Links may no longer be current.)
Canadian Broadcasting Corporation. (December 18, 2002). An interview with
Prime Minister Jean Chrétien. On The National. Retrieved February 2003
from
http://www.cbc.ca/national/news/chretien/interview_021218.html
Prime Minister of Canada. (September 17, 2001). Address by Prime Minister Jean
Chrétien on the occasion of a Special House of Commons Debate in
response to the terrorist attacks in the United States on September 11,
2001. Retrieved February 2003 from
http://pm.gc.ca/multimediachoseformat.asp?Language=E&Page=newsroom&Sub
=Multimedia&filename=20010917_terroristattacks_e.htm
Prime Minister of Canada.(October 15, 2001). Address by Prime Minister Jean
Chrétien on the occasion of a Special House of Commons “Take Note”
Debate on the International Campaign Against Terror. Retrieved February
2003 from
http://pm.gc.ca/multimediachoseformat.asp?Language=E&Page=newsroom&Sub
=Multimedia&filename=20011015_houseofcommons_e.htm