4
CASE STUDY www.icecold2.com 855.EcoCOOL (326.2665) Data Analysis for Unibrite AC Units
CASE STUDY
www.icecold2.com 855.EcoCOOL (326.2665)
Data Analysis for Unibrite AC Units

Data Analysis for Unibrite AC Units
SUMMARY of OBSERVATIONS
Analysis is based on pre-
and post-
measurements associated with introducing Iced Cold product
into refrigera�on compressors serving Unibrite Cooler and Freezer.
Measurement and monitoring include 1-min-interval
data collected
for the following parameters:
Ambient Dry Bulb Temperature, Condenser Water Temperature, Cooler Supply and Return
Temperatures, Freezer Supply and Return Temperatures, High Stage and Low Stage (Booster)
Compressors’ AC
Currents.
Dura�on of data monitoring was ~two weeks before and a�er -
on 9/18-10/3/2014
-
for pre-
treatment, and 12/10-12/25/2014 – for post-treatment.
Some observa�ons are discussed below.
Table presents single-value averages and totals for all measured parameters (please, refer to Excel
charts for detailed trend-logs, complemen�ng single-value summaries):
As Table indicates, and the corresponding trend-logs in Excel charts (not included here) confirm,
the Low Stage AC Current (Amps) was in average ~20.4% lower in post-treatment measurements
than in pre-treatment. Correspondingly, the total energy consumed (in Amp-hours, or –
propor�onally – in kilowa�-hours) was 20.4% lower
as well. Similar
comparison for High Stage AC
Current indicates smaller improvement on 2.7%.
It should be noted, that post-
measurements were performed in some colder (in average) outdoor
condi�ons. However, comparison of subsets of collected data with iden�cal outdoor air
temperatures, s�ll demonstrate improvement (savings) on ~20% for Low Stage compressor, as
shown above.
The air temperature difference between pre-
and post-treatment was minimal
(negligible) for both
–
cooler and freezer
supply and return air. Cooler Supply and Return Air deltaT was almost zero in
both pre-
and post-measurements, and Freezer Supply and Return Air deltaT was also very small
(1.55 and 1.79
degF respec�vely).
Comparison of Low-stage and High-stage AC Currents is shown below.
AC Current for Low-stage compressor on post-treatment is clearly lower than pre-treatment:
1www.icecold2.com 855.EcoCOOL (326.2665)
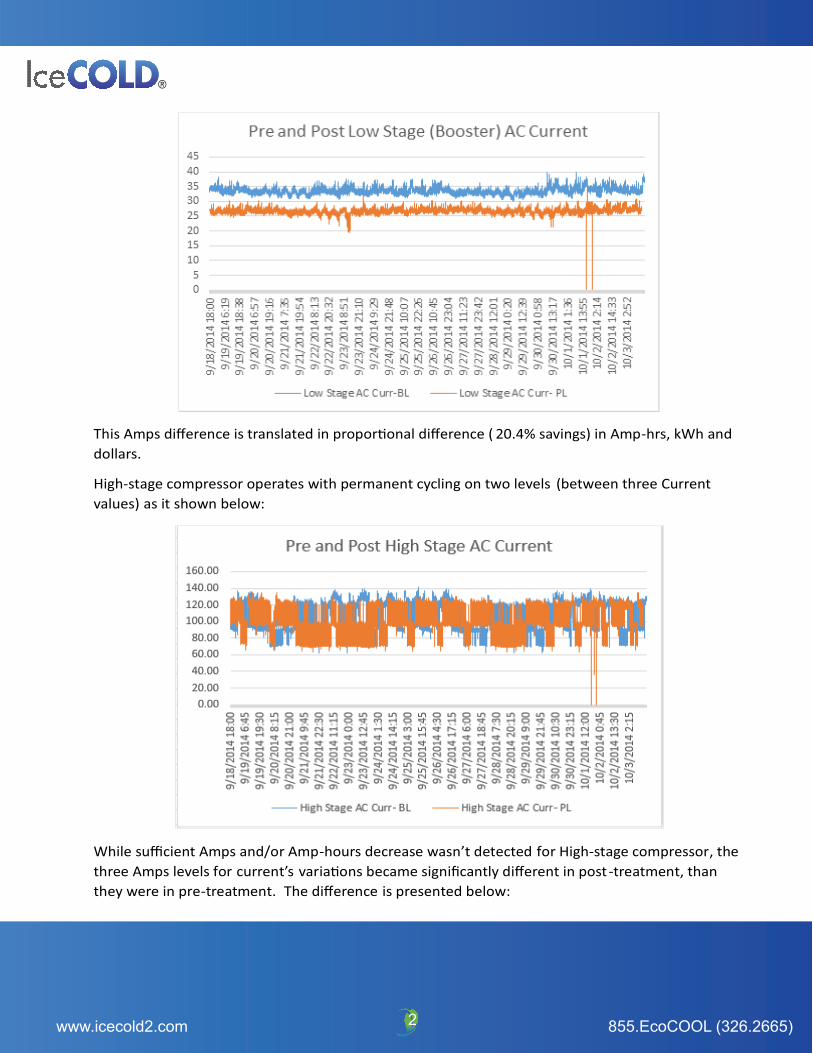
This Amps difference is translated in propor�onal difference ( 20.4% savings) in Amp-hrs, kWh and
dollars.
High-stage compressor operates with permanent cycling on two levels (between three Current
values) as it shown below:
While sufficient Amps and/or Amp-hours decrease wasn’t detected
for High-stage compressor, the
three Amps levels for current’s varia�ons became significantly different in post-treatment, than
they were in pre-treatment.
The
difference is presented below:
2www.icecold2.com 855.EcoCOOL (326.2665)

It’s clearly visible that in post-treatment measurements, the difference between maximal and
intermediate Amp-levels became smaller, and levels themselves – more consistent. While this Iced
Cold effect requires addi�onal analysis / inves�ga�on, it might be indica�on that high stage
compressor operates a�er Iced Cold treatment “not as hard as before” treatment , which could be
translated into extended equipment life�me.
It should be noted that chart above is plo�ed for case-specific (pre- and post-) outdoor air
condi�ons, which enables appropriate weather-independent comparison. Similarly Iced Cold effect
on Low Stage compressor amperage for “aligned” weather condi�ons is shown below, indica�ng
un-ques�onable improvements:
3www.icecold2.com 855.EcoCOOL (326.2665)


