52

What is multilevel regression modelling?Some examples from our own research
Motivations for multilevel modelingComputing
Gelman � Chapter 1 � Why?
Data Analysis Using Regression andMultilevel/Hierarchical Models
Andrew GelmanJennifer Hill
June 13, 2012
Gelman & Hill
What is multilevel regression modelling?Some examples from our own research
Motivations for multilevel modelingComputing
Gelman � Chapter 1 � Why?
Structure
What is multilevel regression modelling?
Some examples from our own research
Motivations for multilevel modelling
Computing
Gelman & Hill

What is multilevel regression modelling?Some examples from our own research
Motivations for multilevel modelingComputing
Models for regression coe�cients
Gelman � Chapter 1 � Why?
What is multilevel regression modelling?
Example � an educational study predicting in each school thestudents' grades y on a standardised test given their scores on apre-test x and other information
A multilevel model is a regression (a linear or generalised linearmodel) in which the parameters � the regression coe�cients � aregiven a probability model
In our student example the second-level model � the school model �has parameters of its own � the hyperparameters of the model �which are also estimated from data
Gelman & Hill

What is multilevel regression modelling?Some examples from our own research
Motivations for multilevel modelingComputing
Models for regression coe�cients
Gelman � Chapter 1 � Why?
Models for regression coe�cients
Keep our example simple � one student-level predictor x � pre-testscore and one school-level predictor u � average parents' income
Varying-intercept model � i for individual student and j [i ] for theschool j containing student i
yi = αj[i ] + βxi + εi , for students i = 1, ..., nαj = a+ buj + ηj , for schools j = 1, ...J
Varying-intercept, varying slope model
yi = αj[i ] + βj[i ]xi + εi , for students i = 1, ..., nαj = a0 + b0uj + ηj1, for schools j = 1, ...Jβj = a1 + b1uj + ηj2, for schools j = 1, ...J
Gelman & Hill

What is multilevel regression modelling?Some examples from our own research
Motivations for multilevel modelingComputing
Home radon measurement and remediationForecasting presidential elections
Gelman � Chapter 1 � Why?
Home radon measurement and remediation
Random sample of more than 80,000 homes throughout the U.S.
Goal � estimate the distribution of radon levels in each of theapproximately 3,000 counties in the U.S.
Hierarchical structure � houses within counties
House-level predictor � �oor on which measurement was taken (0 forbasement, 1 for �rst �oor)
County-level predictor � measurement of the soil uranium
Our varying-intercept modelyi is the log of the radon measurement in house i
x is the �oor of the measurementu is the uranium measurement at the county levelεi within-county variation: measurement error, natural variation
in radon levels within a house over time, variationbetween houses
ηj between-county variation: beyond what is explained by thecounty-level uranium predictor
Gelman & Hill

What is multilevel regression modelling?Some examples from our own research
Motivations for multilevel modelingComputing
Home radon measurement and remediationForecasting presidential elections
Gelman � Chapter 1 � Why?
Home radon measurement and remediation
Random sample of more than 80,000 homes throughout the U.S.
Goal � estimate the distribution of radon levels in each of theapproximately 3,000 counties in the U.S.
Hierarchical structure � houses within counties
House-level predictor � �oor on which measurement was taken (0 forbasement, 1 for �rst �oor)
County-level predictor � measurement of the soil uranium
Our varying-intercept modelyi is the log of the radon measurement in house i
x is the �oor of the measurement
u is the uranium measurement at the county levelεi within-county variation: measurement error, natural variation
in radon levels within a house over time, variationbetween houses
ηj between-county variation: beyond what is explained by thecounty-level uranium predictor
Gelman & Hill

What is multilevel regression modelling?Some examples from our own research
Motivations for multilevel modelingComputing
Home radon measurement and remediationForecasting presidential elections
Gelman � Chapter 1 � Why?
Home radon measurement and remediation
Random sample of more than 80,000 homes throughout the U.S.
Goal � estimate the distribution of radon levels in each of theapproximately 3,000 counties in the U.S.
Hierarchical structure � houses within counties
House-level predictor � �oor on which measurement was taken (0 forbasement, 1 for �rst �oor)
County-level predictor � measurement of the soil uranium
Our varying-intercept modelyi is the log of the radon measurement in house i
x is the �oor of the measurementu is the uranium measurement at the county level
εi within-county variation: measurement error, natural variationin radon levels within a house over time, variationbetween houses
ηj between-county variation: beyond what is explained by thecounty-level uranium predictor
Gelman & Hill

What is multilevel regression modelling?Some examples from our own research
Motivations for multilevel modelingComputing
Home radon measurement and remediationForecasting presidential elections
Gelman � Chapter 1 � Why?
Home radon measurement and remediation
Random sample of more than 80,000 homes throughout the U.S.
Goal � estimate the distribution of radon levels in each of theapproximately 3,000 counties in the U.S.
Hierarchical structure � houses within counties
House-level predictor � �oor on which measurement was taken (0 forbasement, 1 for �rst �oor)
County-level predictor � measurement of the soil uranium
Our varying-intercept modelyi is the log of the radon measurement in house i
x is the �oor of the measurementu is the uranium measurement at the county levelεi within-county variation: measurement error, natural variation
in radon levels within a house over time, variationbetween houses
ηj between-county variation: beyond what is explained by thecounty-level uranium predictor
Gelman & Hill

What is multilevel regression modelling?Some examples from our own research
Motivations for multilevel modelingComputing
Home radon measurement and remediationForecasting presidential elections
Gelman � Chapter 1 � Why?
Home radon measurement and remediation
Random sample of more than 80,000 homes throughout the U.S.
Goal � estimate the distribution of radon levels in each of theapproximately 3,000 counties in the U.S.
Hierarchical structure � houses within counties
House-level predictor � �oor on which measurement was taken (0 forbasement, 1 for �rst �oor)
County-level predictor � measurement of the soil uranium
Our varying-intercept modelyi is the log of the radon measurement in house i
x is the �oor of the measurementu is the uranium measurement at the county levelεi within-county variation: measurement error, natural variation
in radon levels within a house over time, variationbetween houses
ηj between-county variation: beyond what is explained by thecounty-level uranium predictor
Gelman & Hill

What is multilevel regression modelling?Some examples from our own research
Motivations for multilevel modelingComputing
Home radon measurement and remediationForecasting presidential elections
Gelman � Chapter 1 � Why?
Forecasting presidential elections
Predicted outcomes � the Democratic Party's share of the two-partyvote in each of the 11 elections (1948�1988), yielding 511 points
Various predictors (1 · · · k)including:The performance of the Democrats in the previous electionMeasures of state-level and national level economic trendsNational opinion polls up to two months before the election
Goal � make prediction for 1992 election for the 50 states
Gelman & Hill

What is multilevel regression modelling?Some examples from our own research
Motivations for multilevel modelingComputing
Home radon measurement and remediationForecasting presidential elections
Gelman � Chapter 1 � Why?
Forecasting presidential elections
Predicted outcomes � the Democratic Party's share of the two-partyvote in each of the 11 elections (1948�1988), yielding 511 points
Various predictors (1 · · · k)including:The performance of the Democrats in the previous election
Measures of state-level and national level economic trendsNational opinion polls up to two months before the election
Goal � make prediction for 1992 election for the 50 states
Gelman & Hill

What is multilevel regression modelling?Some examples from our own research
Motivations for multilevel modelingComputing
Home radon measurement and remediationForecasting presidential elections
Gelman � Chapter 1 � Why?
Forecasting presidential elections
Predicted outcomes � the Democratic Party's share of the two-partyvote in each of the 11 elections (1948�1988), yielding 511 points
Various predictors (1 · · · k)including:The performance of the Democrats in the previous electionMeasures of state-level and national level economic trends
National opinion polls up to two months before the election
Goal � make prediction for 1992 election for the 50 states
Gelman & Hill

What is multilevel regression modelling?Some examples from our own research
Motivations for multilevel modelingComputing
Home radon measurement and remediationForecasting presidential elections
Gelman � Chapter 1 � Why?
Forecasting presidential elections
Predicted outcomes � the Democratic Party's share of the two-partyvote in each of the 11 elections (1948�1988), yielding 511 points
Various predictors (1 · · · k)including:The performance of the Democrats in the previous electionMeasures of state-level and national level economic trendsNational opinion polls up to two months before the election
Goal � make prediction for 1992 election for the 50 states
Gelman & Hill

What is multilevel regression modelling?Some examples from our own research
Motivations for multilevel modelingComputing
Home radon measurement and remediationForecasting presidential elections
Gelman � Chapter 1 � Why?
Forecasting presidential elections
Predicted outcomes � the Democratic Party's share of the two-partyvote in each of the 11 elections (1948�1988), yielding 511 points
Various predictors (1 · · · k)including:The performance of the Democrats in the previous electionMeasures of state-level and national level economic trendsNational opinion polls up to two months before the election
Goal � make prediction for 1992 election for the 50 states
Gelman & Hill

What is multilevel regression modelling?Some examples from our own research
Motivations for multilevel modelingComputing
Home radon measurement and remediationForecasting presidential elections
Gelman � Chapter 1 � Why?
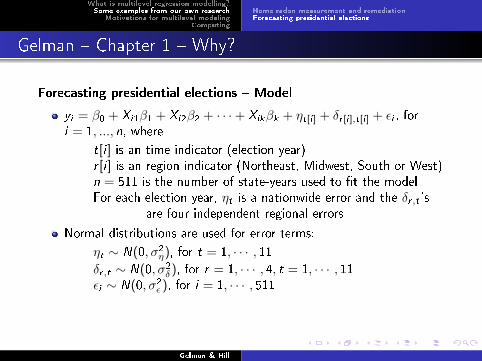
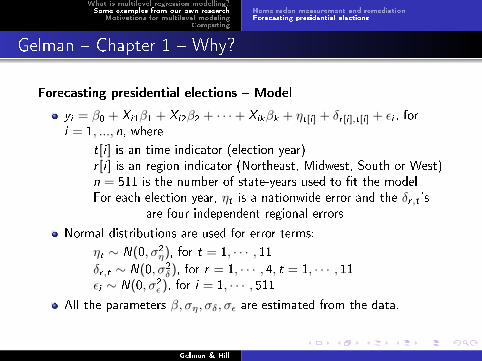
Forecasting presidential elections � Model
yi = β0 + Xi1β1 + Xi2β2 + · · ·+ Xikβk + ηt[i ] + δr [i ],t[i ] + εi , fori = 1, ..., n, where
t[i ] is an time indicator (election year)r [i ] is an region indicator (Northeast, Midwest, South or West)n = 511 is the number of state-years used to �t the modelFor each election year, ηt is a nationwide error and the δr ,t 's
are four independent regional errors
Normal distributions are used for error terms:
ηt ∼ N(0, σ2η), for t = 1, · · · , 11δr ,t ∼ N(0, σ2δ), for r = 1, · · · , 4, t = 1, · · · , 11εi ∼ N(0, σ2ε ), for i = 1, · · · , 511
All the parameters β, ση, σδ, σε are estimated from the data.
Gelman & Hill

What is multilevel regression modelling?Some examples from our own research
Motivations for multilevel modelingComputing
Home radon measurement and remediationForecasting presidential elections
Gelman � Chapter 1 � Why?
Forecasting presidential elections � Model
yi = β0 + Xi1β1 + Xi2β2 + · · ·+ Xikβk + ηt[i ] + δr [i ],t[i ] + εi , fori = 1, ..., n, where
t[i ] is an time indicator (election year)r [i ] is an region indicator (Northeast, Midwest, South or West)n = 511 is the number of state-years used to �t the modelFor each election year, ηt is a nationwide error and the δr ,t 's
are four independent regional errors
Normal distributions are used for error terms:
ηt ∼ N(0, σ2η), for t = 1, · · · , 11δr ,t ∼ N(0, σ2δ), for r = 1, · · · , 4, t = 1, · · · , 11εi ∼ N(0, σ2ε ), for i = 1, · · · , 511
All the parameters β, ση, σδ, σε are estimated from the data.
Gelman & Hill

What is multilevel regression modelling?Some examples from our own research
Motivations for multilevel modelingComputing
Home radon measurement and remediationForecasting presidential elections
Gelman � Chapter 1 � Why?
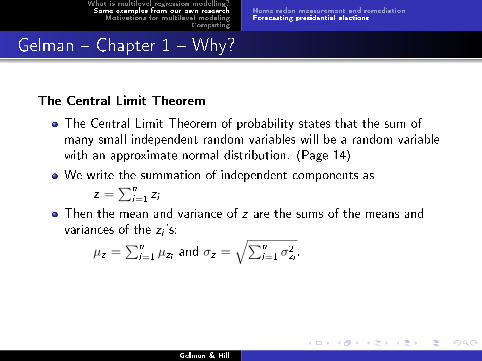
The Central Limit Theorem
The Central Limit Theorem of probability states that the sum ofmany small independent random variables will be a random variablewith an approximate normal distribution. (Page 14)
We write the summation of independent components as
z =∑n
i=1zi
Then the mean and variance of z are the sums of the means andvariances of the zi 's:
µz =∑n
i=1µzi
and σz =√∑n
i=1σ2zi
.
We write this as:
z ∼ N(µz , σ2
z ).
Gelman & Hill

What is multilevel regression modelling?Some examples from our own research
Motivations for multilevel modelingComputing
Home radon measurement and remediationForecasting presidential elections
Gelman � Chapter 1 � Why?
The Central Limit Theorem
The Central Limit Theorem of probability states that the sum ofmany small independent random variables will be a random variablewith an approximate normal distribution. (Page 14)
We write the summation of independent components as
z =∑n
i=1zi
Then the mean and variance of z are the sums of the means andvariances of the zi 's:
µz =∑n
i=1µzi
and σz =√∑n
i=1σ2zi
.
We write this as:
z ∼ N(µz , σ2
z ).
Gelman & Hill
What is multilevel regression modelling?Some examples from our own research
Motivations for multilevel modelingComputing
Home radon measurement and remediationForecasting presidential elections
Gelman � Chapter 1 � Why?
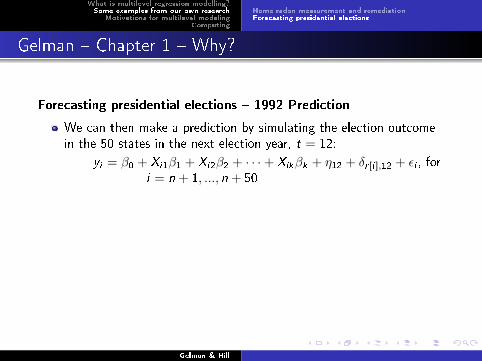
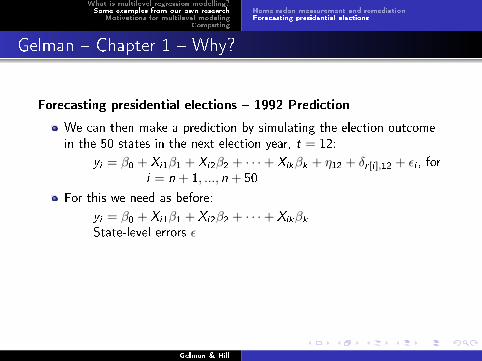
Forecasting presidential elections � 1992 Prediction
We can then make a prediction by simulating the election outcomein the 50 states in the next election year, t = 12:
yi = β0 + Xi1β1 + Xi2β2 + · · ·+ Xikβk + η12 + δr [i ],12 + εi , fori = n + 1, ..., n + 50
For this we need as before:
yi = β0 + Xi1β1 + Xi2β2 + · · ·+ Xikβk
State-level errors ε
and new from our distributions:
A new national error η124 new regional errors δr ,12
Gelman & Hill
What is multilevel regression modelling?Some examples from our own research
Motivations for multilevel modelingComputing
Home radon measurement and remediationForecasting presidential elections
Gelman � Chapter 1 � Why?
Forecasting presidential elections � 1992 Prediction
We can then make a prediction by simulating the election outcomein the 50 states in the next election year, t = 12:
yi = β0 + Xi1β1 + Xi2β2 + · · ·+ Xikβk + η12 + δr [i ],12 + εi , fori = n + 1, ..., n + 50
For this we need as before:
yi = β0 + Xi1β1 + Xi2β2 + · · ·+ Xikβk
State-level errors ε
and new from our distributions:
A new national error η124 new regional errors δr ,12
Gelman & Hill

What is multilevel regression modelling?Some examples from our own research
Motivations for multilevel modelingComputing
Gelman � Chapter 1 � Why?
Multilevel Models v Classical Regression
Learning about treatment e�ects that vary. How does y changewhen some x is varied, with all other inputs held constant? E.g., aparticular educational innovation may be more e�ective for girls thanfor boys.
Multilevel models: Allow us to study e�ects that vary by group, e.g.,an intervention that is more e�ective in some schoolsthan others (because of some unmeasuredschool-level factor)
Classical regression: Estimates of varying e�ects can be noisy,especially when there are few observations per group
Gelman & Hill
What is multilevel regression modelling?Some examples from our own research
Motivations for multilevel modelingComputing
Gelman � Chapter 1 � Why?
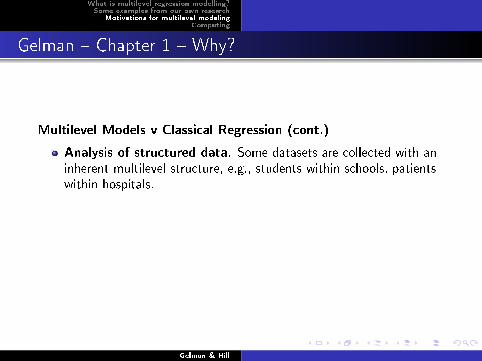
Multilevel Models v Classical Regression (cont.)
Analysis of structured data. Some datasets are collected with aninherent multilevel structure, e.g., students within schools, patientswithin hospitals.
Multilevel modelling: A direct way to include indicators for clustersat all levels of a design.
Classical regression: Problems of over�tting with large numbers ofparameters.
Gelman & Hill

What is multilevel regression modelling?Some examples from our own research
Motivations for multilevel modelingComputing
Gelman � Chapter 1 � Why?
Multilevel Models v Classical Regression (cont.)
Analysis of structured data. Some datasets are collected with aninherent multilevel structure, e.g., students within schools, patientswithin hospitals.
Multilevel modelling: A direct way to include indicators for clustersat all levels of a design.
Classical regression: Problems of over�tting with large numbers ofparameters.
Gelman & Hill

What is multilevel regression modelling?Some examples from our own research
Motivations for multilevel modelingComputing
R & Bugs
Gelman � Chapter 1 � Why?
R & Bugs
R � a free open-source version of S
A program developed in the '70s and '80s at Bell LaboratoriesIt is excellent for graphics and classical statistical modelling �
most relevant here are lm() and glm()Bugs can be called from R.
Bugs � Bayesian Inference using Gibbs Sampling
Program developed by statisticians at the Medical ResearchCouncil in Cambridge
Most powerful versions available � WinBugs 1.4 & OpenBugsThe Bugs modelling language has a modular form that allows
the user to put together all sorts of Bayesian models,including multilevel models
Methodology � set up data in R, �t models in Bugs, then goback to R for further statistical analysis using the�tted models.
Gelman & Hill
What is multilevel regression modelling?Some examples from our own research
Motivations for multilevel modelingComputing
R & Bugs
Gelman � Chapter 1 � Why?
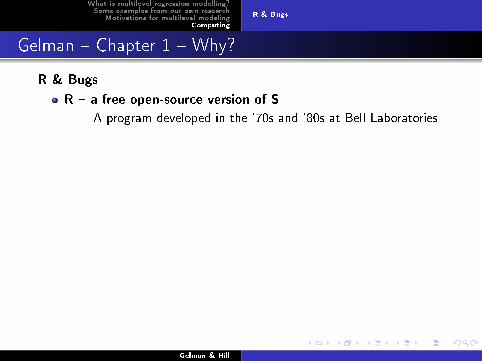
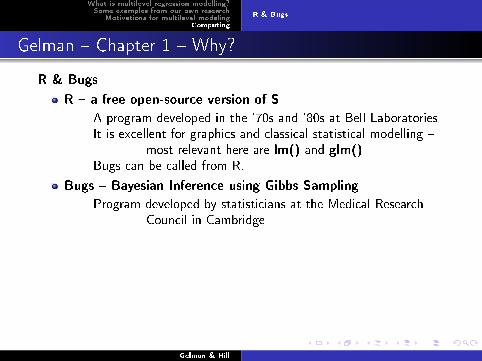
R & Bugs
R � a free open-source version of S
A program developed in the '70s and '80s at Bell Laboratories
It is excellent for graphics and classical statistical modelling �most relevant here are lm() and glm()
Bugs can be called from R.
Bugs � Bayesian Inference using Gibbs Sampling
Program developed by statisticians at the Medical ResearchCouncil in Cambridge
Most powerful versions available � WinBugs 1.4 & OpenBugsThe Bugs modelling language has a modular form that allows
the user to put together all sorts of Bayesian models,including multilevel models
Methodology � set up data in R, �t models in Bugs, then goback to R for further statistical analysis using the�tted models.
Gelman & Hill

What is multilevel regression modelling?Some examples from our own research
Motivations for multilevel modelingComputing
R & Bugs
Gelman � Chapter 1 � Why?
R & Bugs
R � a free open-source version of S
A program developed in the '70s and '80s at Bell LaboratoriesIt is excellent for graphics and classical statistical modelling �
most relevant here are lm() and glm()
Bugs can be called from R.
Bugs � Bayesian Inference using Gibbs Sampling
Program developed by statisticians at the Medical ResearchCouncil in Cambridge
Most powerful versions available � WinBugs 1.4 & OpenBugsThe Bugs modelling language has a modular form that allows
the user to put together all sorts of Bayesian models,including multilevel models
Methodology � set up data in R, �t models in Bugs, then goback to R for further statistical analysis using the�tted models.
Gelman & Hill

What is multilevel regression modelling?Some examples from our own research
Motivations for multilevel modelingComputing
R & Bugs
Gelman � Chapter 1 � Why?
R & Bugs
R � a free open-source version of S
A program developed in the '70s and '80s at Bell LaboratoriesIt is excellent for graphics and classical statistical modelling �
most relevant here are lm() and glm()Bugs can be called from R.
Bugs � Bayesian Inference using Gibbs Sampling
Program developed by statisticians at the Medical ResearchCouncil in Cambridge
Most powerful versions available � WinBugs 1.4 & OpenBugsThe Bugs modelling language has a modular form that allows
the user to put together all sorts of Bayesian models,including multilevel models
Methodology � set up data in R, �t models in Bugs, then goback to R for further statistical analysis using the�tted models.
Gelman & Hill

What is multilevel regression modelling?Some examples from our own research
Motivations for multilevel modelingComputing
R & Bugs
Gelman � Chapter 1 � Why?
R & Bugs
R � a free open-source version of S
A program developed in the '70s and '80s at Bell LaboratoriesIt is excellent for graphics and classical statistical modelling �
most relevant here are lm() and glm()Bugs can be called from R.
Bugs � Bayesian Inference using Gibbs Sampling
Program developed by statisticians at the Medical ResearchCouncil in Cambridge
Most powerful versions available � WinBugs 1.4 & OpenBugs
The Bugs modelling language has a modular form that allowsthe user to put together all sorts of Bayesian models,including multilevel models
Methodology � set up data in R, �t models in Bugs, then goback to R for further statistical analysis using the�tted models.
Gelman & Hill

What is multilevel regression modelling?Some examples from our own research
Motivations for multilevel modelingComputing
R & Bugs
Gelman � Chapter 1 � Why?
R & Bugs
R � a free open-source version of S
A program developed in the '70s and '80s at Bell LaboratoriesIt is excellent for graphics and classical statistical modelling �
most relevant here are lm() and glm()Bugs can be called from R.
Bugs � Bayesian Inference using Gibbs Sampling
Program developed by statisticians at the Medical ResearchCouncil in Cambridge
Most powerful versions available � WinBugs 1.4 & OpenBugsThe Bugs modelling language has a modular form that allows
the user to put together all sorts of Bayesian models,including multilevel models
Methodology � set up data in R, �t models in Bugs, then goback to R for further statistical analysis using the�tted models.
Gelman & Hill

What is multilevel regression modelling?Some examples from our own research
Motivations for multilevel modelingComputing
R & Bugs
Gelman � Chapter 1 � Why?
R & Bugs
R � a free open-source version of S
A program developed in the '70s and '80s at Bell LaboratoriesIt is excellent for graphics and classical statistical modelling �
most relevant here are lm() and glm()Bugs can be called from R.
Bugs � Bayesian Inference using Gibbs Sampling
Program developed by statisticians at the Medical ResearchCouncil in Cambridge
Most powerful versions available � WinBugs 1.4 & OpenBugsThe Bugs modelling language has a modular form that allows
the user to put together all sorts of Bayesian models,including multilevel models
Methodology � set up data in R, �t models in Bugs, then goback to R for further statistical analysis using the�tted models.
Gelman & Hill

What is multilevel regression modelling?Some examples from our own research
Motivations for multilevel modelingComputing
R & Bugs
Gelman � Chapter 1 � Why?
Where next?
The deep end!
Part 2B, Chapter 16, Page 345 � Multilevel modelling in Bugs andR: the basics
Gelman & Hill

What is multilevel regression modelling?Some examples from our own research
Motivations for multilevel modelingComputing
R & Bugs
Gelman � Chapter 1 � Why?
Where next?
The deep end!
Part 2B, Chapter 16, Page 345 � Multilevel modelling in Bugs andR: the basics
Gelman & Hill

What is multilevel regression modelling?Some examples from our own research
Motivations for multilevel modelingComputing
R & Bugs
Gelman � Chapter 1 � Why?
Where next?
The deep end!
Part 2B, Chapter 16, Page 345 � Multilevel modelling in Bugs andR: the basics
Gelman & Hill


