29
+ Data Analytics and Financial Forecasting PSFOA Meeting May 14 2014 Presented by Martin Chaw, Fiscal Manager City of Bellevue Utilities Department

+
Data Analytics andFinancial ForecastingPSFOA MeetingMay 14 2014
Presented by Martin Chaw, Fiscal ManagerCity of Bellevue Utilities Department

+ Agenda
Today’s presentation:
Build upon the tools/tips/tricks presented in “Excel Wizardry” byK.Lorentzen in September 2013
Learning Objectives
Managing and manipulating large amounts of data
Organizing and quickly building ad-hoc management reports
Using the tools/power of Excel to evaluate/assess/forecast financialtrends

+ Background
Data analytics
Disconnect between what I needed and what was available
Needs:
As with any project, need access to large amounts of information
Look for trends and significant variances from plan
Monthly financial reports to Council
Historical research
Trends
Identify issues and plan for adjustments

+ What was readily available
Financial system pre-packaged reports
Pluses:
Real-time evaluation of budget to actuals
Drill down to transactional details
Use report filter settings to query for information
Minuses:
Multiple reports, some can be quite lengthy
Reports can be inflexible
Duplicate entries / Export to Excel and manipulate
Time consuming

+
Reports provided good infobut were limited in manyrespects- Not able to see month to
month activity- Not able to group
selected cost centers- Needed a better mouse
trap
+ My Need
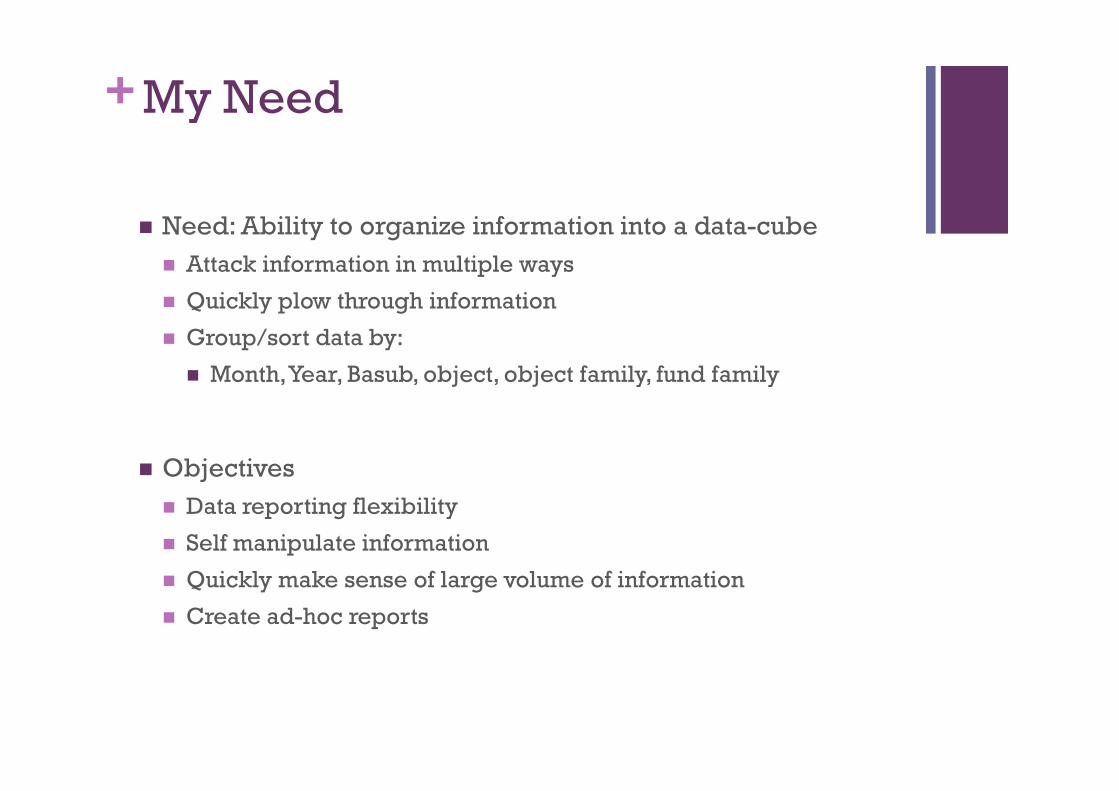
Need: Ability to organize information into a data-cube
Attack information in multiple ways
Quickly plow through information
Group/sort data by:
Month,Year, Basub, object, object family, fund family
Objectives
Data reporting flexibility
Self manipulate information
Quickly make sense of large volume of information
Create ad-hoc reports

+ How I attacked this problem
Went to ourIT folks witha vision

+ My wish was granted!

+ Sample reports created using my DataCube

+ How did I produce these reports?
Using convenient tools of MS Excel
Pivot tables: Interactive tool enabling user to summarize largeamounts of data quickly and simply.
Sumif function: Formulaic function enabling user to sum range ofcells meeting a single criteria
Sumifs function: Formulaic function enabling user to sum range ofcells meeting multiple criteria
Choose function: Executing specific set of commands based uponselected criteria (great for modeling and toggling between options)
Left, Right, Mid functions: Parsing character strings for further dataanalytics

+ PIVOT Tables

+ SUMIF function=sumifs(criteria_range,criteria,sum_range)

+ SUMIFS function=sumifs(sum_range,criteria_range1,criteria1,criteria_range2,criteria2,…)

+ CHOOSE function=choose(index_num,value_1,value_2,value_3,value_4,…)
=CHOOSE($O$3,L6*(1+$P$6),L6*(1+$P$7),L6*(1+$P$8),L6*(1+$P$9))
CHOOSEfunction isconvenient formodeling andquickly togglingbetween multiplescenarios

+ Left, Mid, Right functions
This function is convenient for parsing asingle string of data into more meaningfulparts.
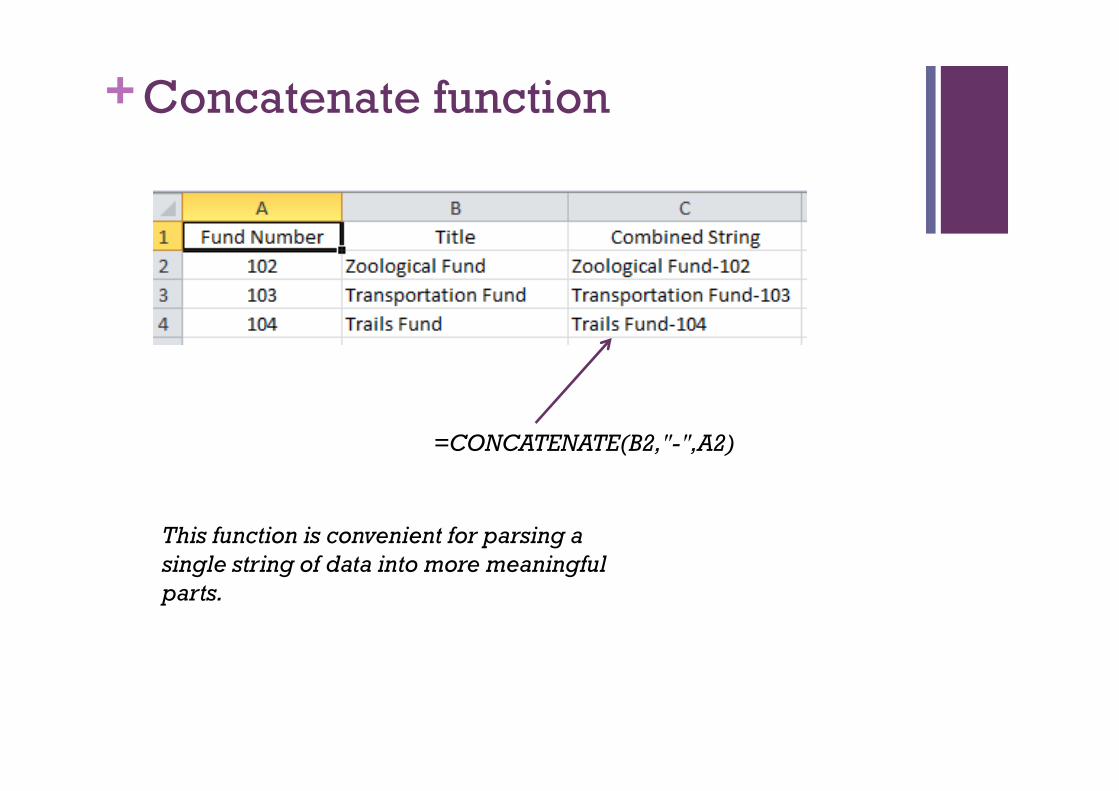
+ Concatenate function
This function is convenient for parsing asingle string of data into more meaningfulparts.
=CONCATENATE(B2,"-",A2)

+ Financial Forecasting
Armed with datacube and all of its powers
What to do with it
Trends
Historical patterns
Correlations
Forecasting

+ Financial Forecasting
Challenges
Seasonality
One time events (ie, outliers)
Organizational changes
Policy/Legislative changes
Mitigating these challenges
Knowing your data
Being aware of one-time significant events that can affect youranalysis (ie, Outliers)
Ask & Dig (evaluating transactional information to understandwhat is happening)

+ Historical patterns
High level observationscan be quickly identifiedwith a simple table suchas this
Significant observations:
Change in billingprocess starting 2011?
Not surprisingly majorityof renewals paid inDecember and into firstmonths of next year
Next steps: triangulatethis data with renewalactivity
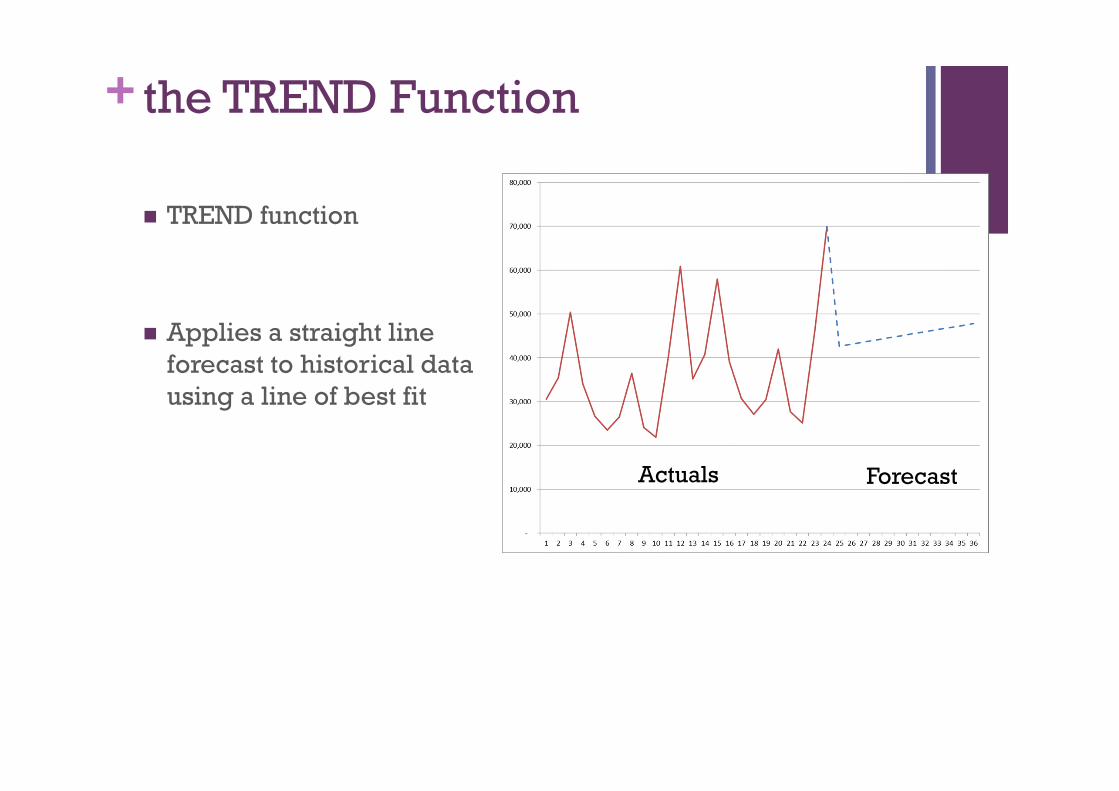
+ the TREND Function
TREND function
Applies a straight lineforecast to historical datausing a line of best fit
Actuals Forecast

+ How to Build a TREND function
=TREND($C$2:$C$25,$B$2:$B$25,B26)
Where:
Historical Actuals (referred to as knownY‘s C2-C25)
Historical Periods (referred to as known X‘s A2-A25)
Your forecast period (referred to as new X A26-A37)
Things to be aware of:
Outliers can skew the trend line (in which case youwill want to ignore these)
Have a sufficiently sized historical dataset (onemonth does not make a trend)
Study data and organize into more meaningfulperiods (e.g. Quarterly, Semi-Annually, Annually)to see patterns

+ Trend Function
Trend function would nothave worked well withmonthly data
… But would have likelywork well with the annualdata
Note: this is the same data aspresented on slide 17

+ Moving Averages
Moving Averages can beused to smooth out the rawdata and help you spottrends
3- or 6-month averagesgenerally provide a goodtrend line

+ Trendlines
Forecasting tool in MS Excel
Attempts to predict trend based upon regression analysis
Best fit measured by R Squared value (1.0 means a perfect fit)
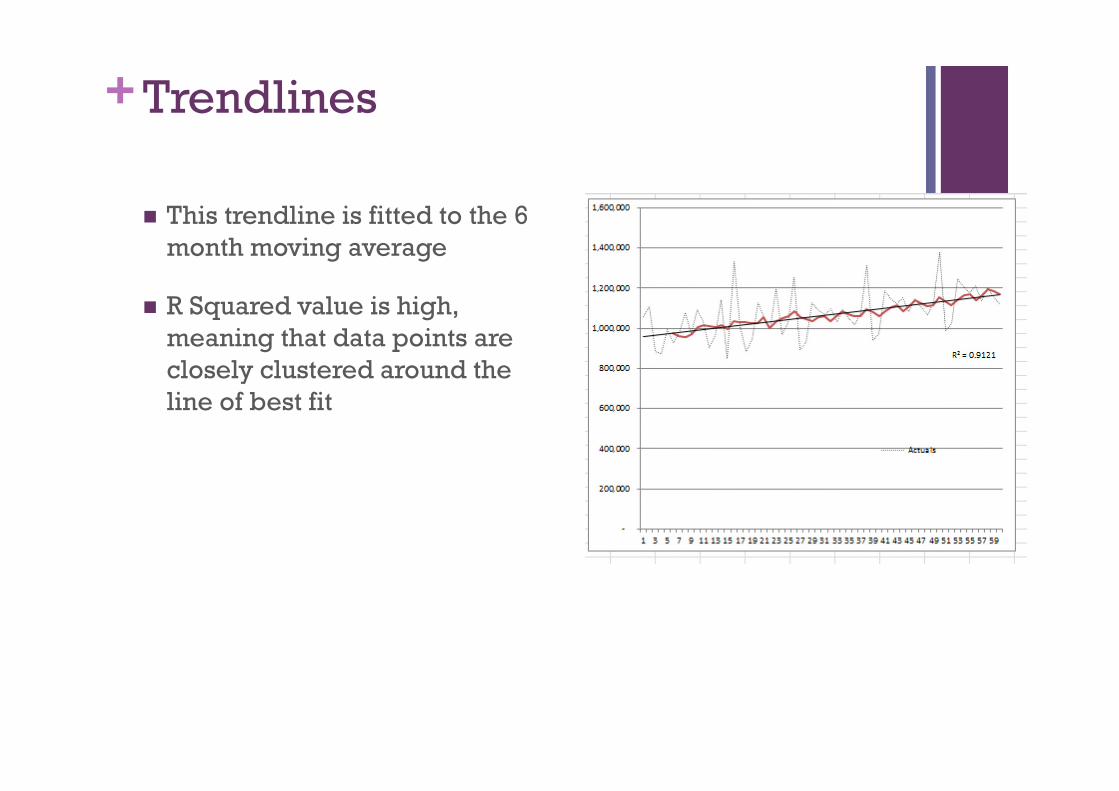
+ Trendlines
This trendline is fitted to the 6month moving average
R Squared value is high,meaning that data points areclosely clustered around theline of best fit

+ Different Types of Trendlines

+ How to Create a Trendline
Select your data series on thechart
Right click
Select “add Trendline”
Select type of line
Select additional information todisplay

+ Final Thoughts
Get access to information
Organization
Sufficient history/granularity
Know your data
Outliers
Organizational/Policy changes can affect information
Tell a really good story using it
Always a story to be told
Uncover it by evaluating / assessing the information
Forecasting is more art than science
Share it and empower those around you

+
End of Presentation


