62
Data Analytics: Continuous Controls Monitoring & Predictive Analytics March 13, 2014 Parm Lalli, CISA, ACDA Matt Osbeck, CPA, CIA, ACDA
Data Analytics: Continuous Controls Monitoring & Predictive Analytics
March 13, 2014
Parm Lalli, CISA, ACDA
Matt Osbeck, CPA, CIA, ACDA

Sunera Snapshot
Copyright © 2013 Sunera LLC. 2
ACL
SAP

About Our Speakers
Parm Lalli, CISA, ACDA
Parm is an ACL Certified Data Analyst (ACDA) and is the National Director for our Data Analytics Practice. Parm has over 10 years of Data Analytics experience, leading many Continuous Controls Monitoring implementations for organizations within many different industries. Parm has worked very closely traditionally with ACL and ACL products. Prior to joining Sunera, Parm was employed with ACL and worked with audit departments, business unit managers, and end users to address their Data Analytics needs by using ACL. He worked on developing scripts across many different industries and applications.
Copyright © 2013 Sunera LLC. 3
Matt Osbeck, CPA, CIA, ACDA
Matt is a Senior Manager in the Los Angeles office of Sunera LLC and is an ACL Certified Data Analyst (ACDA). Matt has over 5 years experience leading data analytics projects. Matt provides 3-day ACL/Arbutus training courses and serves as a lead analytic developer. Matt has vast experience developing analytics for multiple ERP systems, including SAP to test a broad range of IT and operational/financial controls. His experience as has included data analysis of Order-to-Cash, Procure-to-Pay, FCPA / ABAC, IT, Manufacturing, Payroll/HR, Forensic/Fraud and other ad-hoc analysis for clients across many industries.
Prior to joining Sunera, Matt held Internal Audit roles at Wal-Mart, Inc. and Informa plc., a London-based multi-national performing financial, operational and compliance audits.

What Is Continuous Controls Monitoring?
Continuous Controls Monitoring (CCM) describes the techniques of continuously monitoring and auditing an IT system. Typically, CCM solutions will be applied to Enterprise Resource Planning systems. A Continuous Controls Monitoring solution can help to reduce compliance costs (through decreased manual controls and manual testing of those controls), strengthen a company's internal control environment, and reduce the risk of unintentional or intentional errors and fraud. The key objective of CCM is: – To enable near real-time and regular monitoring of controls
effectiveness. By monitoring the compliance with key controls, your organization can
obtain ongoing assurance on the accuracy and validity of large volumes of data flowing through your systems, enabling the isolation and containment of control failures on a timely basis.
Copyright © 2013 Sunera LLC. 4

Common CCM Tools
A number of tools are available. The right choice will depend on each company’s business requirements and will include how well the proposed tool will integrate with existing systems and tools. ACL SAP or Oracle GRC Approva Oversight Actuate BIRT Actuate e.Reports Cognos 8 BI Report Studio Crystal Reports InformationBuilders WebFOCUS JasperServer/iReport Microsoft SQL Server Reporting Services MicroStrategy Report Services SAS Web Report Studio Gartner February 2009: Critical Capabilities for Business Intelligence Reporting Copyright © 2013 Sunera LLC. 5

Data Analytic Opportunities
Copyright © 2013 Sunera LLC. 6

ISACA Study on CCM
10 Fortune 500 Organizations were involved Identify Challenges faced by Organizations Top Data Analytics tools used
– ACL – Idea – Arbutus – Tableau
Group of 10 shared knowledge and agreed upon analytics 7 Recommendations made
Copyright © 2013 Sunera LLC. 7

CCM Documents Required
CCM Project Checklist – This document is a complete Project Checklist of typical CCM project
tasks and responsibilities Data Analytic Tests
– This spreadsheet has standard analytics for many different business processes. Included are the purposes for each analytic
Requirements Document – This is a document that outlines the requirements to carry out a CCM
initiative for a specific business process. This document includes standard tests, the purpose of each test, frequency, parameters, and source data mapping.
Copyright © 2013 Sunera LLC. 8

CCM Documents Required
Application Guide – This document is a guide on how to use this CCM application. It
includes information on how to run tests manually and change parameters. It contains information about source data and how to re-run the process in case of failure.
Technical Guide – This document is the technical guide required by IT to rebuild the server.
It contains information on how to configure the server and its related components.
Copyright © 2013 Sunera LLC. 9

Types of Data Analytics
Ad Hoc Analysis – Time consuming – Data typically supplied by IT – Up to 50% more budgeted time required – Difficult to repeat tests if not documented – Exploratory type analysis
Repeatable Analysis – More skills required than Ad Hoc testing – Pre-defined scripts created to perform same tests over and over again – More consistent and can be run more frequently – Data may be supplied, but imports are automated – Good documentation for the scripts/analytics
Copyright © 2013 Sunera LLC. 10

Types of Data Analytics
Centralized Analysis – Development, storing, and running of repeatable analytics is centralized – A single, powerful server is set up for the repeatable analytics – Data imports are all automated – Standards in place for developing tests and scripting – Source data and results are stored on server – Better security for data files and result files – Great deal of documentation on tests, scripts, data, and sample logic
Continuous Auditing – Process of performing audit related tasks in a continuous manner – Continuous risk and control assessments types of testing – Compliance (SOX) control testing – Security even monitoring
Copyright © 2013 Sunera LLC. 11

Types of Data Analytics
Continuous Controls Monitoring (CCM) – Very skilled and experienced individuals are able to script and
implement – All analytics and data imports are fully automated – No interaction from end users required – Allows for notifications to be sent to Business Unit Manager about
identified exceptions – May involve a web dashboard interface, workflow, remediation tracking,
and heat maps – Better role based security for reviewing results – May provide management with areas for improvement with internal
controls – A better likelihood of identifying fraudulent activity – Acts as a very good deterrent system
Copyright © 2013 Sunera LLC. 12

Benefits of Data Analytics
Access data from many disparate sources
Independent of the systems and people being audited
100% transaction coverage with unlimited file sizes
Read-only data access to ensure the integrity of the data
Audit trails are available to identify steps taken
Scripting/batching capabilities to capture test logic (like macros)
Very fast to run and produce results Easier to comply with the provisions
of Section 404 of the Sarbanes-Oxley Act
Close control loopholes before fraud escalates
Quantifies the impact of fraud Cost-effective Acts as a deterrent Can be automated for continuous
monitoring Provides focus based on risk and
probability of fraud Direct pointers to critical evidence Support for regulatory compliance Logs for review and evidence Scalability – Build on what you need External Audit reliance
Copyright © 2013 Sunera LLC. 13

Data Analytics Automation Benefits
Validates effectiveness of internal controls Identifies occurrences of potential fraud Identifies transactional errors Identifies segregation of duties violations Identifies process deficiencies Utilizes a technology driven process Tests 100% of transactions as opposed to sampling Accesses data across disparate systems and geographies Provides prompt notification of control breakdowns Quantifies exposure of business risk Provides an auditable history of compliance tests and follow-up
activities Enables better allocation of skilled audit/technical resources within the
organization
Copyright © 2013 Sunera LLC. 14

What Are the Challenges
Implementing change
Changing culture for the organization Defining what CCM can accomplish Gathering large volumes of data in multiple applications Understanding data and processes Monitoring of manual controls Relying on reporting Implementing costs Integrating with multiple compliance frameworks and into the
existing IT environments
Copyright © 2013 Sunera LLC. 15
HOW DO YOU MAXIMIZE YOUR INVESTMENT IN CCM?

Where to Apply Data Analytics
What controls are eligible for automated testing? Electronic data is available and accessible. Access to data through an automated process is possible. Rules can be documented or captured within test logic. Internal controls and Compliance controls are eligible. What are the ideal conditions for automated testing? Large number of controls are in place. Large volumes of data are available. Multiple systems and data sources are available. Data is at multiple locations Fraudulent activities are caught prior to a transaction reaching the end
of a process.
Copyright © 2013 Sunera LLC. 16

Data Analytics Steps for Mature Rollout
Steps for Implementing Continuous Controls Monitoring/Auditing
1. Vendor selection and product evaluation 2. Assess controls 3. Scope and design system requirements 4. Data warehouse implementation 5. Data access requirements definition 6. Analytics script development 7. Results verification and review 8. Adjusting logic, parameters, and thresholds 9. Rollout
Copyright © 2013 Sunera LLC. 17

Data Analytics Project Team
Project Team Skills
– Project Manager – Managers who organize and manage all resources to complete the implementation project within the defined scope, time, and cost
– Business – Key owners of each business process to be monitored – Audit – Process and control experts to identify areas of risk and test
design – IT – Key owners of the data and primary systems related to each of the
processes – Technical – Specialized experts to build, configure, and implement the
monitoring tools
Copyright © 2013 Sunera LLC. 18

Data Analytics — Sunera Approach
Step 1
– Review existing business process risk documentation – Review existing analytics for efficiency and effectiveness – Update existing analytics for full automation
Step 2
– Conduct additional reviews of business processes and identify risk areas
– Identify opportunities for improving process through Data Analytics – Identify analytics opportunities within specific business processes – Identify and verify all compensating controls
Copyright © 2013 Sunera LLC. 19

Data Analytics — Sunera Approach
Step 3
– Add risk rating for identified analytics across business units • High, Medium, Low
– Quantify risk areas based on business units ($$) – Obtain management agreement on ratings and quantitative measures
Step 4
– Create requirements documentation • Data requirements from all available sources • Confirm test logic • Confirm required parameters • Confirm reporting fields
– Obtain agreement and sign off on requirements document
Copyright © 2013 Sunera LLC. 20

Data Analytics — Sunera Approach
Step 5
– Obtain sample data from all required sources • Directly or data dump
– Verify data based on requirements document • All fields present • No corruption of data
– Perform data preparation Step 6
– Create scripts for tests – Create Excel result sets – Have end user and/or business unit manager verify results – Tweak any tests to remove false positives
Copyright © 2013 Sunera LLC. 21

Data Analytics—Sunera Approach
Step 7
– Create scheduling for all tests • Daily, weekly, monthly, quarterly
– Move all pieces into production environment – Verify data connections/feeds
Step 8
– Create documentation for handoff – Provide training to CCM stakeholders
Copyright © 2013 Sunera LLC. 22

A Mature Data Analytics Overview
Self-contained on dedicated server Fully automated and scheduled Alerts to business unit managers or stakeholders of results Clear and concise documentation
– For all scripted analytics – For setup and configuration
Training provided to any and all individuals involved, including new hires
Ongoing review of existing analytics and possible new analytics based on new business processes
Maintain a change log for any addition or removal of scripts or changes to configuration
Copyright © 2013 Sunera LLC. 23

Copyright © 2013 Sunera LLC. 24
Data Analytics Examples

Data Analytics Examples
Purchasing Purchase splitting
Purchase cards Inappropriate, unauthorized purchases
Travel & Entertainment Expenses Duplicate claims, inappropriate activity Adult bars using MCC and description
Payroll Phantom employees SSN Test
Copyright © 2013 Sunera LLC. 25

Data Analytics Examples
Accounts Payable Questionable invoices
Invoices without a valid P.O. Sequential invoices Vendor Invoice Formats
Duplicate invoices Multiple invoices for same item description Invoices for same amount on the same date Multiple invoices for same P.O. and date
Vendors Phantom vendors
PO BOX Test Vendor/Employee collusion One time Vendors or Vendors not used in over a year
Copyright © 2013 Sunera LLC. 26

Data Analytics — Non-Industry Specific
Purchasing Questionable purchases
P.O./invoices with amount paid > amount received Purchases of consumer items
Split purchases Similar transactions for same vendor within specific timeframe
Inflated prices Compare prices to standard price lists or to historical prices
Copyright © 2013 Sunera LLC. 27

Data Analytics — Non-Industry Specific
Purchase Cards
Split purchases to avoid purchasing card limits Purchases processed as two or more separate transactions Identified by isolating purchases from specific vendors within short
periods of time Favored vendors for kickbacks
Trend analysis to compare current transaction volumes to previous time period
Suspicious purchases Transactions that occur on weekends, holidays, or vacations Travel related charges not on travel expenditure reports
Copyright © 2013 Sunera LLC. 28

Data Analytics—Non-Industry Specific
Time and Expense Duplicate claims
Submitting claims twice Tracking “no receipt” claims
Isolate expenses without receipts and identify underlying trends through profiling techniques
Threshold reviews Track personnel exceeding thresholds
Inappropriate activity Compare expenses to travel records to ensure expenses claimed for
valid trips Trends by employee compared to peers Fuel vs Mileage claims
Fuel purchase location vs Branch location
Copyright © 2013 Sunera LLC. 29

Data Analytics Sample Logic
Duplicates
– Exact Duplicate – All fields identical within investigation period – Almost Duplicate Variance, Same-Different Duplicates
• Purchase Order: Same Vendor and Similar Amount • Payments: Different Vendor Same Bank Account • Payments: Same Vendor Different Invoice Number Similar Amount • Payments: Same Vendor Same Invoice, Same Amount, Different Date • Payments: Same Vendor Name, Same Amount, Same Date, Different
Vendor ID
Copyright © 2013 Sunera LLC. 30
Data Analytics Sample Logic
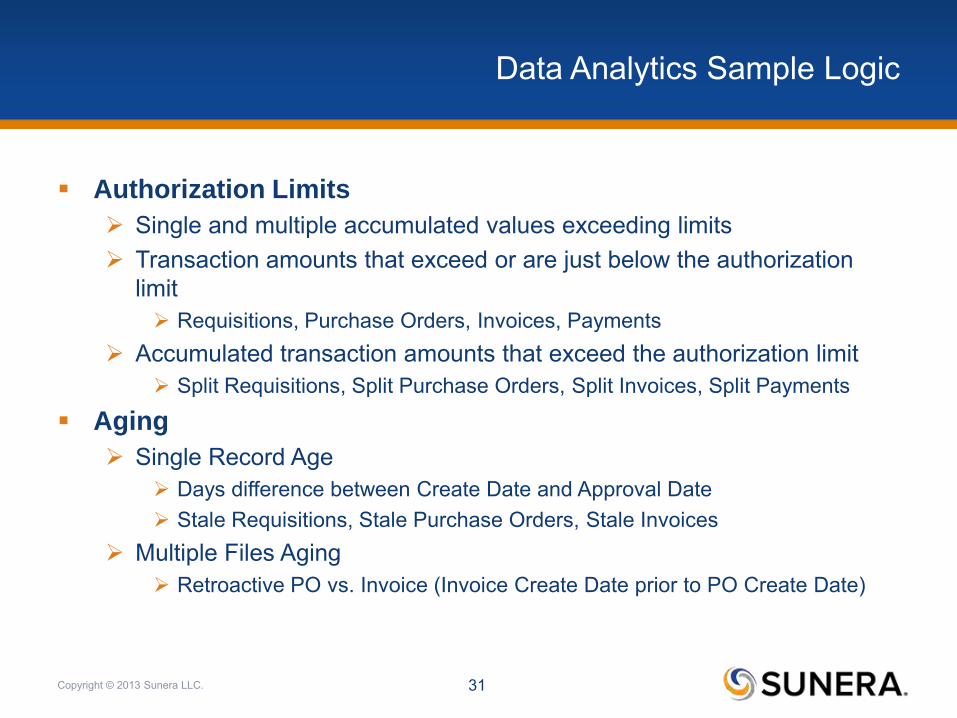
Authorization Limits
Single and multiple accumulated values exceeding limits Transaction amounts that exceed or are just below the authorization
limit Requisitions, Purchase Orders, Invoices, Payments
Accumulated transaction amounts that exceed the authorization limit Split Requisitions, Split Purchase Orders, Split Invoices, Split Payments
Aging
Single Record Age Days difference between Create Date and Approval Date Stale Requisitions, Stale Purchase Orders, Stale Invoices
Multiple Files Aging Retroactive PO vs. Invoice (Invoice Create Date prior to PO Create Date)
Copyright © 2013 Sunera LLC. 31

Data Analytics Sample Logic
Data Quality – Identifying fields where critical data elements deviate from expected values
and formats • Invalid ID formats, missing key values, invalid characters, invalid values • Requisitions, Purchase Orders, Invoices, Received Goods, Payments
Segregation of Duties – SOD Security Table Level
• Comparing roles within ERP security tables to a conflict matrix – SOD at Transaction Level
• Single Record Create/Modify vs. Approve » Requisitions, Purchase Orders, Invoices, Payments
• Multiple files » Create/Modify PO vs. Create/Modify/Approve Vendor Master Update » Create/Modify PO vs. Receiver ID for Goods Received » Create/Modify PO vs. Create/Modify Invoice
Copyright © 2013 Sunera LLC. 32

Data Analytics Sample Logic
Numeric Pattern Matching
Benford digital analysis: exceptions which reveal themselves as digital anomalies. Higher than expected PO amount of $49,000, bypassing controls on amounts
over $50,000. Numeric Sequence or Gaps: exceptions which reveal themselves in a
numeric sequence or gap. Invoice Number Sequences (suspect invoices)
Transactions with even dollar amounts based on a divisor number, minimum transaction count, and threshold value. Expense Report Amounts with even dollar values
Copyright © 2013 Sunera LLC. 33

Data Analytics Sample Logic
String Pattern Matching – Name Match (% word match)
• Word exclusion lists to remove common words like: The, company, and, etc. • Invoice: Employee Vendor Name Match – (Phantom Vendor) • Invoice: Prohibited Vendors
– Address Match (Numeric or Alpha Numeric match) • Match on zip/postal code plus numeric digits from address field. • Match on alpha-numeric values from the address field (no spaces or special
characters) • Invoice: Employee Vendor Address Match – (Phantom Vendor)
– Soundslike Match (phonetic match) • SOUNDEX algorithm • SOUNDSLIKE algorithm • Payroll: similar employee names • T&E: Different expense cards assigned to employees with similar names
Copyright © 2013 Sunera LLC. 34
Transition CCM into Predictive Analytics
Copyright © 2013 Sunera LLC. 35
Transition CCM into Predictive Analytics

Data Analytic Classification
Copyright © 2013 Sunera LLC. 36

Predictive Analytics Defined
Predictive Analytics… “…is business intelligence technology that produces a predictive score for each customer
or other organizational element. Assigning these predictive scores is the job of a predictive model which has, in turn, been trained over your data, learning from the experience of your organization.”
Source: Predictive Analytics World
“..encompasses a variety of techniques from statistics, modeling, machine learning, and data mining that analyze current and historical facts to make predictions about future or otherwise unknown events.
In business, predictive models exploit patterns found in historical and transactional data to identify risks and opportunities. Models capture relationships among many factors to allow assessment of risk or potential associated with a particular set of conditions guiding decision making for candidate transactions.
Predictive analytics is used in actuarial science, marketing, financial services, insurance, telecommunications, retail, travel, healthcare, pharmaceuticals and other fields.”
Source: Wikipedia
Copyright © 2013 Sunera LLC. 37

Copyright © 2013 Sunera LLC. 38
Why is Predictive Analytics Important?
Enable forecasting by allowing organizations to learn from data based on historical trends
Provide insight of what’s expected to happen based on data populations
Allow management determine growth potential
Gain a competitive advantage
Copyright © 2013 Sunera LLC. 39

Analytic Tools
Copyright © 2013 Sunera LLC. 40
There are a wide variety of tools that specialize in or offer the ability to develop predictive analytics, including but not limited to:
Copyright © 2013 Sunera LLC. 41

Predictive Analytic Uses
Copyright © 2013 Sunera LLC. 42
Area Prediction
Credit Scores Based on many criteria, several agencies have an entire business based on predicting how much risk you present to others in defaulting on your debt.
Fraud Identify control weaknesses that may lead to fraud or estimate the amount of theft (shrink) in retails stores around given demographics.
Marketing & Sales Predicting sales based on varied pricing and product models.
Security Risk Indicators
(KRIs)
Predicting vulnerability to external threats that may impact the organization
Customer Retention &
Turnover Rates
Use demographic / socio-economic information about customers to determine their likelihood to remain a customer and how much they will spend over their lifetime (Large Retailer).
Inventory / Production Forecast the timing of orders and production at the customer level and seasonality level (not just sales)

Real world uses of Predictive Analytics
Copyright © 2013 Sunera LLC. 43 Source: Harvard Business Review – January 2006

Amazon Example of Predictive Analytics
Copyright © 2013 Sunera LLC. 44
Fact based on your search Predictions based on Others

Kayak Example of Predictive Analytics
Recommendations on historic trends
Copyright © 2013 Sunera LLC. 45

Target Example of Predictive Analytics
Target knows when you are pregnant! – Target assigns each customer an ID based on credit card number and
other details. – Then compares purchases made by that person and with a purchasing
pattern of pregnant women. – Example: One high school girl was purchasing products that indicated
she was pregnant (high pregnancy score based on the Target fact pattern). Target sent coupons to her house (which happened to be her parents) for diapers, etc. The dad was appalled that someone would send diaper coupons to a high school girl. Dad then drove to target and demanded to speak with a manager. Later he apologized to the manager after speaking with his daughter, and found out there are some things going on in his house that Target knew but he did not.
Copyright © 2013 Sunera LLC. 46

Google Search Example – 4 Step Methodology
Copyright © 2013 Sunera LLC. 47
1. Identify the Objective
• Web search example would be to find the actual page you want to read based on the query submitted
2. Figure out what Levers you have to pull • Levers would be things that you can change yourself. Lever
Google pulled is the ordering of sites 3. What Data we have and can connect that hooks up those levers
with the outcome we want • Data on website tells us people that like website X will also like
Y 4. Hook together the Levers to the objectives using the data.
This is how Google was built

Other Examples
Pandora – Automatically plays music based on music you like / select
Netflix – Selects movies/TV Shows you might like based on what you recently
watched. Internet Ad Placements
– These are now highly targeted based on things you have searched for. Apple
– Calculate production numbers of their products based on past sales
Copyright © 2013 Sunera LLC. 48

Predictive Analytics Models
Predictive Models • models of the relation between the specific performance of a unit in a
sample and one or more known attributes or features of the unit. • objective of the model is to assess the likelihood that a similar unit in a
different sample will exhibit the specific performance Descriptive Models
• models quantify relationships in data in a way that is often used to classify customers or prospects into groups
• models identify many different relationships between customers or products
Decision Models • Models describe the relationship between all the elements of a
decision • generally used to develop decision logic or a set of business rules
that will produce the desired action for every customer or circumstance.
Copyright © 2013 Sunera LLC. 49

Regression Analysis
Copyright © 2013 Sunera LLC. 50
Regression • The difference between regression and descriptive is that regression
deals with numerical/continuous target attributes, whereas descriptive deals with discrete/categorical target attributes.
• Ie. if the target attribute contains continuous (floating-point) values, a regression technique is required. If the target attribute contains categorical (string or discrete integer) values, a classification technique is called for.
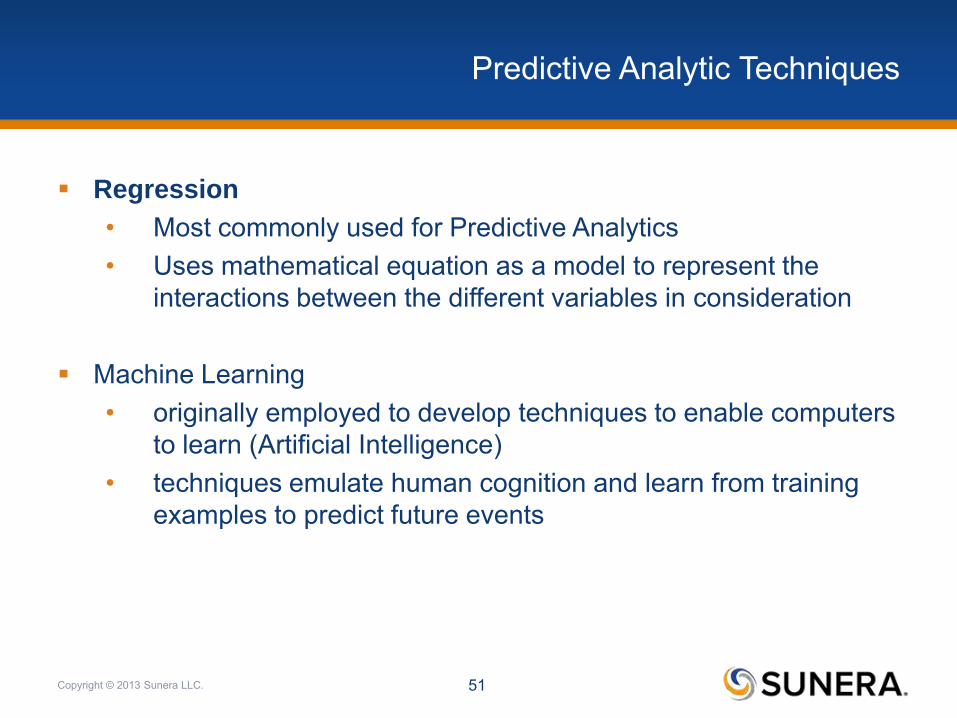
Predictive Analytic Techniques
Regression
• Most commonly used for Predictive Analytics • Uses mathematical equation as a model to represent the
interactions between the different variables in consideration
Machine Learning • originally employed to develop techniques to enable computers
to learn (Artificial Intelligence) • techniques emulate human cognition and learn from training
examples to predict future events
Copyright © 2013 Sunera LLC. 51

Types of Regression Analysis
Regression Types and Their Uses
Linear Can be adapted to a wide variety of data types, including Time-series, cross-sectional, pooled or panel data
Partial and Stepwise Measures how one independent variable and the dependent variable are related after determining the effect of all the other independent variables in the model
Logit or Probit Allow one to predict a discrete outcome (yes or no) from a set of variables that may be continuous, discrete, and/or dichotomous
Regression Splines Allow different regression models to model data over different regions of the dependent variable
Copyright © 2013 Sunera LLC. 52

Regression Basics
Explain relationships between variables by examining the entire populations. However, you are only drawing data from your segment of the population (i.e. your population of customers is not the entire population across the industry/product segment). To ensure the best results: • Build the best model of the “TRUE” relatioinships between variables. • Analyze confidence in the model (mathematical description of its
accuracy)
Copyright © 2013 Sunera LLC. 53

Regression Analysis
Copyright © 2013 Sunera LLC. 54
Regression (con’t) • The most common form of regression is linear regression, in which a
line that best fits the data is calculated, that is, the line that minimizes the average distance of all the points from the line.
• This line becomes a predictive model when the value of the dependent variable is not known; its value is predicted by the point on the line that corresponds to the values of the independent variables for that record.

Regression Analysis
Copyright © 2013 Sunera LLC. 55
Regression (con’t) • Time Series - models are used for predicting or forecasting the future
behavior of variables.
• Account for the fact that data points taken over time may have an internal structure that should be accounted for ie. Trends

Copyright © 2013 Sunera LLC. 56

Sunera Predictive Approach
Copyright © 2013 Sunera LLC. 57
Predictive Analytics Solution
Phase 1:
Identify Internal & External Variables
Phase 2:
Determine Data Sources
Phase 3:
Develop & Run
Analytics
Phase 4:
Remove False Positives
Phase 5:
Implement Analytics
Phase 6:
Monitor Progress

Gift Card Case Study
Developed at global multi-billion dollar restaurant company with many different brands
Goal: Calculate Breakage (Unredeemed Gift Cards) Revenue & Revenue flows to the organization.
Factors Impacting Gift Card Sales /Redemptions: – External Variable(s):
• Economy – Internal Variable(s):
• Seasonal Sales and Promotions • Brand Selling the Card • Sales Channel vs In-Store
Results: – Level of cross-redemption of branded cards – GAAP based rationale for Breakage Revenue – FP&A Forecast of Gift Card Sales, Redemptions, Breakage under multiple
scenarios (Automated)
Copyright © 2013 Sunera LLC. 58

Copyright © 2013 Sunera LLC. 59

Data Analytics Rollout Options
Insource − Internal resources plan and deploy all CCM initiatives
Outsource − Sunera resources (or other provider) perform all the activities required for
CCM rollout − Provide documentation and training to client staff for maintenance of the
program Co-source
− Sunera (or other provider) provides the knowledge and expertise and works with client staff
− Shares the work of developing and creating tests − Provides guidance − Performs reviews of client work conducted and provide feedback/insight − Conducts coaching sessions − Provides ongoing support and advice
Copyright © 2013 Sunera LLC. 60

Data Analytics Training Option
Sunera Training Offers:
2 or 3 day training classes
− Training is hands-on and classes are tailored to meets your participants’ skill levels (beginner, intermediate, advanced).
− We customize the training by integrating your company’s data into the seminar, so your employees get to work with realistic company scenarios.
− Sunera is registered with the National Association of State Boards of Accountancy (NASB) as a sponsor of continuing professional education on the National Registry of CPE sponsors and offers CPE credits to those who attend and completed the training.
− Training is provided by a Sunera Director or Principal Level Associate with multiple years and project experience using ACL.
− We are planning on offering a training course in Calgary in October pending sufficient interest.
− Training (classroom instruction) can be provided to organizations directly.
Copyright © 2013 Sunera LLC. 61

Contact Information
For additional information on Sunera’s services, visit our website at www.sunera.com or contact:
Copyright © 2013 Sunera LLC. 62
Parm Lalli
Director
(949) 204-4550
Matt Osbeck
Senior Manager
(714)453-7939


