43
October 2, 2017 1 Data and Analytics Extra Info: GMLC Sensors and Measurement Roadmapping Activity
October 2, 2017 1October 2, 2017 1
Data and Analytics Extra Info:
GMLC Sensors and Measurement
Roadmapping Activity
October 2, 2017 2October 2, 2017 2
Grid Modernization Laboratory Consortium
PROJECT 1.2.5: SENSING & MEASUREMENT STRATEGY
TASK 2: TECHNOLOGY ROADMAP DEVELOPMENT Technology Roadmap Slides: 3/27/2017 Draft
First Draft Submission to DOE for April 1st, 2017 Milestone
SENSOR & MEASUREMENT TECHNOLOGY ROADMAP
October 2, 2017 3October 2, 2017 3
DESCRIPTION OF CONTENT:
These slides represent the first draft Technology Roadmap for the GMLC 1.2.5 Sensing & Measurement Strategy
project that is due to DOE for review and comment on or before April 1st, 2016. This content is being developed by
a broad team spanning the DOE national laboratory system as described in more detail in the project fact sheet
with strong input and engagement from utilities and other industry stakeholders. Additional information and a
list of references can be found in the corresponding Technology Review & Assessment Document developed and
submitted to DOE on 9/30/2016.
CONTEXT FOR DISTRIBUTION:
The content within this draft will be refined and improved moving into future project years through strategic
engagements with technical subject matter experts, utilities, and other stakeholder partners. Stakeholders are
encouraged to send along detailed feedback and suggestions directly to Paul Ohodnicki
([email protected]), Task 2 Roadmapping Activity Lead and Sensing & Measurement Project Co-PI as
well as Tom Rizy ([email protected]) , Sensing & Measurement Project PI.
DOE LABORATORY CONTRIBUTORS:
Paul Ohodnicki (NETL), Tom Rizy (ORNL), Chen Chen (ANL), Olga Lavrova (SNL), Philip Top (LLNL), Emma
Stewart (LLNL), Jeffrey Taft (PNNL), Yarom Polsky (ORNL), Felipe Bernal-Wilches (SNL), Andrew Clifton
(NREL), Matthew Lave (NREL), Zhi Li (ORNL), Guodong Liu (NREL), Peter Fuhr (ORNL), Steven Bossart
(NETL), Michael McElfresh (ANL), Thomas King (ORNL)
SENSOR & MEASUREMENT TECHNOLOGY ROADMAP
October 2, 2017 4October 2, 2017 4
SENSOR & MEASUREMENT TECHNOLOGY ROADMAP
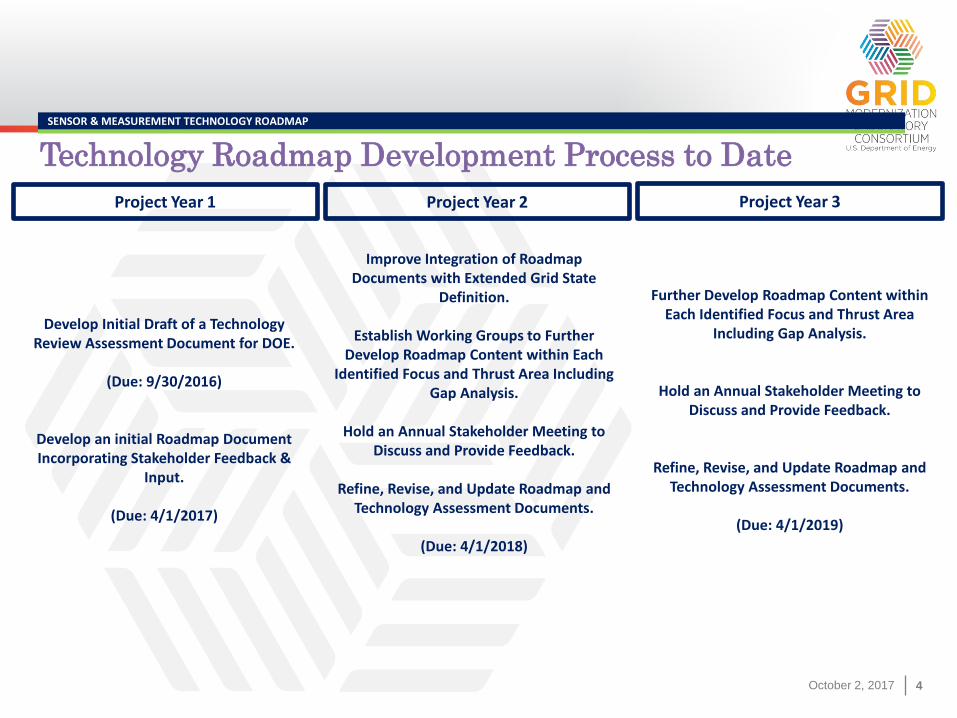
Technology Roadmap Development Process to Date
Project Year 1 Project Year 2 Project Year 3
Develop Initial Draft of a Technology Review Assessment Document for DOE.
(Due: 9/30/2016)
Develop an initial Roadmap Document Incorporating Stakeholder Feedback &
Input.
(Due: 4/1/2017)
Improve Integration of Roadmap Documents with Extended Grid State
Definition.
Establish Working Groups to Further Develop Roadmap Content within Each
Identified Focus and Thrust Area Including Gap Analysis.
Hold an Annual Stakeholder Meeting to Discuss and Provide Feedback.
Refine, Revise, and Update Roadmap and Technology Assessment Documents.
(Due: 4/1/2018)
Further Develop Roadmap Content within Each Identified Focus and Thrust Area
Including Gap Analysis.
Hold an Annual Stakeholder Meeting to Discuss and Provide Feedback.
Refine, Revise, and Update Roadmap and Technology Assessment Documents.
(Due: 4/1/2019)
October 2, 2017 5October 2, 2017 5
SENSOR & MEASUREMENT TECHNOLOGY ROADMAP
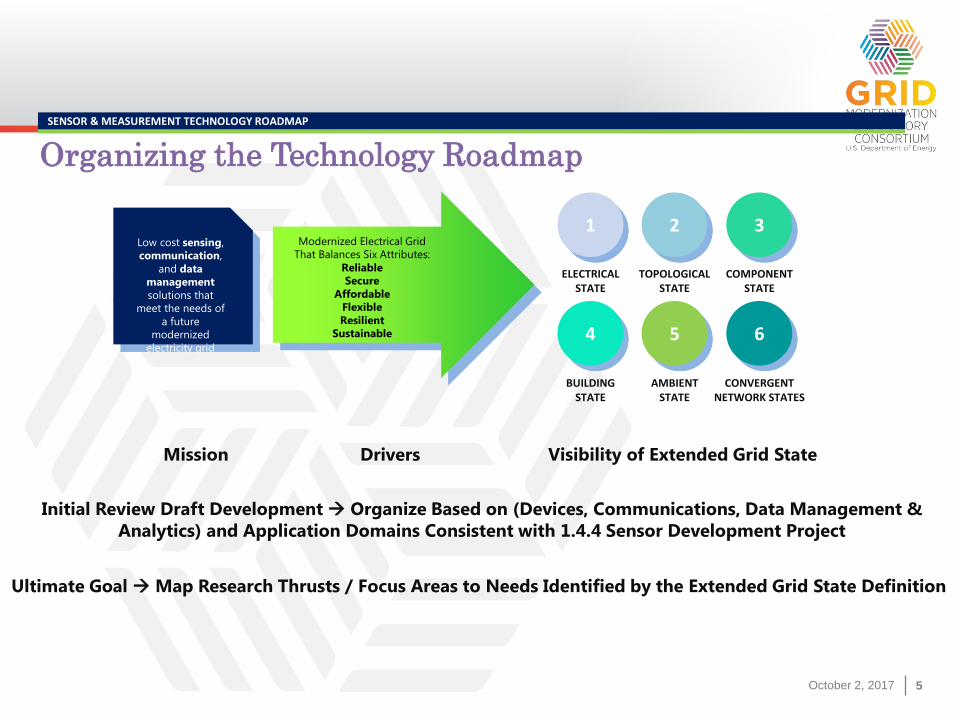
Organizing the Technology Roadmap
Visibility of Extended Grid StateDriversMission
Low cost sensing,
communication,
and data
management
solutions that
meet the needs of
a future
modernized
electricity grid
Modernized Electrical Grid
That Balances Six Attributes:
Reliable
Secure
Affordable
Flexible
Resilient
Sustainable
2 3
4 5 6
1
BUILDING STATE
AMBIENT STATE
CONVERGENT NETWORK STATES
ELECTRICAL STATE
TOPOLOGICALSTATE
COMPONENT STATE
Initial Review Draft Development Organize Based on (Devices, Communications, Data Management &
Analytics) and Application Domains Consistent with 1.4.4 Sensor Development Project
Ultimate Goal Map Research Thrusts / Focus Areas to Needs Identified by the Extended Grid State Definition
October 2, 2017 6October 2, 2017 6
SENSOR & MEASUREMENT TECHNOLOGY ROADMAP
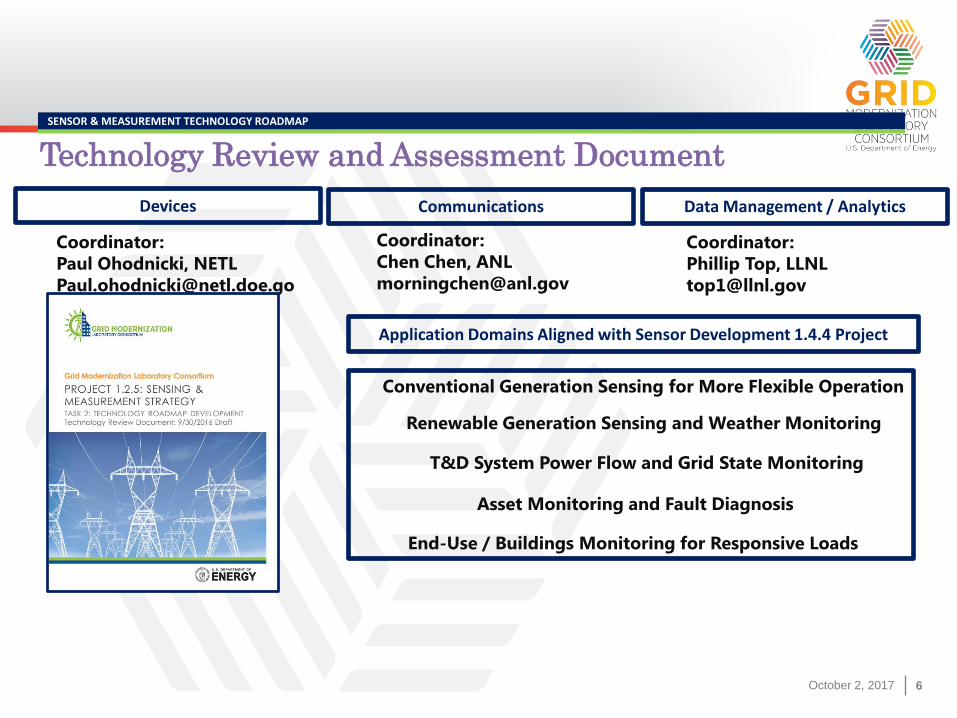
Technology Review and Assessment Document
Conventional Generation Sensing for More Flexible Operation
Coordinator:
Paul Ohodnicki, NETL
v
Devices Communications Data Management / Analytics
Coordinator:
Chen Chen, ANL
Coordinator:
Phillip Top, LLNL
Renewable Generation Sensing and Weather Monitoring
T&D System Power Flow and Grid State Monitoring
Asset Monitoring and Fault Diagnosis
End-Use / Buildings Monitoring for Responsive Loads
Application Domains Aligned with Sensor Development 1.4.4 Project
October 2, 2017 7October 2, 2017 7
SENSOR & MEASUREMENT TECHNOLOGY ROADMAP
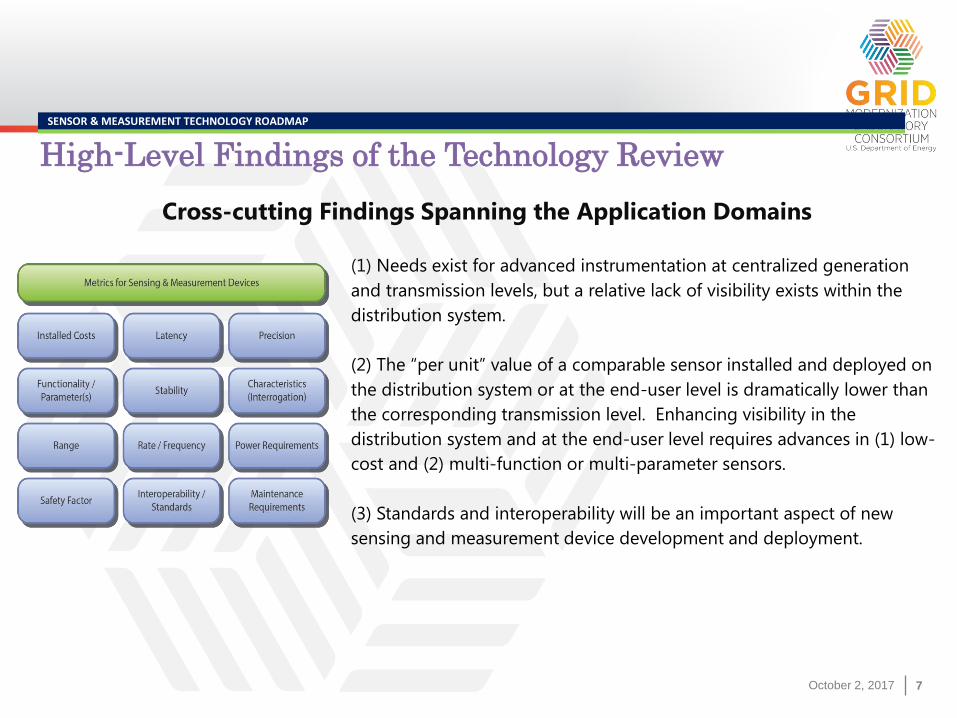
High-Level Findings of the Technology Review
Cross-cutting Findings Spanning the Application Domains
(1) Needs exist for advanced instrumentation at centralized generation
and transmission levels, but a relative lack of visibility exists within the
distribution system.
(2) The “per unit” value of a comparable sensor installed and deployed on
the distribution system or at the end-user level is dramatically lower than
the corresponding transmission level. Enhancing visibility in the
distribution system and at the end-user level requires advances in (1) low-
cost and (2) multi-function or multi-parameter sensors.
(3) Standards and interoperability will be an important aspect of new
sensing and measurement device development and deployment.
October 2, 2017 8October 2, 2017 8
SENSOR & MEASUREMENT TECHNOLOGY ROADMAP
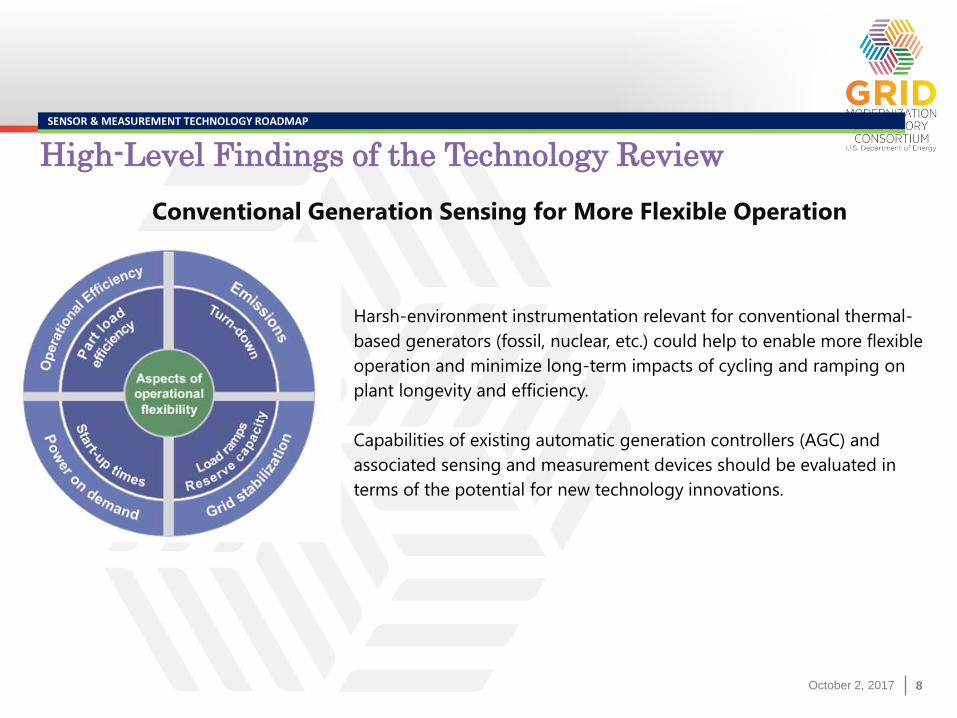
High-Level Findings of the Technology Review
Harsh-environment instrumentation relevant for conventional thermal-
based generators (fossil, nuclear, etc.) could help to enable more flexible
operation and minimize long-term impacts of cycling and ramping on
plant longevity and efficiency.
Capabilities of existing automatic generation controllers (AGC) and
associated sensing and measurement devices should be evaluated in
terms of the potential for new technology innovations.
Conventional Generation Sensing for More Flexible Operation
October 2, 2017 9October 2, 2017 9
SENSOR & MEASUREMENT TECHNOLOGY ROADMAP
High-Level Findings of the Technology Review
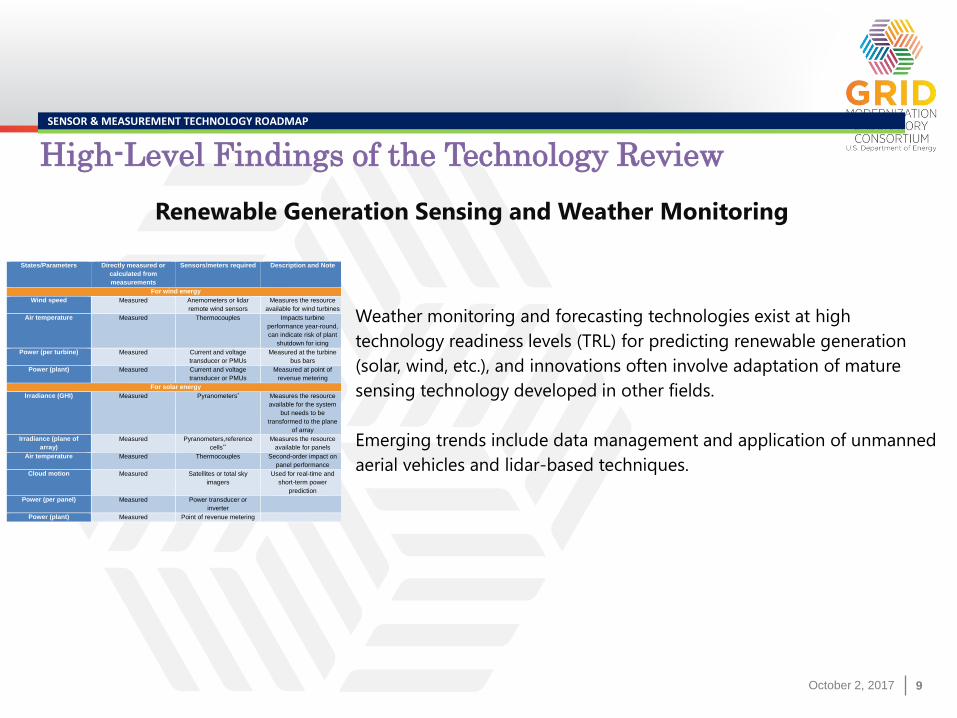
Weather monitoring and forecasting technologies exist at high
technology readiness levels (TRL) for predicting renewable generation
(solar, wind, etc.), and innovations often involve adaptation of mature
sensing technology developed in other fields.
Emerging trends include data management and application of unmanned
aerial vehicles and lidar-based techniques.
Renewable Generation Sensing and Weather Monitoring
States/Parameters Directly measured or
calculated from
measurements
Sensors/meters required Description and Note
For wind energy
Wind speed Measured Anemometers or lidar
remote wind sensors
Measures the resource
available for wind turbines
Air temperature Measured Thermocouples Impacts turbine
performance year-round,
can indicate risk of plant
shutdown for icing
Power (per turbine) Measured Current and voltage
transducer or PMUs
Measured at the turbine
bus bars
Power (plant) Measured Current and voltage
transducer or PMUs
Measured at point of
revenue metering
For solar energy
Irradiance (GHI) Measured Pyranometers* Measures the resource
available for the system
but needs to be
transformed to the plane
of array
Irradiance (plane of
array)
Measured Pyranometers,reference
cells**
Measures the resource
available for panels
Air temperature Measured Thermocouples Second-order impact on
panel performance
Cloud motion Measured Satellites or total sky
imagers
Used for real-time and
short-term power
prediction
Power (per panel) Measured Power transducer or
inverter
Power (plant) Measured Point of revenue metering
October 2, 2017 10October 2, 2017 10
SENSOR & MEASUREMENT TECHNOLOGY ROADMAP
High-Level Findings of the Technology Review
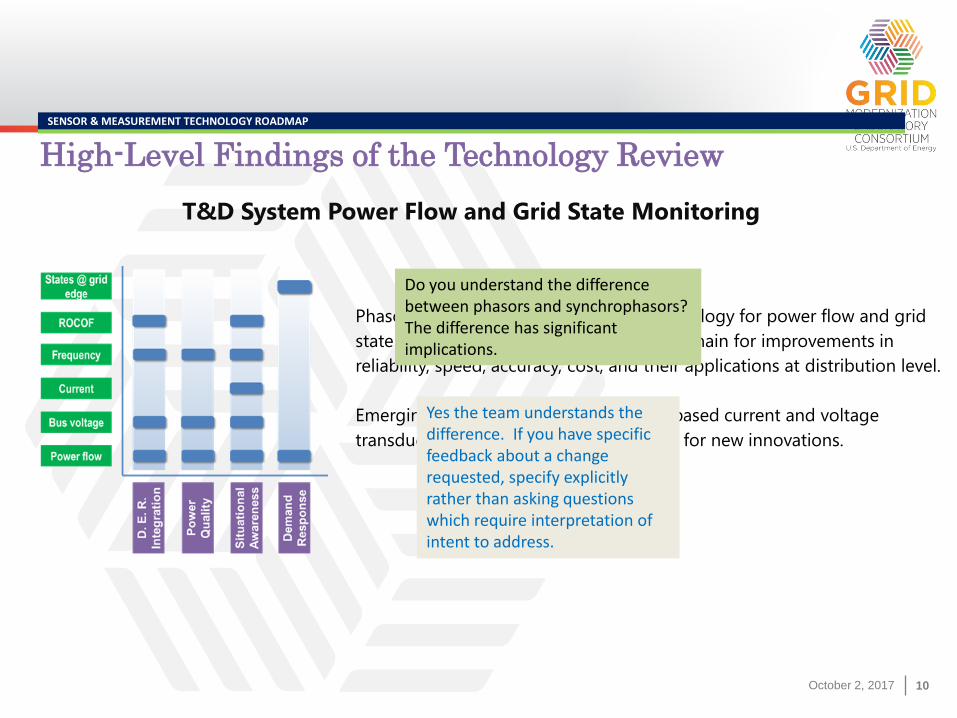
Phasor measurement units are a key technology for power flow and grid
state monitoring, and opportunities still remain for improvements in
reliability, speed, accuracy, cost, and their applications at distribution level.
Emerging electromagnetic phenomena–based current and voltage
transducers show significant opportunity for new innovations.
T&D System Power Flow and Grid State Monitoring
Do you understand the difference between phasors and synchrophasors? The difference has significant implications.
Yes the team understands the difference. If you have specific feedback about a change requested, specify explicitly rather than asking questions which require interpretation of intent to address.
October 2, 2017 11October 2, 2017 11
SENSOR & MEASUREMENT TECHNOLOGY ROADMAP
High-Level Findings of the Technology Review
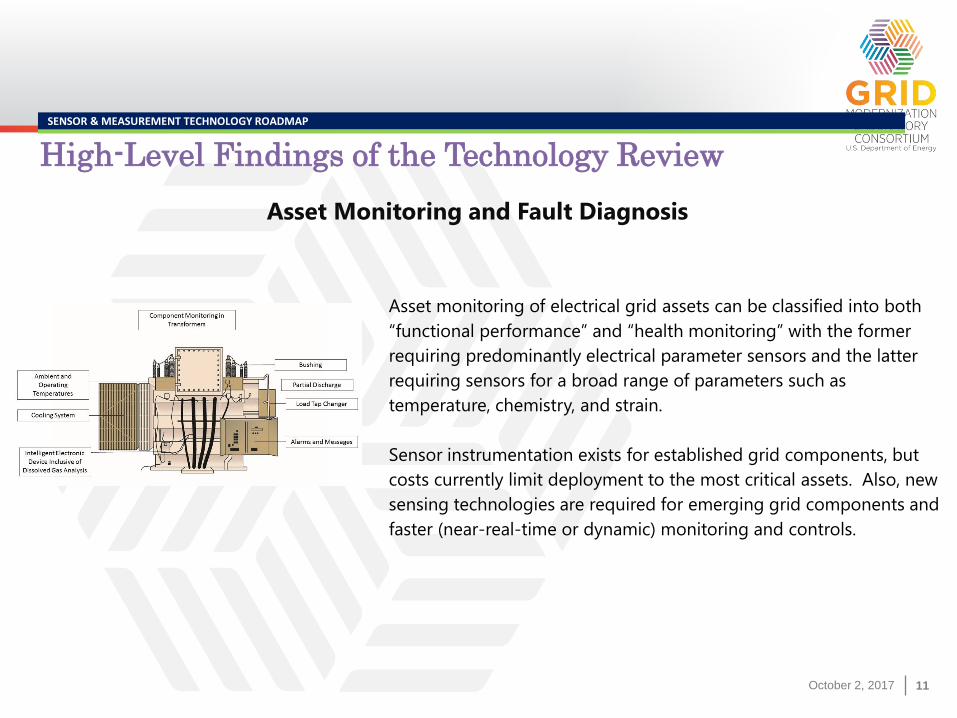
Asset monitoring of electrical grid assets can be classified into both
“functional performance” and “health monitoring” with the former
requiring predominantly electrical parameter sensors and the latter
requiring sensors for a broad range of parameters such as
temperature, chemistry, and strain.
Sensor instrumentation exists for established grid components, but
costs currently limit deployment to the most critical assets. Also, new
sensing technologies are required for emerging grid components and
faster (near-real-time or dynamic) monitoring and controls.
Asset Monitoring and Fault Diagnosis
October 2, 2017 12October 2, 2017 12
SENSOR & MEASUREMENT TECHNOLOGY ROADMAP
High-Level Findings of the Technology Review
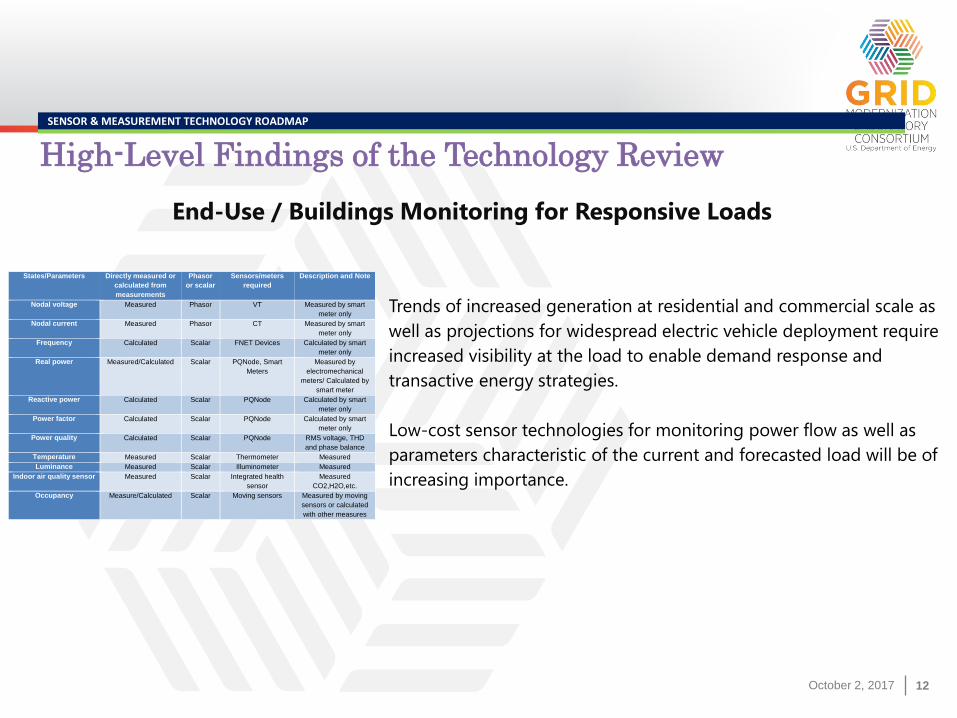
Trends of increased generation at residential and commercial scale as
well as projections for widespread electric vehicle deployment require
increased visibility at the load to enable demand response and
transactive energy strategies.
Low-cost sensor technologies for monitoring power flow as well as
parameters characteristic of the current and forecasted load will be of
increasing importance.
End-Use / Buildings Monitoring for Responsive Loads
States/Parameters Directly measured or
calculated from
measurements
Phasor
or scalar
Sensors/meters
required
Description and Note
Nodal voltage Measured Phasor VT Measured by smart
meter only
Nodal current Measured Phasor CT Measured by smart
meter only
Frequency Calculated Scalar FNET Devices Calculated by smart
meter only
Real power Measured/Calculated Scalar PQNode, Smart
Meters
Measured by
electromechanical
meters/ Calculated by
smart meter
Reactive power Calculated Scalar PQNode Calculated by smart
meter only
Power factor Calculated Scalar PQNode Calculated by smart
meter only
Power quality Calculated Scalar PQNode RMS voltage, THD
and phase balance
Temperature Measured Scalar Thermometer Measured
Luminance Measured Scalar Illuminometer Measured
Indoor air quality sensor Measured Scalar Integrated health
sensor
Measured
CO2,H2O,etc.
Occupancy Measure/Calculated Scalar Moving sensors Measured by moving
sensors or calculated
with other measures
October 2, 2017 13October 2, 2017 13
SENSOR & MEASUREMENT TECHNOLOGY ROADMAP
High-Level Findings of the Technology Review
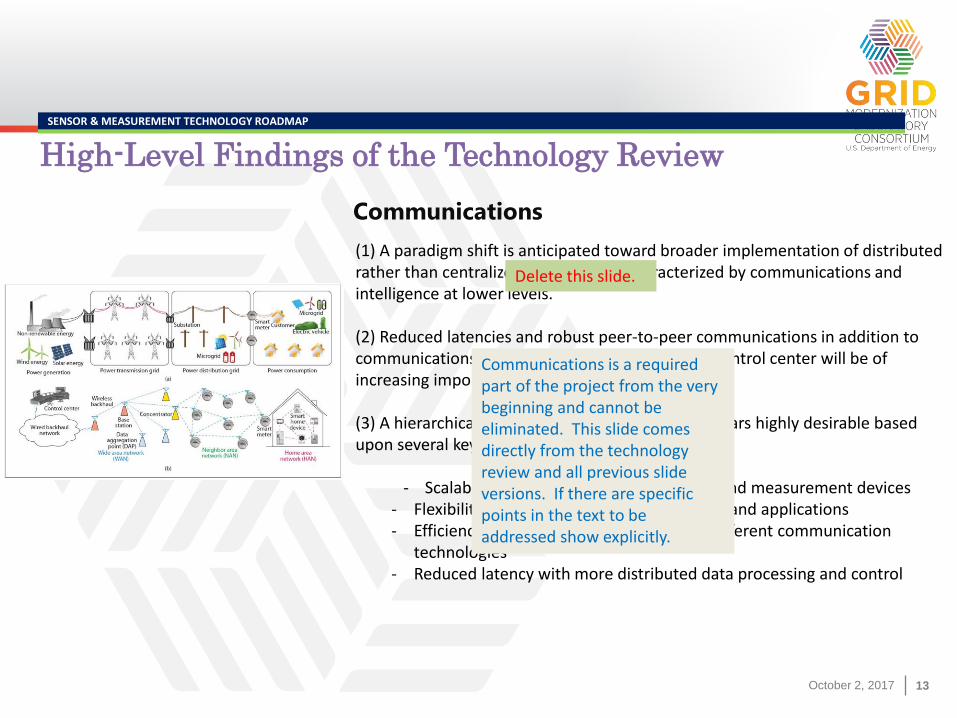
Communications
(1) A paradigm shift is anticipated toward broader implementation of distributed rather than centralized architectures characterized by communications and intelligence at lower levels.
(2) Reduced latencies and robust peer-to-peer communications in addition to communications between various nodes and the control center will be of increasing importance.
(3) A hierarchical communication architecture appears highly desirable based upon several key attributes:
- Scalability for a large number of sensing and measurement devices- Flexibility to incorporate new types of data and applications- Efficiency to leverage unique features of different communication
technologies- Reduced latency with more distributed data processing and control
Delete this slide.
Communications is a required part of the project from the very beginning and cannot be eliminated. This slide comes directly from the technology review and all previous slide versions. If there are specific points in the text to be addressed show explicitly.
October 2, 2017 14October 2, 2017 14
SENSOR & MEASUREMENT TECHNOLOGY ROADMAP
High-Level Findings of the Technology Review
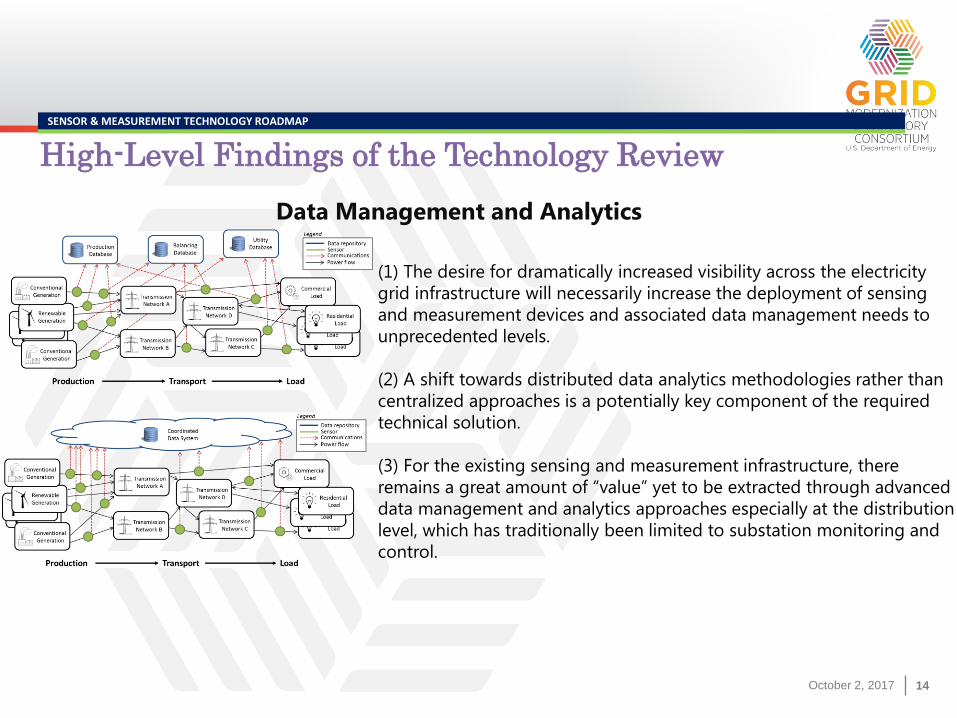
Data Management and Analytics
(1) The desire for dramatically increased visibility across the electricity
grid infrastructure will necessarily increase the deployment of sensing
and measurement devices and associated data management needs to
unprecedented levels.
(2) A shift towards distributed data analytics methodologies rather than
centralized approaches is a potentially key component of the required
technical solution.
(3) For the existing sensing and measurement infrastructure, there
remains a great amount of “value” yet to be extracted through advanced
data management and analytics approaches especially at the distribution
level, which has traditionally been limited to substation monitoring and
control.
October 2, 2017 15
Extra Info – synchrophasors & distribution
sychrophasors
October 2, 2017 16October 2, 2017 16
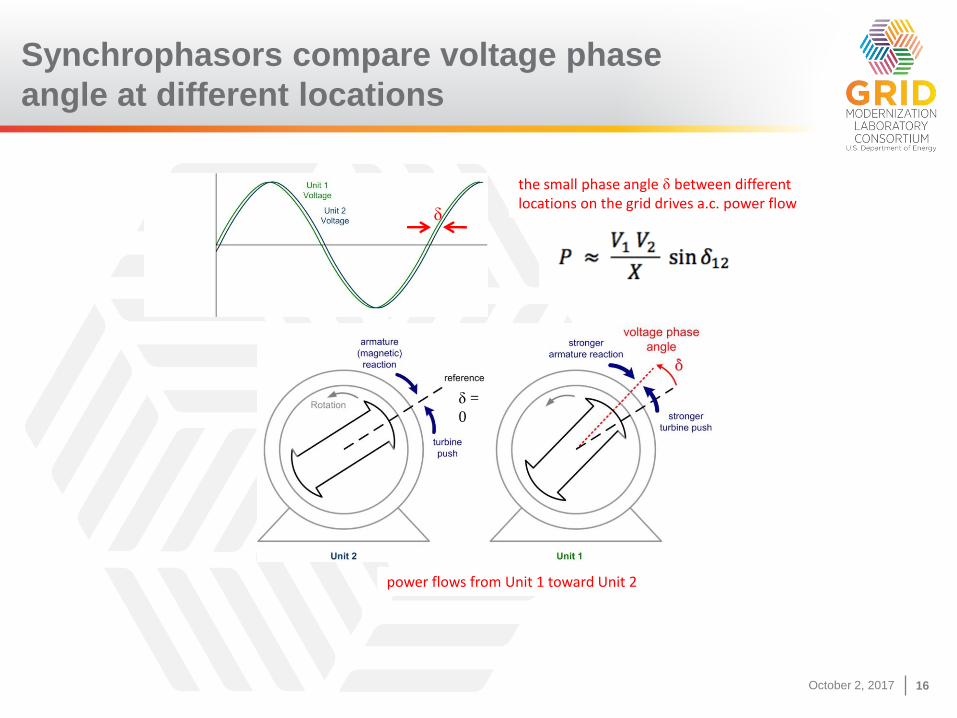
the small phase angle δ between different locations on the grid drives a.c. power flow
δ =
0
δ
power flows from Unit 1 toward Unit 2
Synchrophasors compare voltage phase
angle at different locations
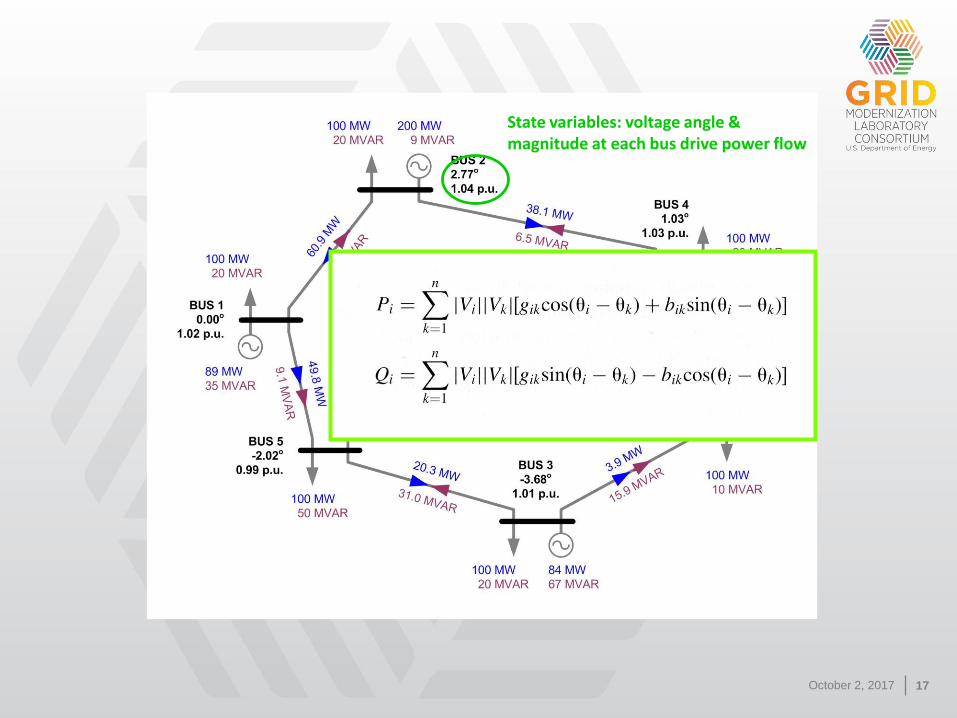
October 2, 2017 17
State variables: voltage angle & magnitude at each bus drive power flow
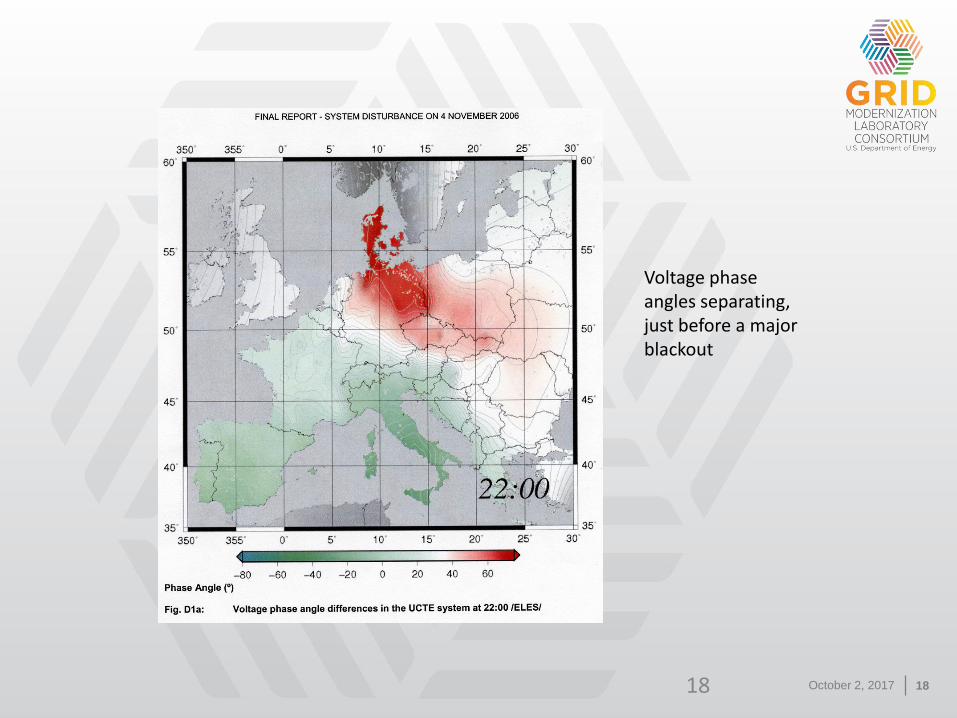
October 2, 2017 1818
Voltage phase angles separating, just before a major blackout
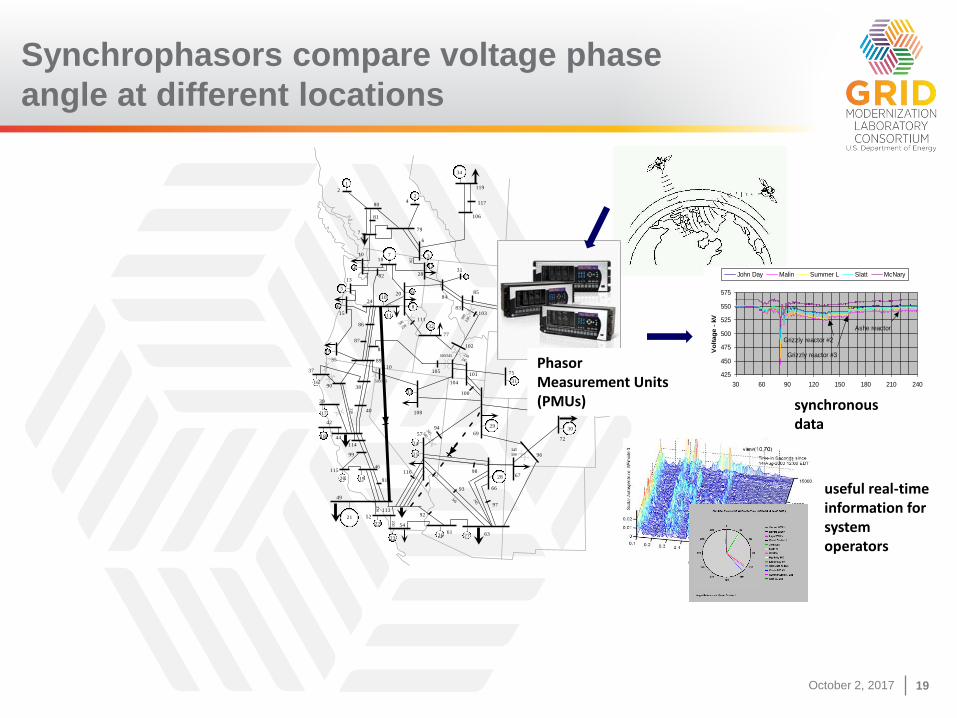
October 2, 2017 19October 2, 2017 19
Synchrophasors compare voltage phase
angle at different locations
2
4
6
7
1
2
13
5
18
24
13
31
33
14
35
15
1638
1740
18
42
44
46
1920
49
22
52
23
54
24
25
57
21
27 63
67
29
6930
72
75
32
77
34
79
80
3
82
8420 9
8
28
12
10
4
7
10
15
6
81
83
85
86
87
88
89
91
6126
92
93
94345500
345
500 96
500/345
97
98
99
31
100
101
230345
500
230
102
10311
119
106
105
104
33
108
500/345
110
111
113
500
230
114
115 116
345
230
230
117
230
90
230
28
66
37
39
345
425
450
475
500
525
550
575
30 60 90 120 150 180 210 240
Time - seconds
Vo
ltag
e -
kV
John Day Malin Summer L Slatt McNary
Grizzly reactor #2
Grizzly reactor #3
Ashe reactor
Phasor Measurement Units (PMUs) synchronous
data
useful real-time information for system operators
October 2, 2017 20October 2, 2017 20
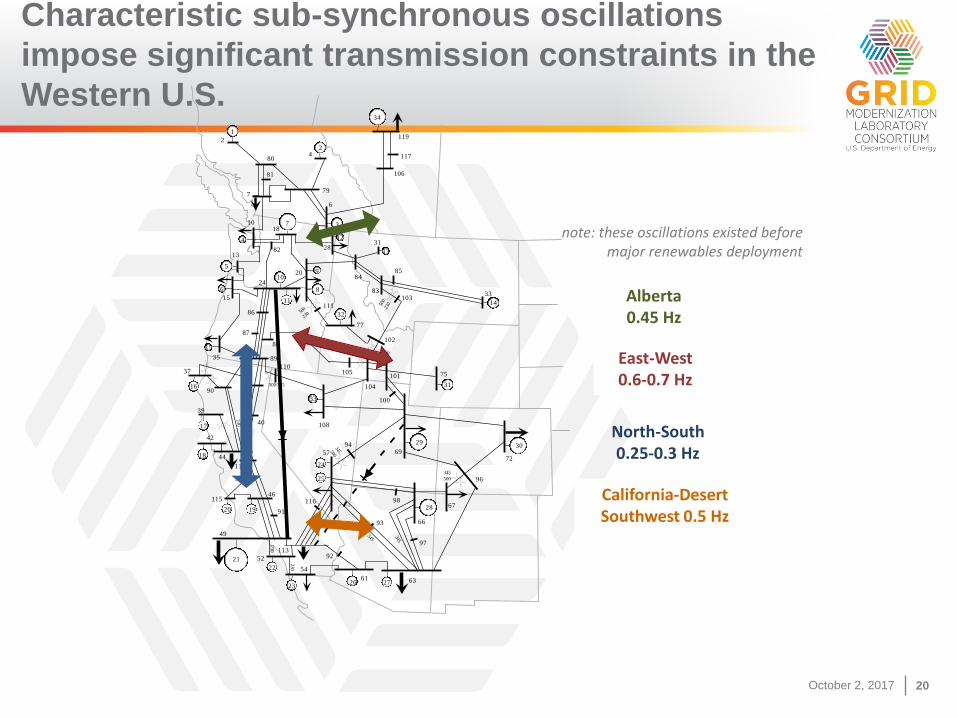
North-South 0.25-0.3 Hz
East-West 0.6-0.7 Hz
California-Desert Southwest 0.5 Hz
Alberta 0.45 Hz
2
4
6
7
1
2
13
5
18
24
13
31
33
14
35
15
1638
1740
18
42
44
46
1920
49
22
52
23
54
24
25
57
21
27 63
67
29
6930
72
75
32
77
34
79
80
3
82
8420 9
8
28
12
10
4
7
10
15
6
81
83
85
86
87
88
89
91
6126
92
93
94345500
345
500 96
500/345
97
98
99
31
100
101
230345
500
230
102
10311
119
106
105
104
33
108
500/345
110
111
113
500
230
114
115 116
345
230
230
117
230
90
230
28
66
37
39
345
Characteristic sub-synchronous oscillations
impose significant transmission constraints in the
Western U.S.
note: these oscillations existed before major renewables deployment
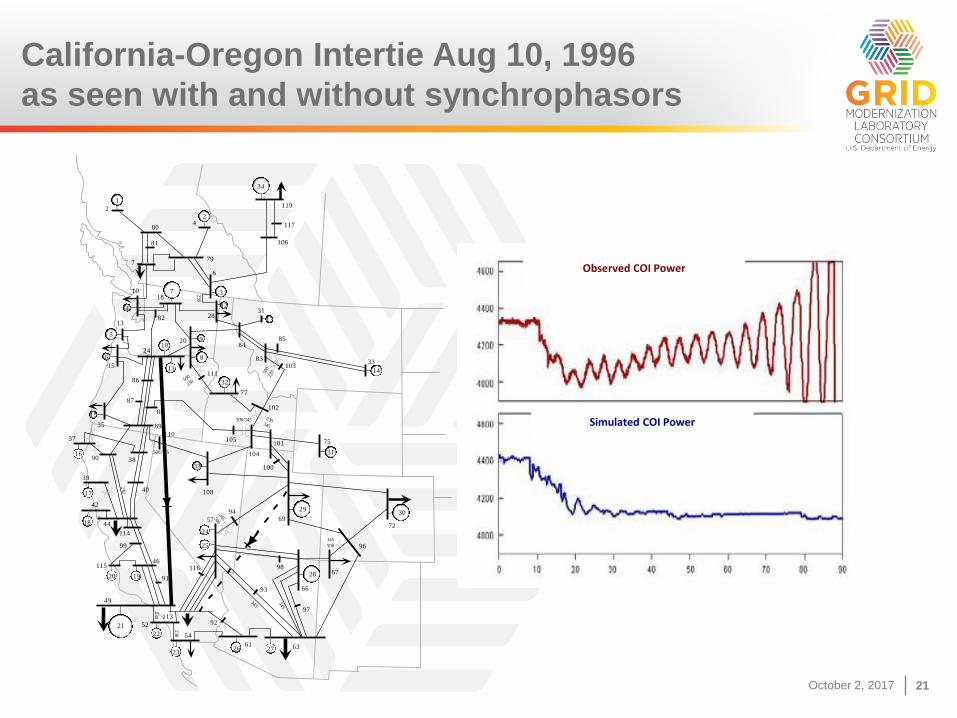
October 2, 2017 21October 2, 2017 21
Observed COI Power
Simulated COI Power
2
4
6
7
1
2
13
5
18
24
13
31
33
14
35
15
1638
1740
18
42
44
46
1920
49
22
52
23
54
24
25
57
21
27 63
67
29
6930
72
75
32
77
34
79
80
3
82
8420 9
8
28
12
10
4
7
10
15
6
81
83
85
86
87
88
89
91
6126
92
93
94345500
345
500 96
500/345
97
98
99
31
100
101
230345
500
230
102
10311
119
106
105
104
33
108
500/345
110
111
113
500
230
114
115 116
345
230
230
117
230
90
230
28
66
37
39
345
California-Oregon Intertie Aug 10, 1996
as seen with and without synchrophasors
October 2, 2017 22October 2, 2017 22
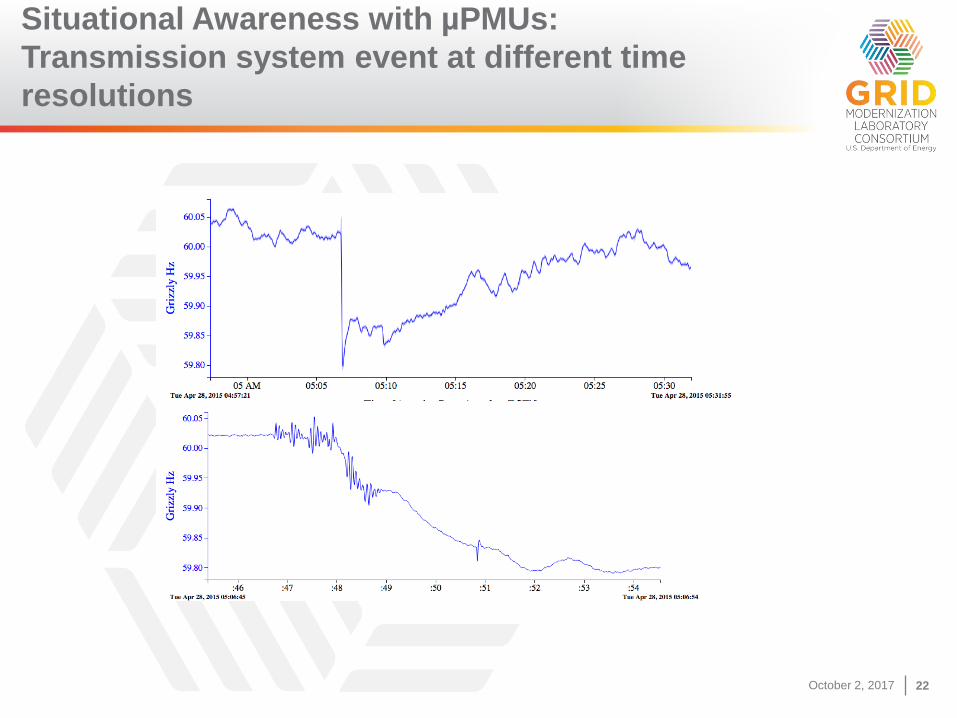
Situational Awareness with µPMUs:
Transmission system event at different time
resolutions
October 2, 2017 23October 2, 2017 23
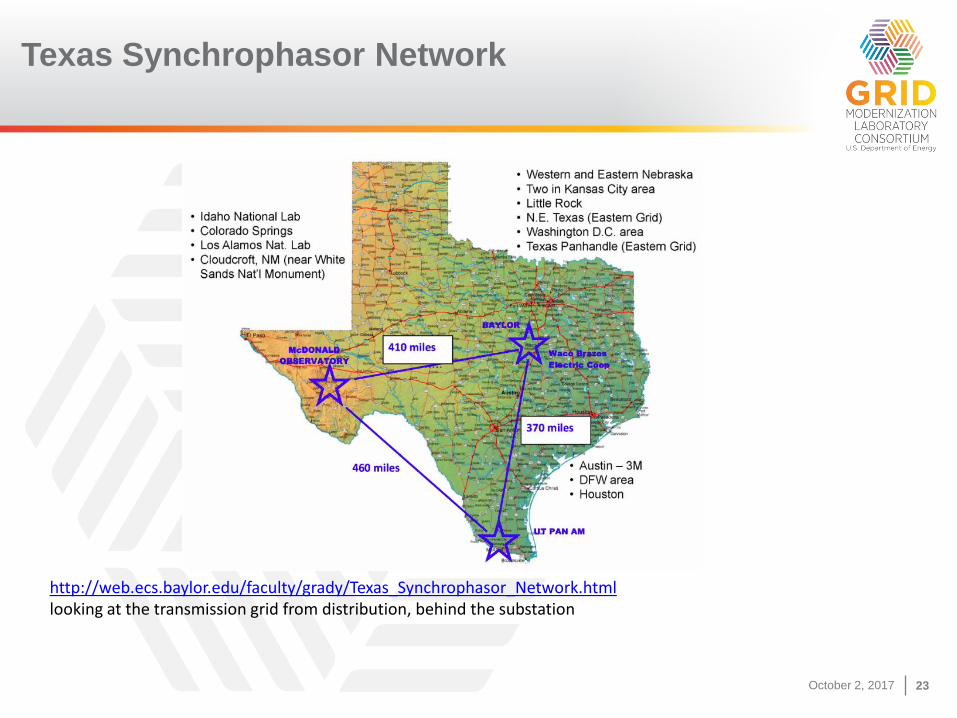
http://web.ecs.baylor.edu/faculty/grady/Texas_Synchrophasor_Network.htmllooking at the transmission grid from distribution, behind the substation
Texas Synchrophasor Network
October 2, 2017 24October 2, 2017 24
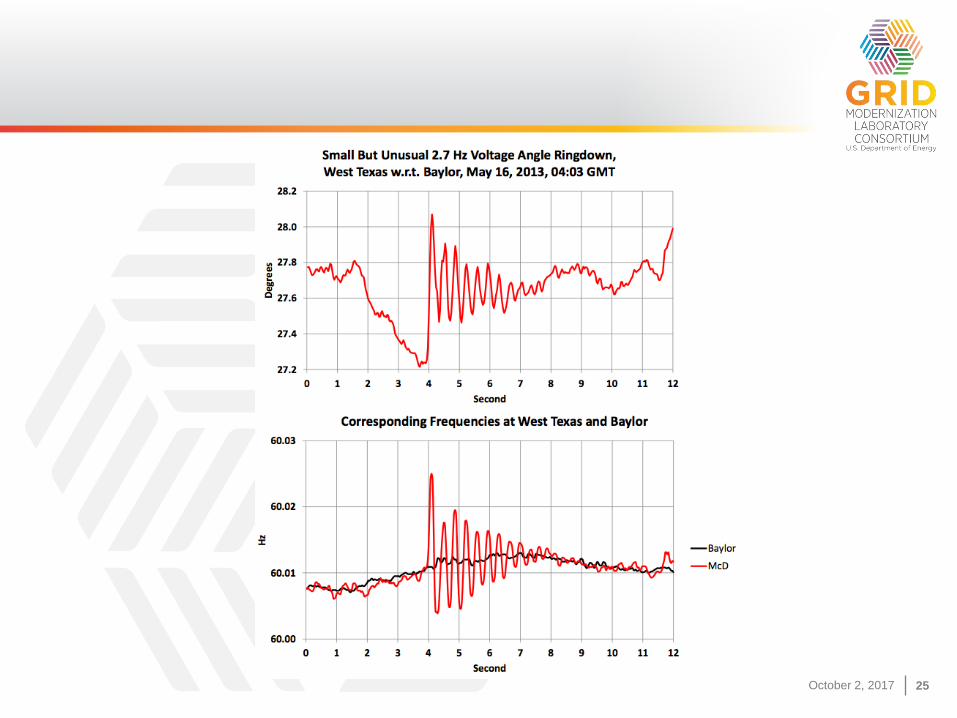
October 2, 2017 25October 2, 2017 25
October 2, 2017 26October 2, 2017 26
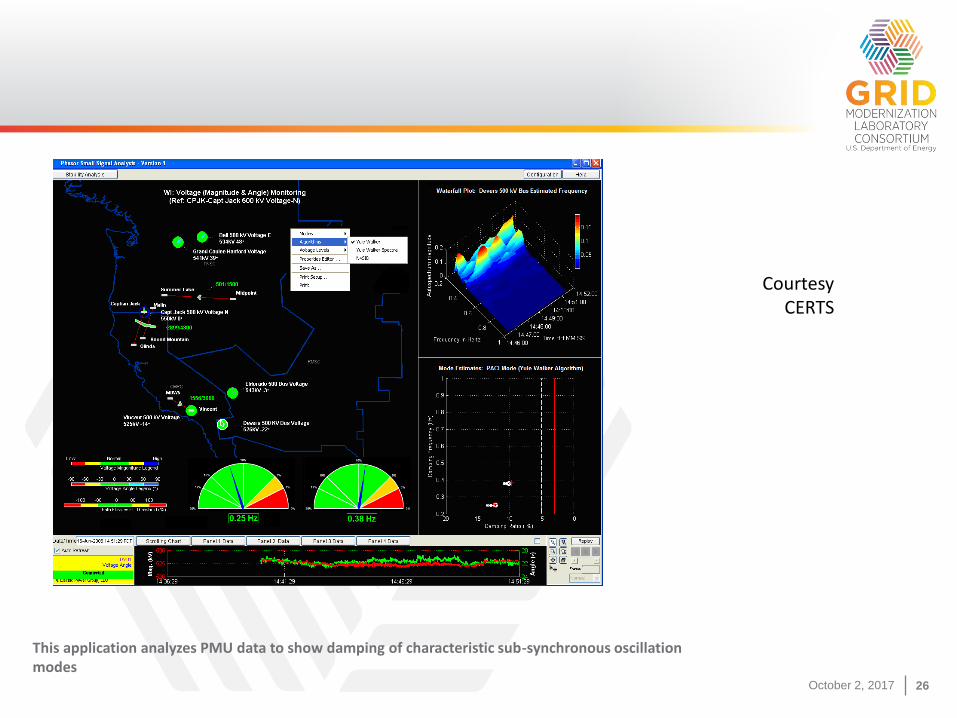
This application analyzes PMU data to show damping of characteristic sub-synchronous oscillation modes
CourtesyCERTS
October 2, 2017 27October 2, 2017 27
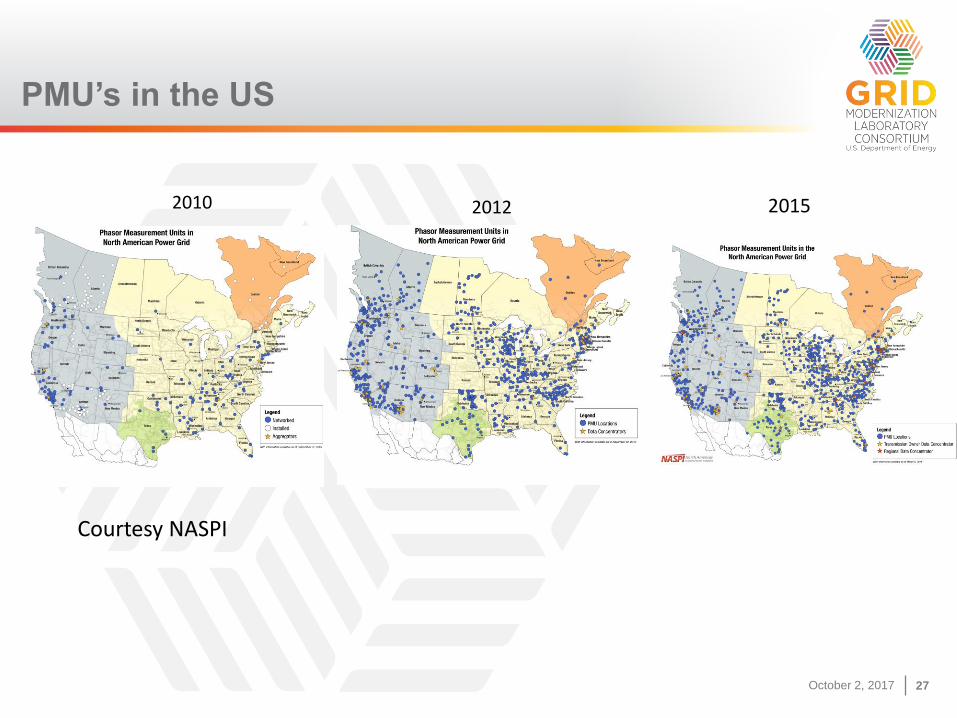
2010
PMU’s in the US
Courtesy NASPI
2012 2015
October 2, 2017 28
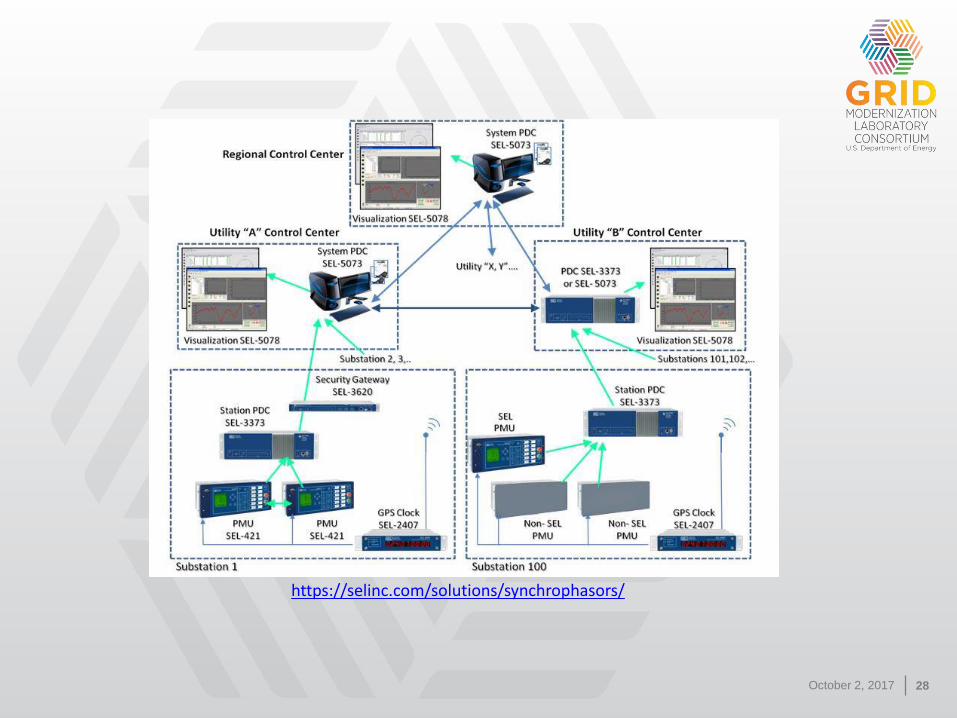
https://selinc.com/solutions/synchrophasors/
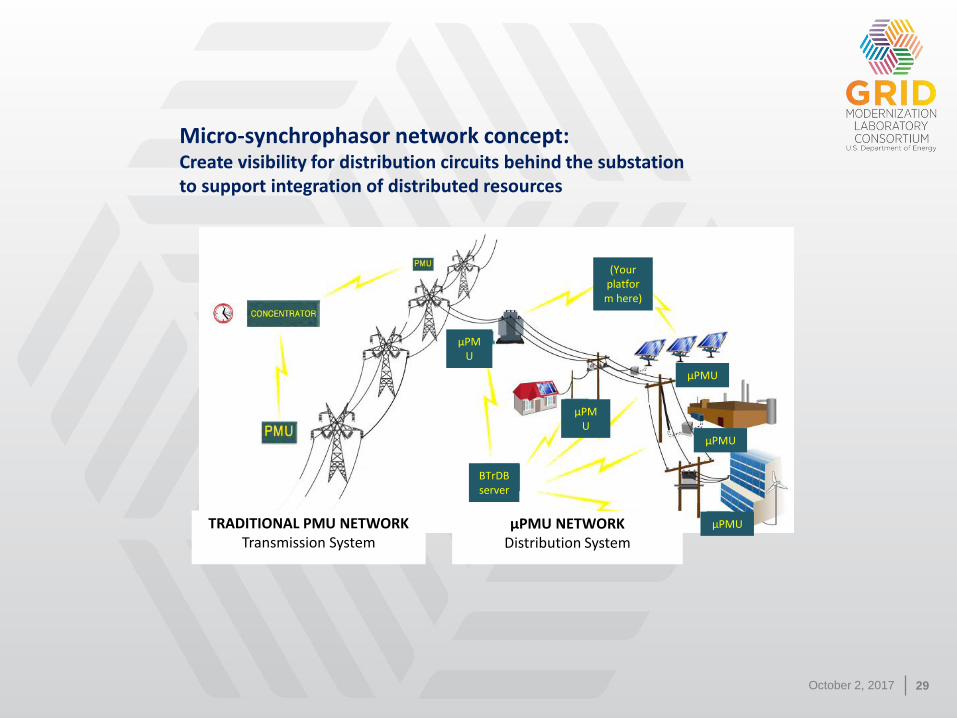
October 2, 2017 29
TRADITIONAL PMU NETWORKTransmission System
μPMU NETWORKDistribution System
BTrDBserver
µPMU
µPMU
µPMU
µPMU
µPMU
(Your platfor
m here)
Micro-synchrophasor network concept:Create visibility for distribution circuits behind the substation to support integration of distributed resources
October 2, 2017 30October 2, 2017 30
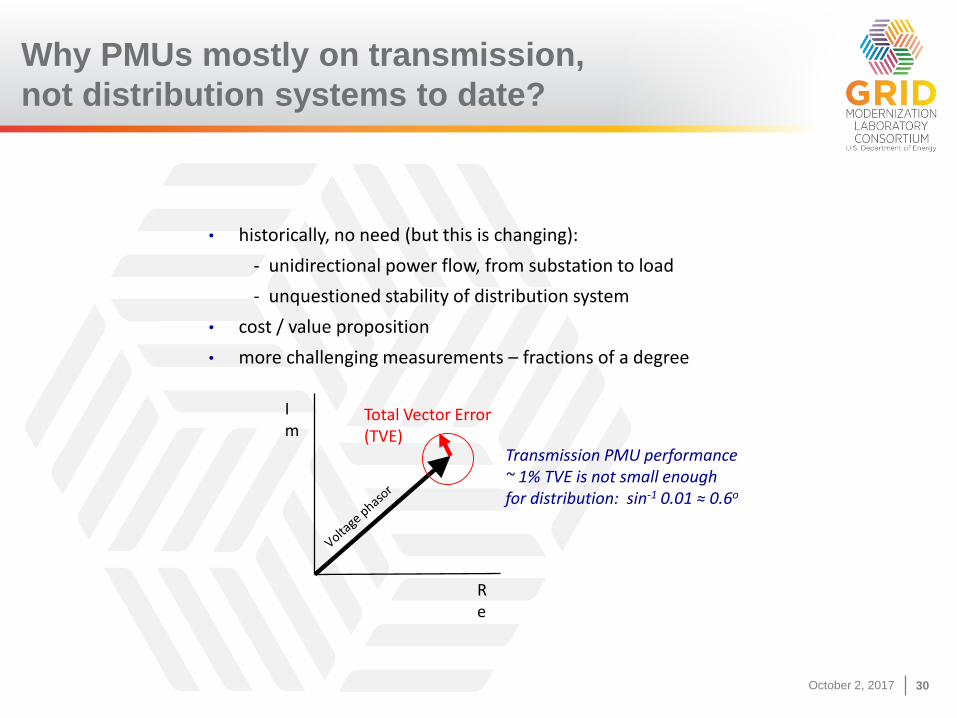
Why PMUs mostly on transmission,
not distribution systems to date?
• historically, no need (but this is changing):
- unidirectional power flow, from substation to load
- unquestioned stability of distribution system
• cost / value proposition
• more challenging measurements – fractions of a degree
Re
Im
Total Vector Error (TVE)
Transmission PMU performance ~ 1% TVE is not small enough for distribution: sin-1 0.01 ≈ 0.6o
October 2, 2017 31
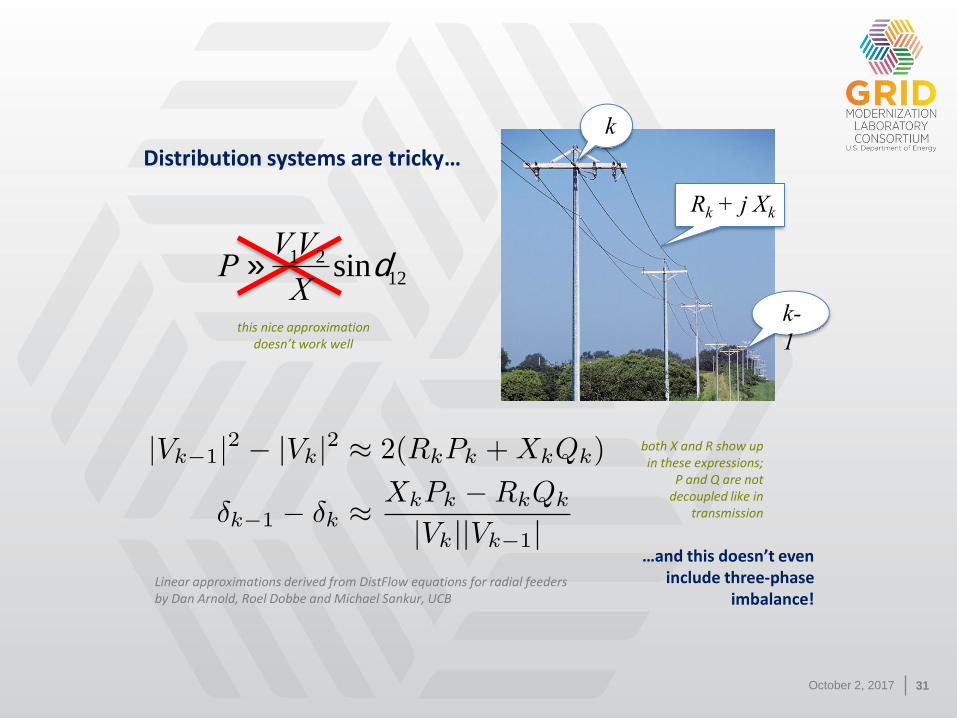
Rk + j Xk
k
k-
1
P »V1V2
Xsind12
both X and R show up in these expressions;
P and Q are not decoupled like in
transmission
Linear approximations derived from DistFlow equations for radial feedersby Dan Arnold, Roel Dobbe and Michael Sankur, UCB
Distribution systems are tricky…
…and this doesn’t even include three-phase
imbalance!
this nice approximation doesn’t work well
October 2, 2017 32October 2, 2017 32
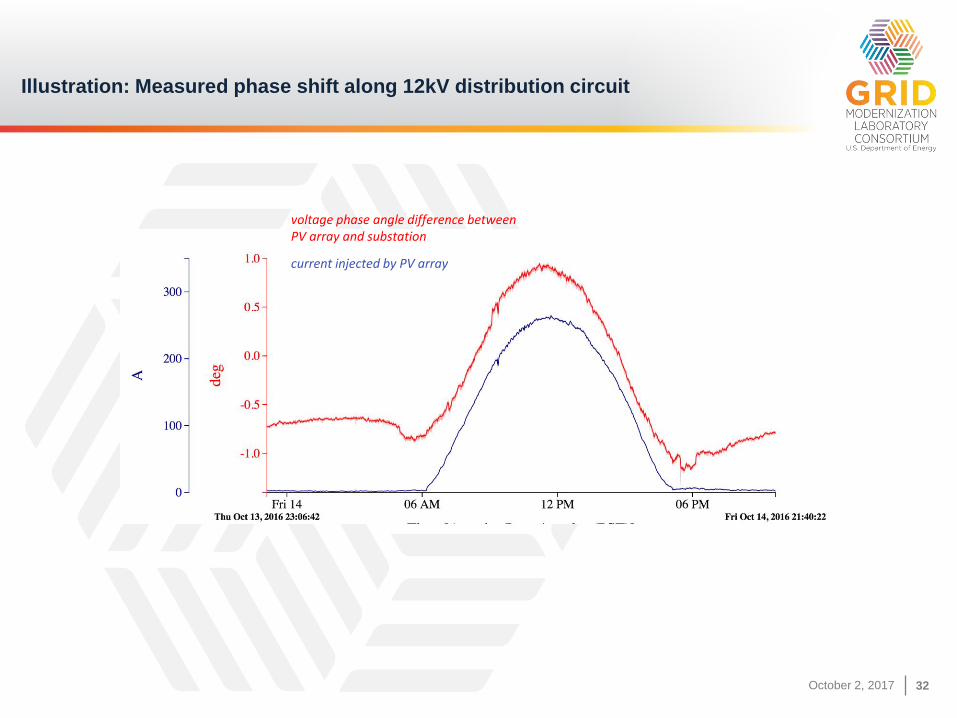
Illustration: Measured phase shift along 12kV distribution circuit
voltage phase angle difference between PV array and substation
current injected by PV array
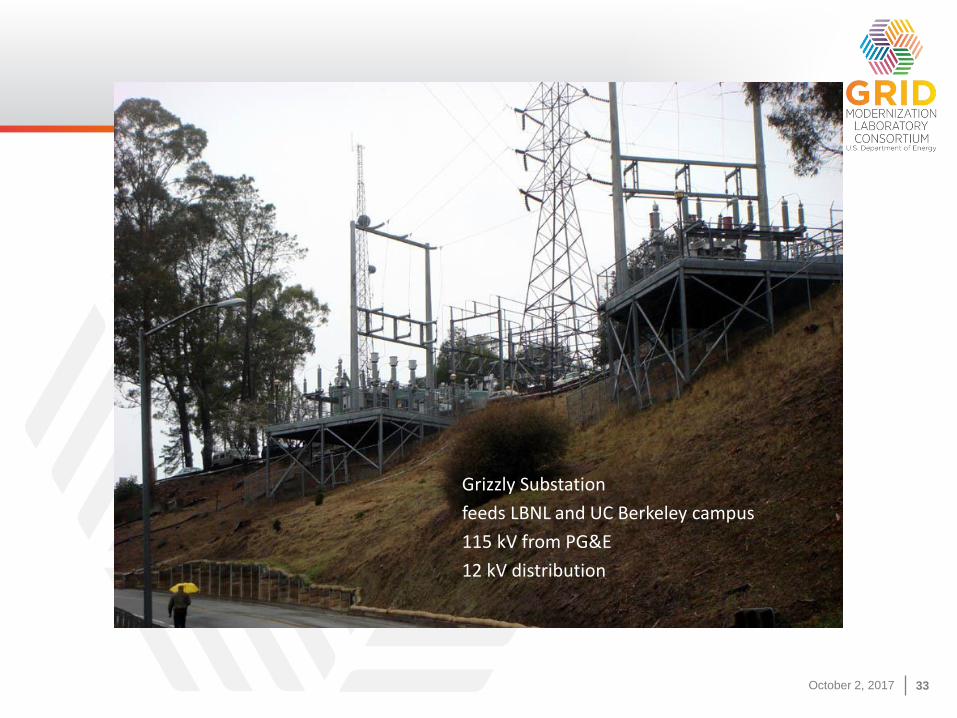
October 2, 2017 33October 2, 2017 33
Grizzly Substation
feeds LBNL and UC Berkeley campus
115 kV from PG&E
12 kV distribution
October 2, 2017 34
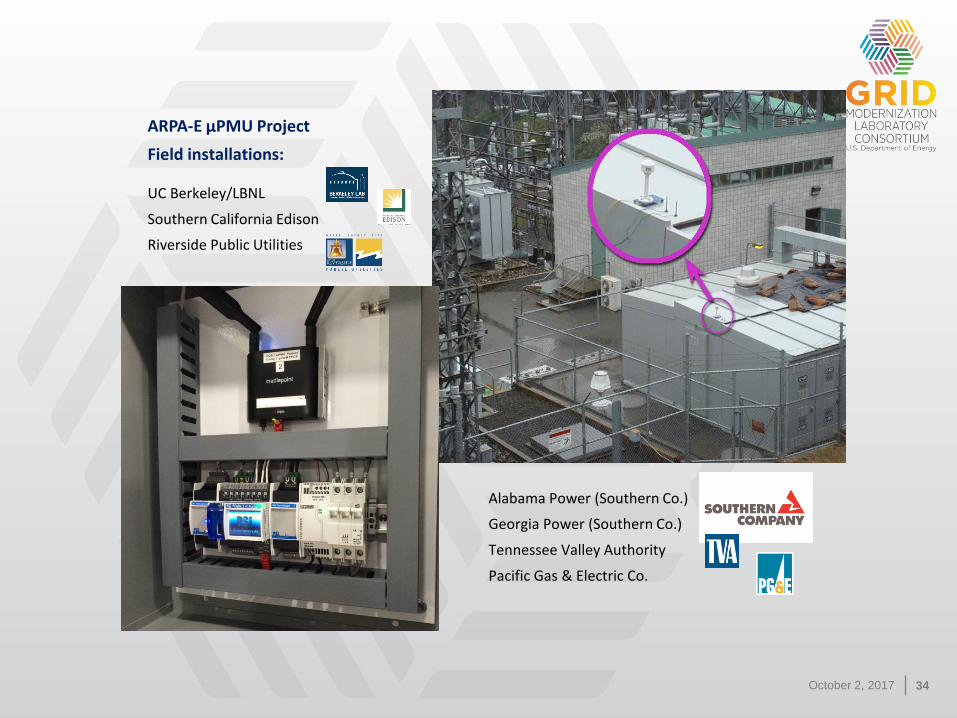
ARPA-E µPMU Project
Field installations:
UC Berkeley/LBNL
Southern California Edison
Riverside Public Utilities
Alabama Power (Southern Co.)
Georgia Power (Southern Co.)
Tennessee Valley Authority
Pacific Gas & Electric Co.
October 2, 2017 35
Other
ServicesOther
ServicesOther
Services
LocalBuffer
LocalBuffer
LocalBuffer
LocalBuffer
...
Chunk Loader
Field Datacenter / Cloud Clients
BTrDBCluster
Distillate Framework Cluster
PlottingService
HTTP
MATLAB
IPython
etc ...
JSON / CSV
Analytics with 3rd party tools
Interactive visualization
Wired
Event Detection Service
Other Services
webapp
PMU
PMU
PMU
PMU
Internet
LTE
modem
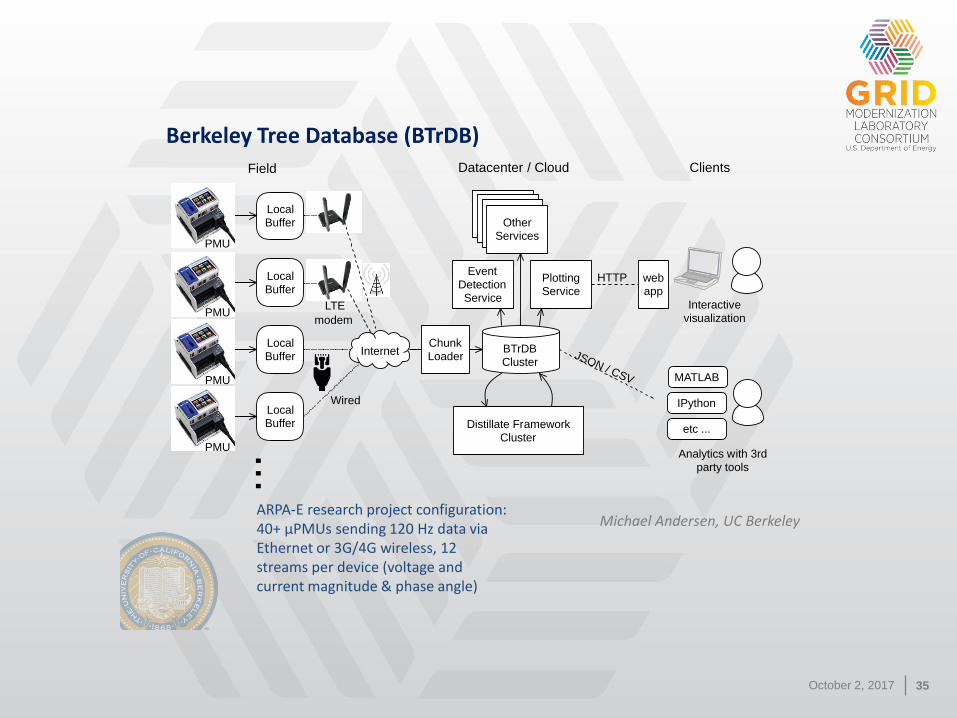
Berkeley Tree Database (BTrDB)
ARPA-E research project configuration:40+ µPMUs sending 120 Hz data via Ethernet or 3G/4G wireless, 12 streams per device (voltage and current magnitude & phase angle)
Michael Andersen, UC Berkeley
October 2, 2017 36October 2, 2017 36
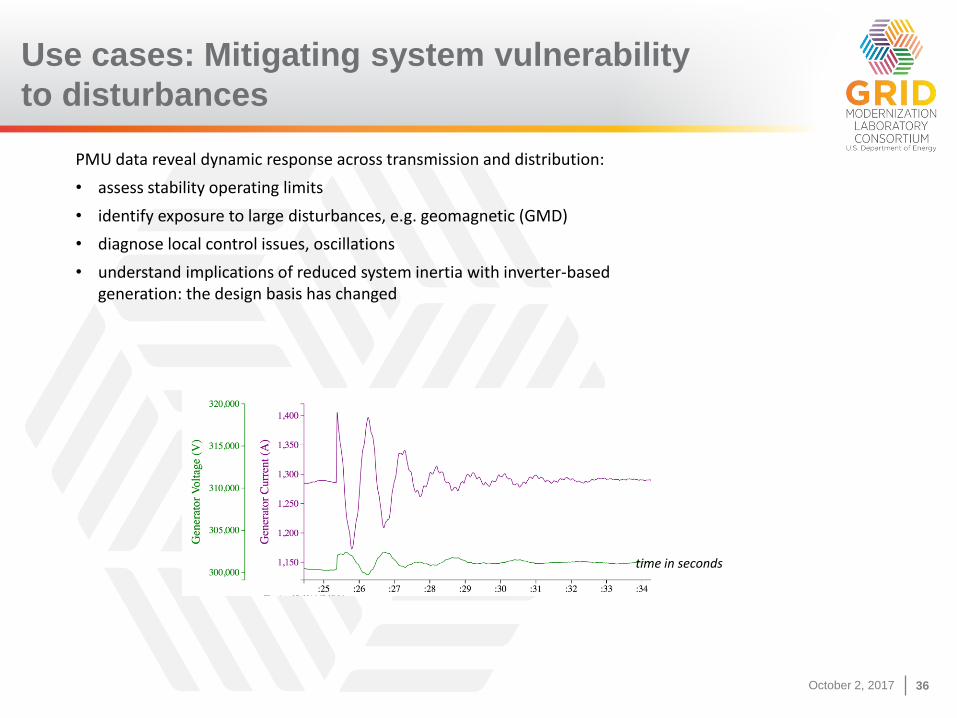
Use cases: Mitigating system vulnerability
to disturbances
PMU data reveal dynamic response across transmission and distribution:
• assess stability operating limits
• identify exposure to large disturbances, e.g. geomagnetic (GMD)
• diagnose local control issues, oscillations
• understand implications of reduced system inertia with inverter-based generation: the design basis has changed
time in seconds
October 2, 2017 37October 2, 2017 37
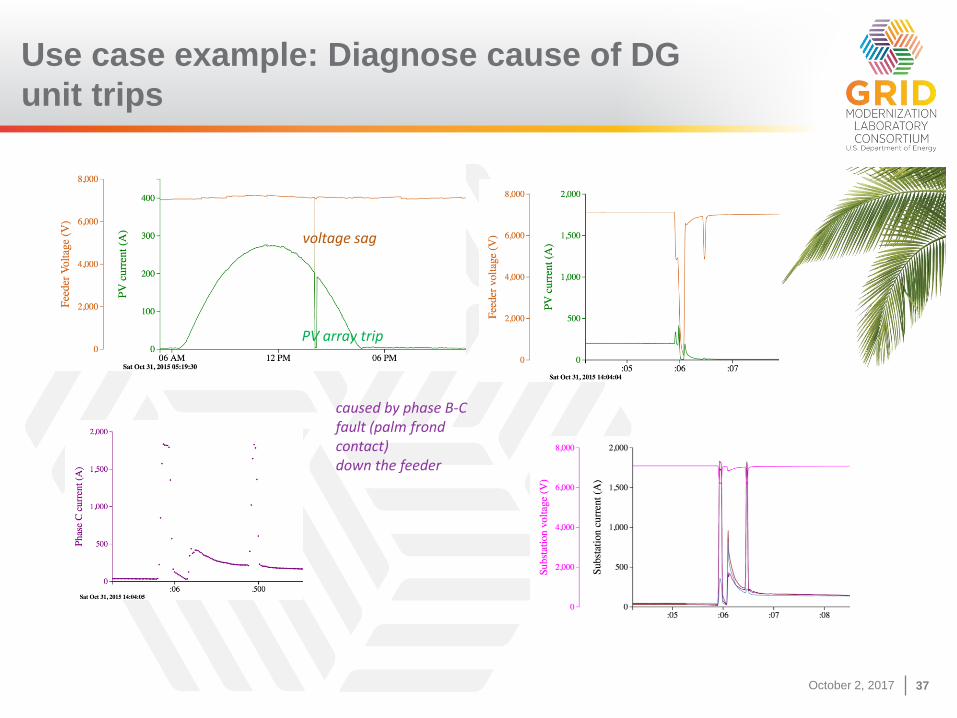
PV array trip
voltage sag
caused by phase B-C fault (palm frond contact)down the feeder
Use case example: Diagnose cause of DG
unit trips
October 2, 2017 38October 2, 2017 38
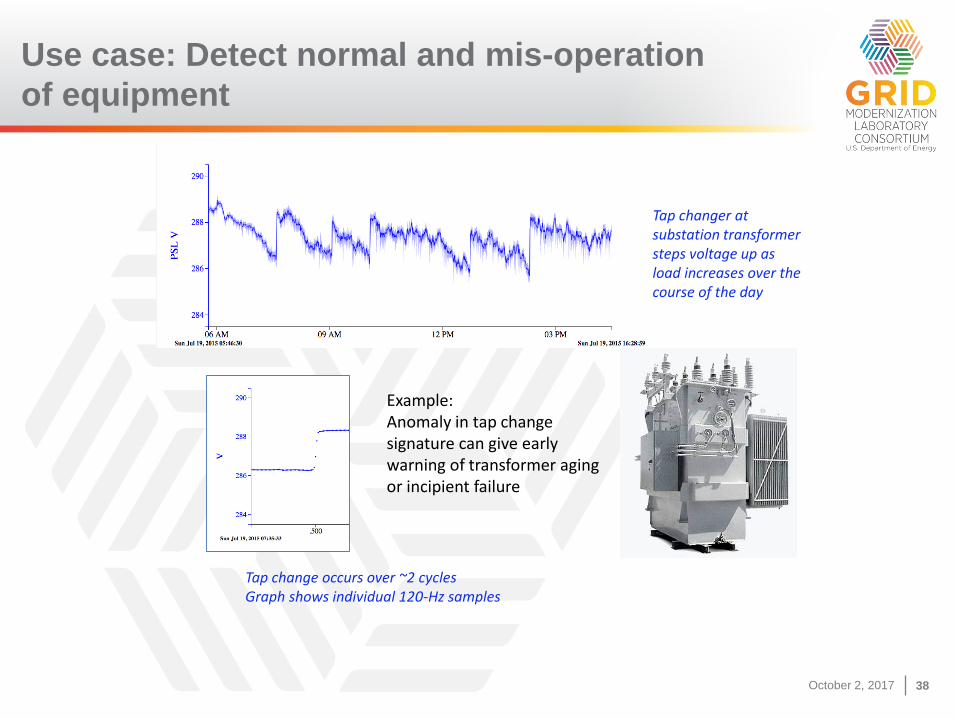
Tap change occurs over ~2 cycles Graph shows individual 120-Hz samples
Tap changer at substation transformer steps voltage up as load increases over the course of the day
Use case: Detect normal and mis-operation
of equipment
Example: Anomaly in tap change signature can give early warning of transformer aging or incipient failure
October 2, 2017 39October 2, 2017 39
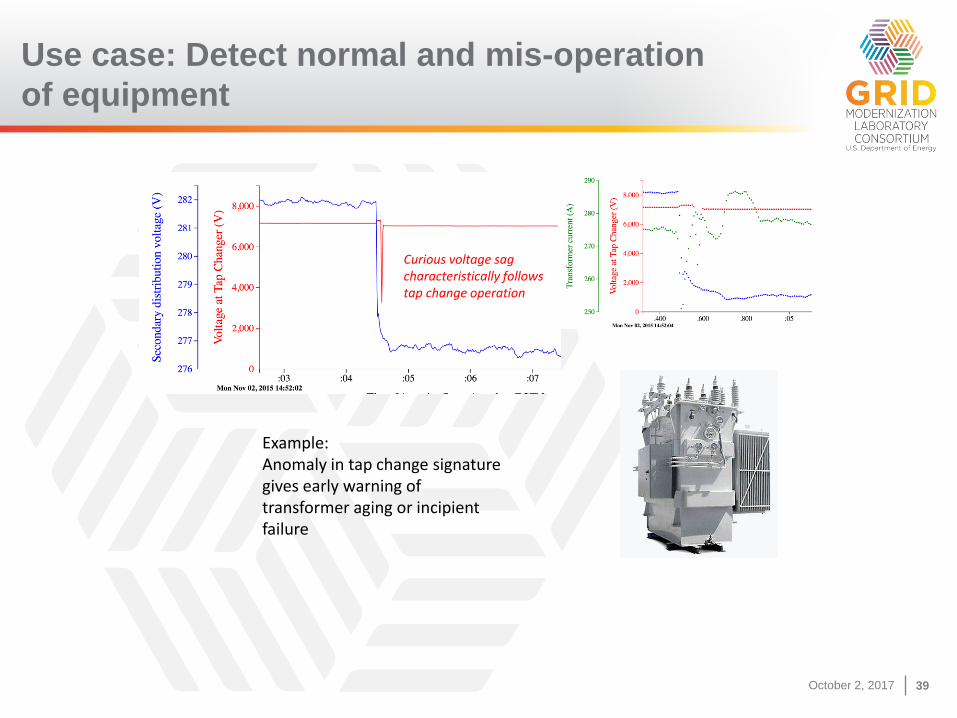
Use case: Detect normal and mis-operation
of equipment
Example: Anomaly in tap change signature gives early warning of transformer aging or incipient failure
Curious voltage sag characteristically follows tap change operation
October 2, 2017 40October 2, 2017 40
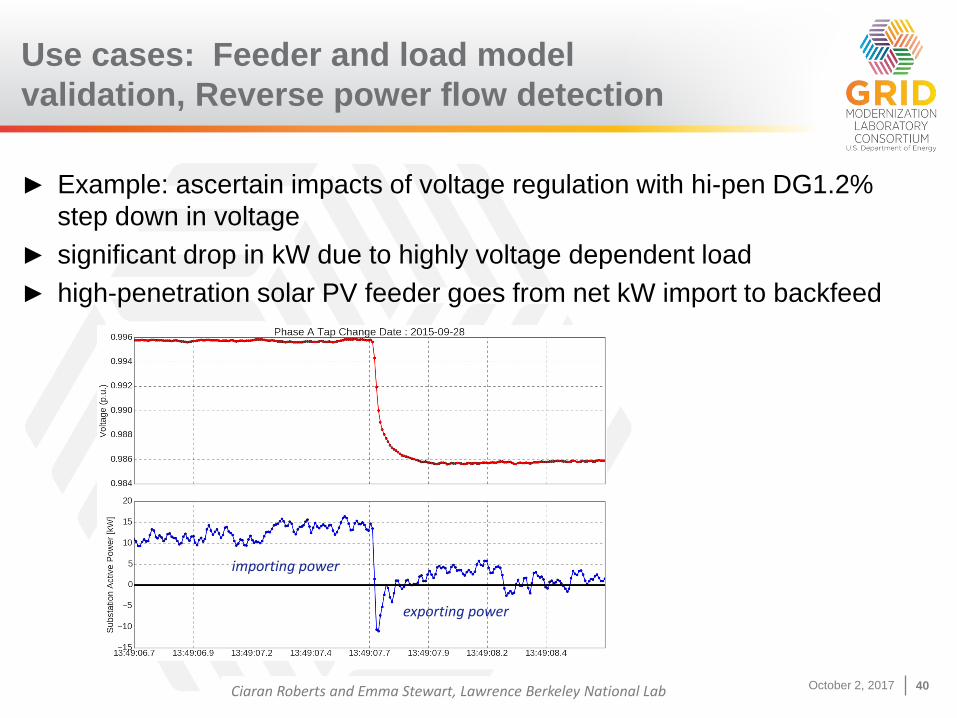
Use cases: Feeder and load model
validation, Reverse power flow detection
► Example: ascertain impacts of voltage regulation with hi-pen DG1.2%
step down in voltage
► significant drop in kW due to highly voltage dependent load
► high-penetration solar PV feeder goes from net kW import to backfeed
exporting power
importing power
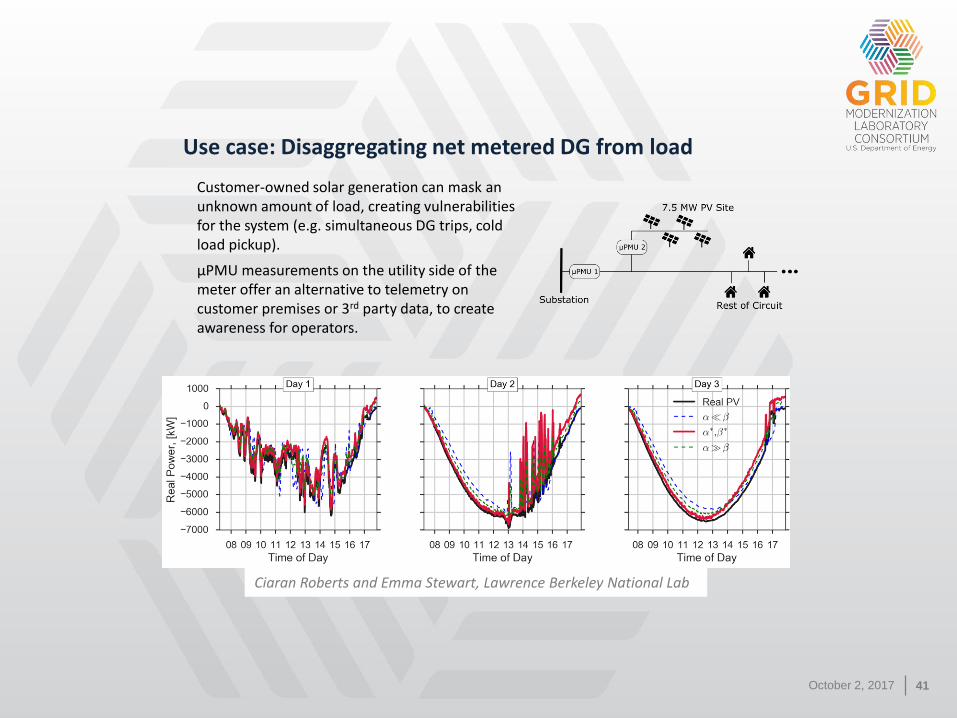
Ciaran Roberts and Emma Stewart, Lawrence Berkeley National Lab
October 2, 2017 41
Use case: Disaggregating net metered DG from load
Ciaran Roberts and Emma Stewart, Lawrence Berkeley National Lab
Customer-owned solar generation can mask an unknown amount of load, creating vulnerabilities for the system (e.g. simultaneous DG trips, cold load pickup).
µPMU measurements on the utility side of the meter offer an alternative to telemetry on customer premises or 3rd party data, to create awareness for operators.
October 2, 2017 42October 2, 2017 42
Ciaran Roberts and Emma Stewart, Lawrence Berkeley National Lab
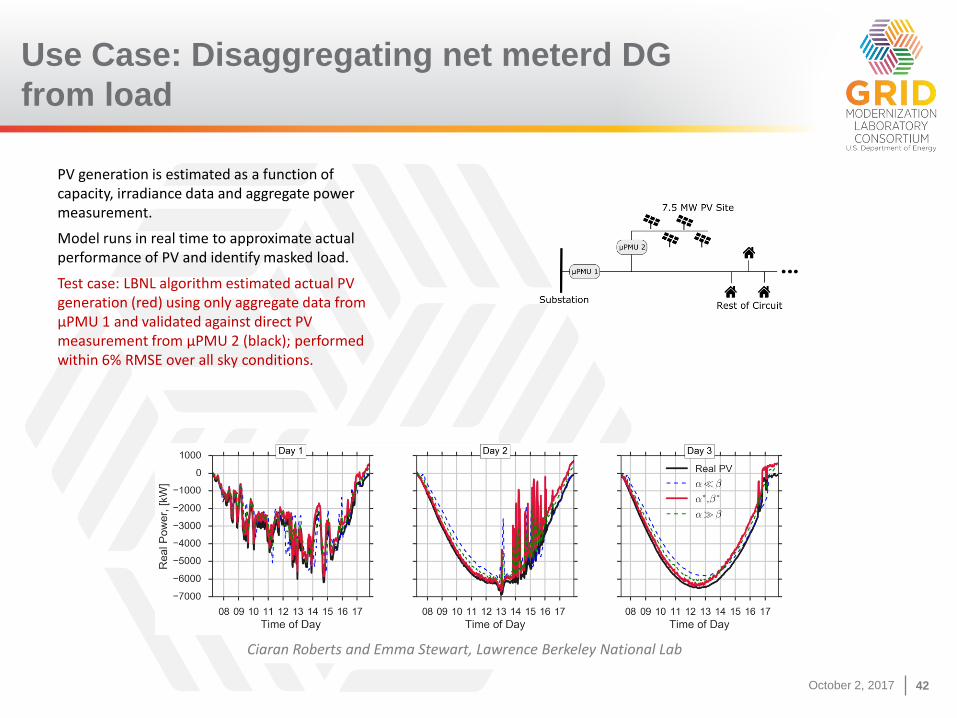
PV generation is estimated as a function of capacity, irradiance data and aggregate power measurement.
Model runs in real time to approximate actual performance of PV and identify masked load.
Test case: LBNL algorithm estimated actual PV generation (red) using only aggregate data from µPMU 1 and validated against direct PV measurement from µPMU 2 (black); performed within 6% RMSE over all sky conditions.
Use Case: Disaggregating net meterd DG
from load
October 2, 2017 43October 2, 2017 43
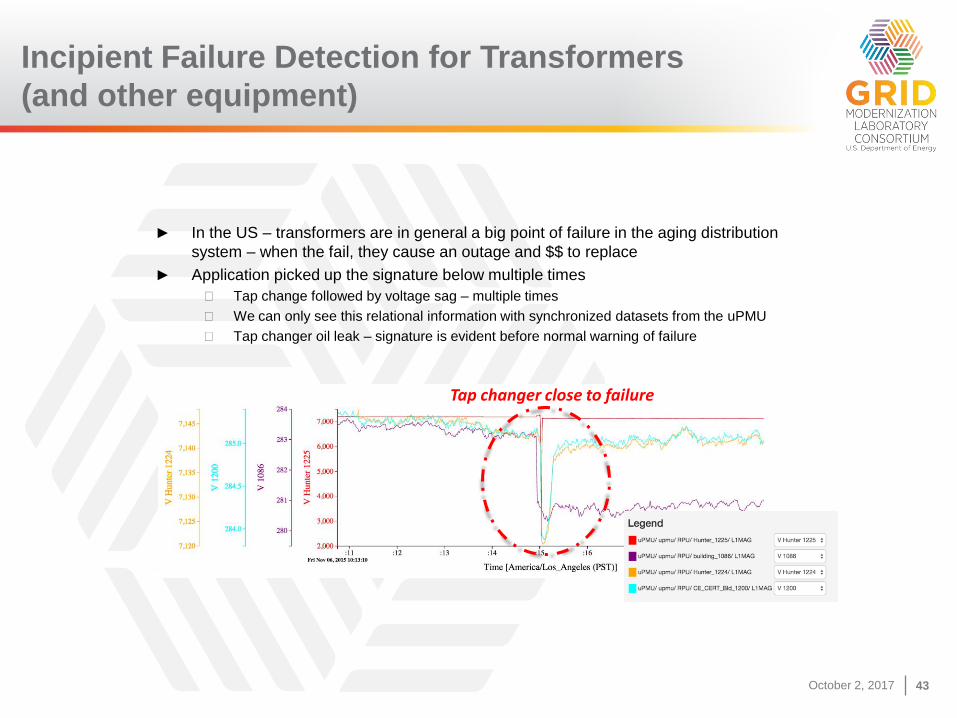
Incipient Failure Detection for Transformers
(and other equipment)
► In the US – transformers are in general a big point of failure in the aging distribution
system – when the fail, they cause an outage and $$ to replace
► Application picked up the signature below multiple times
◼ Tap change followed by voltage sag – multiple times
◼ We can only see this relational information with synchronized datasets from the uPMU
◼ Tap changer oil leak – signature is evident before normal warning of failure
Tap changer close to failure


