Data and Democracy Project: Investing in Neighborhoods A collaboration of Collaborative for Equity and Justice in Education, College of Education University of Illinois-Chicago and Nathalie P. Voorhees Center for Neighborhood and Community Improvement, College of Urban Planning and Public Affairs University of Illinois-Chicago Research Paper Series Paper #1: Examining CPS’ plan to close, consolidate, turn-around 18 schools February 2008 Written by Andrew Greenlee Nancy Hudspeth Pauline Lipman Danielle Akua Smith Janet Smith
Transcript
Data and Democracy Project: Investing in Neighborhoods
A collaboration of
Collaborative for Equity and Justice in Education, College of Education University of Illinois-Chicago
and Nathalie P. Voorhees Center for Neighborhood and Community Improvement,
College of Urban Planning and Public Affairs University of Illinois-Chicago
Research Paper Series
Paper #1: Examining CPS’ plan to close, consolidate, turn-around 18 schools
February 2008
Written by
Andrew Greenlee Nancy Hudspeth Pauline Lipman
Danielle Akua Smith Janet Smith
CONTENTS
1. Background........................................................................................................1 2. Report Focus .....................................................................................................3 3. Data to analyze CPS school utilization ..............................................................6 4. School capacity and utilization...........................................................................7 5. Neighborhood conditions .................................................................................15 6. Community involvement in local decision making............................................21 7. Research Team ...............................................................................................23 8. Appendix..........................................................................................................24
The Collaborative for Equity and Justice in Education, College of Education (CEJE) is a hub for the development of transformative models of urban education. In collaboration with teachers, students, community members, and community organizing efforts, CEJE provides opportunities for teacher development, conducts research, and develops education policy rooted in social justice. The Nathalie P. Voorhees Center for Neighborhood and Community Improvement was established in 1978 as a technical assistance and applied research center in the College of Urban Planning and Public Affairs at the University of Illinois at Chicago. Its mission is to improve the quality of life for all residents of the metropolitan area by assisting community organizations and local government entities to revitalize the many and varied communities in the City of Chicago and surrounding area. For more information about this report, contact: Pauline Lipman
BACKGROUND Urban development policy is much more locally driven today than in the past and much more reliant on a variety of intersecting streams of pubic and private resources. As a result, efforts to revitalize communities are more interrelated, interdependent, and potentially conflicting in practice. In turn, the ability to evaluate the effects of policies and programs intended to improve communities requires information that is more crosscutting and interdisciplinary in nature. The Data and Democracy Project aims to make a contribution to study of education, economic development, and housing policies in Chicago through an in-depth study of their relationship on the ground.
1
The overarching question we aim to answer is: “How do these three policy agendas intersect when used to revitalize communities, and what kinds of benefits are produced?” Recognizing that the term “benefits” is relative and often subjective, we are producing new measures that go beyond the traditional indicators of neighborhood improvement (e.g., change in household income), educational achievement (e.g., test scores), and economic development (e.g., change in property values). Instead, we examine “benefits” from three interrelated dimensions of social justice: economic redistribution, cultural recognition, and political representation. While research on each area of policy exists – much of it produced by UIC
researchers including those on this research team – there is a dearth of data that can be used to answer basic questions about the interrelationships between these different policy arenas. Chicago provides a fertile site to explore these intersecting policies, and to specifically look at how race and ethnicity affects and is affected by public and private interventions. This is important since an array of strategies are being employed in predominantly African American and Latino neighborhoods to improve schools, create jobs and build new housing: Renaissance 2010, which aims to “transform” 20 percent of Chicago’s public schools into new high-performing but often select or special enrollment schools; Tax Increment Financing (TIF), a public financing mechanism that is used to attract and retain new businesses and private investment through infrastructure improvement and tax incentives; and the Plan for Transformation, which is redeveloping public housing into mixed-income communities
housing policy
education policy
economic development
policy
The Data and Democracy Project is developing a more comprehensive and in-depth framework to analyze and interpret changes in community conditions relative to policy goals and stated beneficiaries. Our intent is to make this data and analysis available to policy makers, planners, non-profit agencies, foundations, residents and community leaders, as well as other researchers, concerned with making sure the development of new schools, housing, and businesses in communities of color actually benefit –and not push out – the very families that are assumed to be the target for these improvements. Groundwork for the Data and Democracy Project began when UIC acquired two databases from the Neighborhood Capital
2
Budget Group, a well-known fiscal watchdog organization in Chicago that closed its doors in February 2007 after 18 years of organizing and information dissemination about capital improvements and tax policy. The databases contain historical information on capital improvements for the Chicago Public Schools and property values and public investments in each of the city’s approximately 150 TIF districts. The team updated the data and produced a series of maps that was presented January 22, 2008, at a UIC Great Cities Institute seminar that brought together university scholars and community leaders/activists to examine education and the contested nature of the city. This dialogue with people affected by and acting on housing, community economic development, and education issues on the ground helped to sharpen our research questions, which include:
• What kinds of new schools are being constructed, where are they being opened, and from which neighborhoods are students being pulled?
• What kinds of schools are being closed, where are they located, and what was the justification for their closure? Where have students that previously attended these schools been placed?
• Where are areas of new housing construction, condominium conversion activity, and public housing demolition relative to the placement of new schools, modernized schools, and closed schools?
• Where are areas of greatest racial and ethnic change relative to the placement of new schools, modernized schools, and closed schools?
• Where are areas of greatest property value change relative to the placement of new schools, modernized schools, and closed schools?
• Are parents and students in neighborhoods that have been the recipients of new or modernized schools more or less satisfied with these facilities? What additional public services and investments are necessary to improve the quality of the education received in these schools?
• When new schools are constructed, or created from existing schools under Renaissance 2010, what are the internal and external effects of drawing students from new and dispersed feeder neighborhoods?
• What are the educational opportunities in new schools, which students do they serve, and do these represent more equitable educational experiences for African American and Latino students?
• Which schools have received TIF funds for modernization and school construction?
• What are the advantages and disadvantages of using TIF funds to finance school improvements instead of going through the Board of Education’s normal capital budgeting procedures?
• How are community residents, students, parents, and school-, neighborhood- and city-wide-organizations shaping development policy through local organizing efforts? What voice do they have in shaping the changes occurring in schools and communities?
3
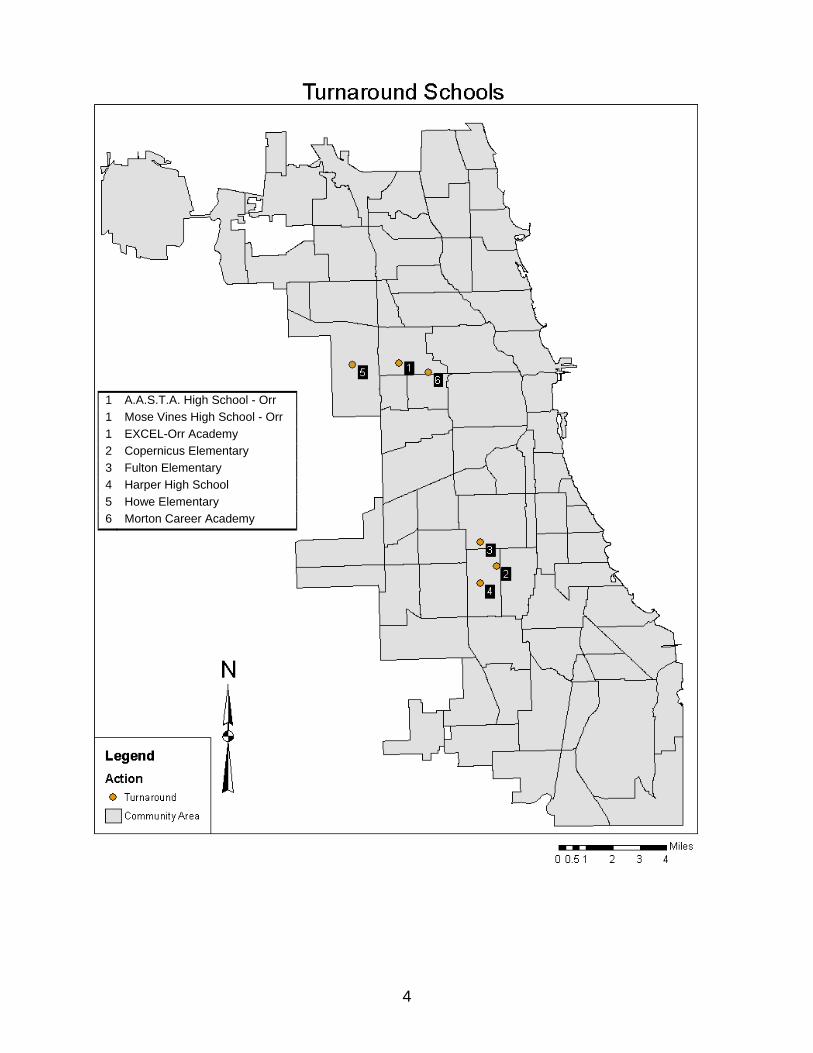
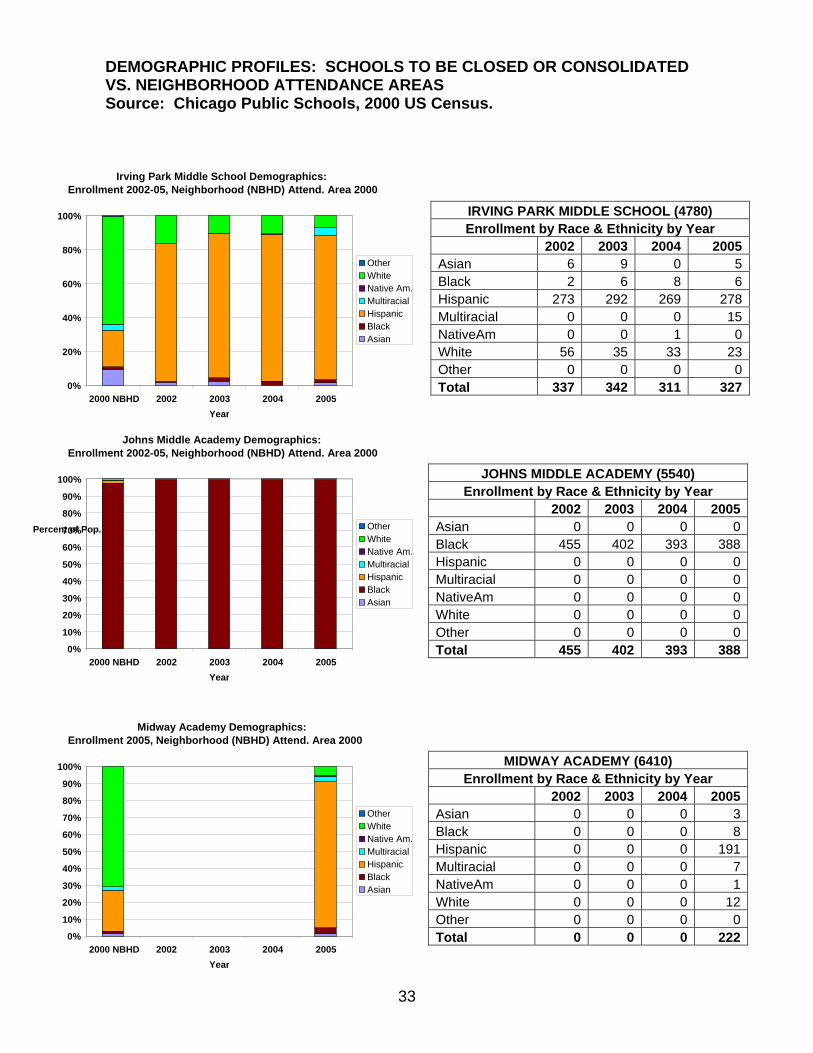
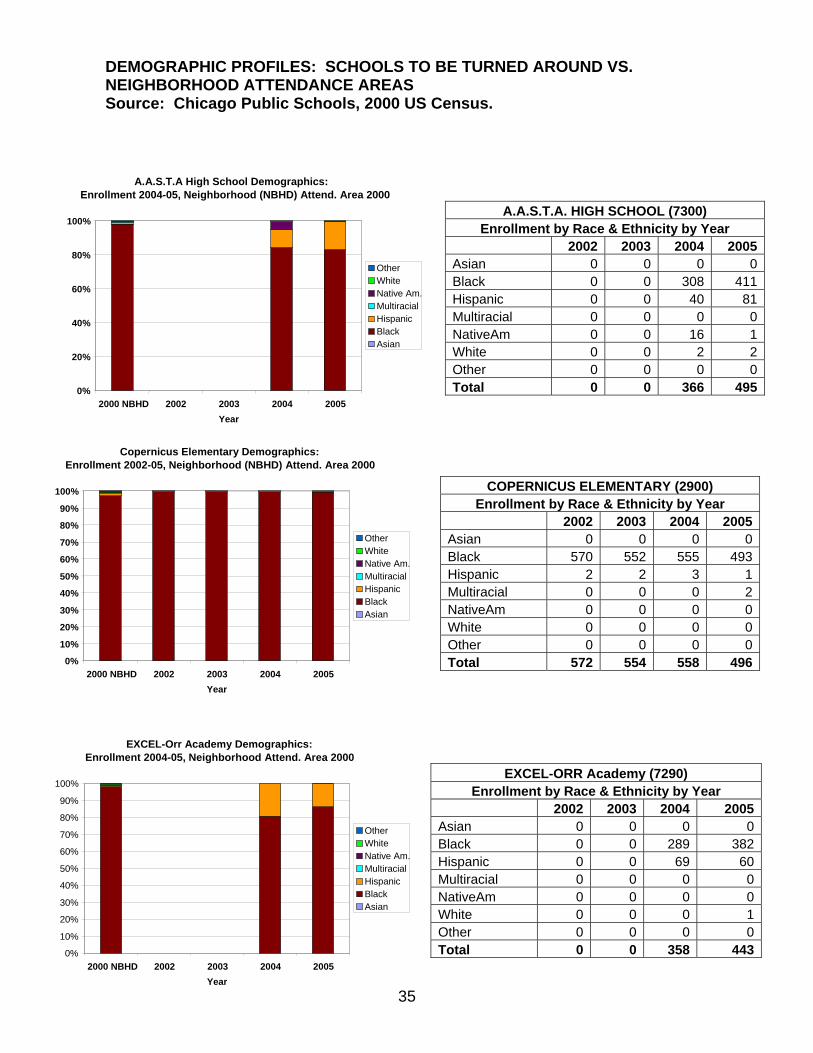
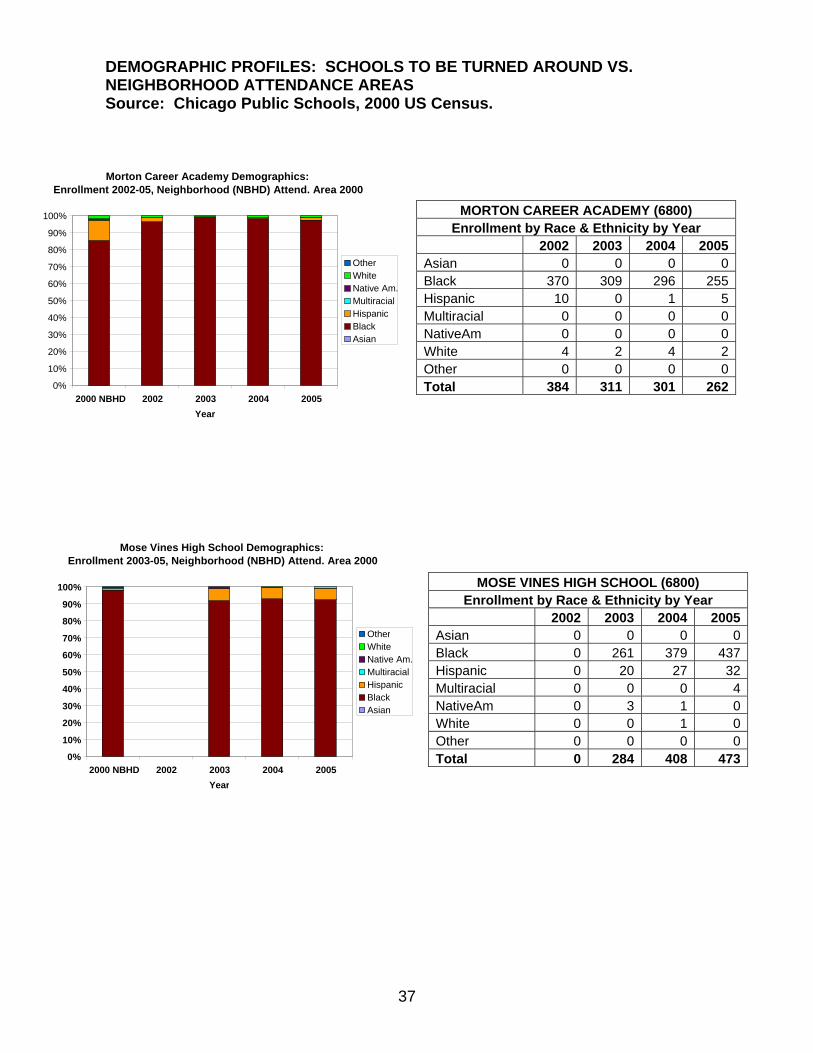
REPORT FOCUS This report provides data that can be used to examine the Chicago Public School district’s plan to close, consolidate, or turn-around 18 schools. Announced January 24, 2008, the plan – if approved – is to be implemented following a decision made by the CPS board at its February meeting. CPS announced it would use the turn around model to address chronic under-performance in 8 elementary and high schools and relocations, phase-outs, consolidations, and closings to address underenrollment in 11 elementary schools. Data in this report show these schools are primarily in communities of color experiencing gentrification or rapidly changing demographics. We focus particularly on schools closed for under enrollment. Turn around schools: These schools will continue to serve the same students but will hire a new principal and new teachers to create a new “academic culture.” Unlike past efforts to turn schools around, this plan includes both high schools and the elementary schools that serve as feeders. Harper High School and Fulton Elementary and Copernicus Elementary on the South Side. Mose Vines High School, A.A.S.T.A. High School, and EXCEL-Orr Academy (all small schools on the Orr campus), and Morton Career Academy and Howe Elementary on the West Side. Orr High School will again become one large high school that CPS will turn into a teacher training academy.
Closing schools: Some schools will be closed by Fall 2008 while some will be phased out over a longer time period. Gladstone Elementary (1231 S Damen) will close Fall 2008 and its attendance boundary reassigned to Smyth Magnet School (1059 W. 13th) and Plamondon (2642 W. 15th). Students also will be given the option of going to other nearby schools. Johns Middle Academy (6936 S. Hermitage Av) will be absorbed into the new Miles Davis (6740 S. Paulina) – a new magnet school opening fall 2008 that will
prepare elementary students for careers in engineering. Miles Davis Academy (6723 S. Wood) will fold into the new Miles Davis magnet school. Andersen Elementary (1148 N. Honore St) will be phased out. New students will now attend Pritzker Elementary (2009 W. Schiller St). A new citywide magnet school modeled after LaSalle Language Academy will be pahsed in to the building. Midway Academy (5434 S. Lockwood Av) will close and children will attend their neighborhood schools. Irving Park Middle School (3815 N. Kedvale Av) will be phased out. New students will attend Marshall Middle School (3900 N. Lawndale Av). Consolidation Schools: Students from these schools will be combined into nearby schools. Carver Middle School (801 E. 133rd Pl) will consolidate with its feeder school, Carver Primary (901 E. 133rd). De La Cruz (2317 W. 23rd Pl) will consolidate with Finkl Elementary (2332 S. Western Av). Abbott Elementary (3630 S. Wells St) will consolidate with Graham Elementary (4436 S. Union Av). Edison Regional Gifted Center (6220 N. Olcott Av) will be relocated to and share a building with the Albany Park Multicultural Academy (4929 N. Sawyer Av). Edison will remain a Regional Gifted Center and both schools would retain their own identities. Roque DeDuprey Elementary (1405 N. Washtenaw Av) will be relocated to Von Humboldt Elementary (2620 W. Hirsch). Both schools would retain their separate identities.
1 A.A.S.T.A. High School - Orr 1 Mose Vines High School - Orr 1 EXCEL-Orr Academy 2 Copernicus Elementary 3 Fulton Elementary 4 Harper High School 5 Howe Elementary 6 Morton Career Academy
4
Closing / Phasing Out Schools Receiving Schools Name Action Label Name LabelGladstone Elementary Closing 1 Smyth Magnet A Plamondon Elementary B Johns Middle Academy Closing 2 New Miles Davis C Miles Davis Academy Closing 3 New Miles Davis C Midway Academy Closing 4 Neighborhood Schools Andersen Elementary Phasing Out 5 Pritzker Elementary D Irving Park Middle School Phasing Out 6 Marshall Middle E Abbott Elementary Consolidating 7 Graham Elementary F Carver Middle School Consolidating 8 Carver Primary G De La Cruz Middle School Consolidating 9 Finkl Elementary H Edison Regional Gifted Center Relocating 10 Albany Park Multicultural Academy I Roque DeDuprey Elementary Relocating 11 Von Humboldt Elementary J
5
6
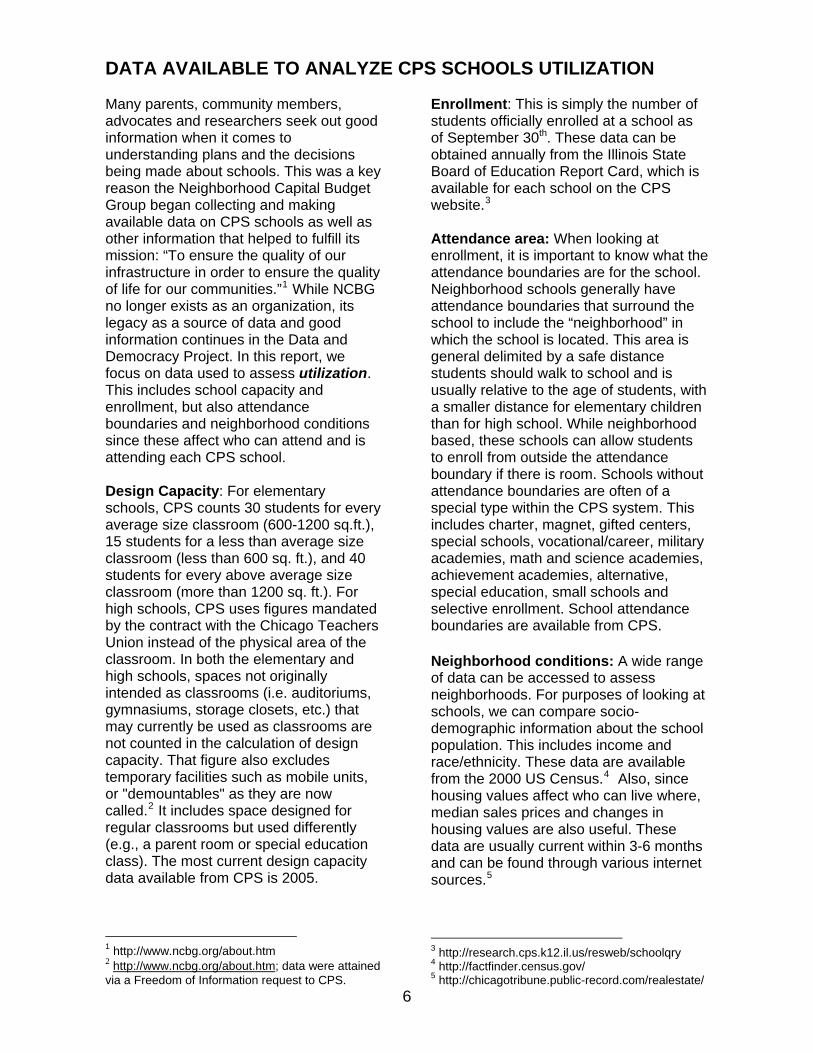
DATA AVAILABLE TO ANALYZE CPS SCHOOLS UTILIZATION Many parents, community members, advocates and researchers seek out good information when it comes to understanding plans and the decisions being made about schools. This was a key reason the Neighborhood Capital Budget Group began collecting and making available data on CPS schools as well as other information that helped to fulfill its mission: “To ensure the quality of our infrastructure in order to ensure the quality of life for our communities.”1 While NCBG no longer exists as an organization, its legacy as a source of data and good information continues in the Data and Democracy Project. In this report, we focus on data used to assess utilization. This includes school capacity and enrollment, but also attendance boundaries and neighborhood conditions since these affect who can attend and is attending each CPS school. Design Capacity: For elementary schools, CPS counts 30 students for every average size classroom (600-1200 sq.ft.), 15 students for a less than average size classroom (less than 600 sq. ft.), and 40 students for every above average size classroom (more than 1200 sq. ft.). For high schools, CPS uses figures mandated by the contract with the Chicago Teachers Union instead of the physical area of the classroom. In both the elementary and high schools, spaces not originally intended as classrooms (i.e. auditoriums, gymnasiums, storage closets, etc.) that may currently be used as classrooms are not counted in the calculation of design capacity. That figure also excludes temporary facilities such as mobile units, or "demountables" as they are now called.2 It includes space designed for regular classrooms but used differently (e.g., a parent room or special education class). The most current design capacity data available from CPS is 2005.
1 http://www.ncbg.org/about.htm 2 http://www.ncbg.org/about.htm; data were attained via a Freedom of Information request to CPS.
Enrollment: This is simply the number of students officially enrolled at a school as of September 30th. These data can be obtained annually from the Illinois State Board of Education Report Card, which is available for each school on the CPS website.3 Attendance area: When looking at enrollment, it is important to know what the attendance boundaries are for the school. Neighborhood schools generally have attendance boundaries that surround the school to include the “neighborhood” in which the school is located. This area is general delimited by a safe distance students should walk to school and is usually relative to the age of students, with a smaller distance for elementary children than for high school. While neighborhood based, these schools can allow students to enroll from outside the attendance boundary if there is room. Schools without attendance boundaries are often of a special type within the CPS system. This includes charter, magnet, gifted centers, special schools, vocational/career, military academies, math and science academies, achievement academies, alternative, special education, small schools and selective enrollment. School attendance boundaries are available from CPS.
Neighborhood conditions: A wide range of data can be accessed to assess neighborhoods. For purposes of looking at schools, we can compare socio-demographic information about the school population. This includes income and race/ethnicity. These data are available from the 2000 US Census.4 Also, since housing values affect who can live where, median sales prices and changes in housing values are also useful. These data are usually current within 3-6 months and can be found through various internet sources.5
SCHOOL CAPACITY AND UTILIZATION CPS considers any elementary school “overcrowded” if enrollment exceeds 80% of the school’s design capacity—the number of students CPS has established that the school can hold. Elementary schools that exceed 100% of their design capacity are “severely overcrowded”. CPS defines high school overcrowding as a school that exceeds 100% of its design capacity. CPS defines 65-80% design capacity as “ideal”. If a school falls below 65% of its design capacity, it is considered to be “under-utilized” and assumed to have excess building space. See NCBG’s 2005 report, Building a Vision for Chicago’s Schools & Neighborhoods: A Framework for a Facilities Master Plan, p. 9. http://www.ncbg.org. The
standards cited in this report were taken from CPS Space Utilization Reports 2001, 2002. CPS determines whether a school is overcrowded or underutilized by dividing the enrollment by the design capacity. However, this calculation usually does not consider important space needs for special curriculum programming. For instance a school offering vocational training classes, labs, or kitchens, would require more space per student. So would a school offering special education classes for students with disabilities, which typically have 10 to 15 students per class.
Table 1. Design capacity and enrollment (2005, 2007) for schools in CPS plan CLOSING / CONSOLIDATING SCHOOLS Unit No.
School Name Address Capacity 2005 (a)
Enrollment 2005 (a)
Enrollment 2007 (b)
2010 Abbott Elementary * 3630 S. Wells St. 1,110 120 99 ( 9%) 2060 Andersen Elementary 1148 N. Honore St. 1,245 572 580 (47%) 2700 Carver Middle School 801 E. 133rd Pl 1,020 387 244 (24%) 7330 De La Cruz Middle School 2317 W. 23rd Pl 310 244 102 (33%) 2220 Edison Regional Gifted Center 6220 N. Olcott Av 410 269 274 (67%) 3540 Gladstone Elementary 1231 S. Damen Av 960 417 287 (30%) 4780 Irving Park Middle School 3815 N. Kedvale Av 670 327 348 (52%) 5540 Johns Middle Academy 6936 S. Hermitage Av 655 388 308 (47%) 6410 Midway Academy 5434 S. Lockwood Av N/A 222 90 (NA) 7180 Miles Davis Academy 6723 S. Wood St 360 345 306 (85%) 7510 Roque DeDuprey Elementary 1405 N. Washtenaw Av N/A 322 235 (NA)
TURNAROUND SCHOOLS Unit No. School Name Address Capacity
2005 (a) Enrollment 2005 (a)
Enrollment 2007 (b)
7300 A.A.S.T.A. High School 730 N. Pulaski Rd N/A 495 4892900 Copernicus Elementary 6010 S. Throop St 720 496 3757290 EXCEL-Orr Academy 730 N. Pulaski Rd N/A 443 4233450 Fulton Elementary 5300 S. Hermitage Av 1,200 672 5631360 Harper High School 6520 S. Wood St N/A 1,261 1,1154060 Howe Elementary 720 N. Lorel Av 1,220 696 5956800 Morton Career Academy 431 N. Troy St 1,020 262 2577530 Mose Vines High School 730 N. Pulaski Rd N/A 473 451
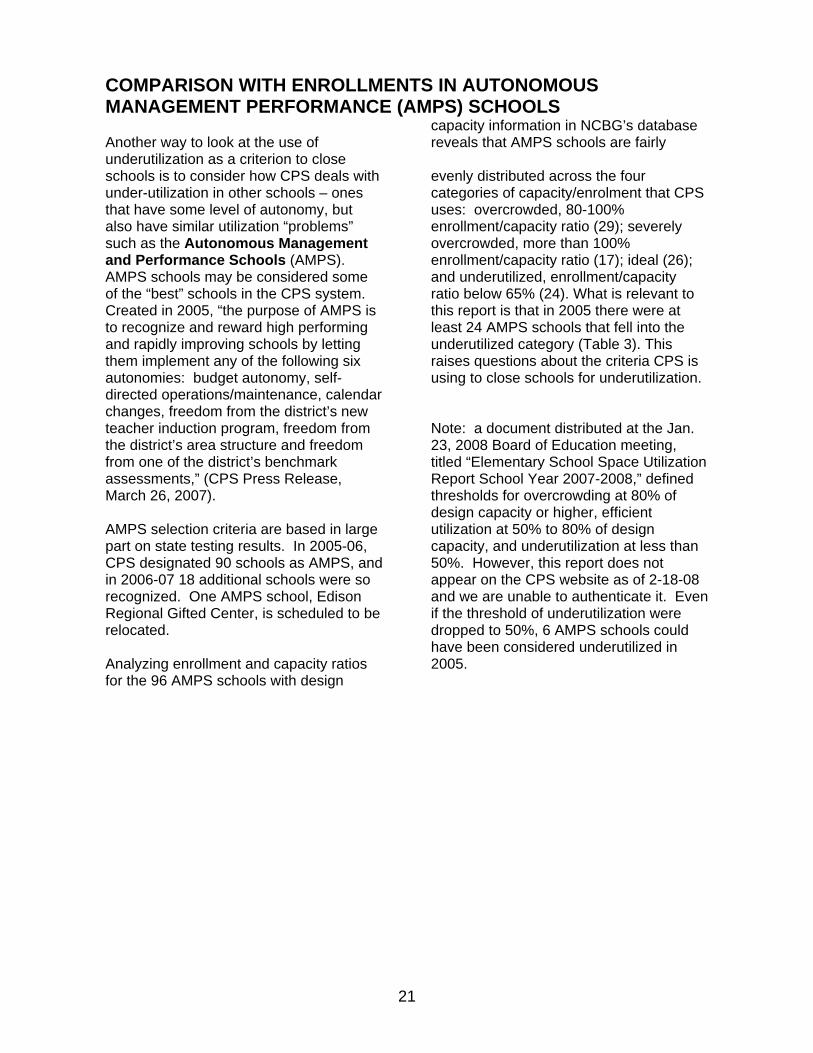
Source: a = Neighborhood Capital Budget Group, 2007 b = Chicago Public Schools, 2008 * Does not include Chicago Choir Academy, which has 196 students Closing and Turn-Around Schools Enrollment: In 2005, the combined total enrollment of the closing and turnaround schools was 8,411. Historical enrollment data for each school is provided in Appendix
A. These graphs of enrollment trends illustrate that although some of the closing schools experienced falling enrollment in recent years that is not the case for the
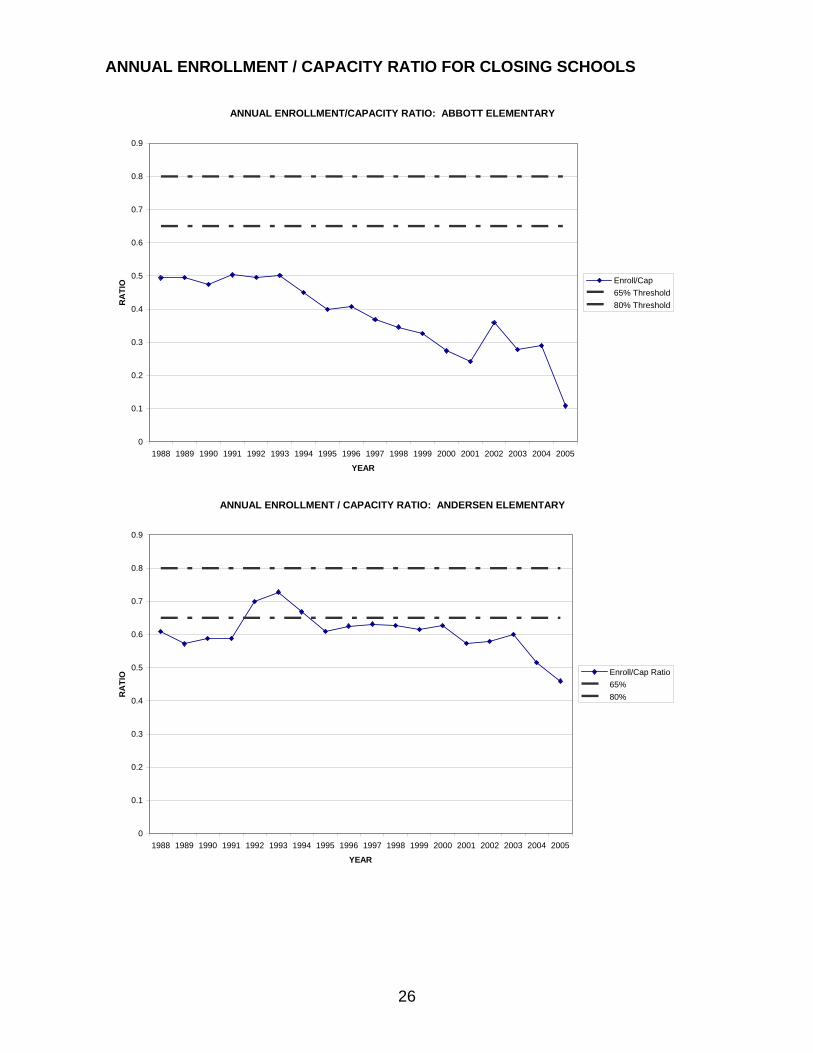
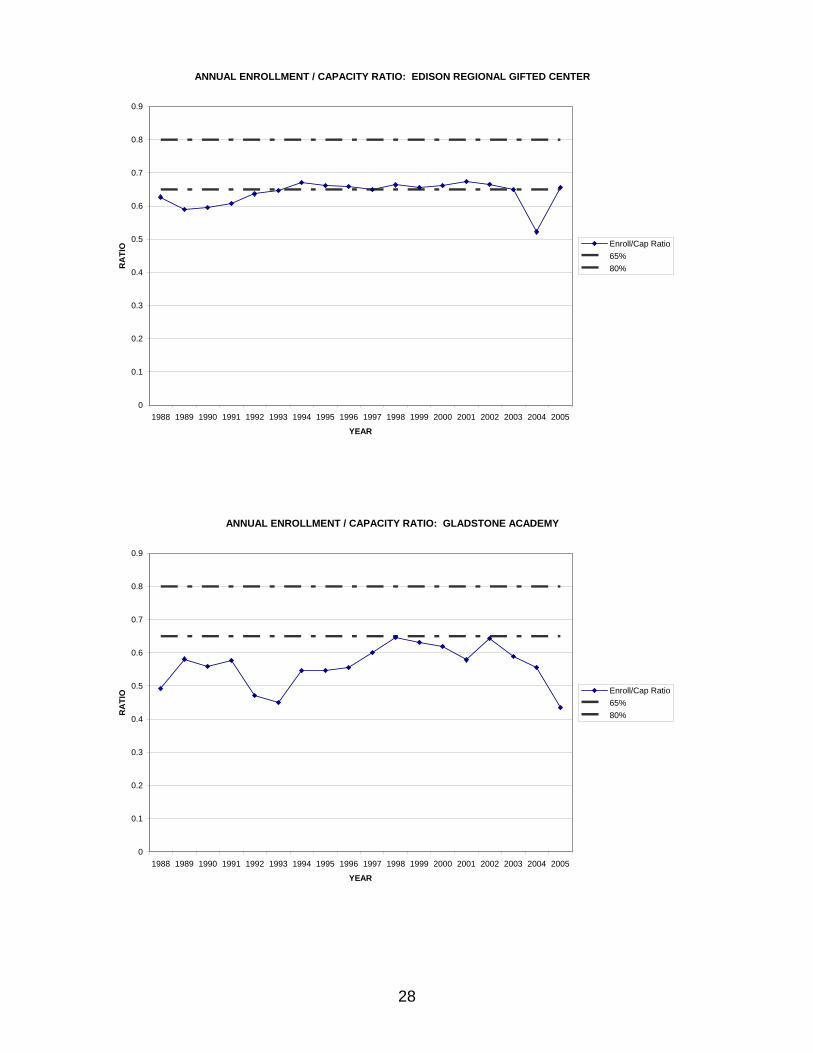
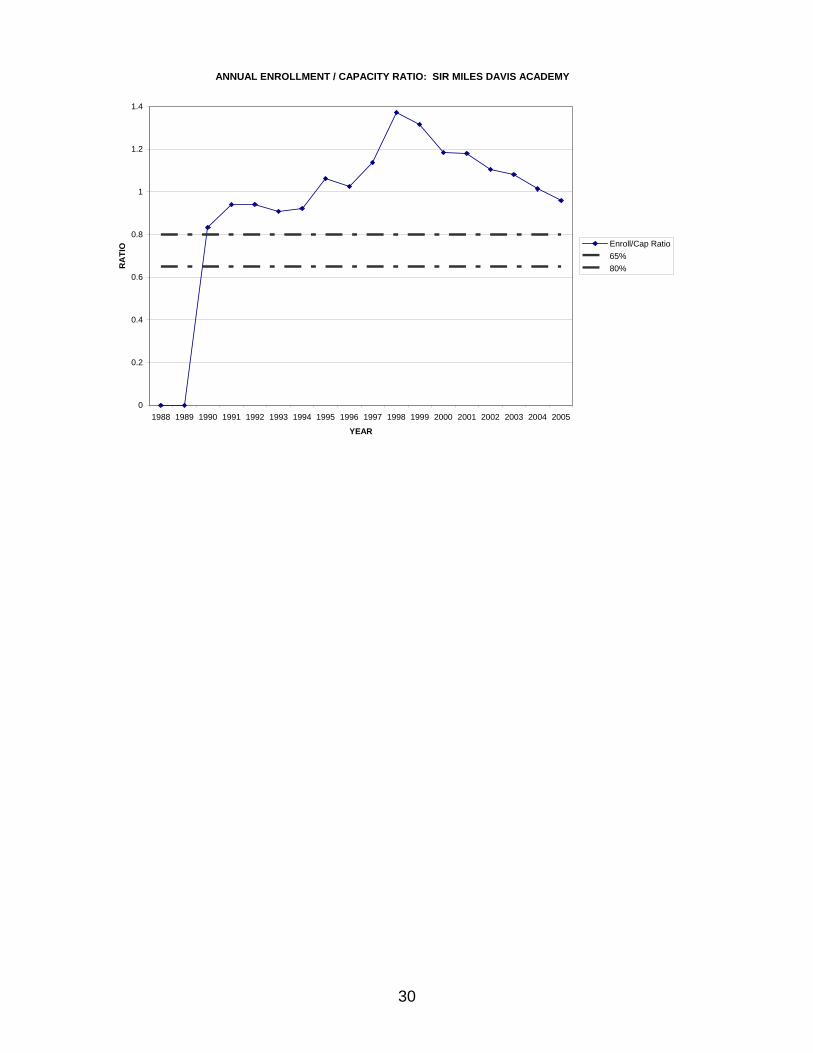
majority of the schools. To note, two years earlier, there had been 740 more students in the schools now designated to close for under-enrollment. Under-utilization and overcrowding: Plotting annual data comparing school design capacity with enrollment levels between 1988 and 2005 illustrates how much variation there is over time in enrollment. While most of the schools on the list for closure were below 65% of their design capacity recently, not all were this low in the past and some actually had seen an increase in enrollment. In 2005, some schools (Edison, De La Cruz) were in the range of “ideal” enrollment levels and others were overcrowded. De La Cruz Middle School was severely overcrowded in 2000, with enrollment at 120% of its design capacity. One school that will be closed, Sir Miles Davis Academy, was severely overcrowded in 1998, with enrollment at 140% of design capacity; it remained severely overcrowded in 2005. (Davis received the ISBE award for outstanding performance—see their website). Note: data were not available for Midway Academy and Roque De Duprey only had one year’s data, 2003. These data only tell part of the story, however, since each school and the community where it is located experience different changes over time. An alternative way to look at school capacity and enrollment is to consider what is “educationally appropriate” relative to the programs and goals of each particular school and education best practices. For example, a 2005 Neighborhood Capital Budget Group report Building a Vision for Chicago’s Schools and Neighborhoods: A Framework for a Facilities Master Plan proposes looking at the amount of space needed for students relative to the age / grade of students. Based on standards used in Washington DC, the guide would be 150 square feet (sf) per student in grade schools; 170 sf per student in middle/junior high schools; and 180 sf per student in high schools.6 The premise is simple but can
6 Andea Lee. Building a Vision for Chicago’s Schools and Neighborhoods: A Framework for a Facilities Master Plan. 2005. NCBG, available at http://www.ncbg.org/
produce different results when it comes to looking at utilization. Educationally appropriate enrollments in relation to building capacity: Determining the actual ratio of building capacity to enrollment is more complex than calculating square footage. It requires us to look closely at how space is being used. For example, in addition to regular classroom space, schools may have computer labs, science labs, language labs, parent rooms, dance studios, rooms designed for students with special needs, multimedia centers, teacher conference rooms, and community services such as health clinics. These adaptations of school buildings are consistent with research on effective educational programs and practices. They are necessary to implement practices that address stated CPS goals: technological literacy, hands-on science, parent and community involvement in schools, high quality education for special needs students, development of highly qualified teachers, and educational enrichment. Some schools that have reduced enrollments are able, for the first time, to teach children in smaller classes. Educational research is clear that smaller class sizes, when accompanied by quality teaching and appropriate resources, improve student learning. This is particularly important for schools working to raise student achievement. Both smaller class sizes and educational enrichments are typical of the highest performing suburban schools. Thus, to determine the educationally appropriate utilization of school buildings requires a more detailed “on the ground” look at how school buildings are being used to strengthen education. This assessment would best be done by pooling the knowledge of school personnel, parents, and CPS staff. The following case studies, based on data provided by school leaders – parents and staff – from two schools slated for closure help to illustrate the need for this kind of analysis of all CPS schools to determine what is educationally appropriate to serve the needs of a school and its community. They represent the perspectives of those often unheard in school decisions – parents, teachers, and community members.
Hans Christian Andersen Community Academy
9
In a packed auditorium, Andersen elementary school parents asked “What does phasing out feel like? Is this a healthy environment for students to learn? What research has been conducted regarding the implications of such a plan on the children and community? Is it right to displace one group of children and replace them with another group? What message does this send to our children?” These questions were being asked because their school is slated to be phased out. Under CPS’s proposed plan, new incoming students would be sent to nearby Pritzker Elementary School and a new city-wide magnet school, modeled after LaSalle Language Academy, would be phased in to Andersen’s building. The outpouring of parent opposition to this plan to phase out their neighborhood school raises good questions about what data were not taken into consideration when CPS made its plan. Parents point to CPS data which show that Andersen has a higher level of parent satisfaction and opportunity for parent participation than the district as a whole (2007 School Report Card). Furthermore, as CPS works to improve academic achievement and develop the full potential of diverse student populations, Andersen is an example to emulate. Andersen won CPS’s 2007 Exemplary Achievement Award for 3 years of consecutive gains on the ISAT and was an Illinois Honor Role School in 2006 and 2007. According to the CPS ISAT Overtime report, the composite percentage of students meeting or exceeding state standards jumped 20.3% from 2005 to 2007, The increase surpassed that of the area and district as a whole. Andersen increased its ISAT scores four years in a row. In 2005-2006, 61.8% of students met or exceeded state standards. In 2006-2007, 64.6% met or exceeded state standards. Andersen also exceeded expectations for meeting Adequate Yearly Progress in reading, math, and student attendance in 2006-2007 (2007 School Report Card). Expected Actual Reading 55% 60.6% Math 55% 66.4% Attendance 90% 94.6% In addition to a dedicated and hard-working staff, these achievements may be attributed to the school’s rich curriculum. Andersen has a diverse student body: 73.1% Latino (Hispanic), 15.9% African American, 4.5% white, 23.9% Limited English Proficient and 91.6% Low Income. Seeing this diversity as an asset, the World Language program focuses on cultural understanding and recognition of the social and cultural contributions of people of different backgrounds. All children in the school are learning Spanish. “We have worked so hard to bring all these programs into the school, and now they want to phase us out. The children deserve better,” one teacher said. Andersen uses the Chicago Math and Science Initiative curricula in mathematics and science and is developing a cutting-edge science education program through its partnership with the Museum of Science and Industry, the inquiry-based FOSS science curriculum, Get Energized! energy education program, and City Science, a program initiated by the National Science Teachers Association to help urban science teachers receive professional development and resources. All these programs provide extensive teacher professional development and hands-on science curricula.
CPS states transferring students to Pritzker “would not inconvenience students” as it is ½ mile from Andersen, “a safe walking distance” (CPS School consolidation Plan, 2008-2012). Parents respond that since many of the families have future kindergarteners, children will be split between Pritzker and Andersen. Some families live 11 blocks or more from Pritzker, creating a hardship if they are transferred. 130 students are bused to Andersen from Mary Lyon, an overcrowded school. What will happen to these students? As children posted signs all over Andersen saying “Save our School,” some say they are “afraid” and “think they did something wrong” to close their school.
Educationally appropriate enrollment: CPS states that Andersen has a current enrollment of 565 students, a design capacity of 1,215, and current enrollment represents a 47% utilization rate (Letter from Arne Duncan to Andersen Parents, Jan. 24, 2008). However, a look at the educationally appropriate enrollment tells a different story. There are 8 special education programs in the building that require small class limits: two blended pre-k classes with 20 children each; two rooms for autistic students, early childhood and primary, with a limit of 7 students each; one developmentally delayed room for 10 students; three cross-categorical special education rooms (primary, intermediate, and upper grades) with 12 students each. There are also two resource rooms for special education pull out programs limited to 20 students each. Based on data on actual use of school space, Andersen staff calculate utilization at 58%, which is closer to the currently acceptable rate. This discrepancy illustrates the need for a qualitative school-based assessment.
To consider: First, if Andersen were to follow the CPS formula and be at the limit of the “ideal’ enrollment range (80%) there would be 972 students in the building. CPS and school districts around the country support small schools (500 students or less). A school with 972 elementary students would be too large while the current enrollment would be appropriate. Second, as the table below illustrates, at the current enrollment, Andersen’s average class size is about that of the state, and often meets or exceeds the average for the subregion and the district. (2007 report card).
Hans Christian Andersen Community Academy, 2007 Report Card
10
11
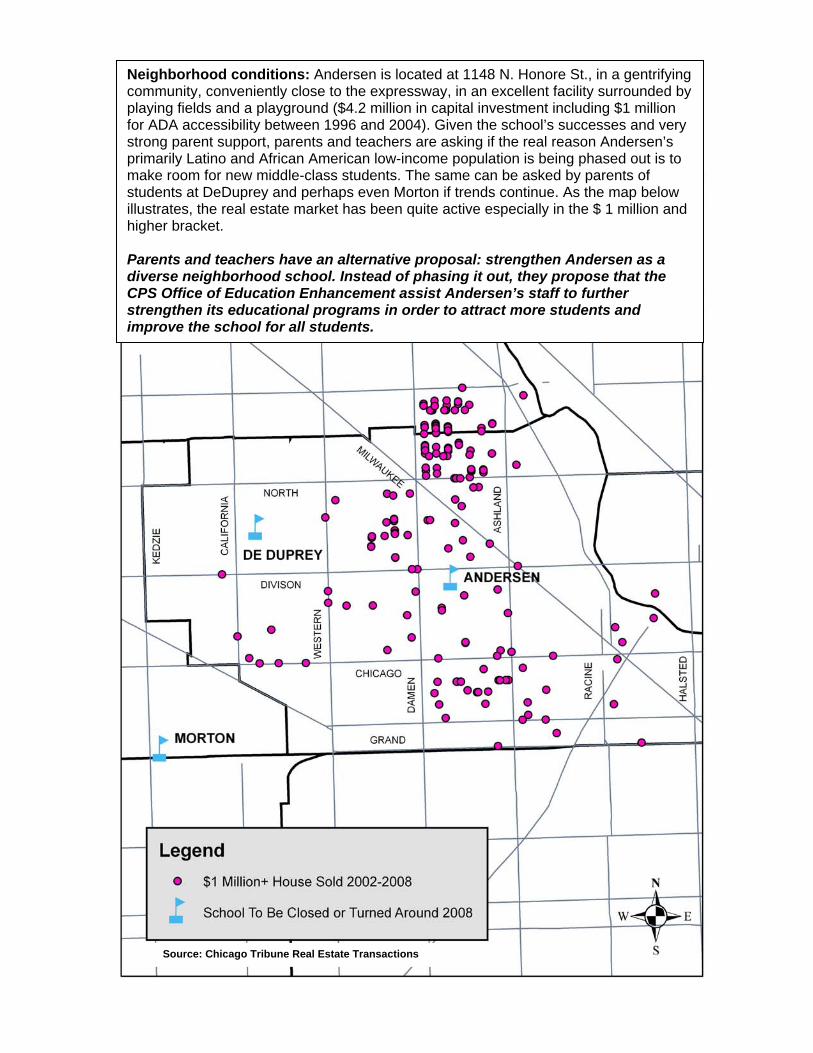
Neighborhood conditions: Andersen is located at 1148 N. Honore St., in a gentrifying community, conveniently close to the expressway, in an excellent facility surrounded by playing fields and a playground ($4.2 million in capital investment including $1 million for ADA accessibility between 1996 and 2004). Given the school’s successes and very strong parent support, parents and teachers are asking if the real reason Andersen’s primarily Latino and African American low-income population is being phased out is to make room for new middle-class students. The same can be asked by parents of students at DeDuprey and perhaps even Morton if trends continue. As the map below illustrates, the real estate market has been quite active especially in the $ 1 million and higher bracket. Parents and teachers have an alternative proposal: strengthen Andersen as a diverse neighborhood school. Instead of phasing it out, they propose that the CPS Office of Education Enhancement assist Andersen’s staff to further strengthen its educational programs in order to attract more students and improve the school for all students.
Source: Chicago Tribune Real Estate Transactions
Abbot Elementary
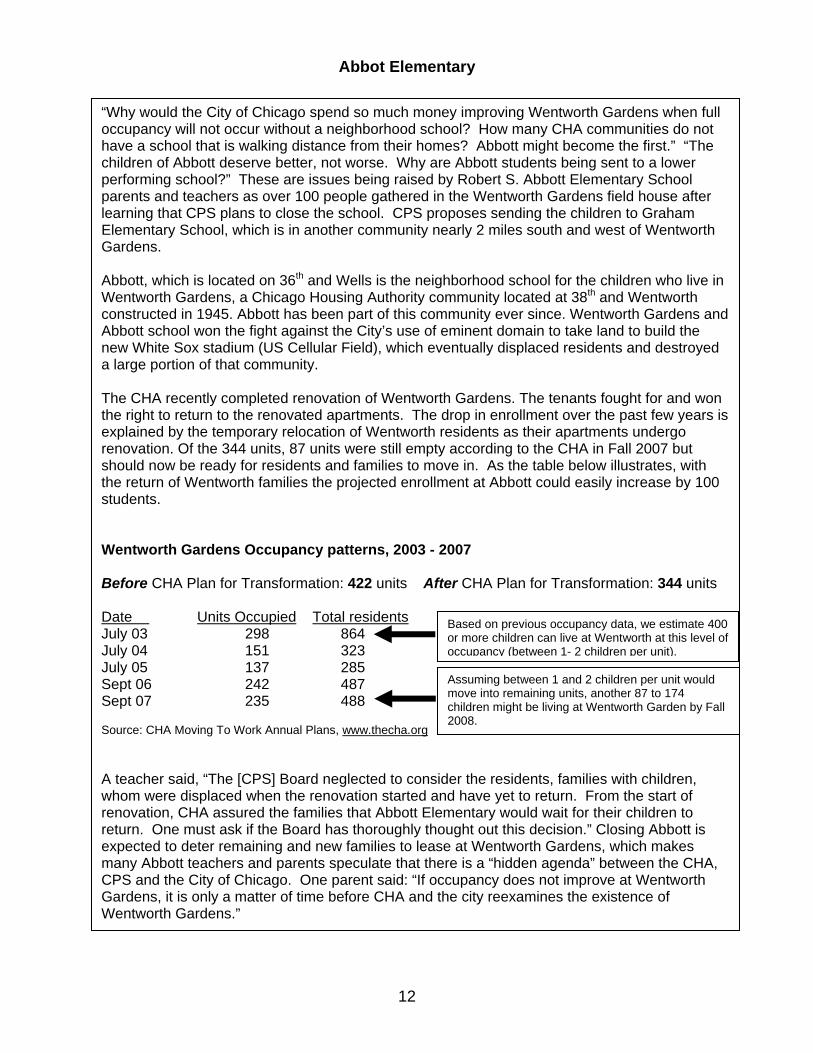
“Why would the City of Chicago spend so much money improving Wentworth Gardens when full occupancy will not occur without a neighborhood school? How many CHA communities do not have a school that is walking distance from their homes? Abbott might become the first.” “The children of Abbott deserve better, not worse. Why are Abbott students being sent to a lower performing school?” These are issues being raised by Robert S. Abbott Elementary School parents and teachers as over 100 people gathered in the Wentworth Gardens field house after learning that CPS plans to close the school. CPS proposes sending the children to Graham Elementary School, which is in another community nearly 2 miles south and west of Wentworth Gardens. Abbott, which is located on 36th and Wells is the neighborhood school for the children who live in Wentworth Gardens, a Chicago Housing Authority community located at 38th and Wentworth constructed in 1945. Abbott has been part of this community ever since. Wentworth Gardens and Abbott school won the fight against the City’s use of eminent domain to take land to build the new White Sox stadium (US Cellular Field), which eventually displaced residents and destroyed a large portion of that community. The CHA recently completed renovation of Wentworth Gardens. The tenants fought for and won the right to return to the renovated apartments. The drop in enrollment over the past few years is explained by the temporary relocation of Wentworth residents as their apartments undergo renovation. Of the 344 units, 87 units were still empty according to the CHA in Fall 2007 but should now be ready for residents and families to move in. As the table below illustrates, with the return of Wentworth families the projected enrollment at Abbott could easily increase by 100 students. Wentworth Gardens Occupancy patterns, 2003 - 2007 Before CHA Plan for Transformation: 422 units After CHA Plan for Transformation: 344 units Date Units Occupied Total residents July 03 298 864 July 04 151 323 July 05 137 285
Based on previous occupancy data, we estimate 400 or more children can live at Wentworth at this level of occupancy (between 1- 2 children per unit).
Sept 06 242 487 Sept 07 235 488 Source: CHA Moving To Work Annual Plans, www.thecha.org
Assuming between 1 and 2 children per unit would move into remaining units, another 87 to 174 children might be living at Wentworth Garden by Fall 2008.
A teacher said, “The [CPS] Board neglected to consider the residents, families with children, whom were displaced when the renovation started and have yet to return. From the start of renovation, CHA assured the families that Abbott Elementary would wait for their children to return. One must ask if the Board has thoroughly thought out this decision.” Closing Abbott is expected to deter remaining and new families to lease at Wentworth Gardens, which makes many Abbott teachers and parents speculate that there is a “hidden agenda” between the CHA, CPS and the City of Chicago. One parent said: “If occupancy does not improve at Wentworth Gardens, it is only a matter of time before CHA and the city reexamines the existence of Wentworth Gardens.”
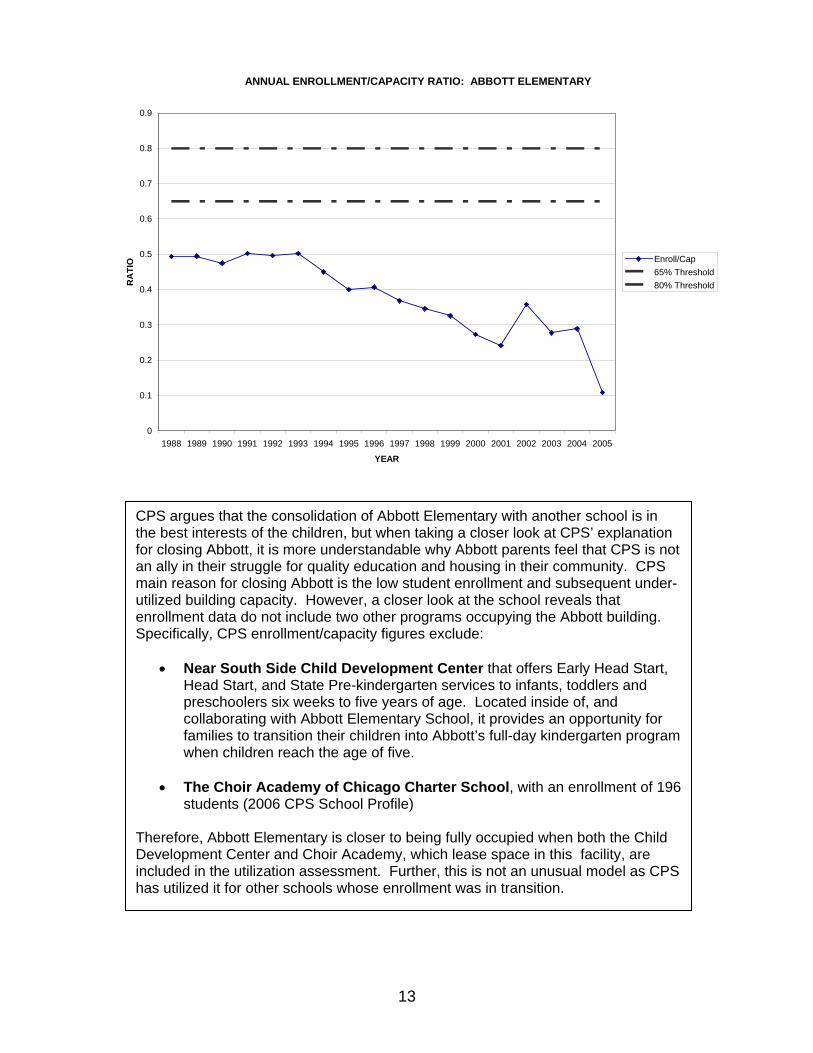
CPS argues that the consolidation of Abbott Elementary with another school is in the best interests of the children, but when taking a closer look at CPS’ explanation for closing Abbott, it is more understandable why Abbott parents feel that CPS is not an ally in their struggle for quality education and housing in their community. CPS main reason for closing Abbott is the low student enrollment and subsequent under-utilized building capacity. However, a closer look at the school reveals that enrollment data do not include two other programs occupying the Abbott building. Specifically, CPS enrollment/capacity figures exclude:
• Near South Side Child Development Center that offers Early Head Start, Head Start, and State Pre-kindergarten services to infants, toddlers and preschoolers six weeks to five years of age. Located inside of, and collaborating with Abbott Elementary School, it provides an opportunity for families to transition their children into Abbott’s full-day kindergarten program when children reach the age of five.
• The Choir Academy of Chicago Charter School, with an enrollment of 196
students (2006 CPS School Profile) Therefore, Abbott Elementary is closer to being fully occupied when both the Child Development Center and Choir Academy, which lease space in this facility, are included in the utilization assessment. Further, this is not an unusual model as CPS has utilized it for other schools whose enrollment was in transition.
13
To consider: If CPS consolidates Abbott with Graham Elementary School, then Abbott students will be forced to travel almost two miles into a different neighborhood. A teacher warned that “Although two miles seems a small price for the greater good, the Board will be subjecting children to unnecessary dangers and influences.” Students will be transported by bus, but since CPS does not transport kindergarten students, kindergarteners and siblings in other grades most likely will be unable to attend the same school. The transportation situation may also affect educational opportunities for Abbott students since many may not be able to participate in After School Programs. Most important, parents are particularly concerned about the safety issues involved in consolidation with Graham. They ask: What is going to happen when a student misses the bus? Students will either not go to school or have to walk. Both of these options are safety concerns as students may be left unsupervised, or choose to walk the two miles to school. A community resident noted at a recent town hall meeting, “I remember a time when we [African Americans] could not cross the viaduct on 35th Street.” In fact, there are reports that some African American students faced racial slurs when Hendricks students were transported to Graham after CPS closed Hendricks. Moreover, Abbott children would have to walk through different gang territories to reach school. Safety has been a problem with previous school closings and transfer of students, e.g., serious incidents involving student safety when Austin High School students were transferred to Clemente High School. These safety issues are another reason parents argue that Wentworth Gardens needs a neighborhood school. Although Abbott is currently under-enrolled, its facility is not underutilized. Two other educational programs occupy the space, and projected enrollments will increase as Wentworth Gardens tenants return to rehabbed buildings – providing they have a neighborhood school to attend. The case of Abbott demonstrates that schools are community institutions, crucial to the life of a community. To close such a school undermines housing and stable community life. Closing Abbott would destabilize the community. When making determinations about closing schools, CPS must take into account not only enrollment but the impact on the community as a whole. Abbott illustrates why a school-community based qualitative assessment of educationally appropriate enrollment is necessary to determine what is in the overall best interest of children and communities.
14
NEIGHBORHOOD CONDITIONS As the case studies suggest, neighborhood conditions may be affecting the attendance at some of the underutilized schools. With rapidly rising housing prices in the late 1990s continuing through 2006, many communities saw double-digit increases annually in the median sales prices of homes. Whether attributed to speculation, gentrification, or simply higher demand for certain neighborhoods, the changes in the housing prices in many Chicago communities is striking, and as a result, many families are feeling the effects. Currently, an estimated 53% of renters and 51% of owners are “burdened” – paying more 30 percent of their income for housing costs (includes utilities and for owners, insurance and taxes). In part, this is because for many families, income has not increased at the same rate as housing costs. For some, though, it may be by choice in order to live close to good schools and other important amenities like transportation and shopping. The following maps help to illustrate the tension between rising housing costs and income in many communities that may be affecting school utilization now but also is likely to in the near future.
15
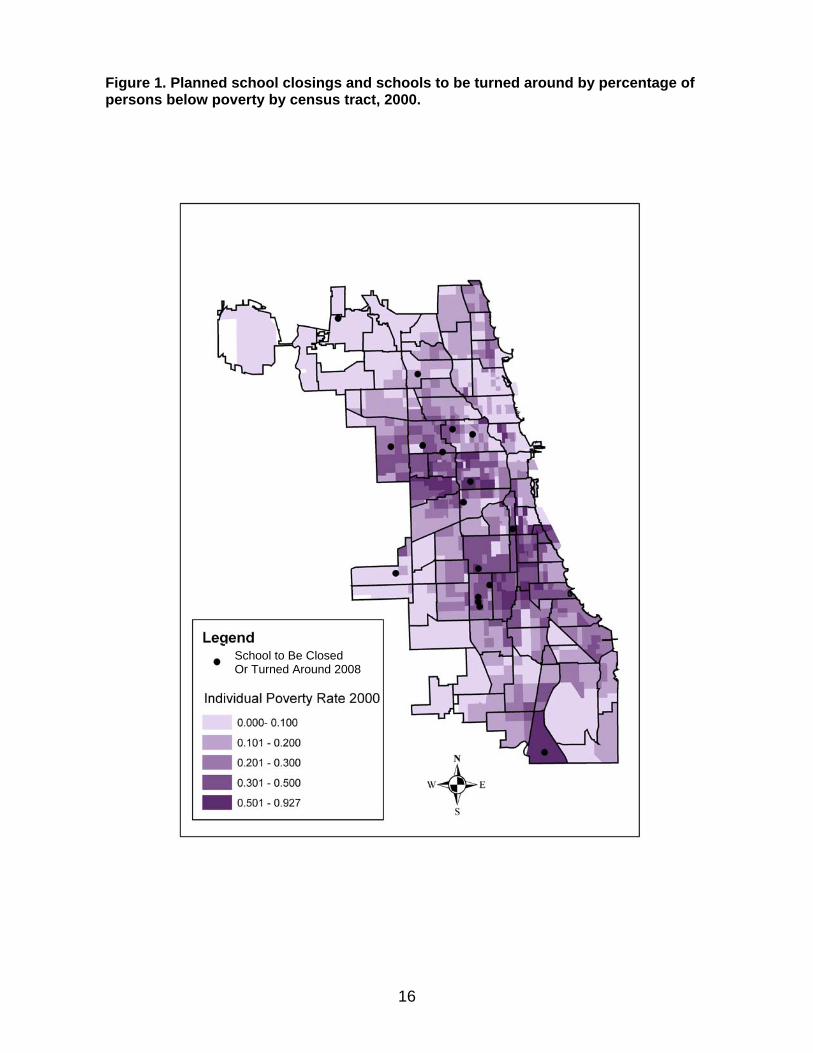
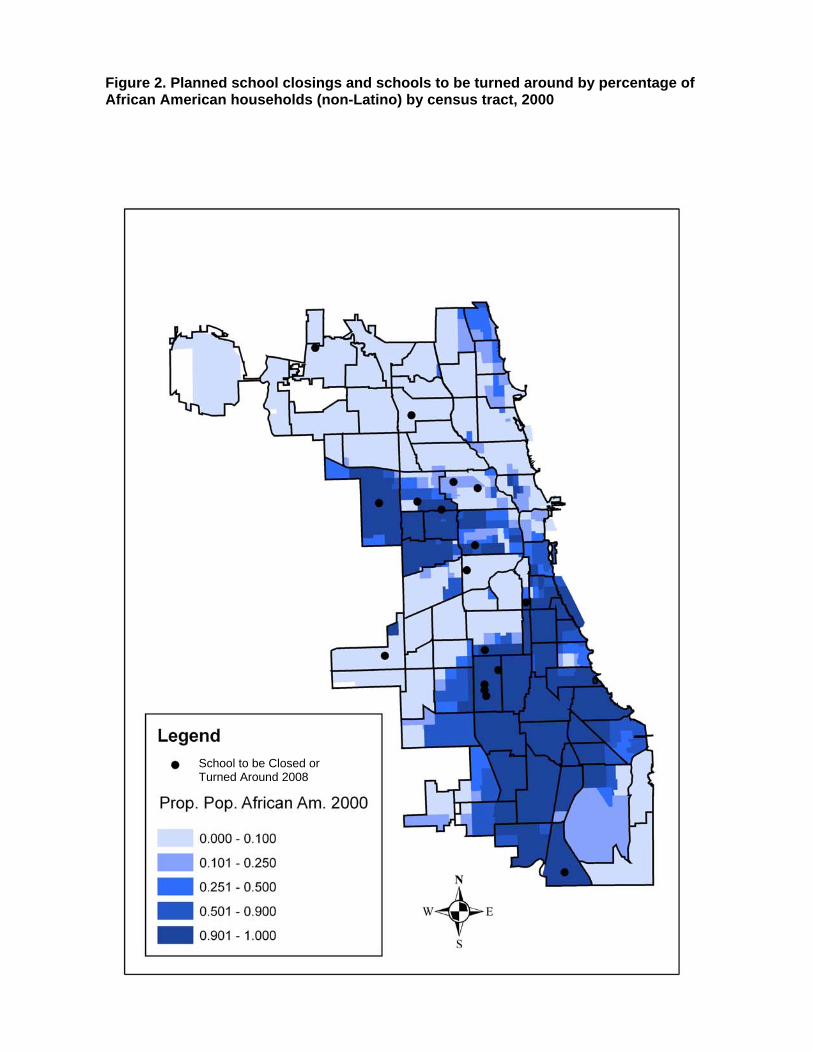
As Figures 1, 2 and 3 show many of the schools to be closed or turned around are in areas that have higher than average poverty rates and a majority of residents either African American or Latino. Even in cases where the schools are located in majority white non-Latino communities, the student population has a significantly higher proportion of students of color than the attendance area or surrounding neighborhood. (See Appendix for demographic profile of closing schools vs. attendance area or neighborhood.)
Overwhelmingly, the students affected by school closings are African American or Latino. The 2000 US Census provides the most current data available on socio-demographic composition (income, poverty, race, ethnicity) of neighborhoods. However, in some neighborhoods there have been dramatic increases in housing prices since 2000, resulting in significant demographic changes. In other communities with changing house values, many residents are still low-income people of color, i.e., Humboldt Park, but if housing trends continue, they will not be able to stay in these communities. As Figures 4 and 5 illustrate, many communities have experienced double-digit increases in the median sales prices, and many have homes selling at prices will above the city median price, with in 2007 was about $254,000.7 These median home sales price increases are presented in Table 2. These maps (Figs. 4 and 5) show how the planned school closings are disproportionately in areas experiencing large changes in house prices. They are in areas that have experienced, are experiencing, or are adjacent to areas with large changes in median house price, which suggests there may be a correlation between school closings and gentrification.
7 “Chicago home sales plummet, prices gain in 2007” Chicago Sun Times, January 24, 2008.
Table 2. Change in median home sales prices in communities with CPS schools affected by plan
Median Sales Price
10/31/07
% Change 2002-2004
% Change 2004-2006
% Change 2002-2006
10 Norwood Park $340,000 18.9% 16.0% 35.6%16 Irving Park $297,000 11.9% 8.5% 20.0%25 Austin $240,000 13.5% 37.4% 53.9%23 Humboldt Park $264,000 31.6% 24.9% 60.1%24 West Town $395,000 9.5% 8.8% 18.0%28 Near West Side $334,500 13.8% -3.0% 9.0%31 Lower West Side (Pilsen) $278,000 -9.7% 25.3% 14.5%34 Armour Square $276,000 68.9% -18.2% 32.2%61 New City $231,500 16.% 40.8% 61.0%56 Garfield Ridge $256,000 27.4% 14.3% 42.3%67 West Englewood $161,000 23.2% 9.0% 31.6%CHICAGO $254,000 22.1% 13.9% 36.0%
Figure 1. Planned school closings and schools to be turned around by percentage of persons below poverty by census tract, 2000.
School to Be Closed Or Turned Around 2008
16
Figure 2. Planned school closings and schools to be turned around by percentage of African American households (non-Latino) by census tract, 2000
17
School to be Closed or Turned Around 2008
Figure 3. Planned school closings and schools to be turned around by percentage of Latino households (all races) by census tract, 2000
18
School to Be Closed or Turned Around 2008
19
Figure 4. Percent change in Median Home Sales Price, 2002-2004, with proposed schools to close 10 16 25 23 Median Sales Price 10/31/07 24 10 Norwood Park $340,000 16 Irving Park $297,000 28 25 Austin $240,000 23 Humboldt Park $264,000 24 West Town $395,000.00 31 34 28 Near West Side $334,500 31 Lower West Side (Pilsen) $278,000 34 Armour Square $276,000 61 New City $231,500 61 56 Garfield Ridge $256,000 67 West Englewood $161,000 56 54 Riverdale $110,750 67
54 Source: Chicago Tribune
20
Figure 5. Percent change in Median Home Sales Price, 2004-2006 with proposed schools to close Source: Chicago Tribune
10
16
25 23 24 Median Sales Price 10/31/07 10 Norwood Park $340,000 16 Irving Park $297,000 28 25 Austin $240,000 23 Humboldt Park $264,000 31 34 24 West Town $395,000.00 28 Near West Side $334,500 31 Lower West Side (Pilsen) $278,000 34 Armour Square $276,000 61 New City $231,500 61 56 Garfield Ridge $256,000 56 67 West Englewood $161,000 67 54 Riverdale $110,750 54
21
COMPARISON WITH ENROLLMENTS IN AUTONOMOUS MANAGEMENT PERFORMANCE (AMPS) SCHOOLS Another way to look at the use of underutilization as a criterion to close schools is to consider how CPS deals with under-utilization in other schools – ones that have some level of autonomy, but also have similar utilization “problems” such as the Autonomous Management and Performance Schools (AMPS). AMPS schools may be considered some of the “best” schools in the CPS system. Created in 2005, “the purpose of AMPS is to recognize and reward high performing and rapidly improving schools by letting them implement any of the following six autonomies: budget autonomy, self-directed operations/maintenance, calendar changes, freedom from the district’s new teacher induction program, freedom from the district’s area structure and freedom from one of the district’s benchmark assessments,” (CPS Press Release, March 26, 2007). AMPS selection criteria are based in large part on state testing results. In 2005-06, CPS designated 90 schools as AMPS, and in 2006-07 18 additional schools were so recognized. One AMPS school, Edison Regional Gifted Center, is scheduled to be relocated. Analyzing enrollment and capacity ratios for the 96 AMPS schools with design
capacity information in NCBG’s database reveals that AMPS schools are fairly evenly distributed across the four categories of capacity/enrolment that CPS uses: overcrowded, 80-100% enrollment/capacity ratio (29); severely overcrowded, more than 100% enrollment/capacity ratio (17); ideal (26); and underutilized, enrollment/capacity ratio below 65% (24). What is relevant to this report is that in 2005 there were at least 24 AMPS schools that fell into the underutilized category (Table 3). This raises questions about the criteria CPS is using to close schools for underutilization. Note: a document distributed at the Jan. 23, 2008 Board of Education meeting, titled “Elementary School Space Utilization Report School Year 2007-2008,” defined thresholds for overcrowding at 80% of design capacity or higher, efficient utilization at 50% to 80% of design capacity, and underutilization at less than 50%. However, this report does not appear on the CPS website as of 2-18-08 and we are unable to authenticate it. Even if the threshold of underutilization were dropped to 50%, 6 AMPS schools could have been considered underutilized in 2005.
22
Table 3. “Underutilized” AMPS Schools based on Enrollment/Capacity Ratio Below 65%
Enrollment / Capacity 2005 (a)
CPS # School Name Address
Design Capacity
Utilization based on enrollment
2110 Audubon 3500 N. Hoyne Ave. 705 63% 2270 Bell 3730 N. Oakley Ave. 1,325 63% 7860 Black Magnet 9101 S. Euclid Ave. 495 58% 2700 Carver Primary 901 E. 133rd Pl. 1,020 38% 2720 Cassell 11314 S. Spaulding Ave. 490 64% 2960 Darwin 3116 West Belden Ave. 1,460 60% 3560 Goethe 2236 N. Rockwell St. 1,085 62% 3680 Grimes 5450 W. 64th Pl 420 45% 3830 Hawthorne 3319 N. Clifton Ave. 890 62% 4330 Kinzie 5625 S. Mobile Ave. 1,370 49% 7240 Lenart 8445 S. Kolin Ave. 590 49% 4700 Mayo 249 E. 37th St. 1,000 53% 4840 Mitchell 2233 W. Ohio St. 615 41% 5030 Murray 5335 S. Kenwood Ave. 740 53% 5080 Newberry 700 W. Willow St. 915 63% 5220 Otis 525 N. Armour St. 1,050 56% 5400 Pershing Magnet 3113 S. Rhodes Ave. 385 58% 5460 Poe Classical 10538 S. Langley Ave. 510 33% 5560 Ray 5631 S. Kimbark Ave. 1,215 56% 5630 Rogers 7345 N. Washtenaw Ave. 955 62% 7790 Sabin Magnet 2216 W. Hirsch St. 885 62% 5720 Sayre 1850 N. Newland Ave. 900 57% 5980 Solomon 6206 N. Hamlin Ave. 600 64% 6330 Ward, J. 2701 S. Shields Ave. 900 56%
Source: Neighborhood Capital Budget Group, 2007. a: This is the most current year design capacity available; used the same year for enrollment, which is from CPS. NOTE: NCBG’s database does not include design capacity data for 12 AMPS schools: Ariel, Chicago Academy, Chicago Agricultural Sciences HS, Chicago Military Academy, Curie HS, Jones College Prep, Lane Tech, Lincoln Park, Northside College Prep, Payton HS, Spry Community Links, Young Magnet.
23
COMMUNITY INVOLVEMENT IN LOCAL DECISION-MAKING Another consideration when looking at the choice of schools to close is what role parents and others in the community get to play in the decision making process prior to CPS announcing plans to close, consolidate or turn around a particular school. This is important given the role CPS has played in being a model for community control over the past twenty years with regard to local school councils, and which now is being called into question. On February 8, 2008, representatives of local school councils at South Shore School of Technology, Moses Vines Preparatory Academy and the South Shore School of Entrepreneurship sued Chicago Public Schools, alleging that CPS violated state law by replacing their elected local school councils with advisory groups appointed by the Board of Education.11 LSC representatives allege district officials are barring them from holding local council elections in April, According to the Chicago Tribune, Charles Walker a plaintiff in the case, said "We were disenfranchised." The councils were created in 1988 to give communities control of the public schools, a reform intended to improve education by making
individual schools accountable to parents and taxpayers. The suit can be understood as part of a broader concern about lack of serious consultation with parents, community, and school staff regarding decisions affecting their schools. These concerns have been raised repeatedly at community meetings related to school closings since Renaissance 2010 was announced in 2004. CPS officials have responded publicly by admitting that they “could do a better job.” However, the recent proposal to turn-around, phase out, consolidate, and relocate schools was again announced without adequate opportunity for community discussion and participation. All schools will have their final (and likely only) final hearing within a couple weeks after they were notified their school would be phased out or relocated. Community organizations have consistently proposed that the school closing policy should include at least one year for full community consultation and discussion and opportunity to introduce alternative plans to ensure that decisions are made with full knowledge and in the best interests of children.
Research Team Pauline Lipman studies the relationship of urban education policy, urban development, and the politics of race. Her book, High Stakes Education (2004), uses Chicago as a case study to examine the relationship of education accountability and differential educational opportunity and Chicago’s restructured economy and drive to be a global city. In 2006-2007 she collaborated with the Kenwood Oakland Community Organization to produce a study of the effects of school closings on schools in the Midsouth area. She is currently a UIC Great Cities Scholar studying “Renaissance 2010, Contested Urban Development, and the Politics of Race.”
Janet Smith focuses on equity issues in local housing planning and policy implementation. Recent research includes the transformation of public housing in Chicago and US; housing and health outcomes; expanding housing opportunities for people with disabilities; and implementing community driven strategies to preserve affordable housing. She recently co-edited/authored Where are Poor People to Live? Transforming Public Housing Communities (2006) with Larry Bennett and Patricia Wright. She is co-director of the Nathalie P. Voorhees Center. David Stovall studies the peculiar relationship between Chicago neighborhoods receiving funds for development and the schools that reside in these areas, focusing on what happens as new, high-performing schools are created to replace existing under-performing institutions. His research documents how many low-income – primarily African-American and Latino/a families –are unable to attend because they no longer live in the area. He has also
investigated school curriculum, social justice student activism, and community inclusion in school culture and decision-making. Rachel Weber examines the relationship between TIF and public education finance and frequently provides advice and technical assistance to school boards, parent-teacher associations, concerned residents, and municipalities on this issue. Following a study of the effect of TIF on school district revenues in Cook County, she recently completed a report for the Illinois Department of Revenue that looked at the impact of TIF on school district property tax revenues, tax rates, and state aid for 786 school districts in Illinois. She has published assessments of TIF’s impact on industrial and residential property values in Chicago in Urban Studies and Regional Science and Urban Economics. Andrew Greenlee is a PhD student in Urban Planning and Policy at UIC. His research interests are related to the geography of opportunity and household selection of neighborhood opportunity via migration. Nancy Hudspeth is a PhD candidate in Urban Planning and Policy at UIC. Her research interests are related to the disparate effects of gentrification and neighborhood change upon low-income residents and local businesses. She has worked for five years at the Voorhees Neighborhood Center, providing technical assistance and data analysis to community organizations. Danielle Akua Smith is a second year PhD student Urban Planning and Policy at UIC.
25
Appendix
ANNUAL ENROLLMENT / CAPACITY RATIO FOR CLOSING SCHOOLS