26
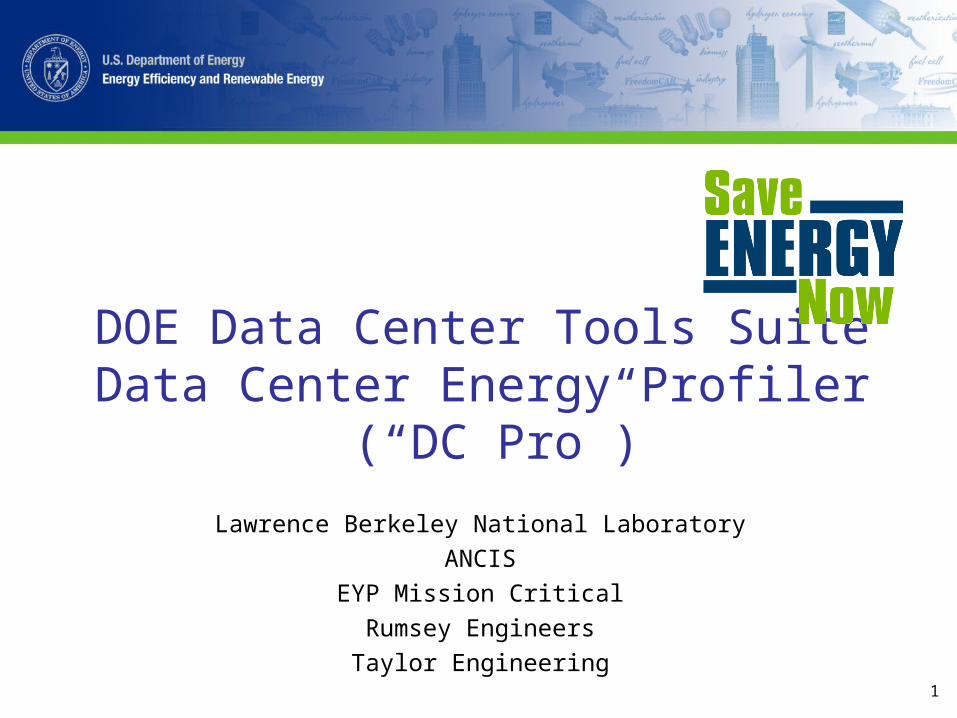
1 DOE Data Center Tools Suite Data Center Energy Profiler (“DC Pro”) Lawrence Berkeley National Laboratory ANCIS EYP Mission Critical Rumsey Engineers Taylor Engineering
| Date post: | 14-Apr-2017 |
| Category: |
Technology |
| Upload: | datacenters |
| View: | 329 times |
| Download: | 6 times |
1
DOE Data Center Tools SuiteData Center Energy Profiler
(“DC Pro”)Lawrence Berkeley National Laboratory
ANCISEYP Mission CriticalRumsey EngineersTaylor Engineering
2
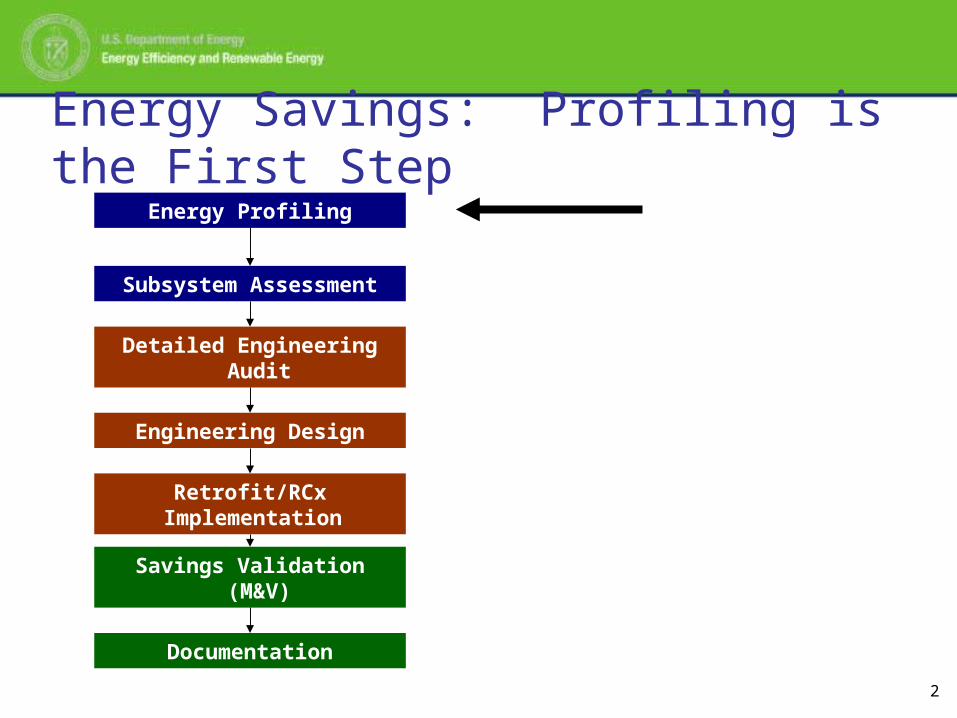
Energy Savings: Profiling is the First StepEnergy Profiling
Subsystem Assessment
Detailed Engineering Audit
Engineering Design
Savings Validation (M&V)
Retrofit/RCx Implementation
Documentation

3
Data Center Profiling Tool Objectives
Tentative• Estimate the efficiency of the IT equipment
(calculations/Watt). Not simple.Firm• Make an initial estimate of the overall efficiency of the
data center support systems (the DCIE metric).• Create initial, estimated energy use breakouts for the
major data center systems.• Provide a list of applicable energy-saving Actions.

4
Springboard:
Quick Plant Energy Profiler, or “Quick PEP”Version 1.1.3, Feb 21, 2007http://www1.eere.energy.gov/industry/quickpep/default.aspx
Suggested name for new tool:Data Center Energy Profiler, or “DC Pro”
5
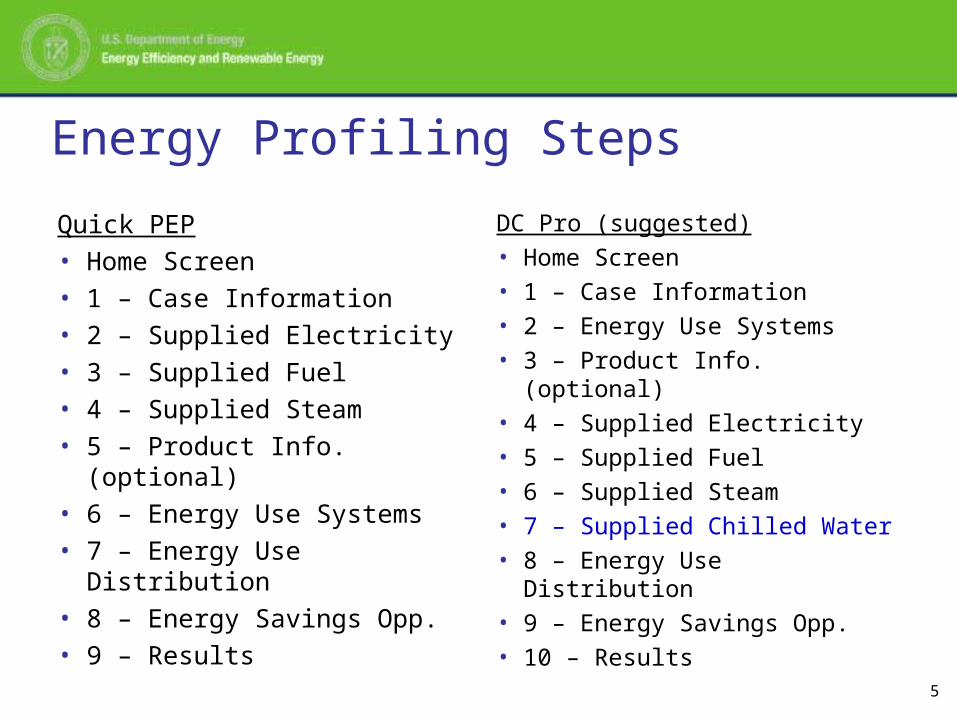
Energy Profiling Steps
Quick PEP• Home Screen• 1 – Case Information• 2 – Supplied Electricity• 3 – Supplied Fuel• 4 – Supplied Steam• 5 – Product Info. (optional)• 6 – Energy Use Systems• 7 – Energy Use Distribution• 8 – Energy Savings Opp.• 9 – Results
DC Pro (suggested)• Home Screen• 1 – Case Information• 2 – Energy Use Systems• 3 – Product Info. (optional)• 4 – Supplied Electricity• 5 – Supplied Fuel• 6 – Supplied Steam• 7 – Supplied Chilled Water• 8 – Energy Use Distribution• 9 – Energy Savings Opp.• 10 – Results
6
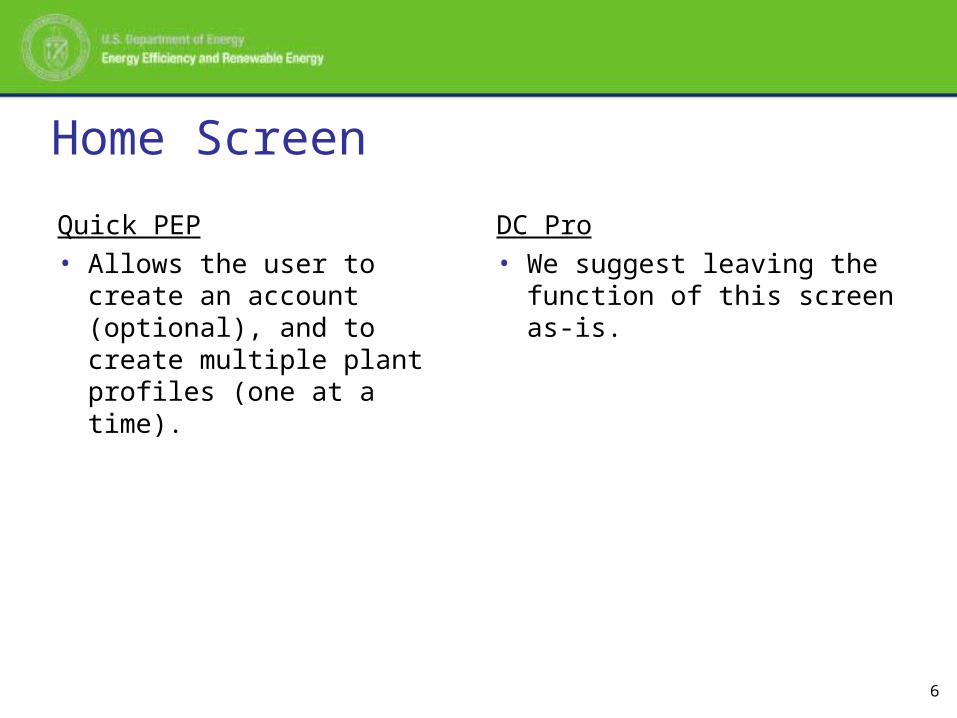
Home Screen
Quick PEP• Allows the user to create an
account (optional), and to create multiple plant profiles (one at a time).
DC Pro• We suggest leaving the
function of this screen as-is.

7
Step 1 – Case Information
Quick PEP asks for:• Case Name• Industry• Contact Name• Contact Email• Contact Address
DC Pro (suggested)• Ask for the same, plus:• Climate Zone• Floor Area, Non-Data Center• Floor Area, Data Center• Data Center Tier (Uptime def.)• DC Current Build-Out (%)

8
Step 2 - Energy Use Systems
Quick PEP• Contains many systems that do
not apply to data centers
DC Pro (suggested new list of major systems)
• Data Center Loads• Controls• Electric Distribution• Air-Side• Data Center Cooling• Chilled Water Plant
9
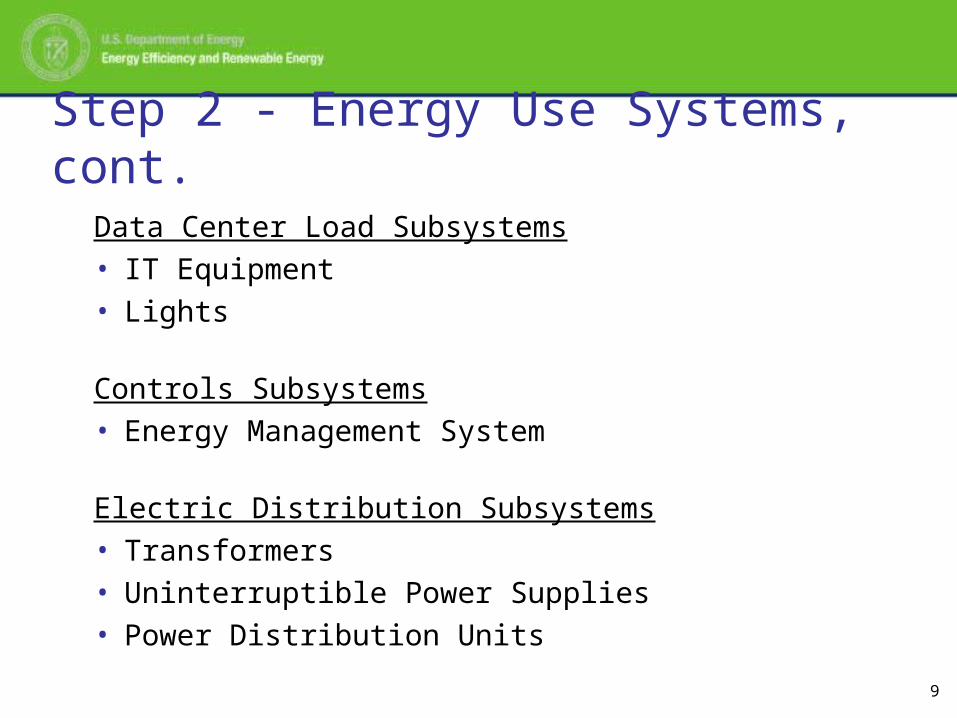
Step 2 - Energy Use Systems, cont.
Data Center Load Subsystems• IT Equipment• Lights
Controls Subsystems• Energy Management System
Electric Distribution Subsystems• Transformers• Uninterruptible Power Supplies• Power Distribution Units
10
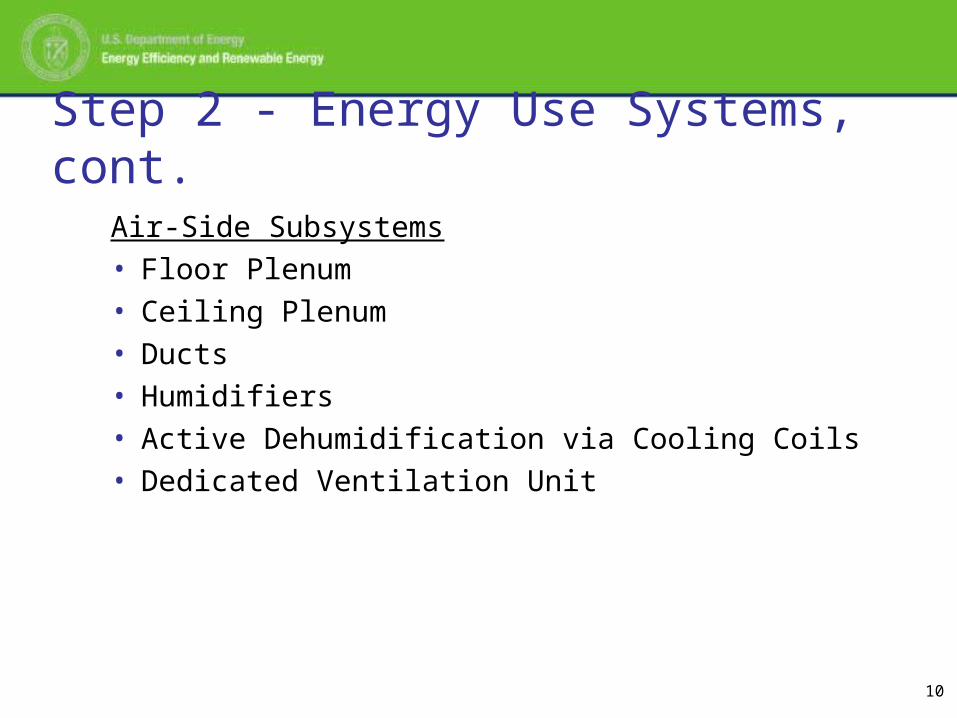
Step 2 - Energy Use Systems, cont.
Air-Side Subsystems• Floor Plenum• Ceiling Plenum• Ducts• Humidifiers• Active Dehumidification via Cooling Coils• Dedicated Ventilation Unit

11
Step 2 - Energy Use Systems, cont.
Data Center Cooling Subsystems• DX CRACs, Air-Cooled Condenser• DX CRACs, Water-Cooled Condenser, Served by Dry Cooler• DX CRACs, Water-Cooled Condenser, Served by Cooling Tower• DX Package Unit(s), Air-Cooled Condenser• DX Package Unit(s), Evaporatively-Cooled Condenser• CHW CRAH• CHW AHU• Air-Side Economizer• Rack-Mounted CHW Coils• Rack-Mounted Hybrid CHW/Refrigerant Cooling (eg, Liebert XDV)
12
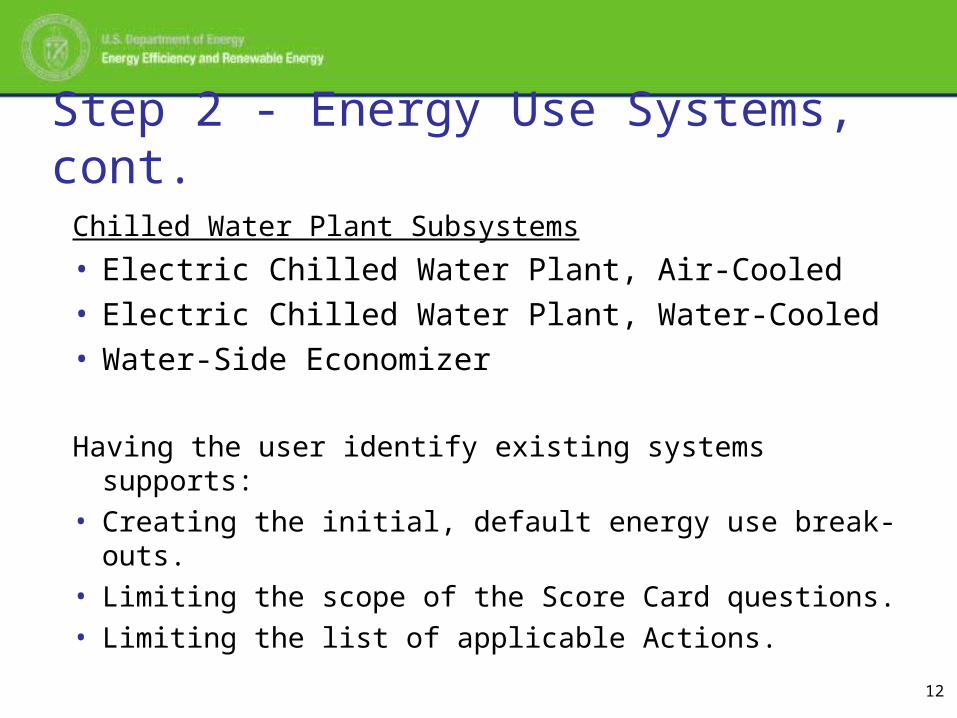
Step 2 - Energy Use Systems, cont.
Chilled Water Plant Subsystems• Electric Chilled Water Plant, Air-Cooled• Electric Chilled Water Plant, Water-Cooled• Water-Side Economizer
Having the user identify existing systems supports:• Creating the initial, default energy use break-outs.• Limiting the scope of the Score Card questions.• Limiting the list of applicable Actions.

13
Step 3 - Product Information (Optional)
Quick PEP• Flexible screen allows user to
quantify one additional parameter (e.g., product, employees, sales), and receive energy-per-X results.
DC Pro• The concept is fine, but there is
ongoing debate about how to quantify what data centers produce.

14
Supplied Energy “Streams”
• Step 4 – Supplied Electricity• Step 5 – Supplied Fuel• Step 6 – Supplied Steam• Step 7 – Supplied Chilled Water
Quick PEP does not provide any results unless at least one energy stream is quantified. We suggest that this same approach be retained for DC Pro, and furthermore suggest that there must be at least one electric stream.
15
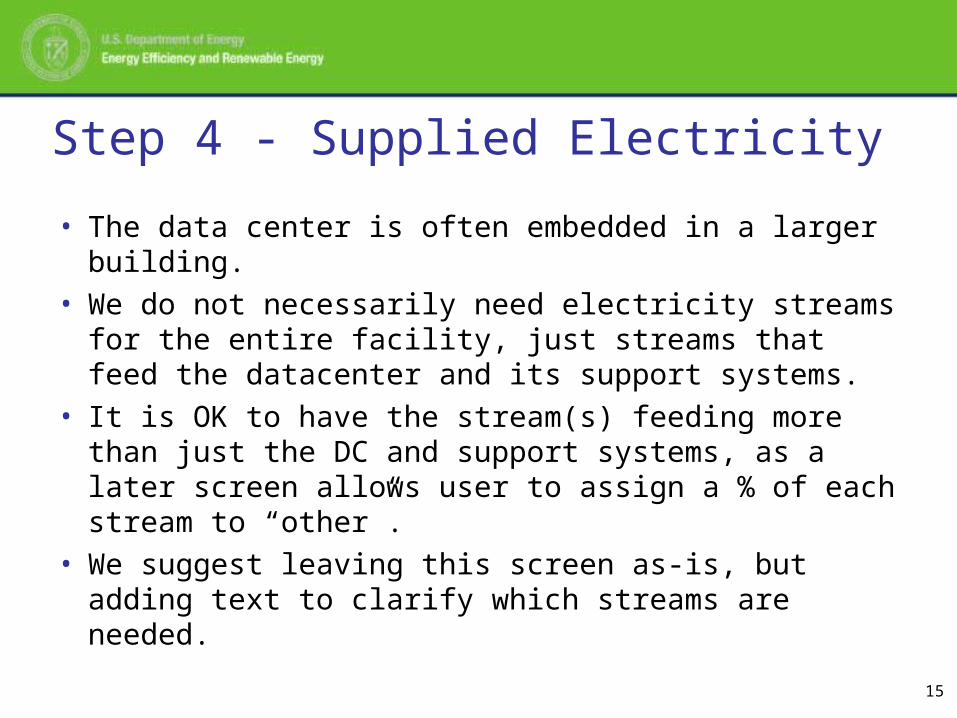
Step 4 - Supplied Electricity
• The data center is often embedded in a larger building.• We do not necessarily need electricity streams for the entire
facility, just streams that feed the datacenter and its support systems.
• It is OK to have the stream(s) feeding more than just the DC and support systems, as a later screen allows user to assign a % of each stream to “other”.
• We suggest leaving this screen as-is, but adding text to clarify which streams are needed.

16
Step 5 - Supplied Fuel
• We suggest leaving this screen as-is. Humidifiers may use fuel other than electricity.

17
Step 6 - Supplied Steam
• We suggest leaving this screen as-is. Humidification system may use purchased steam.
18
Step 7 - Supplied Chilled Water
• This is a suggested new screen. Some data center facilities purchase chilled water from a third party.
• This screen would be similar to the Supplied Fuel screen, but would ask for chilled water usage rates and costs.

19
Step 8 - Energy Use Distribution
• The new screen would be similar to the existing screen, but would add a tab for chilled water if the Supplied Chilled Water concept is adopted.

20
Step 9 - Energy Savings Opportunities
We suggest keeping same structure for this screen. The “Score Cards” will be new, with questions appropriate to the suggested data center systems:
• Data Center Loads• Controls• Electric Distribution• Air Side• Data Center Cooling• Chilled Water Plant

21
Step 9 - Energy Savings Opportunities
Example Score Card Questions (for Electric Distribution System):• Transformer Efficiency?• Number of UPS Modules?• UPS Module Capacity?• Average UPS Load Factor?• etc
The answers to the Score Card question will support:• Refining the energy use breakouts (at the major system level only).• Further limit the list of applicable Actions.

22
Step 10 - Results
Quick PEP• Case Information• Annual Energy Purchases• Annual Energy Consumption• Potential Annual Energy
Savings• Suggested Next Steps
DC Pro• Case Information• Data Center Infrastructure
Efficiency (DCIE)• Annual Energy Purchases• Annual Energy Consumption• Potential Annual Energy
Savings• Suggested Next Steps

23
Step 10 – Results, cont.
Preliminary Assessment of Opportunity
0%
10%
20%
30%
40%
50%
0.0 0.1 0.2 0.3 0.4 0.5 0.6 0.7 0.8 0.9 1.0
DCIE (Higher is Better)
% o
f Dat
acen
ters
% of DCs
You Are Here
You Could Be Here

24
Step 10 – Results, cont.
Example List of Actions (for Electric Distribution System)• Shut Down UPS Modules When Redundancy Level is High Enough• Use High Efficiency MV and LV Transformers• Reduce the Number of Transformers Upstream and Downstream of
the UPS• Locate Transformers Outside the Datacenter• Use 480 V instead of 208 V Static Switches (STS)• Specify High Efficiency Power Supplies• Eliminate Redundant Power Supplies• Supply DC Voltage to IT Rack• etc
25
We need your input!
Purpose of today’s Profiling Tool workshop:
• Are the inputs reasonable?• Are the outputs appropriate and adequate?

26
Thank You!
See you at the Profiling Tool Workshop Session.


![A wind profiler trajectory tool for air quality transport ... · on the basis of comparison with balloon soundings [Martner et al., 1993]. The accuracy of profiler vertical-velocity](https://static.documents.pub/doc/80x56/5fb9608e67c4f77b9f79c7a5/a-wind-profiler-trajectory-tool-for-air-quality-transport-on-the-basis-of-comparison.jpg)


