Page 1
Slide 3.1
Barrow, Statistics for Economics, Accounting and Business Studies, 5th edition © Pearson Education Limited 2009
Chapter 9: Data collection and
sampling methods
• Data collection
primary data (collect the data yourself)
secondary data (use data collected by others)
• Examine secondary sources first
paper sources
electronic sources (becoming much more
prevalent)
Page 2
Slide 3.2
Barrow, Statistics for Economics, Accounting and Business Studies, 5th edition © Pearson Education Limited 2009
Secondary data sources
• Most common way to obtain and use data
• No control over methods of collection, etc.
• May have to compromise on the research
questions that can be answered with the data
• Need to be aware of traps in using such
data…
Page 3
Slide 3.3
Barrow, Statistics for Economics, Accounting and Business Studies, 5th edition © Pearson Education Limited 2009
Make sure you collect the right data!
• Seems obvious, but…
real or nominal data?
covers England, GB or UK?
use wage rate or earnings?
measure wage per hour, per week, per…?
full-time or part-time workers?
• These are just a few examples of issues.
Page 4
Slide 3.4
Barrow, Statistics for Economics, Accounting and Business Studies, 5th edition © Pearson Education Limited 2009
Check definitions of variables
• From the ONS Subnational Population
Projections:
2.3.1. Internal Migration
For subnational population projection purposes this is
defined as migration within England only5.
5 For other uses internal migration will include flows to and from Wales,
Scotland and Northern Ireland, termed cross-border flows. However, the
propensity to migrate model used to project internal migration requires a full
matrix of flows out of and into each LA by single year of age and sex. This
level of detail is not required to project cross border flows and therefore
projections add these flows to other international migration flows.
Page 5
Slide 3.5
Barrow, Statistics for Economics, Accounting and Business Studies, 5th edition © Pearson Education Limited 2009
Try to get up to date figures
• Data series are often revised in the light of
newer and better information
• UK balance of payments 1970, as published
in:
1971 1972 1973 1974 1975 1976 1977 1978 . . . 1986
579 681 692 707 735 733 695 731 . . . 795
Latest estimate is £819m
Page 6
Slide 3.6
Barrow, Statistics for Economics, Accounting and Business Studies, 5th edition © Pearson Education Limited 2009
• Work backwards through publications (i.e.
most recent first) to ensure you have latest
revision of data.
• Economic theory might provide some
guidance, e.g. there is often a preference for
real values rather than nominal
Page 7
Slide 3.7
Barrow, Statistics for Economics, Accounting and Business Studies, 5th edition © Pearson Education Limited 2009
Keep a record of your data sources
• Got a useful table? Need to update it?
• Then you need to know where you found it originally!!
• Keep a record (comments in spreadsheets are
useful).
• Record publication, date, volume, page or table
number.
• Keep URL of electronic data source.
Page 8
Slide 3.8
Barrow, Statistics for Economics, Accounting and Business Studies, 5th edition © Pearson Education Limited 2009
Check your data
• Boring but vital. Garbage in, garbage out.
• Drawing graphs of the data can be a useful
way to spot errors, outliers, etc.
• Correct errors, think about outliers. Are the
latter relevant to your enquiry or just a
nuisance, for example?
Page 9
Slide 3.9
Barrow, Statistics for Economics, Accounting and Business Studies, 5th edition © Pearson Education Limited 2009
Electronic data sources
• Can be an easy, quick and cheap way to collect data.
• Usually easy to find some data but the precise data you need might be more difficult.
• Usually easiest to download in Excel format.
• Data in pdf format is more tricky, but can be ‘cut and pasted’ using the text selection tool
Page 10
Slide 3.10
Barrow, Statistics for Economics, Accounting and Business Studies, 5th edition © Pearson Education Limited 2009
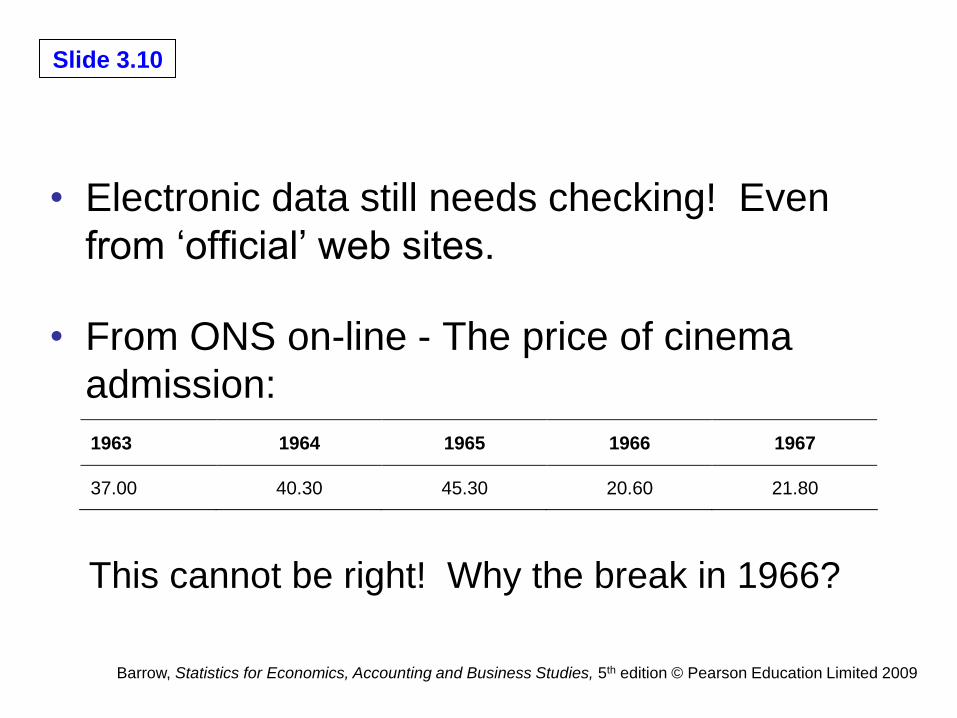
• Electronic data still needs checking! Even
from ‘official’ web sites.
• From ONS on-line - The price of cinema
admission:
1963 1964 1965 1966 1967
37.00 40.30 45.30 20.60 21.80
This cannot be right! Why the break in 1966?
Page 11
Slide 3.11
Barrow, Statistics for Economics, Accounting and Business Studies, 5th edition © Pearson Education Limited 2009
Collecting primary data
• You have control over the questions asked and the sample size (hence confidence intervals of resulting estimates)
• Some form of random sampling important to ensure results are not misleading.
• Random sampling: each member of the population should have an equal or known probability of selection
Page 12
Slide 3.12
Barrow, Statistics for Economics, Accounting and Business Studies, 5th edition © Pearson Education Limited 2009
How not to do a survey
• 1936: Literary Digest tried to predict the up-coming US election by sending out 10 million questionnaires. Got the answer wrong…
• Surveyed its own (well-off) readers
• Used lists of car and telephone owners to sample.
• Magazine went out of business soon after.
Page 13
Slide 3.13
Barrow, Statistics for Economics, Accounting and Business Studies, 5th edition © Pearson Education Limited 2009
Types of random sample
• Simple random sample
• Stratified random sample
• Cluster random sample
• Multi-stage sample
• Quota sample
Page 14
Slide 3.14
Barrow, Statistics for Economics, Accounting and Business Studies, 5th edition © Pearson Education Limited 2009
Simple random sample
• Every possible sample has an equal chance of
occurring.
• E.g. draw sample from names in a hat
• Can be expensive to carry out (e.g. might
have one sample observation from the north
of Scotland, one from Cornwall in the west,
etc.)
Page 15
Slide 3.15
Barrow, Statistics for Economics, Accounting and Business Studies, 5th edition © Pearson Education Limited 2009
Stratified sampling
• Attempts to avoid ‘bad’ (i.e. unrepresentative)
samples.
• E.g. rules out sample with only men. Ensures
representative numbers of men and women.
• Gender is here a stratification factor
• Sample would be 50:50 men and women
Page 16
Slide 3.16
Barrow, Statistics for Economics, Accounting and Business Studies, 5th edition © Pearson Education Limited 2009
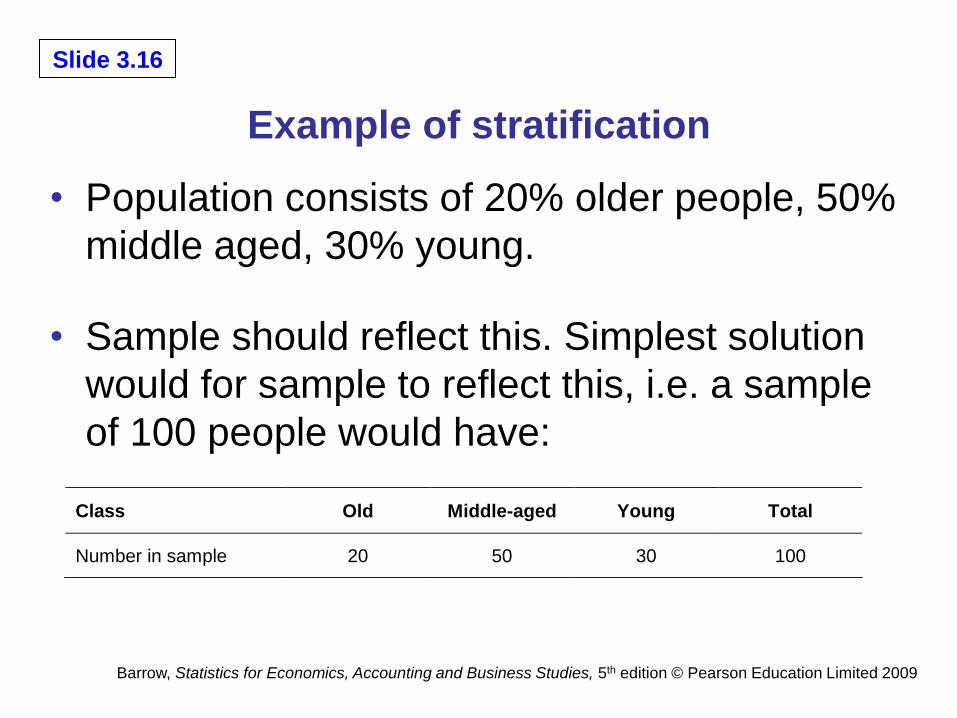
Example of stratification
• Population consists of 20% older people, 50%
middle aged, 30% young.
• Sample should reflect this. Simplest solution
would for sample to reflect this, i.e. a sample
of 100 people would have:
Class Old Middle-aged Young Total
Number in sample 20 50 30 100
Page 17
Slide 3.17
Barrow, Statistics for Economics, Accounting and Business Studies, 5th edition © Pearson Education Limited 2009
• Not essential to have proportional sampling (as above). It is better to:
sample cheaper strata more heavily (increases overall sample size, given your budget)
sample more diverse strata more heavily
• Stratification is most useful when
there are differences between strata
there is little variation within strata.
Page 18
Slide 3.18
Barrow, Statistics for Economics, Accounting and Business Studies, 5th edition © Pearson Education Limited 2009
• Stratification improves the precision of the
estimates, i.e. reduces the sampling variance
of the estimates.
• This results in smaller confidence intervals.
Page 19
Slide 3.19
Barrow, Statistics for Economics, Accounting and Business Studies, 5th edition © Pearson Education Limited 2009
Cluster sampling
• Much cheaper than other methods, hence
allows bigger sample size.
• Cluster methodology intrinsically leads to less
efficient estimates (bigger confidence
intervals, for a given sample size) but the
larger sample size can offset this.
Page 20
Slide 3.20
Barrow, Statistics for Economics, Accounting and Business Studies, 5th edition © Pearson Education Limited 2009
• Population divided into clusters, e.g. regions
of the country
• Only some of the clusters sampled. This
reduces cost, possibly substantially.
• Clustering method benefits most when
clusters are similar to each other
there is plenty of variation within each cluster
(Note contrast with stratification)
Page 21
Slide 3.21
Barrow, Statistics for Economics, Accounting and Business Studies, 5th edition © Pearson Education Limited 2009
Multi-stage sampling
• Combines the other types of sampling, e.g.
Stage 1: cluster sampling of counties (could be
stratified to ensure (e.g.) different regions fairly
represented)
Stage 2: simple random sample of districts
within the selected counties
Stage 3: stratified (e.g. according to age)
sample of individiuals with selected districts.
Page 22
Slide 3.22
Barrow, Statistics for Economics, Accounting and Business Studies, 5th edition © Pearson Education Limited 2009
Quota sampling
• Non-random but extremely cheap
• E.g. sampling passers-by in the street
• Can make some attempts to ensure it is representative, e.g. ensure similar numbers of men and women; appropriate numbers of different age groups, etc.
• Political polling often like this.
Page 23
Slide 3.23
Barrow, Statistics for Economics, Accounting and Business Studies, 5th edition © Pearson Education Limited 2009
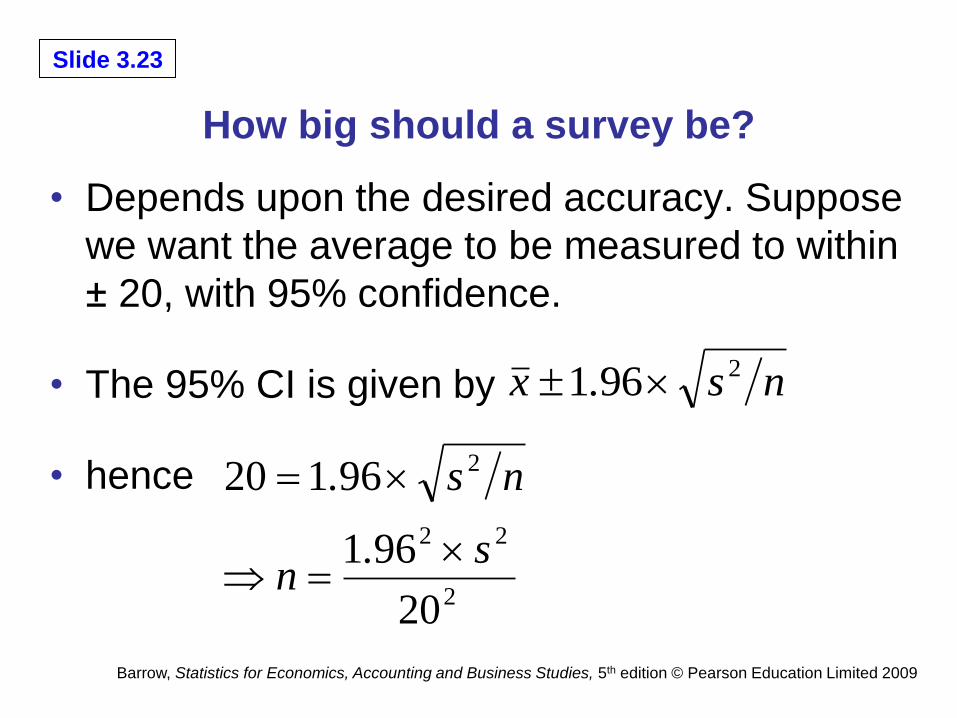
How big should a survey be?
• Depends upon the desired accuracy. Suppose
we want the average to be measured to within
± 20, with 95% confidence.
• The 95% CI is given by
• hence
ns.x 2961
2
22
2
20
961
96120
s.n
ns.
Page 24
Slide 3.24
Barrow, Statistics for Economics, Accounting and Business Studies, 5th edition © Pearson Education Limited 2009
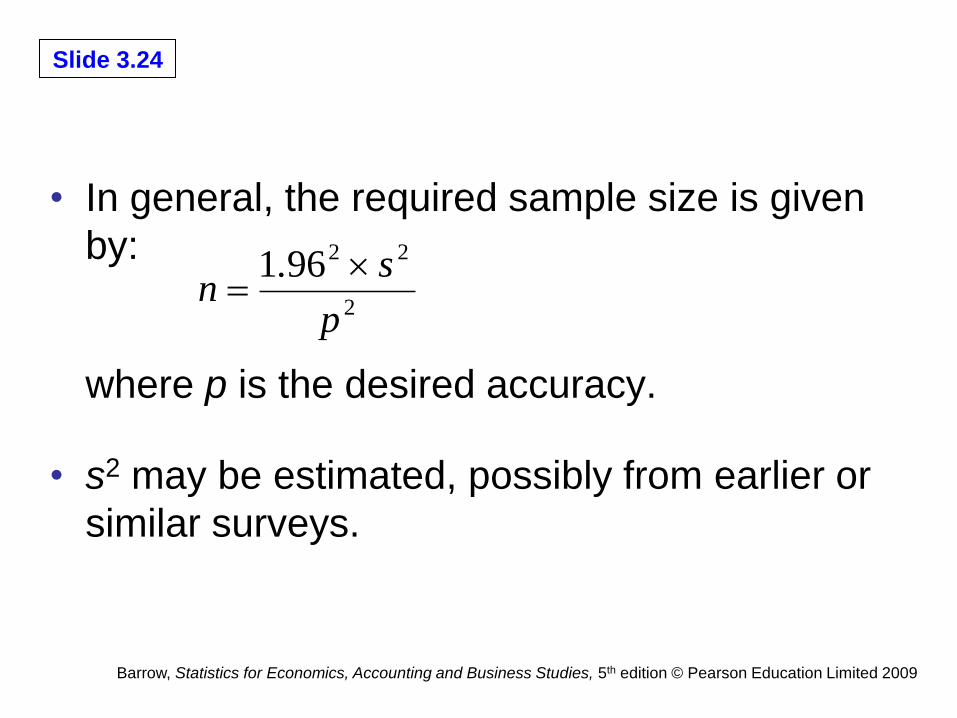
• In general, the required sample size is given
by:
where p is the desired accuracy.
• s2 may be estimated, possibly from earlier or
similar surveys.
2
22961
p
s.n
Page 25
Slide 3.25
Barrow, Statistics for Economics, Accounting and Business Studies, 5th edition © Pearson Education Limited 2009
The sampling frame
• A list from which to choose the sample observations is required. This is called the sampling frame.
• Ideally it should contain the whole population (e.g. the Post Office Address File contains all the addresses in the UK)
• Sampling should be done randomly from this list.
Page 26
Slide 3.26
Barrow, Statistics for Economics, Accounting and Business Studies, 5th edition © Pearson Education Limited 2009
Interview techniques
• Interviewers should not ‘lead’ the subjects towards an answer:
“Do you agree with me that …?” would be a bad way to ask the question
• The ordering of questions might matter:
Do you know how many were killed by the atomic bomb on Hiroshima?
Do you believe in nuclear deterrence?
• Non-response bias is a potential problem.
Page 27
Slide 3.27
Barrow, Statistics for Economics, Accounting and Business Studies, 5th edition © Pearson Education Limited 2009
Example: the Expenditure and Food Survey
• A three stage, rotating, stratified random sample!
• Stage 1:
Country divided into 150 strata (groups of local authorities), stratified by geographic area, urban/rural character, prosperity
Each quarter of the year, one new authority chosen from each stratum. It remains in the sample for one year, then is replaced.
Page 28
Slide 3.28
Barrow, Statistics for Economics, Accounting and Business Studies, 5th edition © Pearson Education Limited 2009
• Stage 2: four ‘wards’ (smaller administrative
areas) in each local authority are selected.
• One ward is used in each of the four quarters.
• Stage 3: 16 addresses chosen at random in
each ward.
Page 29
Slide 3.29
Barrow, Statistics for Economics, Accounting and Business Studies, 5th edition © Pearson Education Limited 2009
• The sampling frame is the Postcode Address
File.
• Some of these are business, rather than
household, addresses so are not used.
• About 60% of households agree to participate
in the survey, giving about 6,500 households
as the sample size.
Page 30
Slide 3.30
Barrow, Statistics for Economics, Accounting and Business Studies, 5th edition © Pearson Education Limited 2009
• Interviewed households keep a diary of all their
expenditures (to avoid a recall bias, where some
items are easily remembered, others not)
• Participants are paid a small sum (around £10) for
participating.
• Confidence intervals are difficult to calculate because
of complicated design. They are wider than with
simple random sampling of the same sample size,
but the design permits a much larger sample.
Page 31
Slide 3.31
Barrow, Statistics for Economics, Accounting and Business Studies, 5th edition © Pearson Education Limited 2009
Summary
• There are a few useful things to remember about
collecting and using data, such as to always,
always check your data.
• There are different types of sample design. There
is a trade-off between accuracy and cost.
• Important factors in collecting data are the
desired accuracy of the results, the sample frame
and the interview techniques.