100
Data Dashboards The Nuts and Bolts of Data Dashboard Development
Data DashboardsThe Nuts and Bolts of Data Dashboard Development

IntroductionAndy HourietFounder and President August Development Corporation● Over 30 years of software design and development● Custom software and technology implementation● Extensive experience with foundation and non-profit
applications

Workshop Objectives● What is a dashboard?● Why do I want a dashboard, what can I do with it?● What should I put on my dashboard?● How do I use my dashboard?● Current dashboards exercise● Designing a dashboard?● Dashboard design exercise● Building a dashboard● Discussion and questions


Dashboards in DetailPart 1 of 673.
What is a Dashboard?● Easy to read view of data, usually graphical● Shows current and historic trends● Simplified view of key performance
indicators
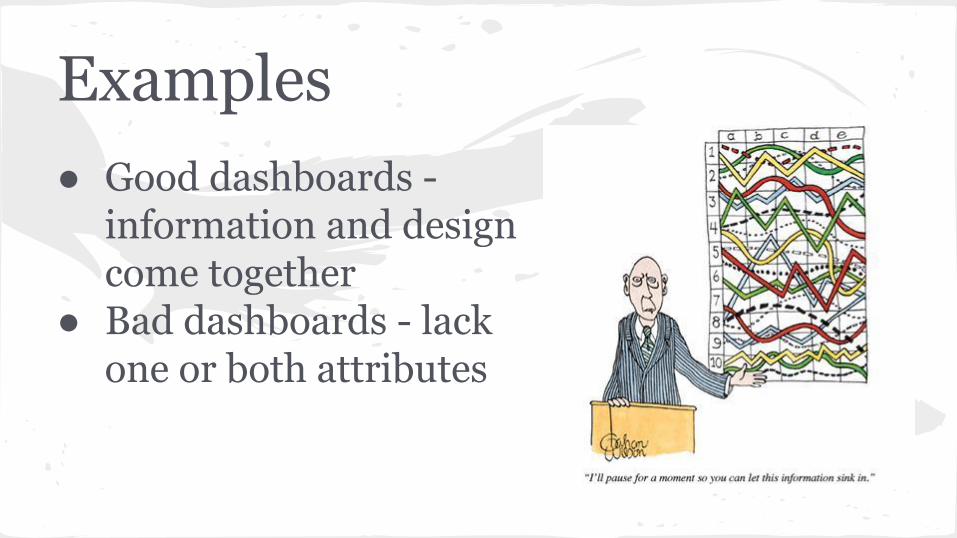
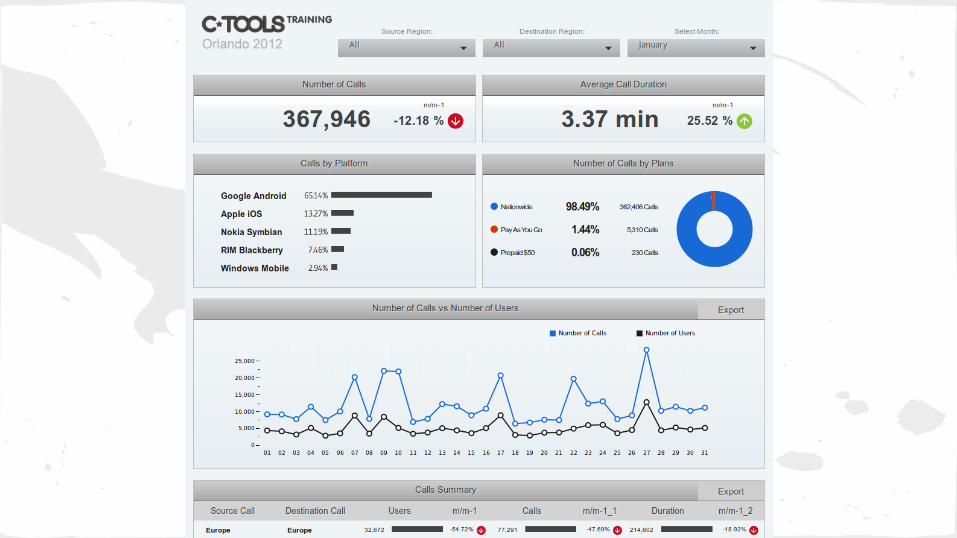
Examples● Good dashboards -
information and design come together
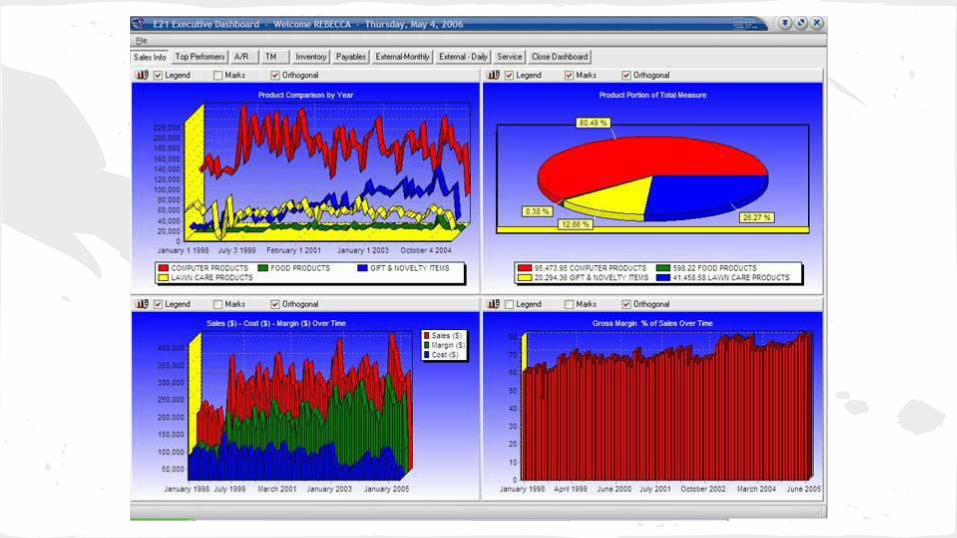
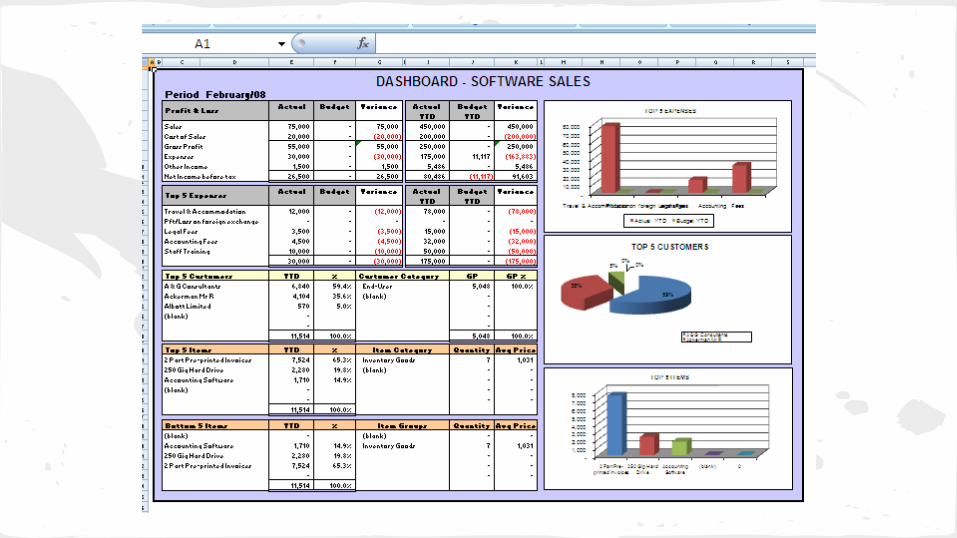
● Bad dashboards - lack one or both attributes


Multiple DashboardsDifferent dashboards for different business areas: ● Finance● Program(s)● Development● HR

Why not Reports?● Reports are useful for details, potentially
time consuming for summary data● An effective alternative to reports

Do you have any dashboards?● SalesForce● Raiser’s Edge● Convio● Google Analytics● Others?
Why do I want a dashboard?
Why do I want a dashboard?● Reliable, accurate view of your strengths and
weaknesses● Quickly identify trouble areas● Share information between departments ● Makes it easy to see other department
strategic goals and progress● Help align your metrics with your strategic
goals

Why do I want a dashboard?Strategic goals:● Do you have written strategic goals?● Do you have metrics that support those
goals?
Why do I want a dashboard?● Dashboards are a very effective tool that
helps drive the management decision making process
● Traditional approach is meetings, reviewing reports, asking questions

Why do I want a dashboard?The design process can drive critical improvements in process and how you measure process:● Detailed review of common departmental
functions● Implementing ways to measure, leading to
metrics

What do I put on a dashboard?

What do I put on a dashboard?● Anything that helps you view metrics in
support of your strategic plans● Generally speaking, 7 charts/graphs, plus or
minus 2○ Too little--don’t get full nuanced perspective on
different elements of the work○ Too much--loses readability and usability

What do I put on a dashboard?Program performance:● Constituents served● Staff workloads● Follow-up tracking● New and existing cases● Impact

What do I put on a dashboard?Development performance:● New donors● Existing donors● Individuals/organizations● Donation thresholds

What do I put on a dashboard?Membership:● New members● Renewals
What do I put on a dashboard?Human resources:● Staff training● Staff program performance
What do I put on a dashboard?Marketing/Communications:● Website views● Newsletter click-throughs● Donation conversions● Document downloads● Conversions to donations

What do I put on a dashboard?Volunteers:● Recruiting performance● Volunteer participation● Retention
What do I put on a dashboard?Financials:● Revenue● Expenses● Burn rate● Operating reserves● Current ratio
What do I put on a dashboard?High-level to low-level drill down:● Start with an overall summary of key items
from each area - a big-picture view● Drill down into more detailed metrics in
each area
What do I put on a dashboard?Other data:● It doesn’t all have to all be for decision-
making, there can be informational sections
How do I use my dashboard?
How do I use my dashboard?● Make the dashboard review a regular
component of the work process● Consider automated alerting for review● Consider automated alerting when specific
metrics are outside of range
How do I use my dashboard?Possible options:
● Daily, weekly, monthly review● Monthly levels check● Executive management meetings● Department management meetings● Board/governance meetings/presentations● Public website versions
How do I use my dashboard?● Use it to make decisions that drive change● Dashboards can drive change in practical use● What can be measured can be monitored,
what can be monitored can be changed

PAI Dashboard Walkthrough- A little bit about Philadelphia Academies, Inc.- National Career Academy Coalition’s
10 National Standards of Practice- To the Dashboard...

PAI Dashboard Walkthrough- Use:
- Using in monthly All-Staff meetings to call out areas of need and collaboration, as well as inform other departments of work in the field
- Will be using to show and explain progress toward goals to school-based partners (principals, Academy Coordinators, etc.)--focuses them on tangible goals empowers them to act on what is needed
- Will share dashboard components with our Board
Worksheet - Current DashboardsSection VII.

Worksheet - Current Dashboards1) Do you have any existing dashboards that you use? (please list them)2) What is on your dashboard(s)? (in general; what is the focus)3) How did you decide what to put on your dashboard(s)?

Worksheet - Current Dashboards4) Where does the data come from (manually entered, spreadsheets, databases, accounting system, etc.)? Who collects and/or synthesizes the data from the sources?5) Who uses the dashboard(s)?

Worksheet - Current Dashboards6) How is it used? (decision making, daily management review, general reference, etc.)7) How often is it used? (daily, weekly, monthly, board, etc.)
Worksheet - Current Dashboards8) Is your dashboard sufficient? If not, what is missing?9) If not helpful or effective, do you have any ideas on how they might be improved?
Worksheet - Current DashboardsWorksheet Review
Designing Your DashboardUnit 43.
Designing Your DashboardGeneral guidelines for a dashboard:● Metrics that reflect performance towards
organizational objectives● Keep it as simple as possible
Designing Your DashboardBuild from reliable data sources:● Ideally sources that are part of normal
business operation● Data entered in to management systems -
done as part of business operation

Designing Your DashboardManually entered/collected data:● Spreadsheets and other manually entered
data commonly has little validation● Proceed with caution
Designing Your DashboardBalanced Scorecard:● Method for designing and developing
objectives and outcomes● Prepare a plan for all aspects of the
organization (balance)● Executive management plans, with input
from the organizational areas

Designing Your DashboardDestination Statement:● A description of the organization in the
future, typically three to five years away● Include perspectives for:
○ Financial○ Constituents○ Processes○ Learning and growth
Designing Your DashboardStrategy Map:● 12 to 24 objectives as activities and outcomes● Definitions of the objectives● Measures for each objective with targets● All in support of the destination

Designing Your DashboardOther approaches:● What information are you frequently asking
for?● What information is in your current reports
and tools?

Designing Your DashboardSource the data:● What do we have now that fits the measures?● What don't we have?● How do we maintain it and be assured of
accuracy?

Designing Your DashboardSource the data:● What do we need to do to get the data we
don't have yet?● Is it really practical to get it, what is the
effort?● Is there enough return for the effort?

Designing Your DashboardWARNING - it’s very easy to want to include too much data, which can make things cluttered and hard to follow.
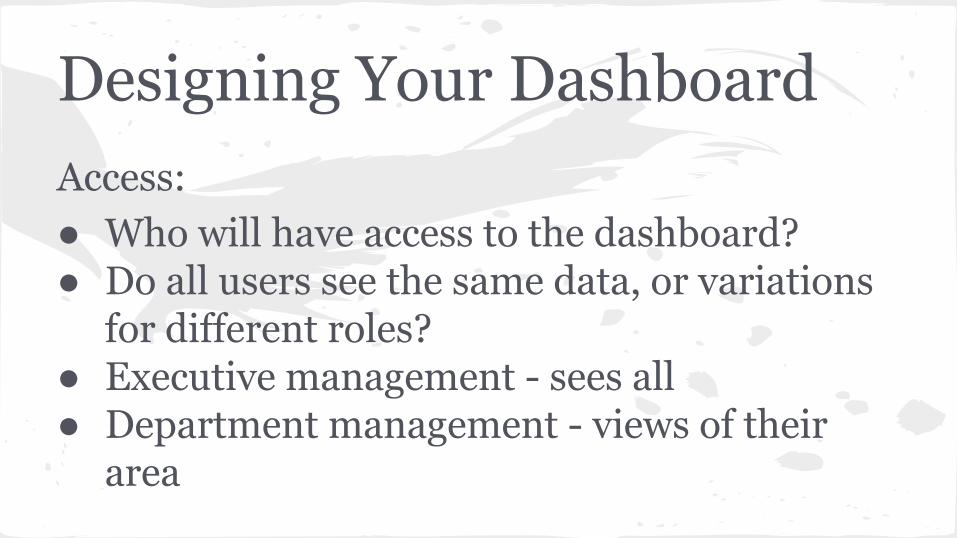
Designing Your DashboardAccess:● Who will have access to the dashboard?● Do all users see the same data, or variations
for different roles?● Executive management - sees all● Department management - views of their
area
Designing Your DashboardWARNING - it’s very easy to make a misleading dashboard, be very careful to review with your team and make sure you are evaluating and interpreting correctly.
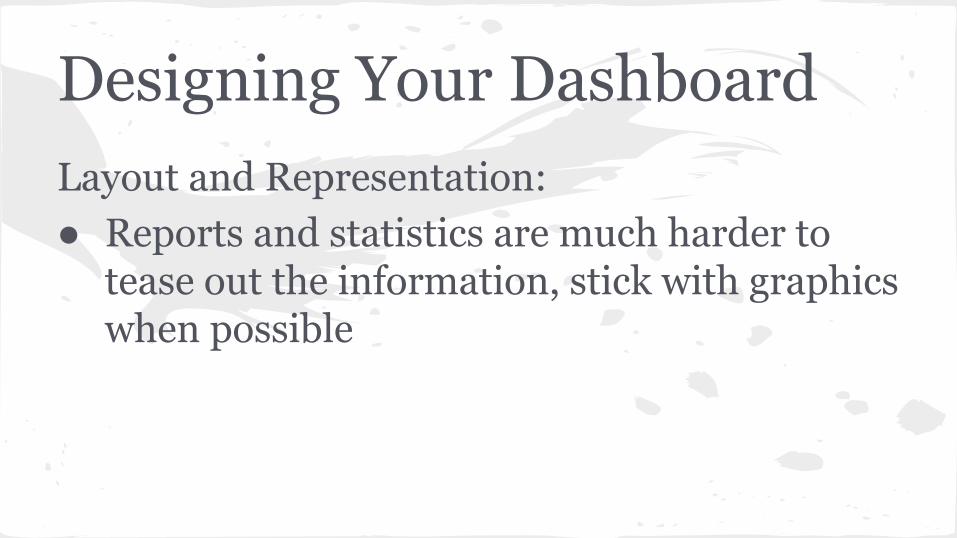
Designing Your DashboardLayout and Representation:● Reports and statistics are much harder to
tease out the information, stick with graphics when possible
Designing Your Dashboard
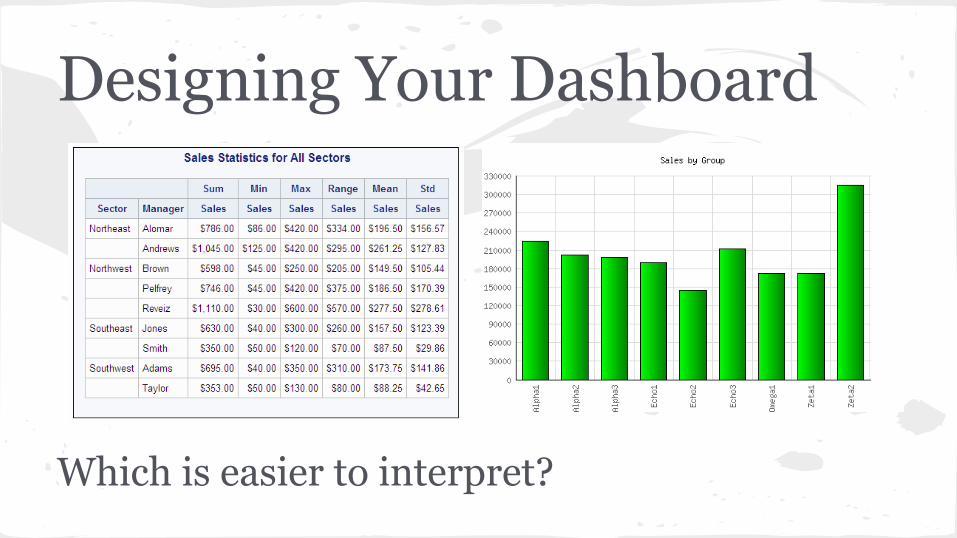
Which is easier to interpret?
Designing Your DashboardLayout and Representation:● Above all else, show the data, the fewer the
pixels the better● High data to pixel ratios

Designing Your Dashboard
Simple beats complicated every time!
Designing Your DashboardLayout and Representation:● Which charts go with which kinds of data?

Designing Your DashboardLine charts - best for time series
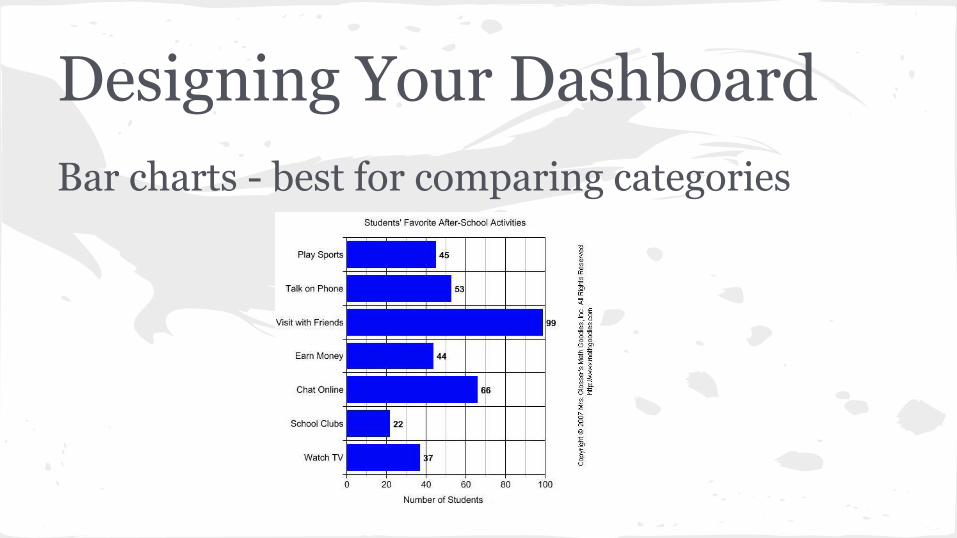
Designing Your DashboardBar charts - best for comparing categories
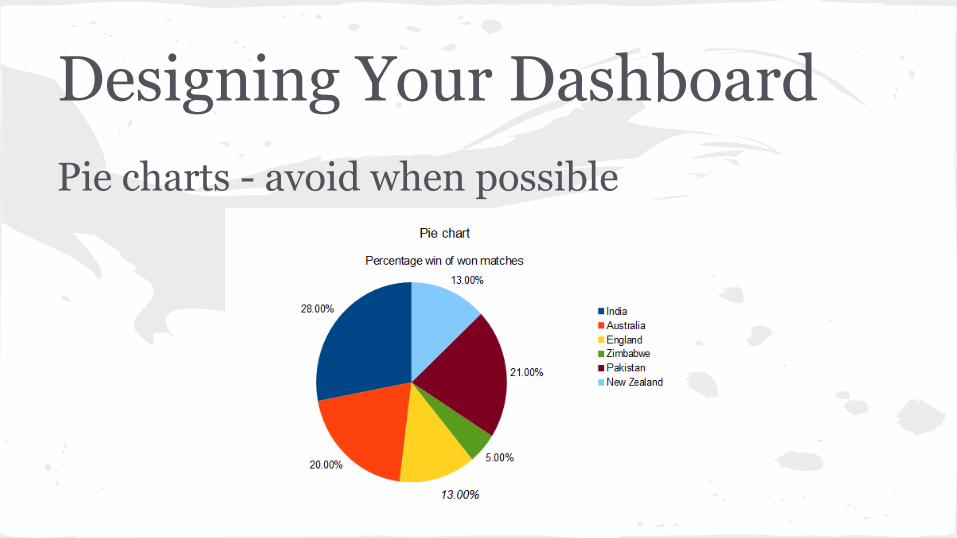
Designing Your DashboardPie charts - avoid when possible
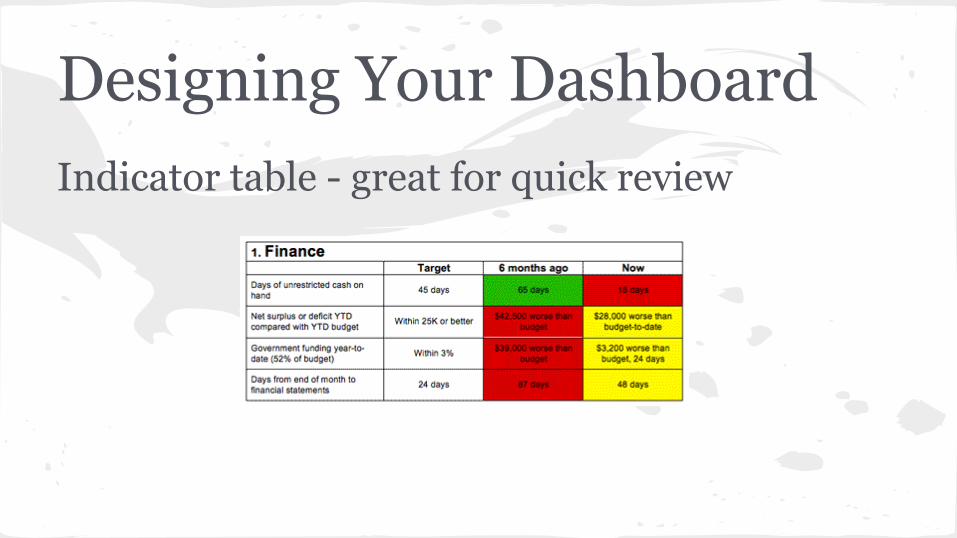
Designing Your DashboardIndicator table - great for quick review
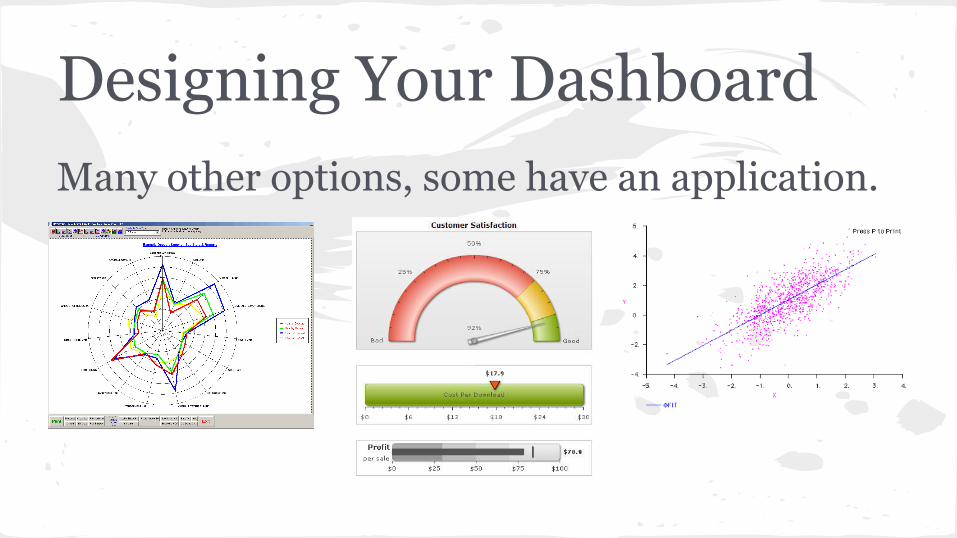
Designing Your DashboardMany other options, some have an application.

Designing Your DashboardAdditional guidelines:● Stay away from bright colors● Avoid many shades of color, too hard to
distinguish● Minimal annotations, everything doesn’t
need a label
Designing Your DashboardAdditional guidelines:● Test different options and get feedback● Good data visualization takes practice
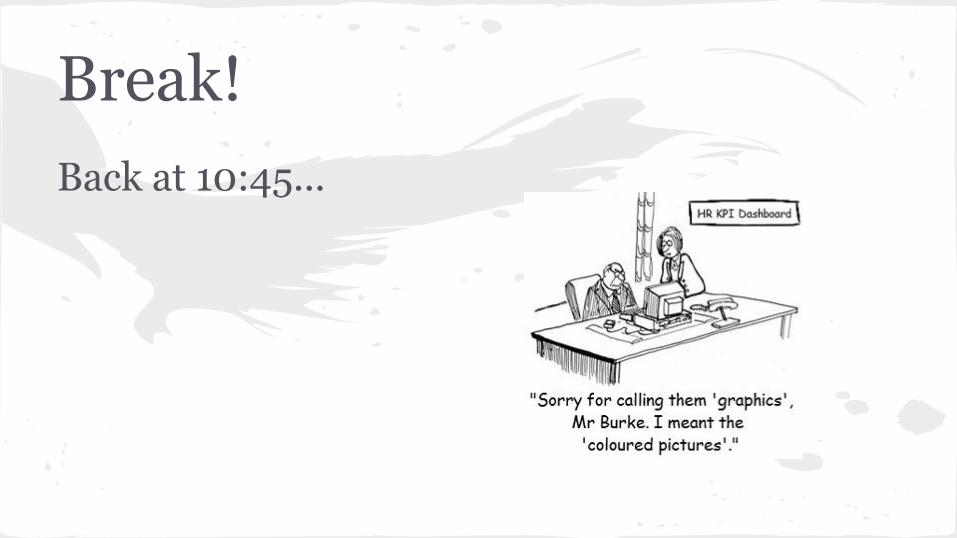
Break!Back at 10:45...

PAI Dashboard Design1. What information do we include? How do we
define (and measure) success?2. How do we visualize what we want on the
dashboard?3. How will we collect and enter data?
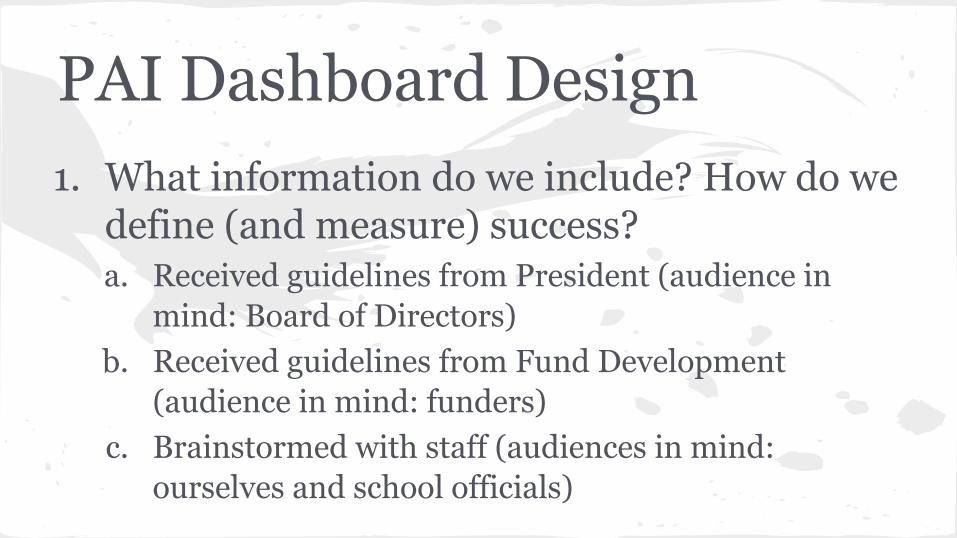
PAI Dashboard Design1. What information do we include? How do we
define (and measure) success?a. Received guidelines from President (audience in
mind: Board of Directors)b. Received guidelines from Fund Development
(audience in mind: funders)c. Brainstormed with staff (audiences in mind:
ourselves and school officials)
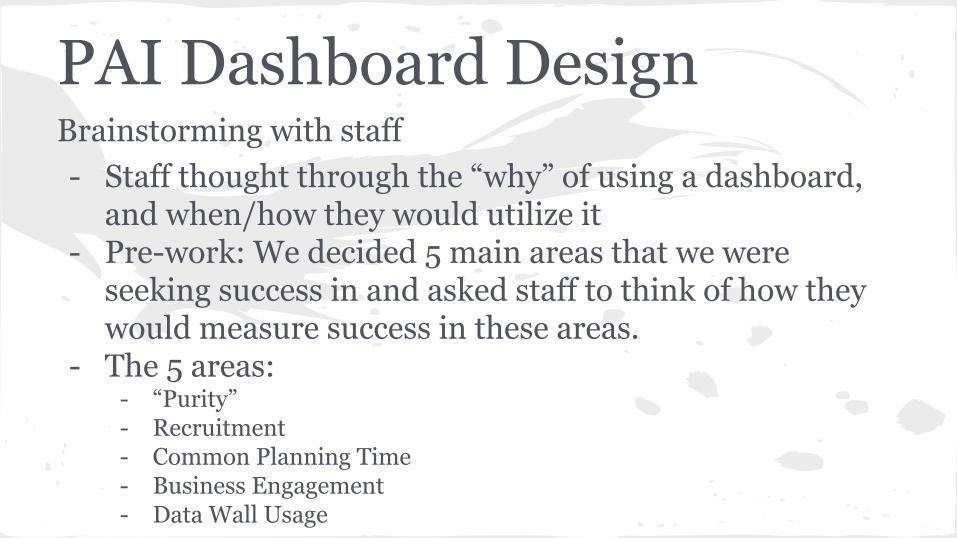
Brainstorming with staff- Staff thought through the “why” of using a dashboard,
and when/how they would utilize it- Pre-work: We decided 5 main areas that we were
seeking success in and asked staff to think of how they would measure success in these areas.
- The 5 areas:- “Purity”- Recruitment- Common Planning Time- Business Engagement- Data Wall Usage
PAI Dashboard Design

2. How do we visualize what we want on the dashboard?a. Synthesize and eliminate
i. Which pieces will be most telling? Avoid any duplications and also data that will be difficult to collect.
b. Came up with charts/visualizations for each data pointc. Defined all termsd. Collected them into broad categories/sections to be
grouped together
PAI Dashboard Design
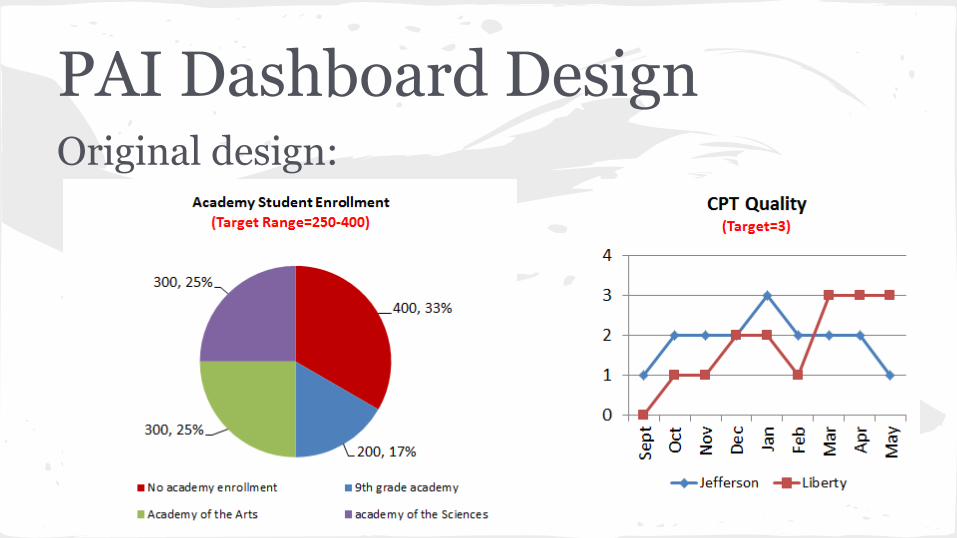
Original design:
PAI Dashboard Design

Final design:
PAI Dashboard Design

- First draft, reviewed with staff, final draft
- If you haven’t noticed: this is a hugely collaborative process! It can be painfully slow, but also gets everyone on board and invested.
PAI Dashboard Design

3. How will we collect and enter data? a. Decide division of roles and responsibilitiesb. Design reporting forms
i. Some may be optional while others are requiredc. Ask those who are collecting the best way to do itd. Train staff
i. Recommendations if data entry is new for staff:1. Have folks practice the data entry together in a group
2. Meet regularly to ensure or develop standardized processes and iron out inconsistencies and difficulties
PAI Dashboard Design

Worksheet - Dashboard DesignPhase Alpha.

Worksheet - Dashboard Design1) Destination/Mission StatementWhat does success for your organization look like from these lenses?
○ Financial○ Constituents○ Operational○ Learning and Growth
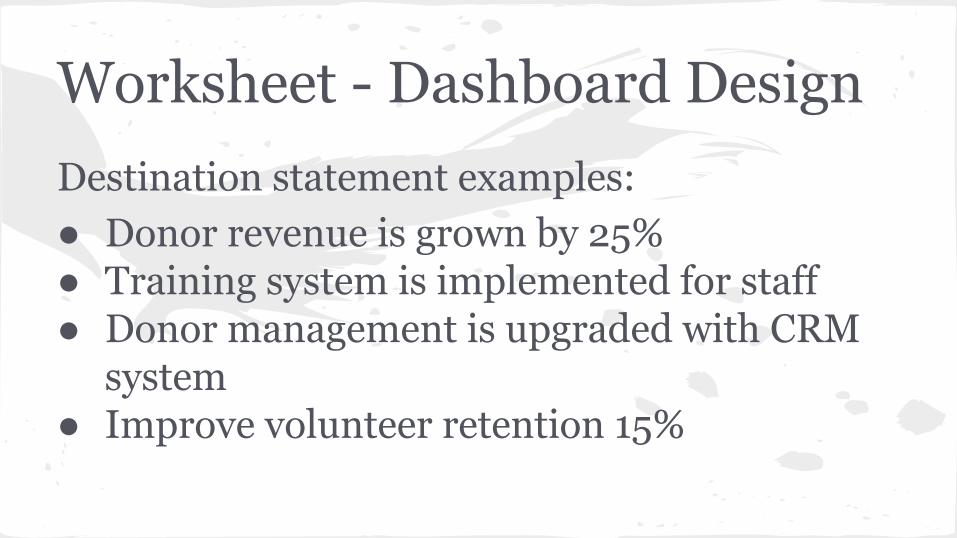
Worksheet - Dashboard DesignDestination statement examples:● Donor revenue is grown by 25%● Training system is implemented for staff● Donor management is upgraded with CRM
system● Improve volunteer retention 15%

Worksheet - Dashboard Design2) Dashboard ElementsWith your Destination/Mission statement in mind, list possible dashboard elements that would give appropriate measurements or metrics to manage those items. Don’t hold back--this is the brainstorming phase where you want to create more possibilities for the dashboard than what you eventually want in your final version.

Worksheet - Dashboard Design2) Dashboard Elements● Do this in multiple passes, make the list of
elements and descriptions first● Fill in the Target, Chart Type and Data
Source in a later pass

Worksheet - Dashboard Design3) Information Systems Resources● List your current information systems
(accounting/financial software, development/donor management, Excel spreadsheets, databases, line of business applications, SalesForce, etc.)
●

Worksheet - Dashboard Design4) Audience● List the roles/people that need access to the
dashboards
Worksheet - Dashboard Design5) Usage:● What will the process for use be? (How often
are they reviewed, at what meetings, etc.)

Worksheet - Dashboard DesignReview, questions.

Building Your DashboardPart last.

Building Your DashboardExisting applications:● Accounting - QuickBooks, PeachTree, Sage● Operations applications (SalesForce, CRM,
Raiser’s Edge)

Building Your DashboardDashboard applications:● Excel● Google Sheets● Tableau (multiple editions)● QlickView● COGNOS● Many, many more
Building Your DashboardCustom dashboards:● Stand-alone applications● Integrated existing applications● Seamless workflow

Building Your DashboardDashboard demo:● Excel● Tableau Public
Building Your DashboardExcel● Enter data manually● Import data from various tools, many
options● Add-ons for pivot tables, etc.

Building Your DashboardExcel● Sample data
Building Your DashboardTableau Public● Import Excel, Access and Text data● Import data from various tools with
upgraded versions ($)● Great variety of visualizations

Building Your DashboardTableau Public● Same sample data
Thank YouFeel free to contact me with questions about any of the process after the workshop.
Andy HourietAugust Development [email protected] x110
Data DashboardsFin.


