30
data-driven citizens @fryford http://visual.ons.gov.uk office for national statistics
| Date post: | 05-Aug-2015 |
| Category: |
Data & Analytics |
| Upload: | robertofry |
| View: | 112 times |
| Download: | 0 times |
data-driven citizens@fryford http://visual.ons.gov.uk office for national statistics

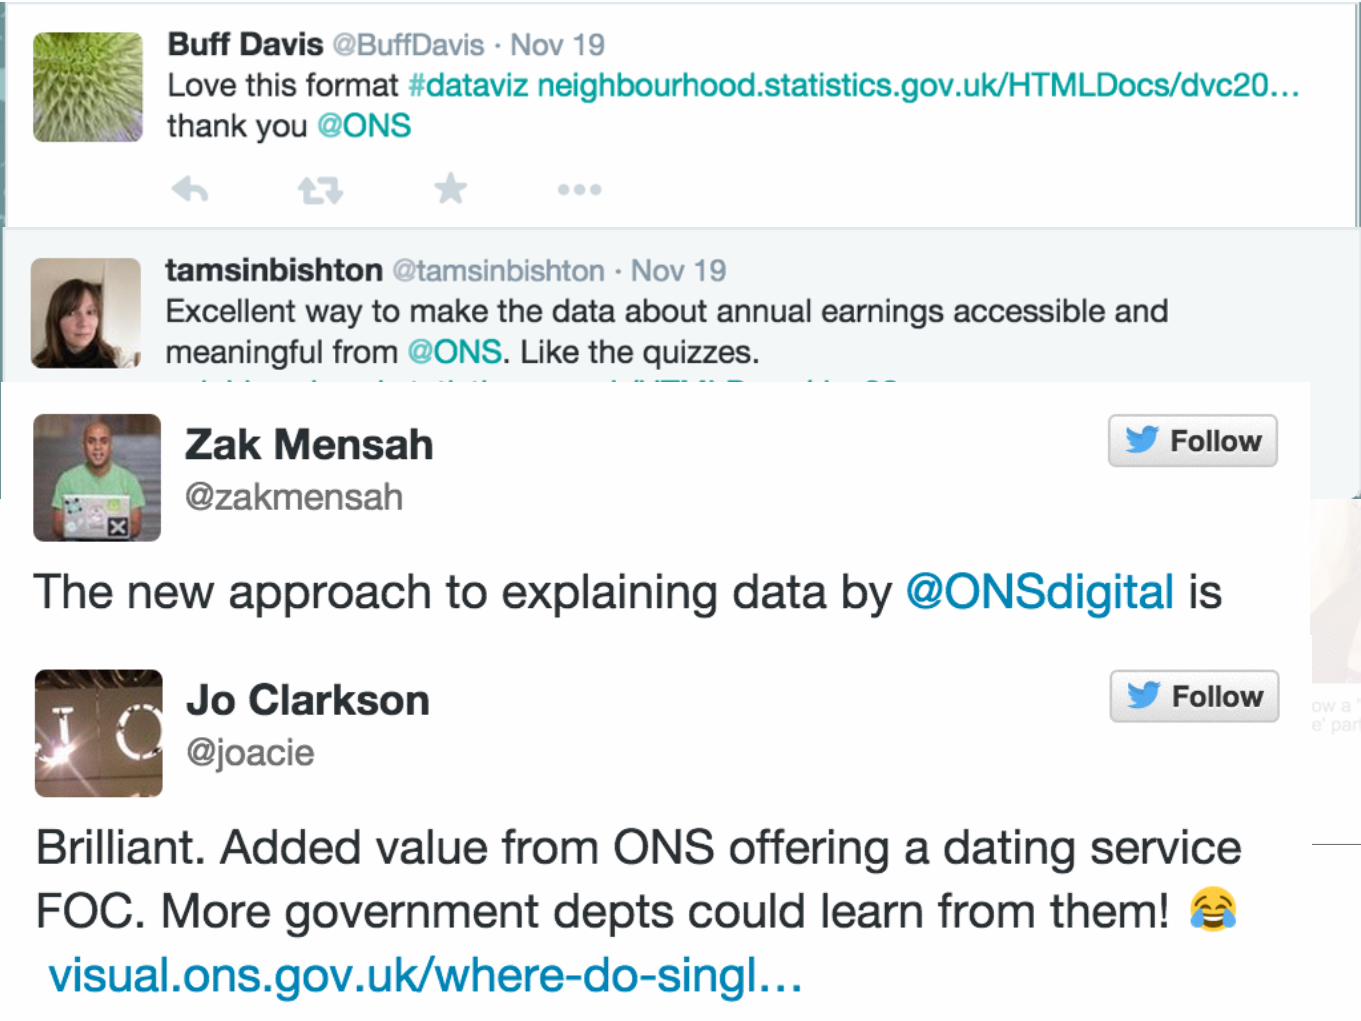
Mike Bostock leaving New York Times

Mike Bostock leaving New York Times
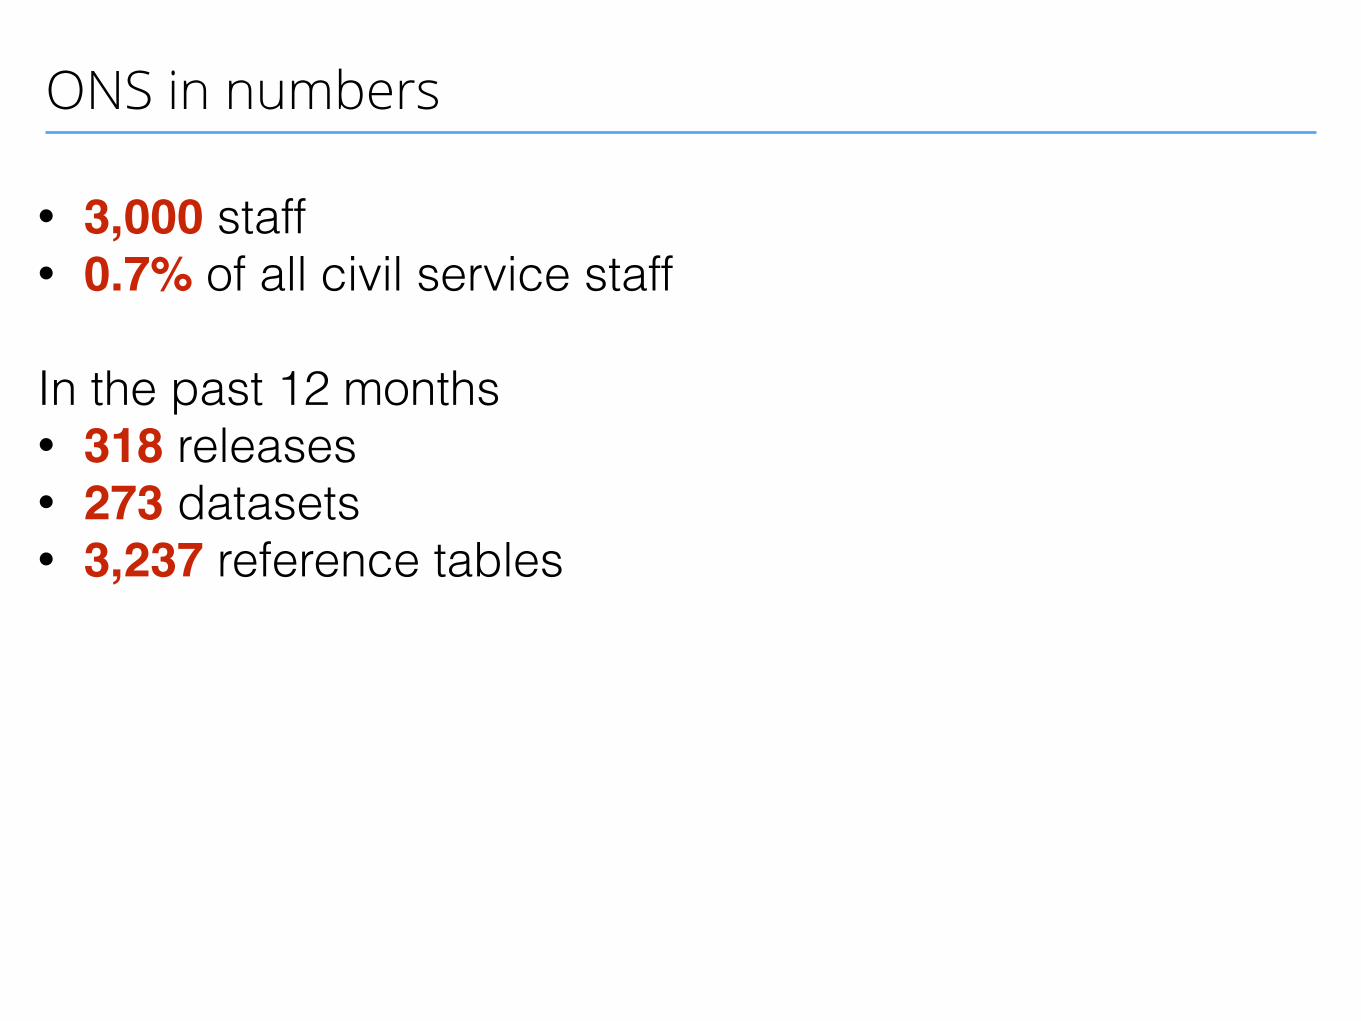
ONS in numbers
• 3,000 staff • 0.7% of all civil service staff !In the past 12 months • 318 releases • 273 datasets • 3,237 reference tables
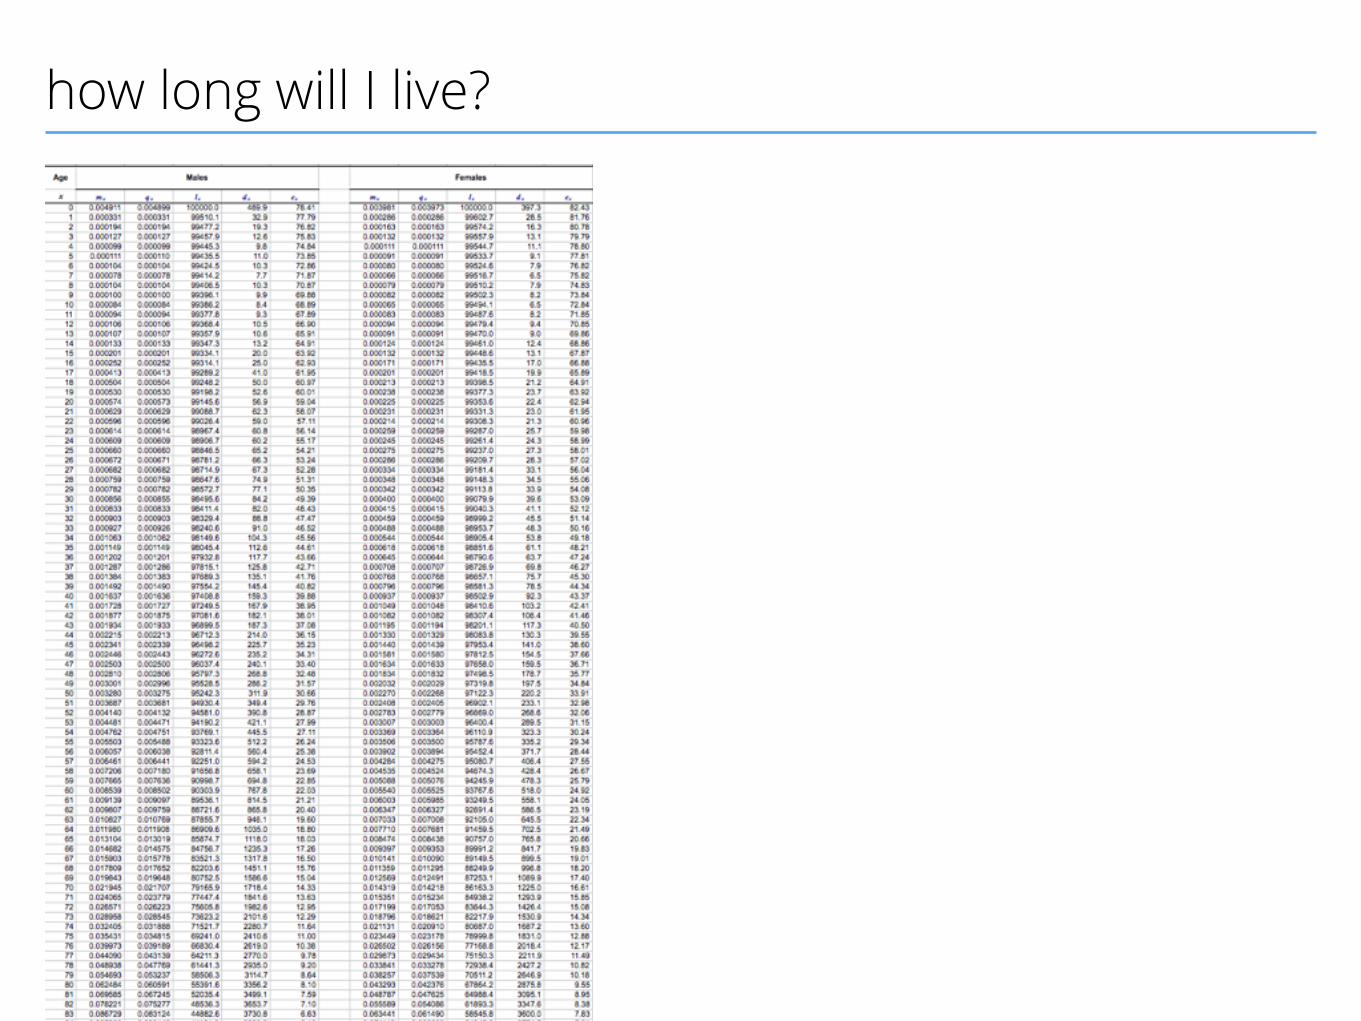
how long will I live?
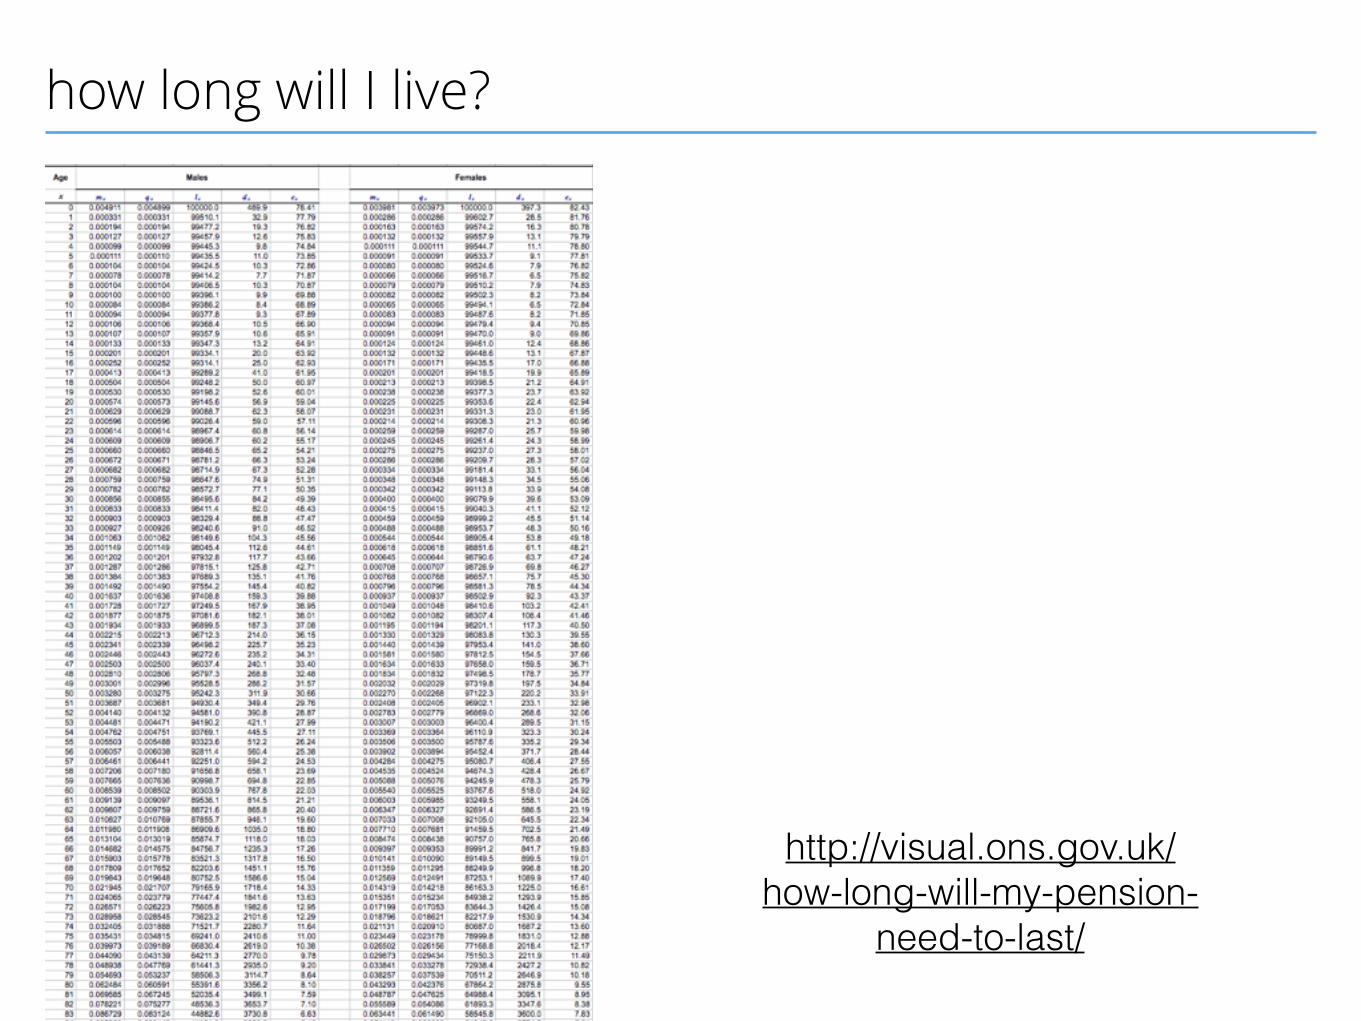
how long will I live?
http://visual.ons.gov.uk/how-long-will-my-pension-
need-to-last/
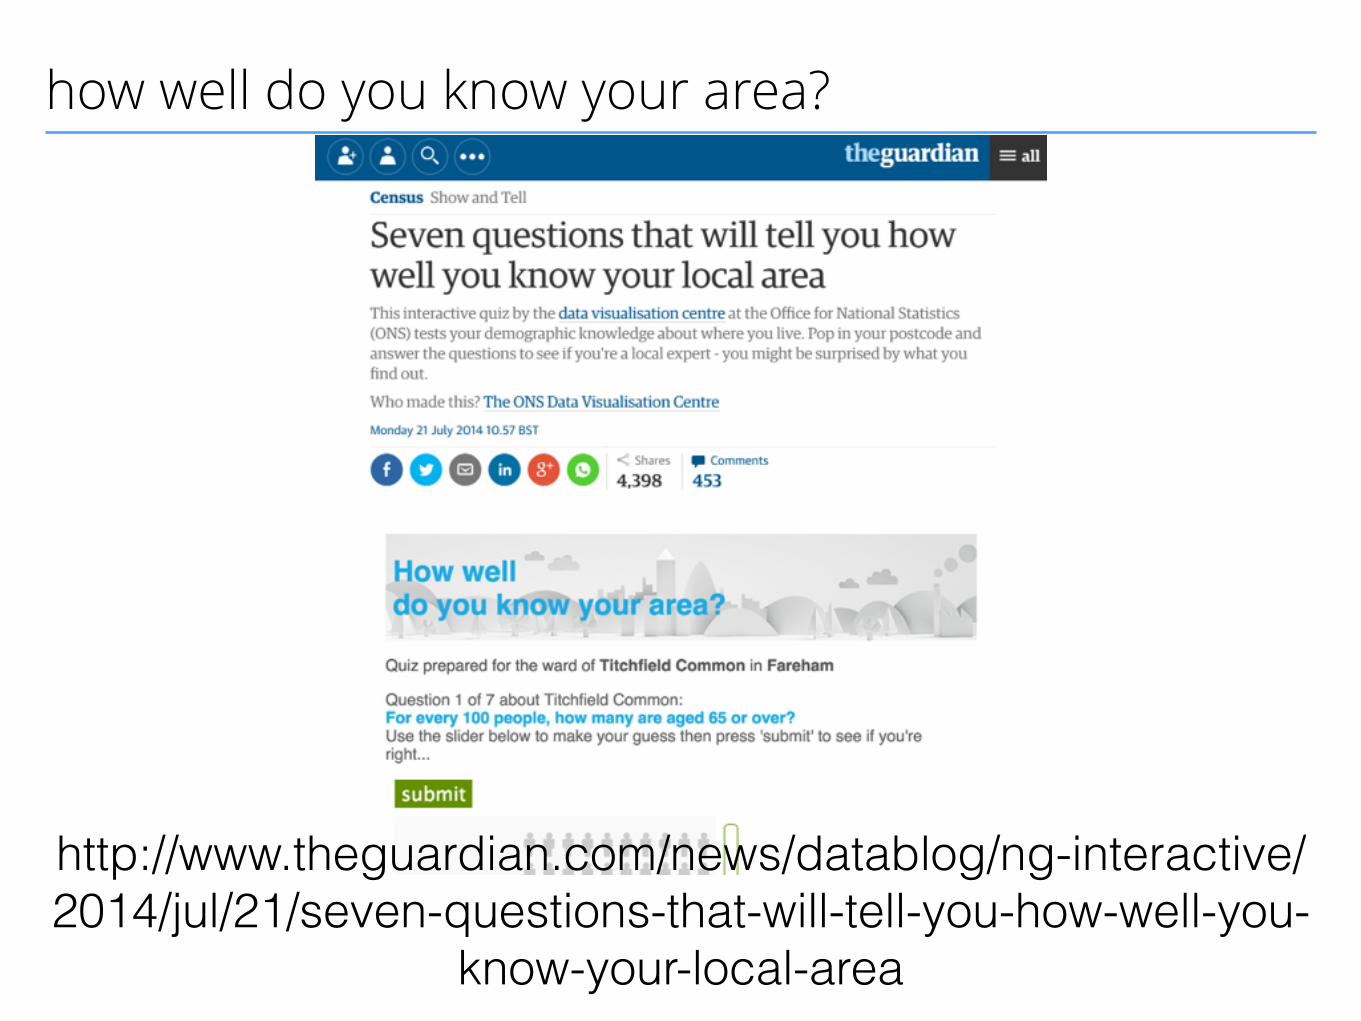
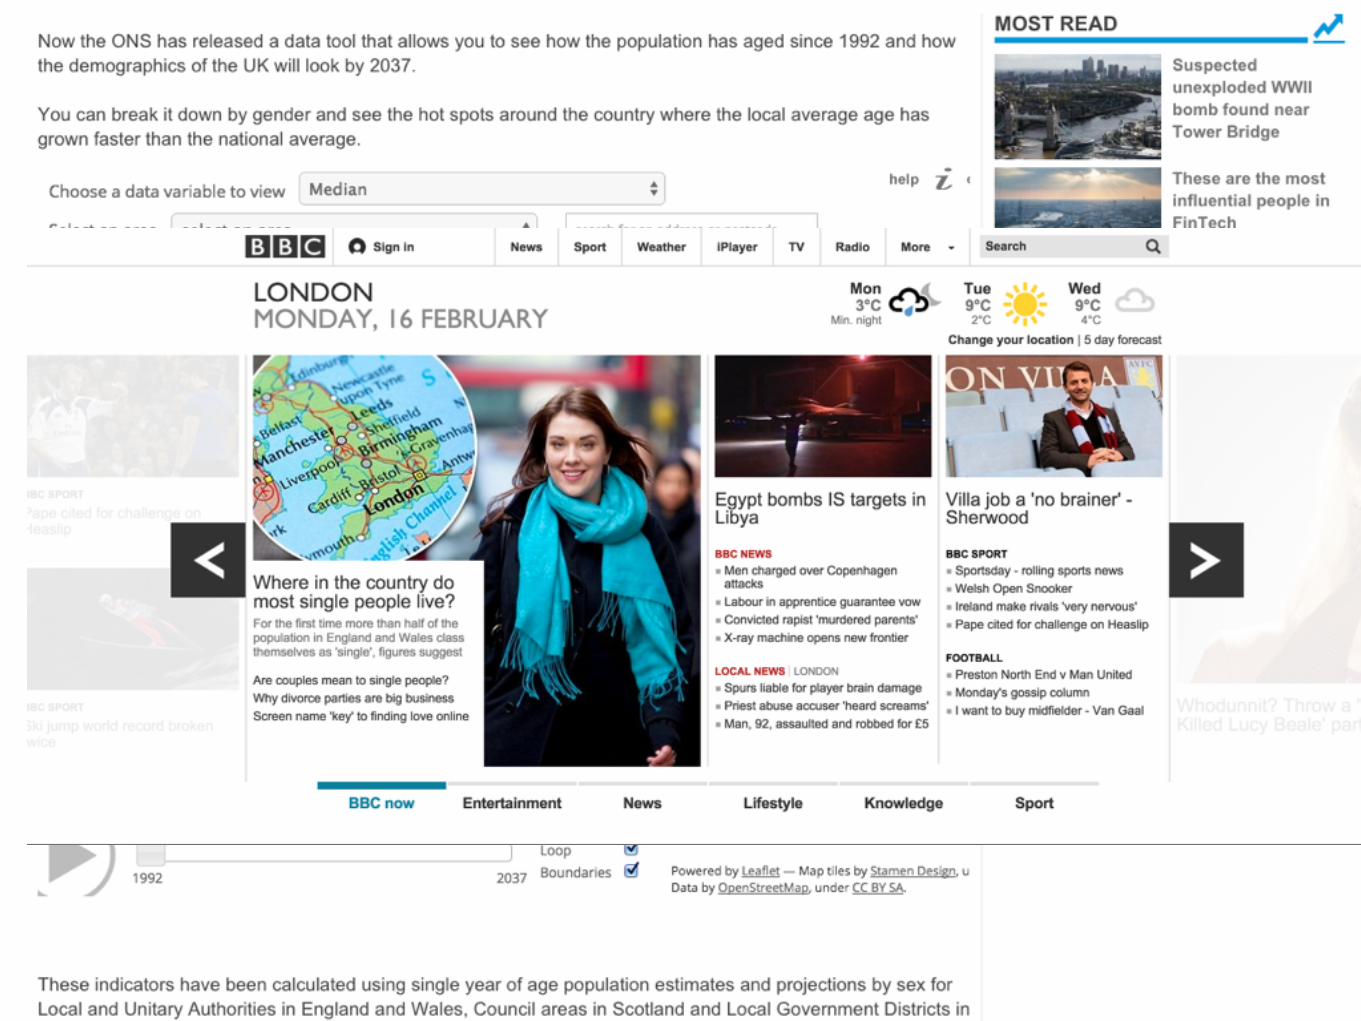
how well do you know your area?
http://www.theguardian.com/news/datablog/ng-interactive/2014/jul/21/seven-questions-that-will-tell-you-how-well-you-
know-your-local-area
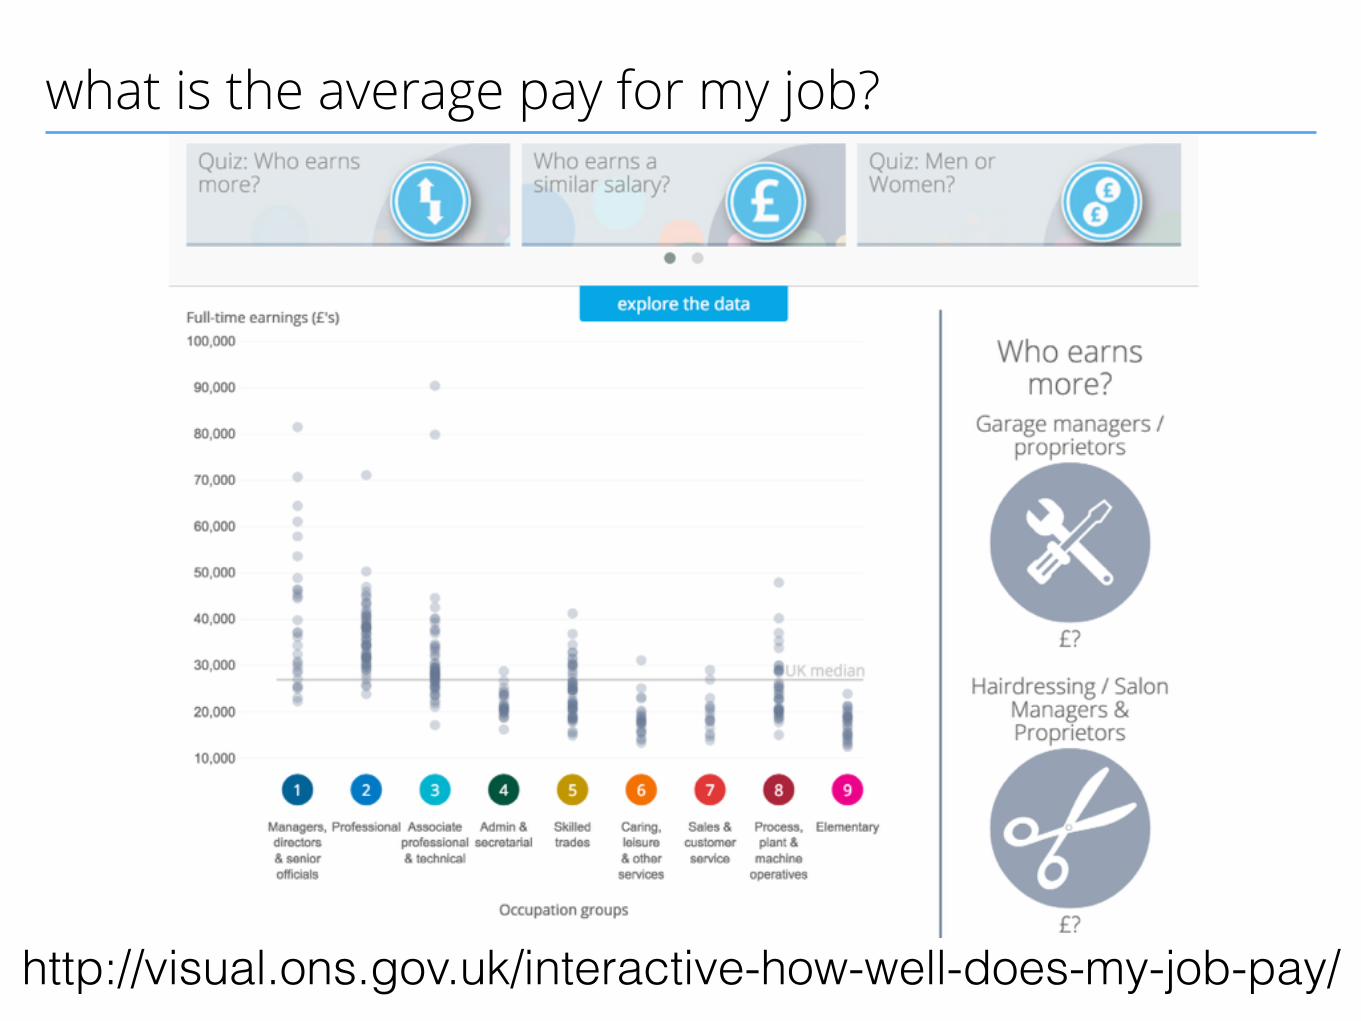
what is the average pay for my job?
http://visual.ons.gov.uk/interactive-how-well-does-my-job-pay/
my top 5 D3js (and related) tips ’n’ tricks countdown
5
topojsonhttps://github.com/mbostock/topojson

my top 5 D3js (and related) tips ’n’ tricks countdown
5
topojsonhttps://github.com/mbostock/topojson
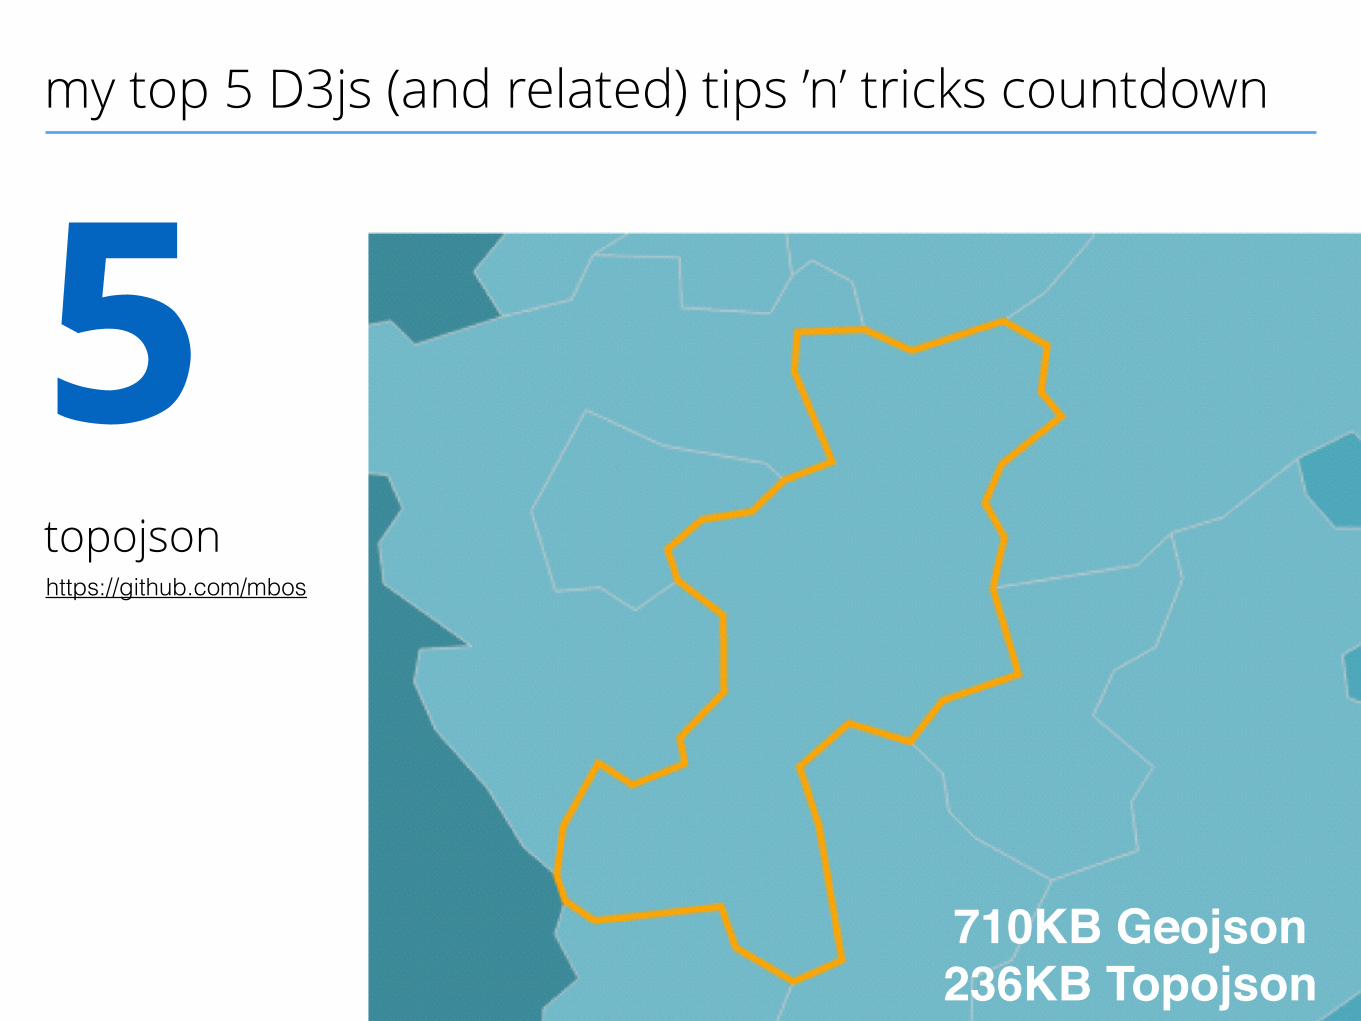
my top 5 D3js (and related) tips ’n’ tricks countdown
5
topojsonhttps://github.com/mbostock/topojson
710KB Geojson!236KB Topojson
my top 5 D3js (and related) tips ’n’ tricks countdown
5
topojsonhttps://github.com/mbostock/topojson
710KB Geojson!236KB Topojson

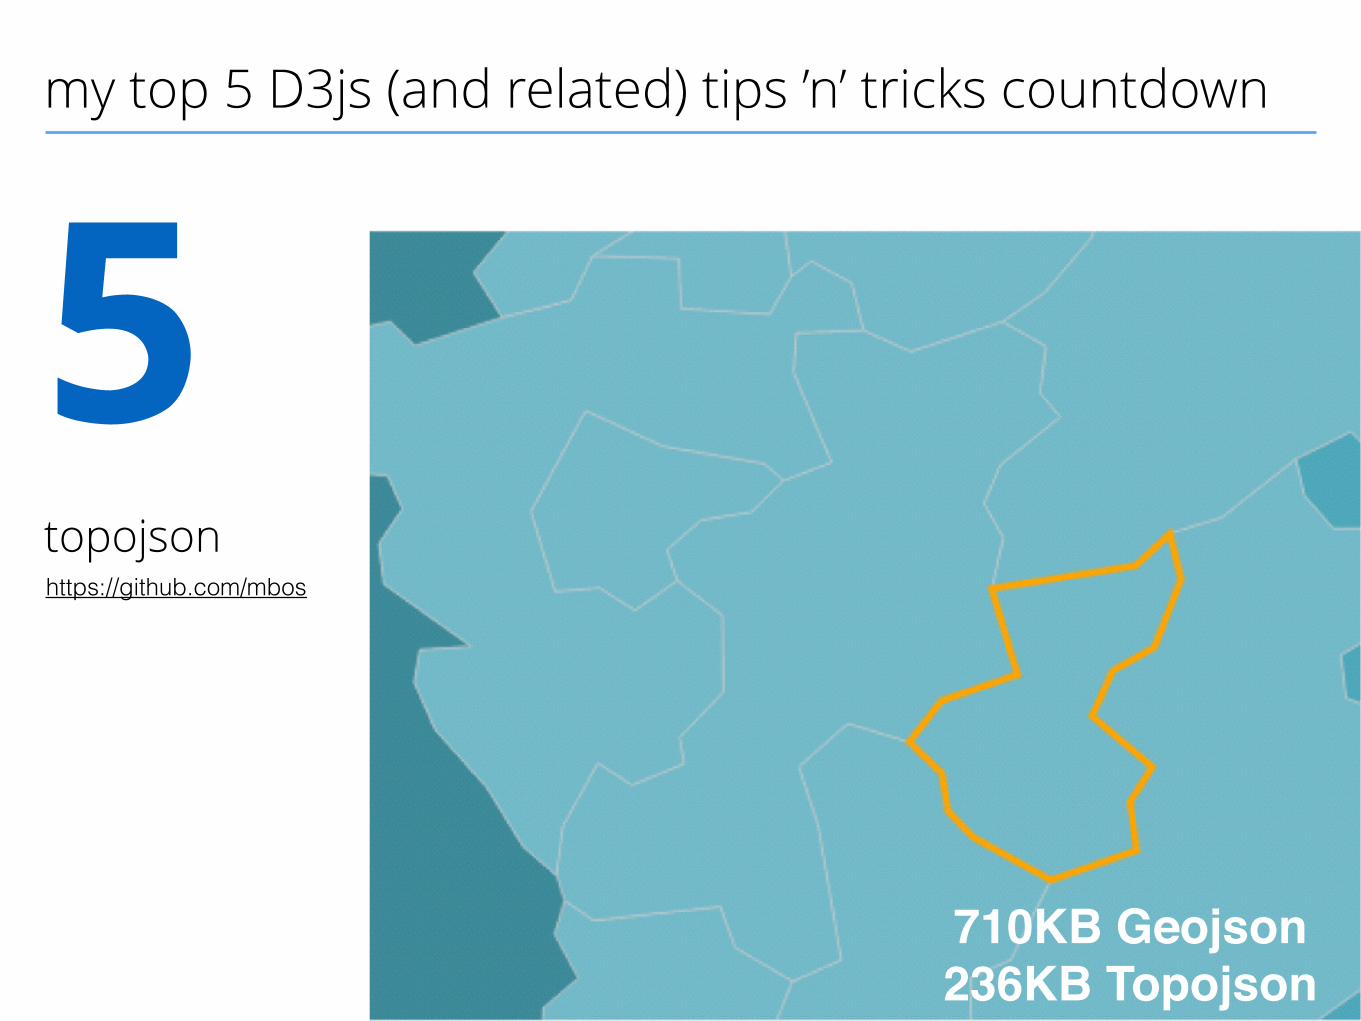
my top 5 D3js (and related) tips ’n’ tricks countdown
5
topojsonhttps://github.com/mbostock/topojson
710KB Geojson!236KB Topojson
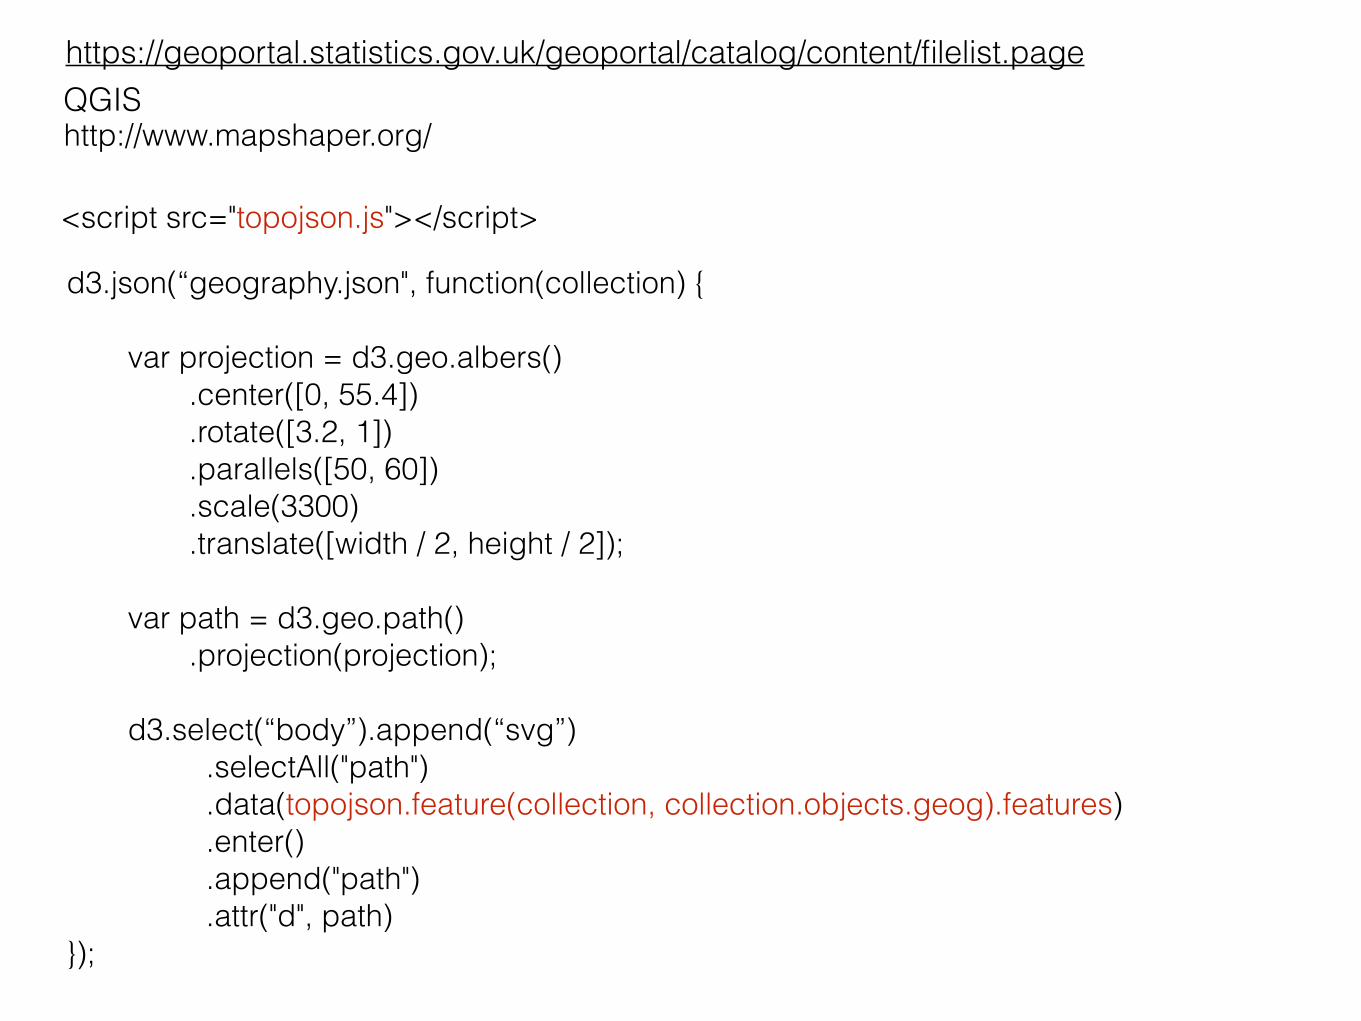
<script src="topojson.js"></script>
d3.json(“geography.json", function(collection) { ! var projection = d3.geo.albers() .center([0, 55.4]) .rotate([3.2, 1]) .parallels([50, 60]) .scale(3300) .translate([width / 2, height / 2]); ! var path = d3.geo.path() .projection(projection); ! d3.select(“body”).append(“svg”) .selectAll("path") .data(topojson.feature(collection, collection.objects.geog).features) .enter() .append("path") .attr("d", path) });
https://geoportal.statistics.gov.uk/geoportal/catalog/content/filelist.pageQGIShttp://www.mapshaper.org/
my top 5 D3js (and related) tips ’n’ tricks countdown
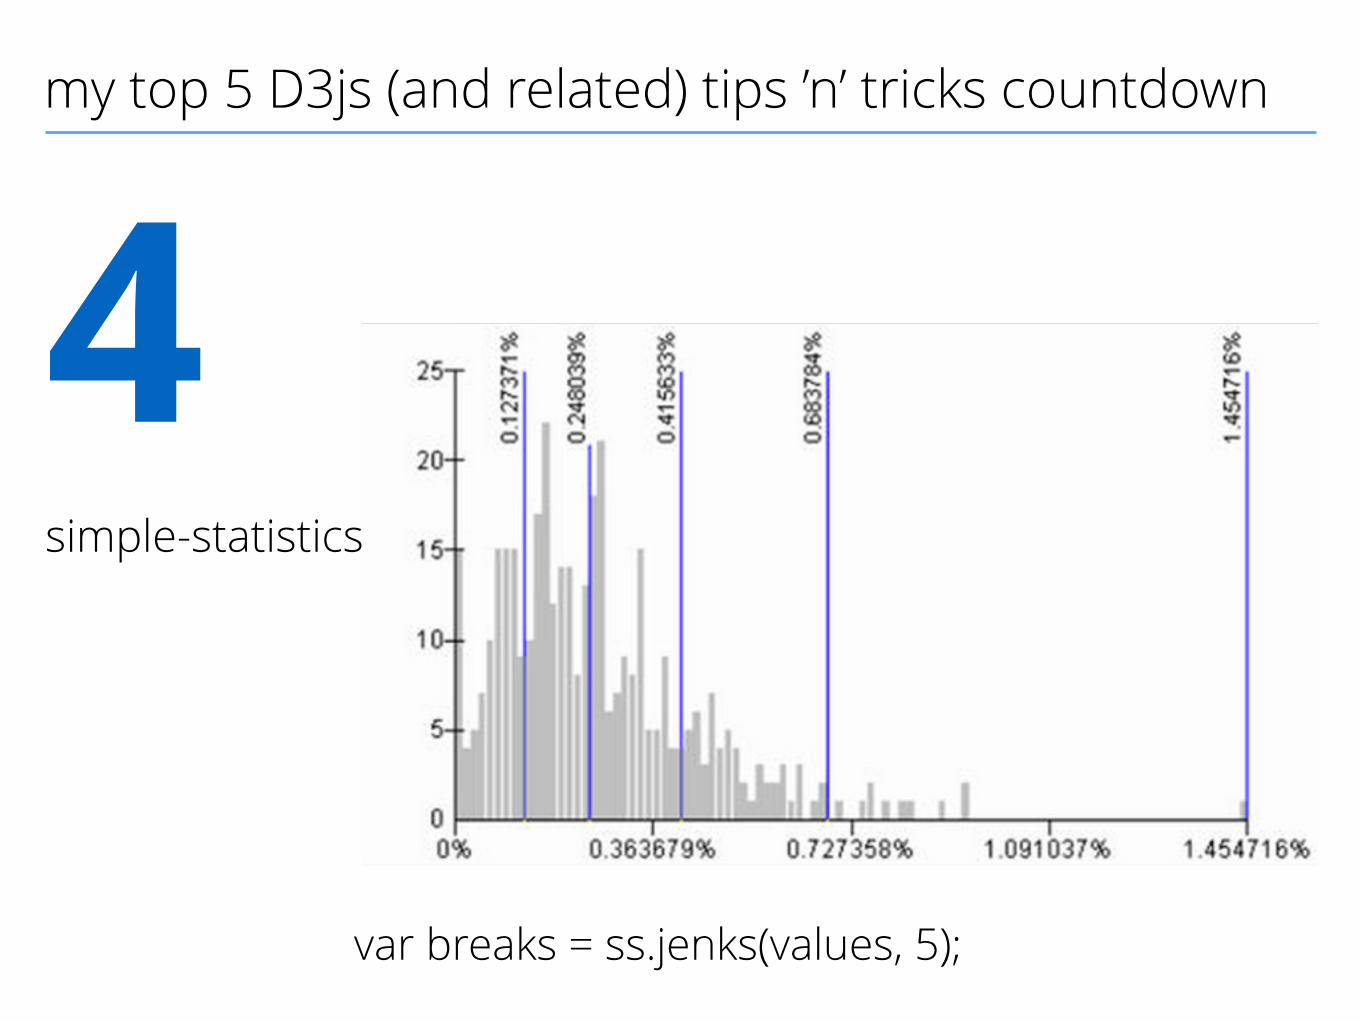
4
simple-statisticshttps://github.com/tmcw/simple-statistics
my top 5 D3js (and related) tips ’n’ tricks countdown
4
simple-statistics
var breaks = ss.jenks(values, 5);
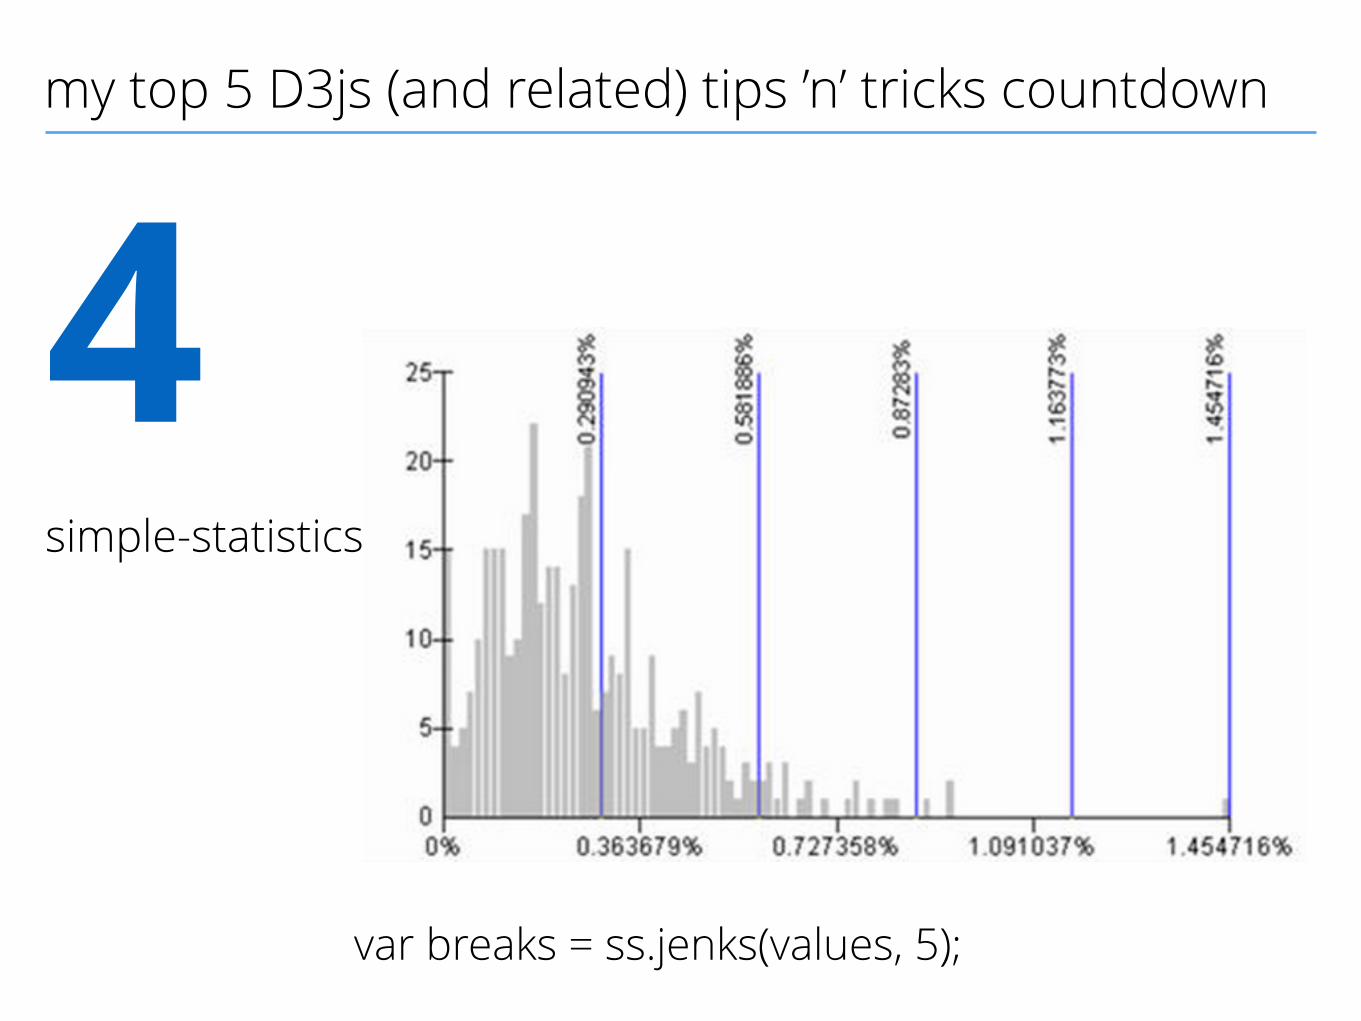
my top 5 D3js (and related) tips ’n’ tricks countdown
4
simple-statistics
var breaks = ss.jenks(values, 5);
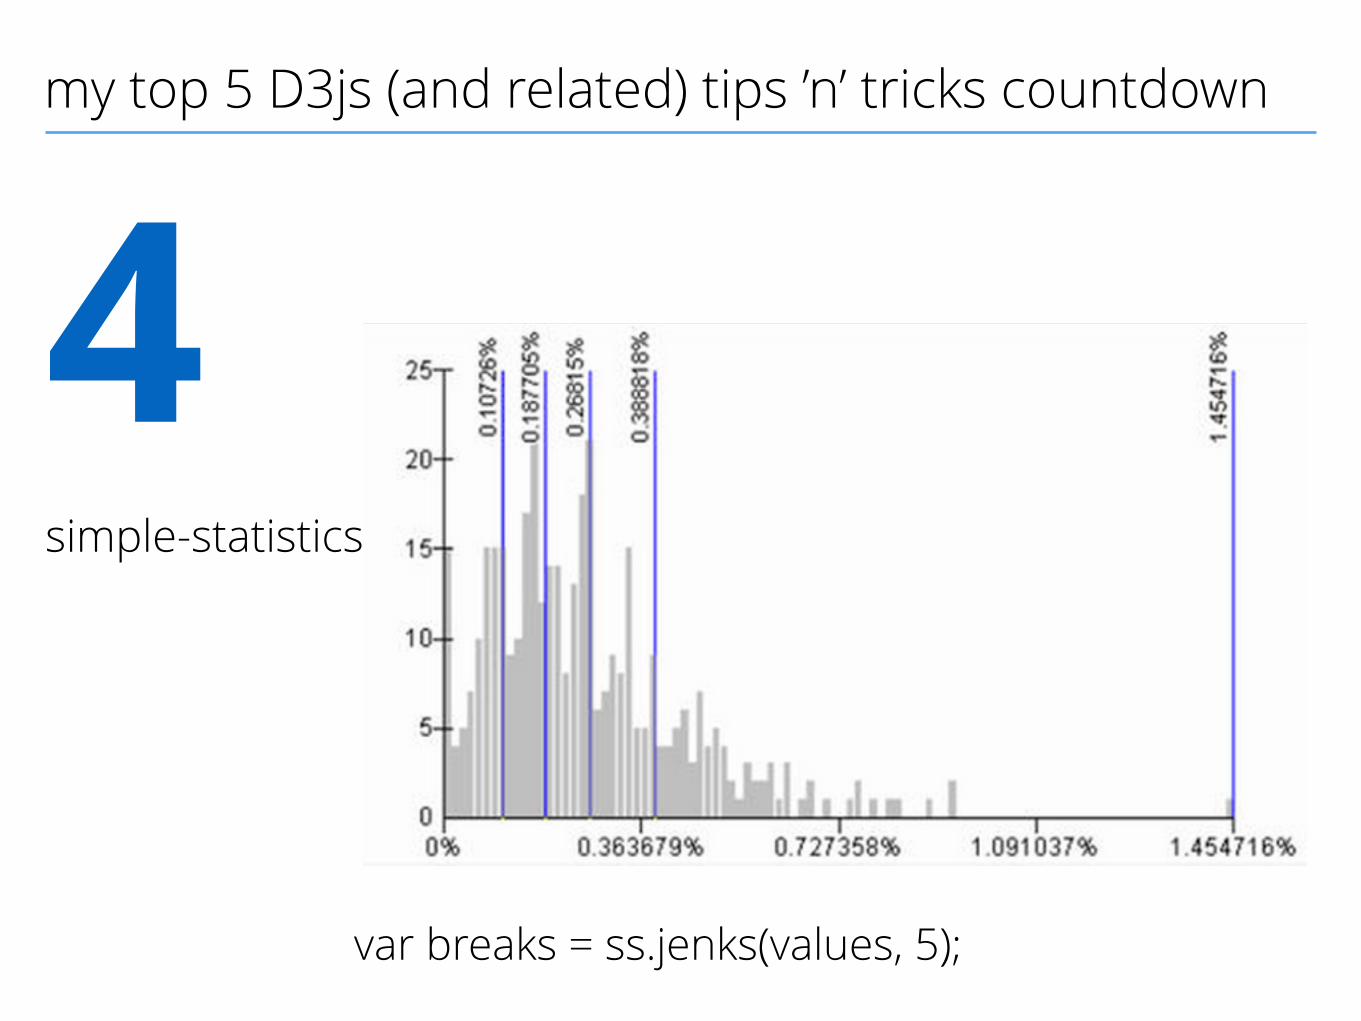
my top 5 D3js (and related) tips ’n’ tricks countdown
4
simple-statistics
var breaks = ss.jenks(values, 5);
my top 5 D3js (and related) tips ’n’ tricks countdown
3
pym.jshttp://blog.apps.npr.org/pym.js/
my top 5 D3js (and related) tips ’n’ tricks countdown
2
d3 cartogramhttps://github.com/shawnbot/d3-cartogram/
my top 5 D3js (and related) tips ’n’ tricks countdown
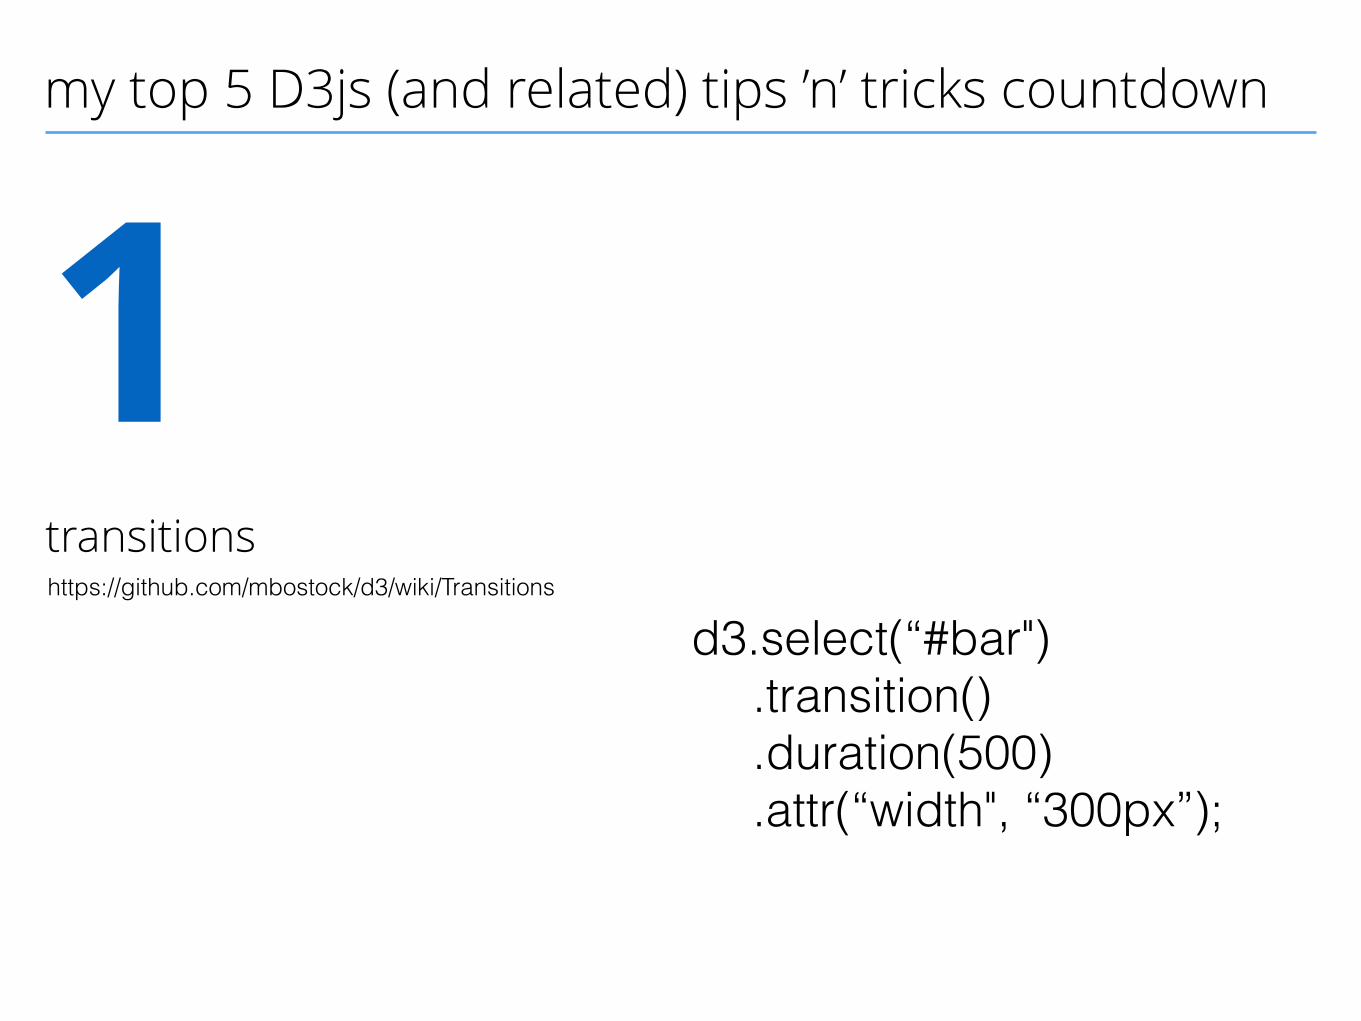
1
transitionshttps://github.com/mbostock/d3/wiki/Transitions
d3.select(“#bar") .transition() .duration(500) .attr(“width", “300px”);
questions?
@fryford
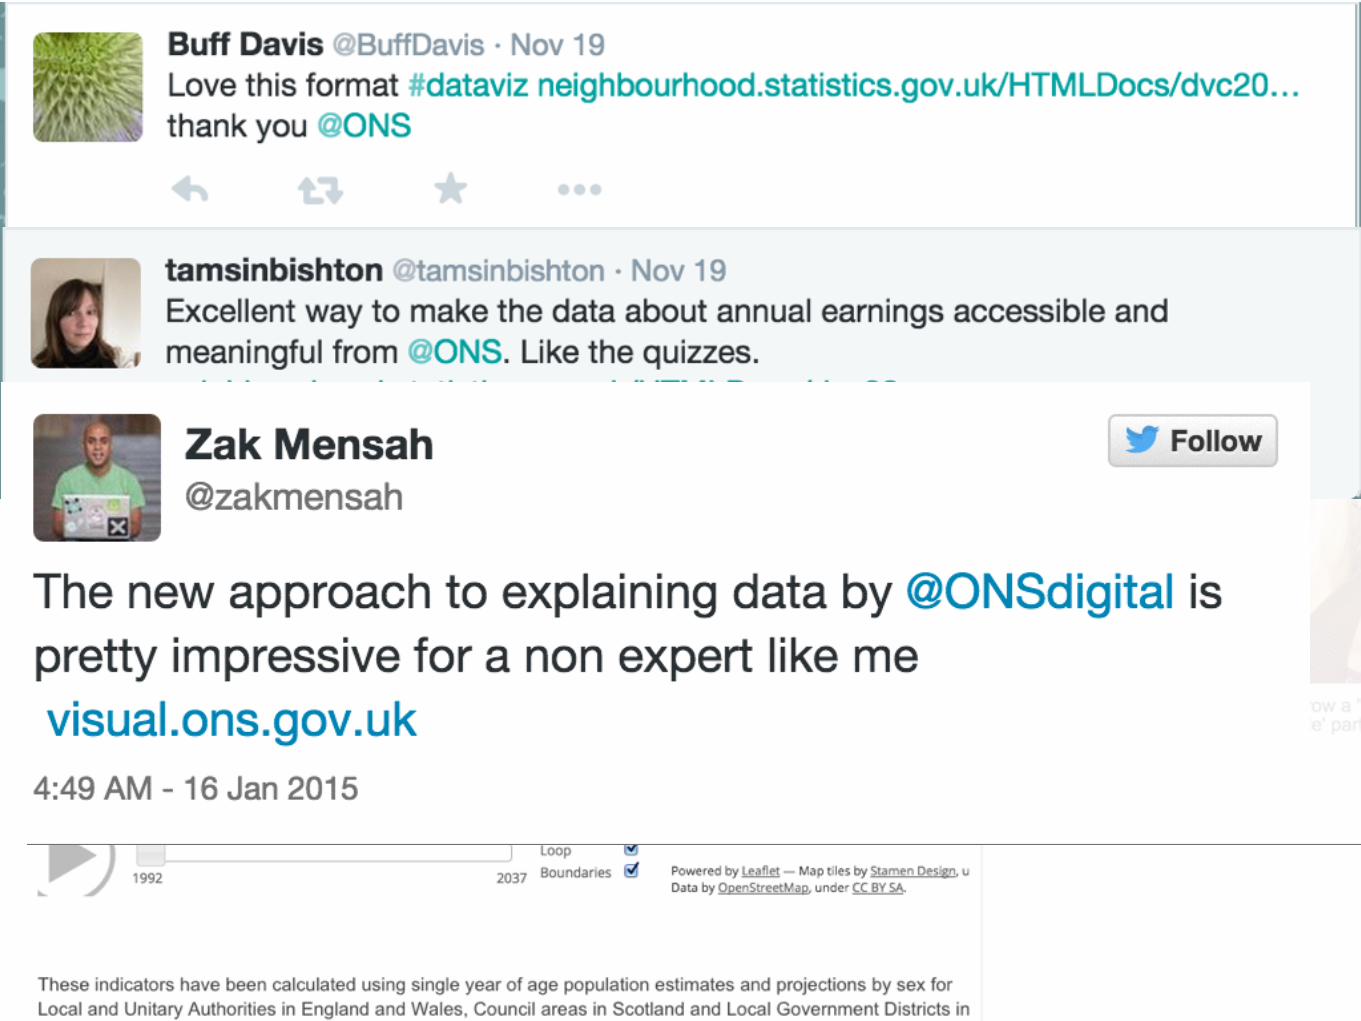
http://digitalpublishing.ons.gov.uk/2015/01/15/official-data-new-light-introducing-visual-ons/
linkshttp://visual.ons.gov.uk/
http://visual.ons.gov.uk/how-long-will-my-pension-need-to-last/
http://www.theguardian.com/news/datablog/ng-interactive/2014/jul/21/seven-questions-that-will-tell-you-how-well-you-know-your-local-area
http://www.bbc.co.uk/news/politics/constituencies/E14000699#visual_journalism-2015-newsspec_10189-content-english-index.inc
http://visual.ons.gov.uk/interactive-how-well-does-my-job-pay/http://visual.ons.gov.uk/visualising-your-constituency/
http://bl.ocks.org/tmcw/4969184http://visual.ons.gov.uk/victory-in-europe-day-how-world-war-ii-changed-the-uk/
http://visual.ons.gov.uk/interactive-how-do-earnings-vary-across-the-country/http://www.neighbourhood.statistics.gov.uk/HTMLDocs/dvc134_f/index.html
http://prag.ma/code/d3-cartogram/#deaths/2010


![Data-Driven and Keyword-Driven Test[1]](https://static.documents.pub/doc/80x56/577ce76d1a28abf103951d8d/data-driven-and-keyword-driven-test1.jpg)


