Abstract: In recent years, the number of services in mobile networks has increased exponentially.This increase has forced operators to change their network management processes to ensure anadequate Quality of Experience (QoE). A key component in QoE management is the availability of aprecise QoE model for every service that reflects the impact of network performance variations on theend-user experience. In this work, an automatic method is presented for deriving Quality-of-Service(QoS) thresholds in analytical QoE models of several services from radio connection traces collectedin an Long Term Evolution (LTE) network. Such QoS thresholds reflect the minimum connectionperformance below which a user gives up its connection. The proposed method relies on the fact thatuser experience influences the traffic volume requested by users. Method assessment is performedwith real connection traces taken from live LTE networks. Results confirm that packet delay or userthroughput are critical factors for user experience in the analyzed services.
Keywords: traffic monitoring; mobile network; quality of experience; big data; LTE
1. Introduction
In recent years, there has been a significant increase in the number of users andservices in mobile networks. This fact has led to an exponential growth in the demand ofmobility services. In coming years, a tenfold increase of mobile traffic is expected, reaching71% of total traffic on the Internet by 2022. Internet of Things (IoT) applications are oneof the main causes for this increase, and by 2023, IoT devices will account for 50% of allglobal networked devices [1]. Not only that, new radio access technologies (e.g., 5G) haveincreased the complexity of mobile networks, which has been identified as a major issuefor the success of future deployments [2].
Traditionally, operators have managed their networks in a Quality of Service (QoS)framework. This QoS perspective needs to measure user or network performance (e.g.,accessibility, sustainability, integrity, et al.). Thus, network management must be oriented insuch a way as to meet some requirements based on these indicators (e.g., a user throughputnot less than X Mbps). Additionally, QoS requirements can be defined in a service basisin such a way that different services can use different indicators and/or meet differentrequirements. As an example, operators usually demand some maximum delay for real-time services (e.g., Voice over IP (VoIP)), while throughput is the most-used indicator forbest-effort services (e.g., the Internet) [3].
The QoS framework, however, lacks the user’s perspective, and so a good net-work/user performance is not always translated into a good user experience. Opera-tors have therefore shifted their focus from network performance to end-user satisfaction(Quality of Experience (QoE)) [4]. This shift is reinforced by the success of smartphonesand tablets, which has raised users’ expectations, and the introduction of 5G new radiotechnology [5,6]. As a consequence, QoS management processes have been replaced bya more modern approach that is focused on QoE. This new paradigm has become a keydifferentiating factor in a competitive market in which networks and services are similar
for all operators. In this new framework focused on the user’s perspective, Customer Expe-rience Management (CEM) has become an extremely important task for mobile networkoperators [7].
CEM aims to improve the final user experience by optimizing the use of networkresources [8]. One of the main tasks involved in CEM is to find sophisticated indicators atthe service level to ensure service performance is properly characterized. Unfortunately,such service performance indicators are usually not available for network operators, unlesscomplex crowd sourcing schemes are deployed [9]. Thus, CEM tries to understand thefactors influencing user quality perception with the aim of describing the relationshipbetween measurable variables and the experience perceived by the end user (i.e., QoEmodeling [8,10]. Such variables may be human (e.g., age, education, etc.), system (e.g.,resolution, throughput, delay, etc.) or context (e.g., cost, data charging gap, mobility, etc.)factors [11–13]. For system aspects, QoE models often consist of analytical utility functionsrelating network-based QoS indicators to user opinion [14]. In its simplest form, thisrelationship between QoS and QoE is a logarithmic [15] or exponential [16] function. Thisapproach is followed by most frameworks for large-scale, on-line, passive monitoring foreach connection [17,18]. For a comprehensive survey of objective QoE models, the readeris referred to [19].
Most QoE models include parameters reflecting QoS thresholds above/below whichQoE remains constant [20]. The values of these thresholds are derived from subjectivetests with real users in lab environments, which are time-consuming and may not reflectthe true conditions in real life. Moreover, objective QoE models are seldom updated.However, customer expectations continuously increase as a result of handset upgrades,service diversification and new radio technologies. As a consequence, user satisfactionprogressively decreases if the provided QoS remains the same. For this reason, QoEmodels must be continuously updated. In most cases, tuning model parameters would beenough, avoiding more complex actions, such as changing the model structure. Even so,an automatic parameter tuning process is required to avoid subjective tests.
Current mobile networks generate a huge amount of information in the form ofmeasurements and interaction registers [21]. However, for simplicity, the majority ofthis information is discarded, and CEM is often performed based on limited data. Thus,operators are only focused on Configuration Management (CM), Performance Management(PM), Charge Data Record (CDR) and Customer Relationship Management (CRM) data.All this information is usually aggregated, meaning that it is impossible to identify anindividual user’s QoE. With the latest advances in information technologies, it is nowpossible to analyze massive volumes of information by using Big Data Analytics (BDA)techniques [22]. In mobile networks, BDA can improve the reaction time of managementsystems, allowing actions in real time and in a proactive way to improve the monitoring,control and optimization of QoE [21]. Connection traces are one of the main sources ofinformation in mobile networks. Traces systematically register all events associated with aspecific cell/user in some period of time, becoming a powerful tool for automated networkperformance analysis, monitoring and control [6].
In this work, a novel automatic method is presented to tune QoS thresholds in classicalanalytical QoE models by analyzing radio connection traces in an Long Term Evolution(LTE) system. The proposed method relies on the fact that users tend to shorten theirconnections when QoE is not satisfactory. Thus, the values of QoS thresholds can be inferredby detecting the loss of traffic volume for each connection as a result of unsatisfied users.The method consists of two stages: first, connections are segregated per service, based onQoS Class Identifiers (QCIs) and hierarchical clustering from connection descriptors; then,the value of QoS thresholds is estimated for each service by analyzing traffic descriptors ona per-connection basis. Method assessment is carried out by using a real trace dataset fromtwo live LTE networks. Unlike previous approaches, the proposed data-driven method(a) can be fully automated, eliminating the need for subjective tests when deploying a newservice; (b) can deal with the large diversity of system and human factors, which cannot
Electronics 2021, 10, 829 3 of 15
be taken into account in lab environments; and (c) can be executed periodically to detectchanges in user trends in large geographical regions.
The rest of the work is organized as follows. Section 2 introduces the use of utilityfunctions for QoE characterization. Section 3 outlines the trace collection process in mobilenetworks. Section 4 describes the proposed method to adjust QoS threshold parameters inclassical QoE models based on network traces. Section 5 shows the results obtained with atrace dataset taken from real LTE systems. Finally, Section 6 presents the main conclusions.
2. Characterization of Quality of Experience
QoE monitoring in mobile networks is a key factor for operators [23]. As the networkevolves, new indicators and counters are included in network equipment with the aim ofreflecting service performance (e.g., initial buffering time or web download time for videoand web services, respectively). However, user experience, as a subjective matter, cannotbe measured but only estimated from network and service performance indicators. For thispurpose, QoE models use utility functions to map the value of network Key PerformanceIndicators (KPIs), reflecting QoS, to user experience [20,24].
How QoS parameters are mapped into a QoE indicator is a widely studied subject. Ageneric formula connecting QoE with QoS for different packet data services is describedin [16]. It is assumed here that user experience remains constant at a maximum level whensome upper QoS threshold is exceeded. Similarly, a minimum QoS threshold can be definedbelow which a user neglects to continue its connection due to their bad experience. Thesestatements can be formulated as
where QoSi, ∀i ∈ {1, 2. . . N}, are the N network performance indicators reflecting serviceperformance, QoE is the indicator quantifying user experience, f is the user utility function,and QoEmax and QoEmin define the range of QoE values. Note that existence of QoE limitsimplies that there also exist QoS thresholds, QoSi,thmax and QoSi,thmin
, above or below whichQoE does not change. Thus, (1) can be reformulated as
At the same time, user experience is influenced by factors that strongly dependon the requested service. For instance, a user performing a voice call is sensitive topacket delay, whereas a user uploading a photo in a social network is more sensitive tothroughput [25]. Thus, different user utility functions are defined for each service [20]. Toaid comparison, QoE is commonly measured as the Mean Opinion Score (MOS). MOS scaleranges from 1 (worst experience) to 5 (best experience), i.e., MOS(s)
max ≤ 5 and MOS(s)min ≥ 1.
However, some models set more restrictive limits. With these considerations, (1) can bereformulated as
where superscript s refers to the service under consideration (i.e., s ∈ {web, video, . . .}).From (3), it follows that users of different services can experience a different QoE withthe same network performance (QoS). Consequently, different QoS requirements must beachieved to guarantee the same MOS for all services in a mobile network [20].
Electronics 2021, 10, 829 4 of 15
QoS thresholds give extremely valuable information to network operators, as it is notworthwhile to increase QoS beyond/below a certain threshold if there is no impact on userexperience. Unfortunately, the value of QoS thresholds per service, QoS(s)
i,min/max, is highlydependent on many factors, such as user expectation (which is not the same for all users),handset features (the user expects a better experience for a more expensive terminal) ornetwork evolution (a specific level of user experience previously seen as acceptable maynot be so some months later). All these factors make it very difficult for operators to findprecise QoS thresholds for their networks. Nonetheless, approximating these thresholds isstill useful for operators as it allows them to assess the overall cell performance from a userexperience perspective. From these thresholds, operators can trigger corrective actions tohave an impact on the overall user experience (e.g., ensuring some minimum user QoE).In this work, we take advantage of the fact that the minimum threshold, QoSi,min, oftenreflects the QoS below which the user gives up the connection [16]. Thus, QoSi,min can beinferred from user behavior observed in connection traces.
3. Trace Collection Process
Monitoring the QoE of individual users can only be done by collecting QoS indicatorsfor each connection. Such a piece of information is only available in connection traces,containing signaling messages (a.k.a. events) exchanged between every single piece of userequipment (UE) and base station. The structure of events consists of a header and a messagecontainer made up of different attributes, referred to as event parameters. The headerprovides general information (e.g., timestamp, base station, user, event type, among others),whereas attributes stored in the message container are specific to the event. Depending onthe network entities involved, events can be external or internal. External events consist ofsignaling messages exchanged through network interfaces via standard protocols [26–28],whereas internal events store vendor-specific information about the performance of thebase stations (known as evolved Nodes B (eNBs) in LTE). Events selected by the networkoperator are registered in a Data Trace File (DTF) for each cell, which is. generated aftereach reporting period (currently, 15 min). Two types of DTFs are distinguished: UE TrafficRecording (UETR) and Cell Traffic Recording (CTR) [29]. UETRs gather events from aspecific users identified by International Mobile Subscriber Identity (IMSI), while CTRsstore cell performance information by monitoring many anonymous connections [30]. Inthis work, CTRs are used to collect QoS indicators that reflect the average performance ofeach cell in the network.
A high-level view of the architecture for trace reporting in LTE can be found in [30].The operator starts the trace collection process by preparing a Configuration Trace File (CTF)in the Operations Support System (OSS). A CTF consists of (a) the event(s) to be monitored,(b) the particular UE(s) or ratio of anonymous users to be monitored, (c) the ReportingOutput Period (ROP), (d) the maximum number of traces activated simultaneously inthe OSS and (e) the time period when trace collection is enabled. Once trace collection isenabled, UEs transfer their event records to their serving eNB. After finishing the ROP,DTFs are generated by the eNB and then sent to the OSS asynchronously.
Trace files are binary files encoded in ASN.1 format [29]. Trace decoding is performedby a parsing tool that decodes, synchronizes and correlates events to extract the informationcontained in fields and compute the required network indicators, as described later.
4. Estimation of QoS Thresholds on a Per-Service Basis
A novel method to automatically estimate QoS thresholds for different services isdescribed in this section. In this work, only the threshold that determines the worst networkperformance tolerated by users before terminating the connection is estimated. Dependingon the service, this critical value corresponds to QoS(s)
i,thminor QoS(s)
i,thmax. Estimation is
carried out by a heuristic approach based on user behavior observed in connection traces.The inputs to the method are the following descriptors, collected for each connection:(a) the QCI value; (b) the Radio Resource Control (RRC) connection time; (c) the total
Electronics 2021, 10, 829 5 of 15
downlink (DL) and uplink (UL) traffic volume at the packet data converge protocol level;(d) the DL traffic volume ratio transmitted in the last transmission time intervals (TTIs) [31];(e) the DL activity ratio, computed as the ratio between active TTIs (i.e., those with datato transmit) and the effective duration of the connection; (f) the DL session throughput,computed as the volume transmitted in the DL divided by the effective duration of theconnection; (g) the mean downlink delay, τ, defined as the sum of DL mean connectiondelays in Radio Link Control (RLC) and Medium Access Control (MAC) layers; and (h)the mean DL Packet Data Control Protocol (PDCP) connection throughput, THPDCP,DL,excluding the last TTIs. The output of the method is an estimate of the QoS threshold foreach indicator i and service s, QoS(s)
i,thmin/max.
Two main steps are required to estimate QoS thresholds for each service: (1) theclassification of connection traces on a service basis and (2) the estimation of QoS thresholdsfor each service by analyzing user behavior.
4.1. Step 1: Classification of Connection Traces
Due to the coexistence of multiple services with very different requirements, cellularoperators are forced to classify traffic for each service to offer differentiated access andresource management [32]. In LTE, services are distinguished by their QCI value [33].Then, different traffic management priorities and policies (e.g., scheduling weights, queuethresholds, link-layer protocol configuration, etc.) are applied depending on QCI. In currentnetworks, services are commonly classified as QCI 1 (VoIP), QCI 2 (conversational video),QCI 3 (real-time gaming), QCI 4 (non-conversational video), QCI 5 (IMS signaling) andQCIs from 6 to 9 (services based on the Transport Control Protocol without a guaranteedbit rate) [33]. In particular, QCI labels 6 to 9 include a mix of services, ranging from socialnetworks to buffered streaming, which have very different QoS requirements from a QoEperspective. Moreover, some operators assign these last QCI values for user prioritizationpurposes (i.e., plan vs pre-paid). Thus, it is very difficult to monitor the experience of eachspecific service based on counters in the network management system, even if these aresegregated per QCI. Thus, a more accurate traffic classification is needed for QCIs 6–9.
In recent years, several methods for data traffic classification have been proposed.The simplest method is to identify the connection port [34]. However, currently, severalapplications use non-standard ports, and port assignment is often dynamic, meaning thatthere is no unequivocal relationship between a port number and service. More refinedmethods for traffic classification are based on the analysis of information exchangedalong the session [35]. Such an approach cannot be applied for encrypted traffic services.Moreover, even for non-encrypted services, all these methods rely on information fromhigh protocol layers, which can only be accessed by expensive network probes [36].
An option to solve these limitations consists of analyzing payload-independent flowcharacteristics. These methods exploit the fact that different applications show differentfeatures in their traffic that can be classified with Machine Learning (ML) techniques.Encrypted traffic classification has been extensively covered in the literature. In [37], asupervised learning algorithm is used to identify fingerprints of Android apps from theirencrypted network traffic. However, supervised schemes require a labeled training dataset.Other alternatives use unsupervised learning algorithms to classify connections withoutthe need of a previously-labeled dataset [38,39]. In [38], an unsupervised method foroffline coarse-grained traffic classification in cellular radio access networks is presented.This method relies on the fact that the identification of the class of service for a specificconnection can be performed from a set of traffic descriptors showing the properties of databursts in the connection. Unfortunately, radio connection traces do not explicitly registerthese traffic descriptors at the burst level, so that they must be estimated from other trafficparameters collected per connection. In the absence of labeled data that could be usedas ground truth, the authors in [38] validate their method by comparing the traffic mixresulting from their classification algorithm against mobile traffic statistics published by a
Electronics 2021, 10, 829 6 of 15
vendor. Results show that traffic shares per application class estimated by the proposedmethod are similar to those provided by a vendor report.
The above-described method is used in this work in the absence of a large dataset ofreal traces that includes the service requested by the user for each radio connection, due tothe difficulty of combining data from the radio access and core domains. To this end, thefollowing traffic descriptors are collected per connection:
• The RRC connection time;• The total DL traffic volume at the packet data converge protocol level;• The UL traffic volume ratio ηUL [%], computed as
ηUL = 100× VULVUL + VDL
; (4)
• The DL traffic volume ratio transmitted in last TTIs, ηlastTTIUL , computed as
ηlastTTIUL =
V lastTTIDLVDL
; (5)
• The DL activity ratio, ηactiveDL , computed as the ratio between active TTIs and the
effective duration of the connection,
ηactiveDL =
TactiveDLTe f f
; (6)
• The session DL throughput, THsessionDL (in bps).
Then, burst level parameters required for traffic classification are estimated for eachconnection from the set of traffic descriptors listed above. From these parameters, con-nections are divided into groups by hierarchical clustering. Finally, the resulting groupsare associated with broad application groups by analyzing the median value of trafficdescriptors for connections in each group.
4.2. Step 2: Estimation of Minimum Qos Thresholds
As explained in Section 2, each service has its own user utility function, f (s), combiningdifferent QoS indicators. In this work, the analysis is restricted to application groups thathave a significant share of connections and are affected by QoS; namely, Voice over LTE(VoLTE), full-buffer data services (e.g., app download, software update, large file downloadvia File Transfer Protocol, etc.) and streaming services (e.g., audio/video, live/buffered,etc.). For simplicity, in each service, only the QoS indicator with the largest impact onQoE for each service is considered (i.e., N =1 ∀ s in (3)). This indicator is not necessarilythe same for all services. For instance, packet delay negatively affects user experience forreal-time services (e.g., VoLTE or conversational video-streaming), whereas user experiencein non-real-time services (e.g., app download) is more sensitive to user data throughput.Previous works have shown that user experience in most services is dominated by asingle QoS metric. For instance, in [40], an analytical model to estimate the QoE for avideo-streaming service based on different network level metrics (e.g., average sessionthroughput, packet loss ratio and round-trip time) is presented. It is shown there that QoEis strongly correlated with a single QoS metric (average session throughput). On the otherhand, it is well accepted that voice calls are mostly affected by packet delay [41]. For thisreason, user experience is estimated here from the foremost QoS indicator of the requestedservice in order to reduce the complexity of the proposed model.
Hereafter, it is assumed that the QoE of a connection k of service s, MOS(s)(k), isconditioned by the value of the indicator i with the largest impact for that service, QoS(s)
i (k).
When this indicator falls below a certain threshold, QoS(s)i,min users experience their worst
QoE, MOS(s)min, which is reflected in different traffic indicators depending on the service.
Electronics 2021, 10, 829 7 of 15
For instance, unsatisfied VoLTE users tend to shorten their connections, and the effect istherefore observed in connection length. In contrast, in non-real-time services, whetherbackground, interactive or streaming, the effect is more evident in the traffic volume foreach connection. As a consequence, an analysis of an additional and service-based trafficindicators (e.g., length connection for VoLTE or data volume for streaming services) isneeded in order to detect those low-QoE connections. This traffic indicator is denoted asT(s)
j (k). Then, the QoE estimation of a connection k of service s is based on QoS indicator
j, QoS(s)j (k), used to infer the user behavior, and QoS indicator i, QoS(s)
i , as the indicator
with the largest effect on QoE. As user behavior is not deterministic, this QoS(s)i has some
random component so that connections with the same QoS(s)i do not end up with identical
values of QoS(s)j . To deal with this uncertainty, a percentile curve relating connection QoS(s)
i
and QoS(s)j is constructed for each service by discretizing QoS(s)
i values and computing the
50th percentile (median) of the distribution of QoS(s)j per bin, QoS(s)
j,50th tile(QoS(s)i ).
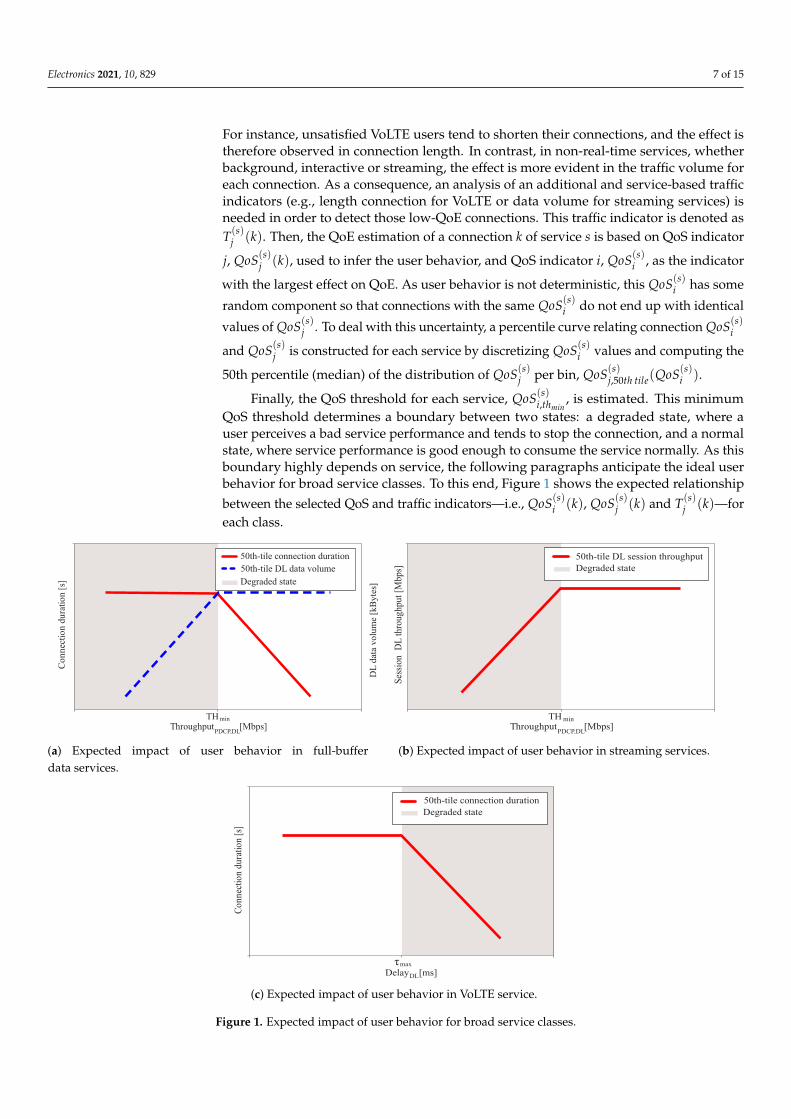
Finally, the QoS threshold for each service, QoS(s)i,thmin
, is estimated. This minimumQoS threshold determines a boundary between two states: a degraded state, where auser perceives a bad service performance and tends to stop the connection, and a normalstate, where service performance is good enough to consume the service normally. As thisboundary highly depends on service, the following paragraphs anticipate the ideal userbehavior for broad service classes. To this end, Figure 1 shows the expected relationshipbetween the selected QoS and traffic indicators—i.e., QoS(s)
i (k), QoS(s)j (k) and T(s)
j (k)—foreach class.
THThroughput
PDCP,DL
min
[Mbps]
50th-tile connection duration
50th-tile DL data volume
Degraded state
Co
nn
ecti
on
ura
tio
nd
[s]
DL
dat
a volu
me
[kB
yte
s]
(a) Expected impact of user behavior in full-bufferdata services.
TH
Ses
sion
hro
ughput
DL
t[M
bps]
ThroughputPDCP,DL
min
Degraded state
[Mbps]
50th-tile DL session throughput
(b) Expected impact of user behavior in streaming services.
Delay [ms]DL
max
Co
nn
ecti
on
ura
tio
nd
[s]
50th-tile connection duration
Degraded state
τ
(c) Expected impact of user behavior in VoLTE service.
Figure 1. Expected impact of user behavior for broad service classes.
Electronics 2021, 10, 829 8 of 15
In full-buffer data services, all data are available at the beginning of the connection,meaning that the associated traffic pattern consists of a few, very long bursts in whichdata are transmitted at full speed. Thus, the user terminal demands as many resources aspossible until all the data are transmitted. It is assumed here that the user tends to give upthe session when the download time exceeds a certain threshold. Such an action shouldbe reflected both in connection duration and traffic volumes per connection, as shown inFigure 1a. The x-axis represents the mean DL PDCP connection throughput, measuredonly considering active (and non-last) TTIs, which are selected as the QoS indicator withthe largest impact on QoE for these services. The primary x-axis represents the connectionduration, while the secondary y-axis represents the total DL data volume per the connection.The solid curve represents the median of the distribution of connection duration, whereasthe dashed line represents the median of the distribution of the total DL data volume.For clarity, the shaded area labeled as the degraded state comprises connections whoselink conditions are unacceptable for the user, which are more likely to be interrupted. Asobserved in the figure, it is expected that users will try to maintain a connection until amaximum duration is reached. On the right of the figure, as the link performance improves,the connection duration is reduced, since data are transmitted faster. In contrast, the datavolume per connection remains constant, since it is not conditioned by link performancebeyond a certain point (i.e., the user ends the connection before downloading the completedata). Thus, the minimum QoS threshold, THmin, in full-buffer data services is estimatedas the average DL PDCP throughput below which connection duration drops.
Streaming services are also affected by user throughput, meaning that the selectedQoS indicator is again DL PDCP throughput. However, a different behavior is expected forconnection duration and data volume. Streaming sessions consist of long connections withlarge data volume distributed in many bursts. Unlike full-buffer data services, streamingservices are elastic, meaning that a good link performance does not necessarily lead toa reduction of session duration. Thus, connection duration may not be a good QoSindicator to reflect user behavior. Instead, DL session throughput, calculated by dividingthe total DL data volume by the connection duration (including silent periods), mayreflect the quality of the downloaded material. Figure 1b shows the expected impact ofuser behavior for streaming services, representing the relationship between DL PDCPthroughput and DL session throughput. The solid line represents the median sessionthroughput and the shaded area defines the degraded state. As shown, in the degradedstate, the session throughput decreases as the DL PDCP throughput decreases. Once theDL PDCP throughput is good enough, the session throughput remains constant, showingthat the latter is not conditioned by the former. Thus, the minimum QoS threshold, THmin,for streaming services is the value of the DL PDCP throughput below which the mediansession throughput starts to decrease.
In a VoLTE service, the connection duration is the most representative indicator forthe characterization of user behavior. However, unlike full-buffer data, the QoS indicatorwith the strongest impact on QoE is packet delay. Figure 1c shows the expected impactof user behavior in VoLTE by representing the variation of connection duration causedby changes in DL packet delay. As in previous sub-figures, the solid line represents themedian of connection duration and the shaded area is the degraded state. It is observedthat the median connection duration should drop when the DL packet delay increasesabove a certain limit. Thus, the minimum QoS threshold, τmax, for VoLTE is the value ofaverage DL packet delay above which the mean connection duration starts to decrease.
It is envisaged that, in real networks, some services may not be fully represented bythe three above cases. For instance, web service or social networks might show differentbehaviors depending on the size of their objects. Likewise, live streaming may have strictlatency requirements.
Electronics 2021, 10, 829 9 of 15
5. Performance Assessment
In this section, the above-described method to estimate QoS thresholds on a servicebasis is tested with a set of radio connection traces taken from a live LTE network. For clarity,the analysis set-up is first explained and results are presented later. Finally, implementationissues are discussed.
5.1. Analysis Set-Up
Two independent datasets are generated from anonymous traces collected in twodifferent LTE systems. Both systems are mature enough to provide a large set of connectionswith a varying QoS to derive the required QoS thresholds. Dataset 1 is collected in 1960LTE cells covering an urban area of 3900 km2. Specifically, traces are collected during twohours (from 10:00 to 12:00 a.m.), resulting in 48,683 connections: 43% of connections inQCI 1 and 57% in the range of QCIs 6–9. On the other hand, dataset 2 is collected from10:00 to 11:00 a.m. in 145 LTE cells covering 125 km2 in an urban area, resulting in 10,123connections, all of which have QCIs between 6 and 9.
Traces are processed to obtain the traffic descriptors for each connection needed fortraffic classification, as defined in Section 4.1. Then, connections are classified with theunsupervised learning method described in the same subsection. After classification, 8% ofconnections are labeled as full-buffer data services, 5% are classified as streaming, 35% areclassified as VoIP, 5% as web browsing of webs with large objects and 47% as web browsingfor webs with small objects or social networks.
5.2. Results
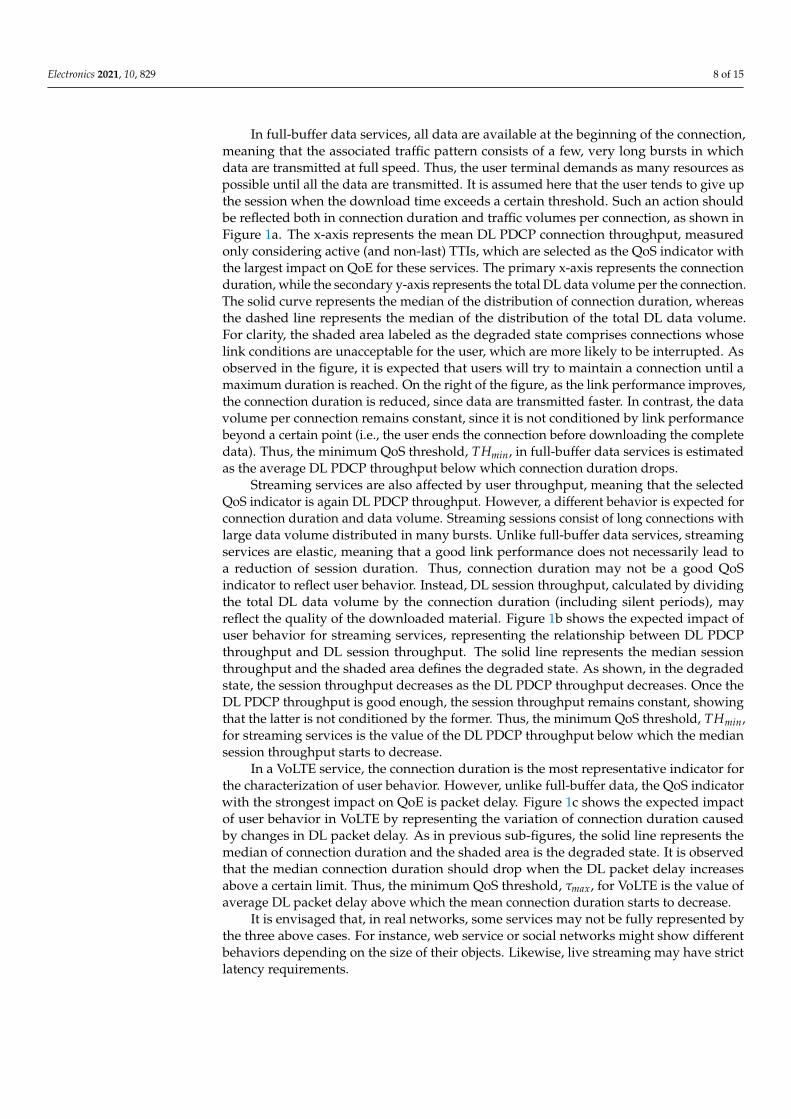
Figure 2 shows the analysis for full-buffer data services. Each point in the figurerepresents a connection labeled as full-buffer data service. The solid line represents themedian connection duration, CD( f b)
median, and the dashed line represents the median DL
data volume, V( f b)DLmedian
. The throughput axis is adjusted to low values (below 10 Mbps)to better identify the boundary between the two states specified in Figure 1a. The resultsconfirm the expected impact of user behavior, since, for a low DL PDCP throughput, theDL data volume decreases and the connection duration stagnates. The minimum QoSthreshold can be determined as the TH( f b)
PDCP,DL value that causes CD( f b)median to drop and
V( f b)DLmedian
to remain constant. From the figure, the estimated threshold for this service is
TH( f b)PDCP,DLmin
= 5 Mbps.
0
1500
3000
4500
0
5
10
15
20
25
1 10
DL
ata
lum
e[k
Byte
s]d
vo
C[s
]onnecti
on
dura
tion
Throughput [Mbps]PDCP, DL
2 3 4 5 6 7 8 9
Median onnection urationc d
Median DL ata olumed v
Figure 2. Quality of Service (QoS) and traffic indicators for full-buffer data services.
Electronics 2021, 10, 829 10 of 15
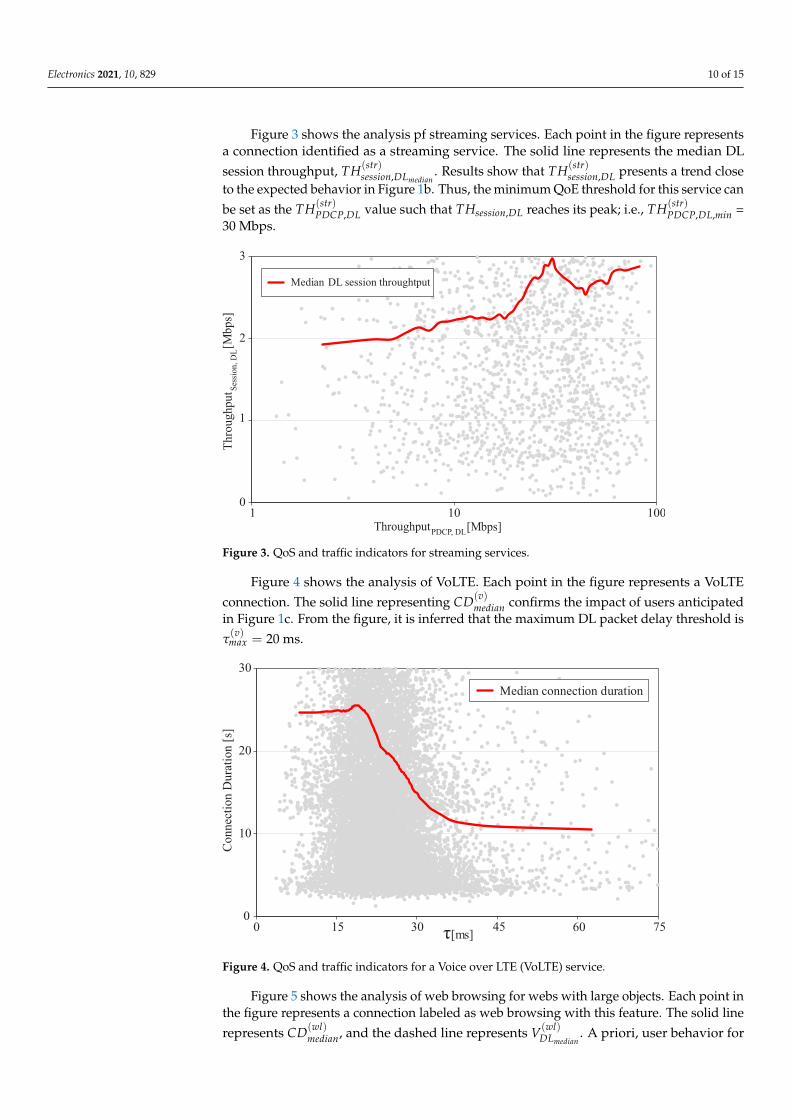
Figure 3 shows the analysis pf streaming services. Each point in the figure representsa connection identified as a streaming service. The solid line represents the median DLsession throughput, TH(str)
session,DLmedian. Results show that TH(str)
session,DL presents a trend closeto the expected behavior in Figure 1b. Thus, the minimum QoE threshold for this service canbe set as the TH(str)
PDCP,DL value such that THsession,DL reaches its peak; i.e., TH(str)PDCP,DL,min =
30 Mbps.
0
1
2
3
1 10 100
Thro
ughput
Median hroughtputDL session t
Throughput [Mbps]PDCP, DL
[Mb
ps]
Ses
sio
n,
DL
Figure 3. QoS and traffic indicators for streaming services.
Figure 4 shows the analysis of VoLTE. Each point in the figure represents a VoLTEconnection. The solid line representing CD(v)
median confirms the impact of users anticipatedin Figure 1c. From the figure, it is inferred that the maximum DL packet delay threshold isτ(v)max = 20 ms.
0
10
20
30
Co
nn
ecti
on
Du
rati
on
[s]
Median onnection urationc d
0 15 30 45 60 75τ[ms]
Figure 4. QoS and traffic indicators for a Voice over LTE (VoLTE) service.
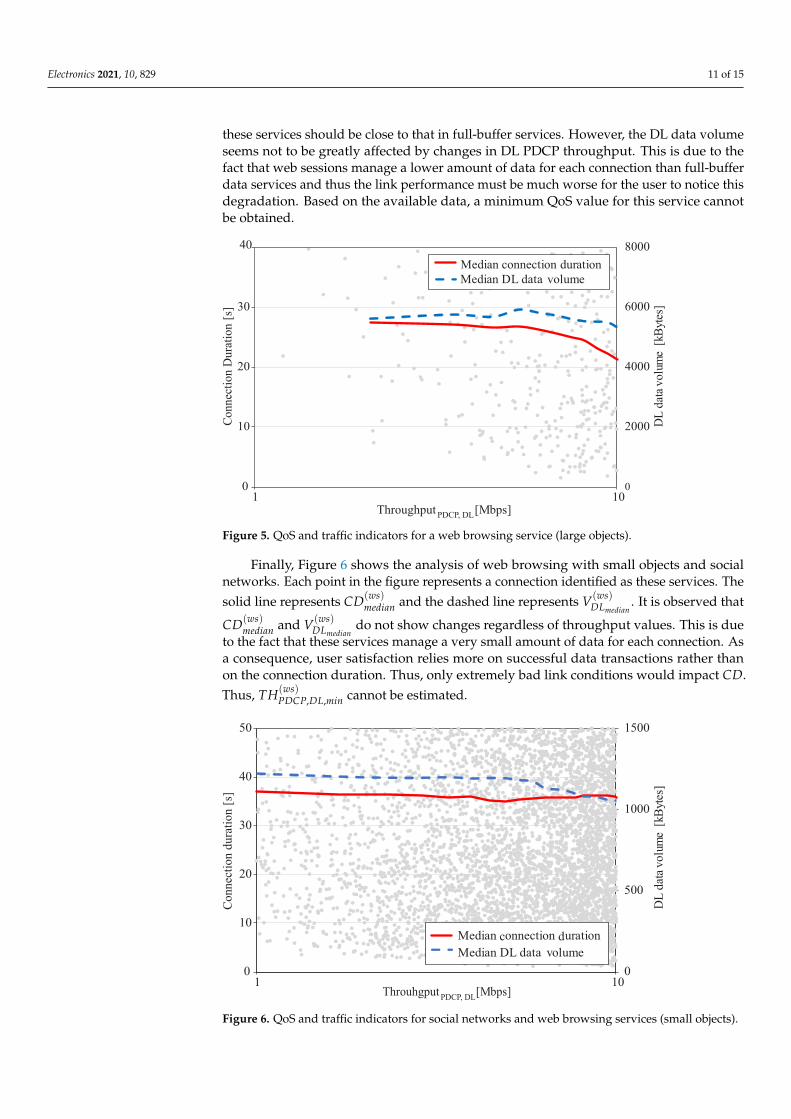
Figure 5 shows the analysis of web browsing for webs with large objects. Each point inthe figure represents a connection labeled as web browsing with this feature. The solid linerepresents CD(wl)
median, and the dashed line represents V(wl)DLmedian
. A priori, user behavior for
Electronics 2021, 10, 829 11 of 15
these services should be close to that in full-buffer services. However, the DL data volumeseems not to be greatly affected by changes in DL PDCP throughput. This is due to thefact that web sessions manage a lower amount of data for each connection than full-bufferdata services and thus the link performance must be much worse for the user to notice thisdegradation. Based on the available data, a minimum QoS value for this service cannotbe obtained.
0
2000
4000
6000
8000
0
10
20
30
40
1 10
DL
ata
olu
me
[kB
ytes
]d
v
C[s
]o
nn
ecti
on
Du
rati
on
Throughput
Median onnection urationc d
Median DL ata olumed v
[Mbps]PDCP, DL
Figure 5. QoS and traffic indicators for a web browsing service (large objects).
Finally, Figure 6 shows the analysis of web browsing with small objects and socialnetworks. Each point in the figure represents a connection identified as these services. Thesolid line represents CD(ws)
median and the dashed line represents V(ws)DLmedian
. It is observed that
CD(ws)median and V(ws)
DLmediando not show changes regardless of throughput values. This is due
to the fact that these services manage a very small amount of data for each connection. Asa consequence, user satisfaction relies more on successful data transactions rather thanon the connection duration. Thus, only extremely bad link conditions would impact CD.Thus, TH(ws)
PDCP,DL,min cannot be estimated.
0
500
1000
1500
0
10
20
30
40
50
1 10
DL
ata
olu
me
[kB
ytes
]d
v
C[s
]o
nn
ecti
on
du
rati
on
Throuhgput [Mbps]PDCP, DL
Median onnection urationc d
Median DL ata olumed v
Figure 6. QoS and traffic indicators for social networks and web browsing services (small objects).
Electronics 2021, 10, 829 12 of 15
5.3. Implementation Issues
The method is designed as a centralized scheme that can be integrated into OSSplatforms. Due to its simplicity, its computational load is relatively low. The theoreticaltime complexity increases linearly with the number of analyzed connection traces. Inpractice, the most time-consuming process is trace pre-processing, which can be done bytrace processing tools provided by OSS vendors and the classification process, which isperformed by using an unsupervised algorithm and can be implemented, along with therest of the method, in any programming language (in this work, Matlab [42]). Specifically,the total execution time for the considered datasets in a 2.6-GHz quad-core processor laptopis less than 5462 s (92 s per 1000 connections).
6. Conclusions
In this paper, a novel automatic method for estimating QoS thresholds to be integratedin user utility functions on a per-service basis in an LTE system is proposed. The methodrelies on the collection of radio connection traces. In the first stage, connection tracesare classified into application groups based on QCI and traffic descriptors registered perconnection. Then, a minimum QoS threshold is inferred on a per-service basis by analyzingthe QoS indicator with the largest impact on user experience and the traffic indicator thatbest reflects user behavior. The method has been tested with traces taken from live LTEnetworks, resulting in a minimum DL user throughput of 5 Mbps for full-buffer dataservices, 30 Mbps for streaming services and a maximum DL packet delay of 20 ms forVoIP services. The proposed data-driven method can be fully automated, eliminating theneed for time-consuming subjective tests. Likewise, it can deal with the large diversityof system and human factors, which cannot be taken into account in lab environments.Due to its low computational load, it can be executed periodically to track changes in usertrends. Additional analysis can be extended to 5G and broadband Internet satellite systemsto check the impact of network capabilities on general user behavior.
Author Contributions: The contributions of authors are as follows: Conceptualization, A.J.G., M.T.and S.L.-R.; methodology, A.J.G. and M.T.; software, A.J.G. and M.T.; validation, A.J.G. and M.T.;formal analysis, A.J.G.; investigation, A.J.G. and M.T.; resources, M.T. and S.L.-R.; data curation, A.J.G.and C.G.; writing—original draft preparation, A.J.G.; writing—review and editing, M.T. and S.L.-R.;visualization, A.J.G.; supervision, M.T. and S.L.-R.; project administration, M.T. and S.L.-R.; fundingacquisition, M.T. All authors have read and agreed to the published version of the manuscript.
Funding: This work has been funded by the Spanish Ministry of Science, Innovation and Universities(RTI2018-099148-BI00), the Junta de Andalucía (UMA18-FEDERJA256) and Ericsson Spain.
Data Availability Statement: Restrictions apply to the availability of these data. Data were obtainedfrom Ericsson Spain and are available from A.J.G. with the permission of Ericsson Spain.
Conflicts of Interest: The authors declare no conflict of interest.
AbbreviationsThe following abbreviations are used in this manuscript:
BDA Big Data AnalyticsCDR Charge Data RecordCEM Customer Experience ManagementCM Configuration ManagementCRM Customer Relationship ManagementCTF Configuration Trace FileCTR Cell Traffic RecordingDL Downlink
Electronics 2021, 10, 829 13 of 15
DTF Data Trace FileeNB evolved Nodes BIMSI International Mobile Subscriber IdentityIoT Internet of ThingsKPI Key Performance IndicatorLTE Long Term EvolutionMAC Medium Access ControlML Machine LearningMOS Mean Opinion ScorePM Performance ManagementOSS Operations Support SystemPDCP Packet Data Control ProtocolQCI QoS Class IdentifierQoE Quality of ExperienceQoS Quality of ServiceRLC Radio Link ControlROP Reporting Output PeriodRRC Radio Resource ControlTTI Transmission Time IntervalUE User EquipmentUETR User Equipment Traffic RecordingUL UplinkVoIP Voice over IPVoLTE Voice over LTE
References1. Cisco Systems Inc. Cisco Visual Networking Index: Global Mobile Data Traffic Forecast Update, 2017–2022. Available online:
https://s3.amazonaws.com/media.mediapost.com/uploads/CiscoForecast.pdf (accessed on 29 March 2021).2. Hossain, E.; Hasan, M. 5G cellular: key enabling technologies and research challenges. IEEE Instrum. Meas. Mag. 2015, 18, 11–21.
[CrossRef]3. Sesia, S.; Toufik, I.; Baker, M. LTE-the UMTS Long Term Evolution: From Theory to Practice; John Wiley & Sons: Hoboken, NJ,
USA, 2011.4. Liotou, E.; Tsolkas, D.; Passas, N.; Merakos, L. Quality of experience management in mobile cellular networks: Key issues and
design challenges. IEEE Commun. Mag. 2015, 53, 145–153. [CrossRef]5. Gupta, A.; Jha, R.K. A survey of 5G network: Architecture and emerging technologies. IEEE Access 2015, 3, 1206–1232. [CrossRef]6. Imran, A.; Zoha, A.; Abu-Dayya, A. Challenges in 5G: how to empower SON with big data for enabling 5G. IEEE Netw. 2014,
28, 27–33. [CrossRef]7. Banerjee, A. Revolutionizing CEM with Subscriber-Centric Network Operations and QoE Strategy. Available online: http:
//www.accantosystems.com/wp-content/uploads/2016/10/Heavy-Reading-Accanto-Final-Aug-2014.pdf (accessed on 29March 2021).
8. Barakovic, S.; Skorin-Kapov, L. Survey and challenges of QoE management issues in wireless networks. J. Comput. Netw. Commun.2013, 2013, 165146. [CrossRef]
9. Jin, H.; Su, L.; Chen, D.; Nahrstedt, K.; Xu, J. Quality of information aware incentive mechanisms for mobile crowd sensingsystems. In MobiHoc’15: Proceedings of the 16th ACM International Symposium on Mobile Ad Hoc Networking and Computing,Hangzhou, China, 22–25 June 2015; Association for Computing Machinery: New York, NY, USA, 2015.
10. Collange, D.; Costeux, J.L. Passive Estimation of Quality of Experience. J. UCS 2008, 14, 625–641.11. Brunnström, K.; Beker, S.A.; De Moor, K.; Dooms, A.; Egger, S.; Garcia, M.N.; Hossfeld, T.; Jumisko-Pyykkö, S.; Keimel, C.;
Larabi, M.C.; et al. Qualinet White Paper on Definitions of Quality of Experience. Available online: https://hal.archives-ouvertes.fr/hal-00977812 (accessed on 29 March 2021).
12. Li, Y.; Kim, K.H.; Vlachou, C.; Xie, J. Bridging the data charging gap in the cellular edge. In SIGCOMM’19: Proceedings of the ACMSpecial Interest Group on Data Communication, Beijing, China, 19–23 August, 2019; Association for Computing Machinery: New York,NY, USA, 2019.
13. Wang, J.; Zheng, Y.; Ni, Y.; Xu, C.; Qian, F.; Li, W.; Jiang, W.; Cheng, Y.; Cheng, Z.; Li, Y.; et al. An active-passive measurementstudy of tcp performance over lte on high-speed rails. In Proceedings of the 25th Annual International Conference on MobileComputing and Networking, Los Cabos, Mexico, 21–25 October 2019; pp. 1–16.
14. Hori, T.; Ohtsuki, T. QoE and throughput aware radio resource allocation algorithm in LTE network with users using differentapplications. In Proceedings of the 2016 IEEE 27th Annual International Symposium on Personal, Indoor, and Mobile RadioCommunications (PIMRC), Valencia, Spain, 4–8 September 2016; pp. 1–6.
15. Reichl, P.; Tuffin, B.; Schatz, R. Logarithmic laws in service quality perception: where microeconomics meets psychophysics andquality of experience. Telecommun. Syst. 2013, 52, 587–600. [CrossRef]
16. Fiedler, M.; Hossfeld, T.; Tran-Gia, P. A generic quantitative relationship between quality of experience and quality of service.IEEE Netw. 2010, 24, 36–41. [CrossRef]
17. Casas, P.; Seufert, M.; Schatz, R. YOUQMON: A system for on-line monitoring of YouTube QoE in operational 3G networks.ACM Sigmetrics Perform. Eval. Rev. 2013, 41, 44–46. [CrossRef]
18. Baer, A.; Casas, P.; D’Alconzo, A.; Fiadino, P.; Golab, L.; Mellia, M.; Schikuta, E. DBStream: A holistic approach to large-scalenetwork traffic monitoring and analysis. Comput. Netw. 2016, 107, 5–19. [CrossRef]
19. Skorin-Kapov, L.; Varela, M.; Hoßfeld, T.; Chen, K.T. A survey of emerging concepts and challenges for QoE management ofmultimedia services. ACM Trans. Multimed. Comput. Commun. Appl. (TOMM) 2018, 14, 1–29. [CrossRef]
20. Oliver-Balsalobre, P.; Toril, M.; Luna-Ramírez, S.; Avilés, J.M.R. Self-tuning of scheduling parameters for balancing the quality ofexperience among services in LTE. EURASIP J. Wirel. Commun. Netw. 2016, 2016, 1–12. [CrossRef]
21. Baldo, N.; Giupponi, L.; Mangues-Bafalluy, J. Big data empowered self organized networks. In Proceedings of the EuropeanWireless 2014: 20th European Wireless Conference, Barcelona, Spain, 14–16 May 2014; pp. 1–8.
22. Witten, I.H.; Frank, E.; Mark, A.; Hall, M.A. Data Mining: Practical machine learning tools and techniques. Morgan KaufmannBurlingt. MA 2011, 10, 1972514.
23. Nokia Siemens Networks. Quality of Experience (QoE) of Mobile Services: Can It be Measured and Improved. Availableonline: https://docplayer.net/25986899-White-paper-quality-of-experience-qoe-of-mobile-services-can-it-be-measured-and-improved.html (accessed on 29 March 2021).
24. Fiedler, M.; Chevul, S.; Radtke, O.; Tutschku, K.; Binzenhöfer, A. The network utility function: a practicable concept for assessingnetwork impact on distributed services. In Proceedings of the 19th International Teletraffic Congress (ITC19), Beijing, China,29 August–2 September 2005.
25. Navarro-Ortiz, J.; Lopez-Soler, J.M.; Stea, G. Quality of experience based resource sharing in IEEE 802.11 e HCCA. In Proceedingsof the 2010 European Wireless Conference (EW), Lucca, Italy, 12–15 April 2010; pp. 454–461.
26. 3GPP. TS25.331, Technical Specification Group Radio Access Network; Radio Resource Control (RRC); Protocol specifica-tion; V11.4.0, Rel-11. Available online: https://portal.3gpp.org/desktopmodules/Specifications/SpecificationDetails.aspx?specificationId=1180 (accessed on 29 March 2021).
27. 3GPP. TS36.413, Technical Specification Group Radio Access Network; Evolved Universal Terrestrial Radio Access Network(E-UTRAN); S1 Application Protocol (S1AP); V8.4.0, Rel-8. Available online: https://portal.3gpp.org/desktopmodules/Specifications/SpecificationDetails.aspx?specificationId=2446 (accessed on 29 March 2021).
28. 3GPP. TS36.423, Technical Specification Group Radio Access Network; Evolved Universal Terrestrial Radio Access Network(E-UTRAN); X2 Application Protocol (X2AP); V9.2.0, Rel-9. Available online: https://portal.3gpp.org/desktopmodules/Specifications/SpecificationDetails.aspx?specificationId=2452 (accessed on 29 March 2021).
29. 3GPP. TS32.423, Digital Cellular telecommunications system (Phase 2+); Universal Mobile Telecommunications System (UMTS);LTE; Telecommunication Management; Subscriber and Equipment Trace; Trace Data Definition and Management; V10.5.0, Rel-10. Available online: https://portal.3gpp.org/desktopmodules/Specifications/SpecificationDetails.aspx?specificationId=2010(accessed on 29 March 2021).
30. 3GPP. TS32.421, Telecommunication Management; Subscriber and Equipment Trace; Trace Concepts and Requirements; V6.7.0,Rel-6. Available online: https://portal.3gpp.org/desktopmodules/Specifications/SpecificationDetails.aspx?specificationId=2008(accessed on 29 March 2021).
31. Sánchez, P.A.; Luna-Ramírez, S.; Toril, M.; Gijón, C.; Bejarano-Luque, J.L. A data-driven scheduler performance model for QoEassessment in a LTE radio network planning tool. Comput. Netw. 2020, 173, 107186. [CrossRef]
32. Ekstrom, H. QoS control in the 3GPP evolved packet system. IEEE Commun. Mag. 2009, 47, 76–83. [CrossRef]33. 3GPP. TS23.203, Technical Specification Group Services and System Aspects; Policy and Charging Control Architecture; V13.7.0,
Rel-13. Available online: https://portal.3gpp.org/desktopmodules/Specifications/SpecificationDetails.aspx?specificationId=810(accessed on 29 March 2021).
34. Palmieri, F.; Fiore, U. A nonlinear, recurrence-based approach to traffic classification. Comput. Netw. 2009, 53, 761–773. [CrossRef]35. Nguyen, T.T.; Armitage, G. A survey of techniques for internet traffic classification using machine learning. IEEE Commun. Surv.
Tutorials 2008, 10, 56–76. [CrossRef]36. García, A.J.; Toril, M.; Oliver, P.; Luna-Ramírez, S.; García, R. Big data analytics for automated QoE management in mobile
networks. IEEE Commun. Mag. 2019, 57, 91–97. [CrossRef]37. Taylor, V.F.; Spolaor, R.; Conti, M.; Martinovic, I. Appscanner: Automatic fingerprinting of smartphone apps from encrypted
network traffic. In Proceedings of the 2016 IEEE European Symposium on Security and Privacy (EuroS&P), Saarbruecken,Germany, 21–24 March 2016; pp. 439–454.
38. Gijón, C.; Toril, M.; Solera, M.; Luna-Ramírez, S.; Jiménez, L.R. Encrypted Traffic Classification Based on Unsupervised Learningin Cellular Radio Access Networks. IEEE Access 2020, 8, 167252–167263. [CrossRef]
39. Jiménez, L.R. Web Page Classification based on Unsupervised Learning using MIME type Analysis. In Proceedings of the2021 International Conference on COMmunication Systems & NETworkS (COMSNETS), Bangalore, India, 5–9 January 2021;pp. 375–377.
40. Jiménez, L.R.; Solera, M.; Toril, M. A network-layer QoE model for YouTube live in wireless networks. IEEE Access 2019,7, 70237–70252. [CrossRef]
41. Na, S.; Yoo, S. Allowable propagation delay for VoIP calls of acceptable quality. In International Workshop on Advanced InternetServices and Applications; Springer: Berlin/Heidelberg, Germany, 2002; pp. 47–55.
42. MathWorks. Matlab. Available online: https://www.mathworks.com/products/matlab.html (accessed on 10 November 2020).