Data-Driven Dialogue Practical Strategies for Collaborative Inquiry Wisconsin Summit for Data-Informed Leadership March 2, 2016 Developed by Bruce Wellman and Laura Lipton Co-directors, MiraVia, LLC Bruce Wellman 229 Colyer Road, Guilford, VT 05301 USA p: 802-257-4892, f: 802-257-2403, e-mail: [email protected]Twitter: @brucewellman Laura Lipton 236 Lucy's Lane, Charlotte, VT 05445 USA p: 860-425-6483, f; 802-329-2341 e-mail: [email protected]
Transcript
Data-Driven DialoguePractical Strategies for Collaborative Inquiry
Wisconsin Summit for Data-Informed Leadership
March 2, 2016
Developed byBruce Wellman and Laura Lipton
Co-directors, MiraVia, LLC
Bruce Wellman229 Colyer Road, Guilford, VT 05301 USA
2 Copyright 2016 • Bruce Wellman & Laura Lipton, MiraVia LLC • All rights reserved
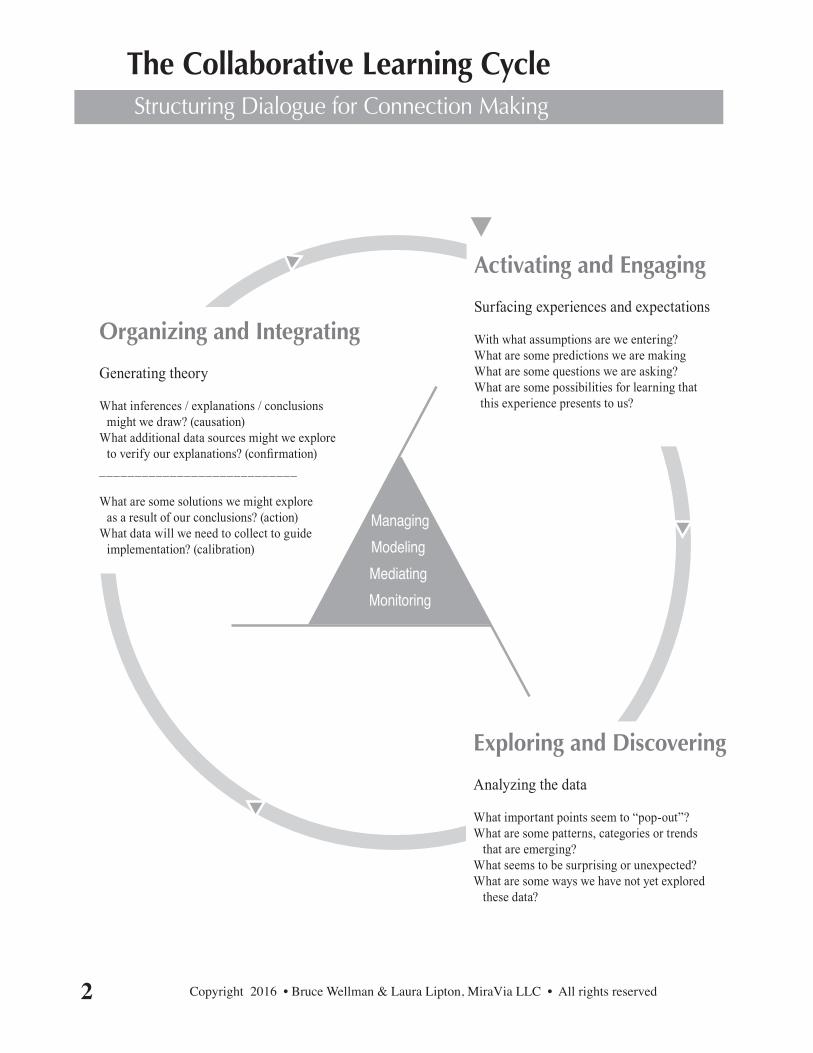
The Collaborative Learning CycleStructuring Dialogue for Connection Making
ManagingModelingMediating
Monitoring
Exploring and Discovering
Analyzing the data
What important points seem to “pop-out”?What are some patterns, categories or trends that are emerging?What seems to be surprising or unexpected?What are some ways we have not yet explored these data?
Organizing and Integrating
Generating theory
What inferences / explanations / conclusions might we draw? (causation)What additional data sources might we explore to verify our explanations? (confirmation)____________________________
What are some solutions we might explore as a result of our conclusions? (action)What data will we need to collect to guide
implementation? (calibration)
Activating and Engaging
Surfacing experiences and expectations
With what assumptions are we entering?What are some predictions we are makingWhat are some questions we are asking?What are some possibilities for learning that this experience presents to us?
3 Copyright 2016 • Bruce Wellman & Laura Lipton, MiraVia LLC • All rights reserved
The Collaborative Learning CycleProductive discourse requires shape and structure. Thoughtfully designed processes increase focus, minimize distractions, and deepen exploration and analysis of data. Without such processes, group work disintegrates into excessive storytelling, over-certain and over-sold solutions, and premature rush to action spearheaded by just a few members of the group.
The collaborative learning cycle is a framework that establishes a learning forum for group exploration of data. Structured engagement with information and fellow learners ignites the processes of collaborative inquiry and problem solving. This inquiry-driven approach promotes specific cognitive processes and group member interaction in three phases.
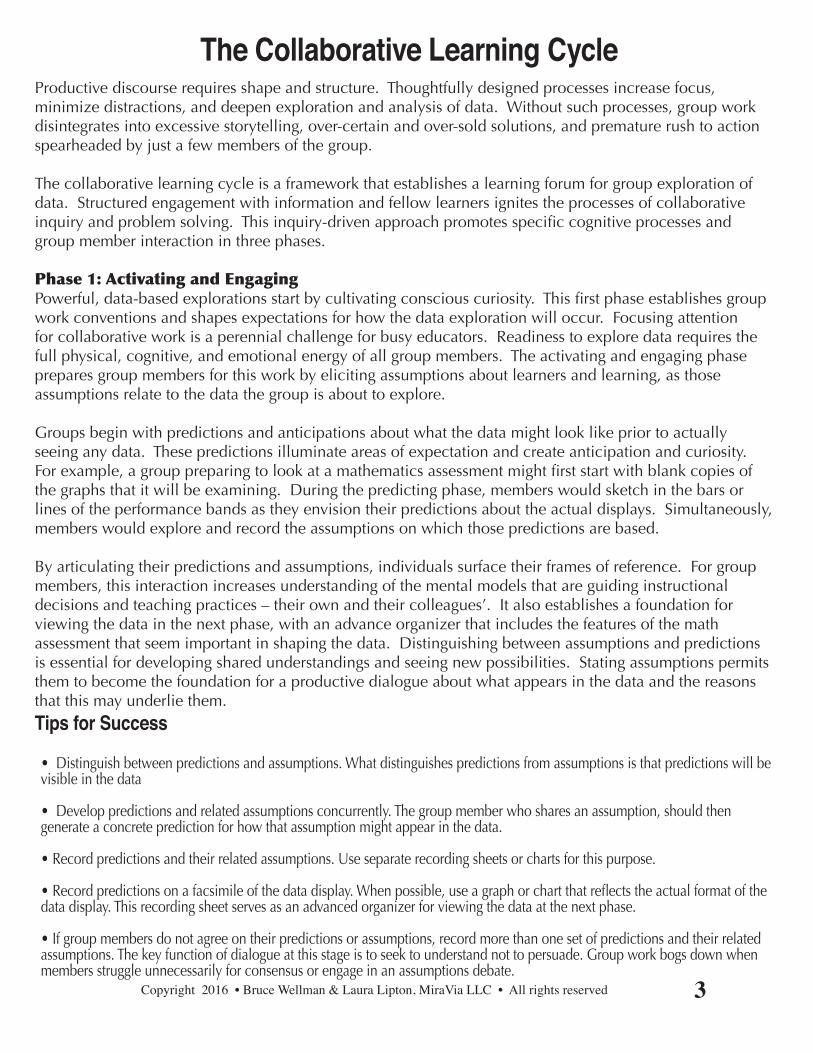
Phase 1: Activating and EngagingPowerful, data-based explorations start by cultivating conscious curiosity. This first phase establishes group work conventions and shapes expectations for how the data exploration will occur. Focusing attention for collaborative work is a perennial challenge for busy educators. Readiness to explore data requires the full physical, cognitive, and emotional energy of all group members. The activating and engaging phase prepares group members for this work by eliciting assumptions about learners and learning, as those assumptions relate to the data the group is about to explore.
Groups begin with predictions and anticipations about what the data might look like prior to actually seeing any data. These predictions illuminate areas of expectation and create anticipation and curiosity. For example, a group preparing to look at a mathematics assessment might first start with blank copies of the graphs that it will be examining. During the predicting phase, members would sketch in the bars or lines of the performance bands as they envision their predictions about the actual displays. Simultaneously, members would explore and record the assumptions on which those predictions are based.
By articulating their predictions and assumptions, individuals surface their frames of reference. For group members, this interaction increases understanding of the mental models that are guiding instructional decisions and teaching practices – their own and their colleagues’. It also establishes a foundation for viewing the data in the next phase, with an advance organizer that includes the features of the math assessment that seem important in shaping the data. Distinguishing between assumptions and predictions is essential for developing shared understandings and seeing new possibilities. Stating assumptions permits them to become the foundation for a productive dialogue about what appears in the data and the reasons that this may underlie them.
Tips for Success
• Distinguish between predictions and assumptions. What distinguishes predictions from assumptions is that predictions will be visible in the data
• Develop predictions and related assumptions concurrently. The group member who shares an assumption, should then generate a concrete prediction for how that assumption might appear in the data.
• Record predictions and their related assumptions. Use separate recording sheets or charts for this purpose.
• Record predictions on a facsimile of the data display. When possible, use a graph or chart that reflects the actual format of the data display. This recording sheet serves as an advanced organizer for viewing the data at the next phase.
• If group members do not agree on their predictions or assumptions, record more than one set of predictions and their related assumptions. The key function of dialogue at this stage is to seek to understand not to persuade. Group work bogs down when members struggle unnecessarily for consensus or engage in an assumptions debate.
4 Copyright 2016 • Bruce Wellman & Laura Lipton, MiraVia LLC • All rights reserved
Phase 2: Exploring and Discovering
Observing data skillfully requires thoughtful process, emotional control, and mental focus. Working with data should be a learning experience. To align with that intention, it is important to attend to careful structuring of the exploring and discovering phase. Purposeful uncertainty is the guiding mindset of this phase, which is the heart of collaborative inquiry. To embrace a spirit of exploration and discovery, groups must avoid jumping to premature conclusion and closure. To remain open to possibilities and fresh viewpoints, group members must stay with the data to explore multiple storylines. This is the phase of observing, noticing, distinguishing, sorting, comparing, and contrasting.
Whatever a group’s size, exploring and discovering require data teams of four or five members, each team working with shared, visually clear data displays. Larger working groups and too much data at one time lead to overload, generalization, and disengagement. During this phase, both data enthusiasts and data shy have their own challenges. For inclusive collaborative inquiry, the data enthusiasts need to act as resources, refraining from dominating their groups and interpreting data for other members. The data shy need the confidence to ask what they fear might be obvious questions about the data or the displays.
Tips for Success
• Provide time to orient to the data displays before talking. Two to three minutes of silence equalizes the opportunity for each group member to prepare for exploring the data. This pause honors the different pacing and processing needs of individuals and produces more balanced engagement.
• Develop a sequence for exploration and designate a starting point. When multiple data sets or complex displays are on view, agreement on initial talking points saves time and energy and maximizes momentum and focus.
• Apply structures and protocols to balance participation. Deliberately structuring group work increases engagement, focus and time efficiency. For example, assigning roles, such as recorder, process checker, materials manager, and timekeeper or providing individual thinking and writing time before talking ensures access to information and opportunity to contribute for each group member.
• Establish a public recording protocol. Create common charts or recording space for observations. Keep a separate chart for questions or comments that are ‘outside the phase’. For example, should conclusions or explanations surface, it is sometimes expedient to record them, rather than debate them. This process is also effective for questions that are not directly relevant to the data.
• Chart observations in language that is concise and specific. Each observation statement should communicate a single idea clearly and concisely. These statements should focus only on observable facts contained in the data without interpretation or inference. Relevant data terminology, such as mean, median, mode, range and distribution increases the precision of the observation.
5 Copyright 2016 • Bruce Wellman & Laura Lipton, MiraVia LLC • All rights reserved
Phase 3: Organizing and Integrating
Moving from observing to understanding and then to action planning requires skillful process in the organizing and integrating phase. This third phase of the collaborative learning cycle guides the transition to formal problem finding and solving as it builds a foundation for thoughtful and detailed planning processes. This phase takes place in two stages: causation and action. Group members need to be open to multiple interpretations as to why the data look the way they do, before developing any follow up plans. Most data sets do not tell a whole story. For any explanation of causal factors to be credible, the analysis must be thoughtful and based on multiple, rich sources of information. Therefore, this phase includes collecting and considering additional data that may be indicated by the theories of causation that emerge. Confirmation builds confidence and commitment to ultimate implementation plans. Multiple voices and perspectives serve the work in each stage of organizing and integrating.
Stage One: Causation. In this stage, groups generate potential theories of causation. “Why did we get these results? What caused these outcomes?” Often a group member’s theory of causation is based on personal experience. For example, staff developers may tend to suggest teacher knowledge and skill as contributing factors, and workshops as a solution. Curriculum experts tend to suggest that the prime factor is lack of fidelity to the curriculum design that contributes to disappointing results. As groups extend the dialogue, surfacing a variety of causal theories, and confirming them with additional data, the deeper factors or root causes of the data emerge.
Confidence in any selected theory of causation increases when additional data sources confirm and elaborate the nuances of the theory. For example, a sixth grade team working with an expository writing assessment that reflects low student performance might decide on several causal theories to explore: (1) the writing instruction is not appropriately balanced between narrative and expository writing, (2) the reading instruction is not appropriately balanced between fiction and nonfiction genres, (3) the specific skills of vocabulary and word choice are underdeveloped, and (4) teachers lack instructional repertoire for teaching expository writing. A subset of teachers from the team could then gather further data to clarify or confirm each of these theories to refine and enrich the theory of causation that will drive the team’s action planning.
Stage Two: Action. Once an analysis of multiple data sources confirms a potential theory of causation, the team develops an action plan to address the cause(s). For example, “Now that we’re pretty sure it’s a balance between narrative and expository focus in reading and writing, let’s develop some outcomes, instructional scaffolds, and resources that will represent a more suitable balance.”
Effective plans call for clear outcomes, measureable criteria for progress and success, necessary action steps, data-driven monitoring arrangements for determining progress and goal achievement, assignment of responsibilities, and projected timelines.
Effectively implementing the Organizing and Integrating phase of the learning cycle builds ownership of challenges and shared commitment to actions. It increases motivation for change in practice and program. Collective responsibility for student learning is a hallmark of improving schools.
6 Copyright 2016 • Bruce Wellman & Laura Lipton, MiraVia LLC • All rights reserved
Tips for Success
• Study success. Select an observation from the previous phase that reflects successful performance, such as an improvement trend, a high-level skill that stands out on a rubric or benchmark assessment, or a spike on a bar graph for a particular group of students. Develop causal theories for what might have produced that success.
• Generate multiple theories of causation. Use the five causal arenas as categories for stretching thinking in generating diverse explanations for observable results. Groups should intentionally develop theories in more than one area.
Causal Categories: • Curriculum • Instructional methods, materials and resources • Teacher knowledge, skills and dispositions • Student readiness (knowledge, skills and dispositions) • Infrastructure (time, space, student grouping, etc.)
• Seek calibrating data that are in existing archives. Given time and energy constraints, it is useful to look first to archival data to confirm, correct or clarify causal theories.
• Generate multiple theories of solution. There are no simple answers for complex problems. Successful improvement plans require multiple intervention points and interrelated approaches.
• Make sure goals are clear and measureable. It is useful to provide guidelines and criteria for goal setting to ensure that everyone understands and is ready to engage in a shared pursuit of excellence. One effective model is based on SMART goals (O’Neill & Conzemius, 2006). Smart goals are Specific, Measureable, Attainable, Results-oriented and Timebound.
7 Copyright 2016 • Bruce Wellman & Laura Lipton, MiraVia LLC • All rights reserved
Use this column to record definitions and summaries for each phase of the cycle.
Activating and Engaging
Exploring and Discovering
Organizing and Integrating
The Collaborative Learning Cycle
Save this space for use in the morning.
8 Copyright 2016 • Bruce Wellman & Laura Lipton, MiraVia LLC • All rights reserved
1. Identify something in your own work setting that you are interested in knowing more about. (A curriculum gap, an instructional gap, student skill deficit, student behavioral pattern, etc.)
ex: High school student skills with reading informational text
Your Issue:
2. To explore this issue craft examples of each of the following: • A problem statement: The problem is…..
ex: The problem is that students do not apply effective reading strategies to understand informational text.
• An hypothesis: If….. Then…..
ex: If students are presented with multiple opportunities for guided reading of informational texts then students will be more successful in transferring these skills to independent practice.
• A question: How are we doing with….?What are some differences between….. and….? Why do/does….? What are the most productive….?
ex: What are the essential differences between students who are skillful readers of informational text and those who are not?
Choosing Which Data to Collect
page 1 of 2
9 Copyright 2016 • Bruce Wellman & Laura Lipton, MiraVia LLC • All rights reserved
3. Determine which framing structure might be the most productive to explore (problem statement, hypothesis, or question). 4. Identify at least three data sources you might tap to gather additional information about your issue.
ex: 1. State/Provinicial and local reading assessment data. 2. Interview skillful teachers to determine which reading skills they deem to be the most essential. 3. Samples of students' written responses to informational text.
•
•
•
10 Copyright 2016 • Bruce Wellman & Laura Lipton, MiraVia LLC • All rights reserved
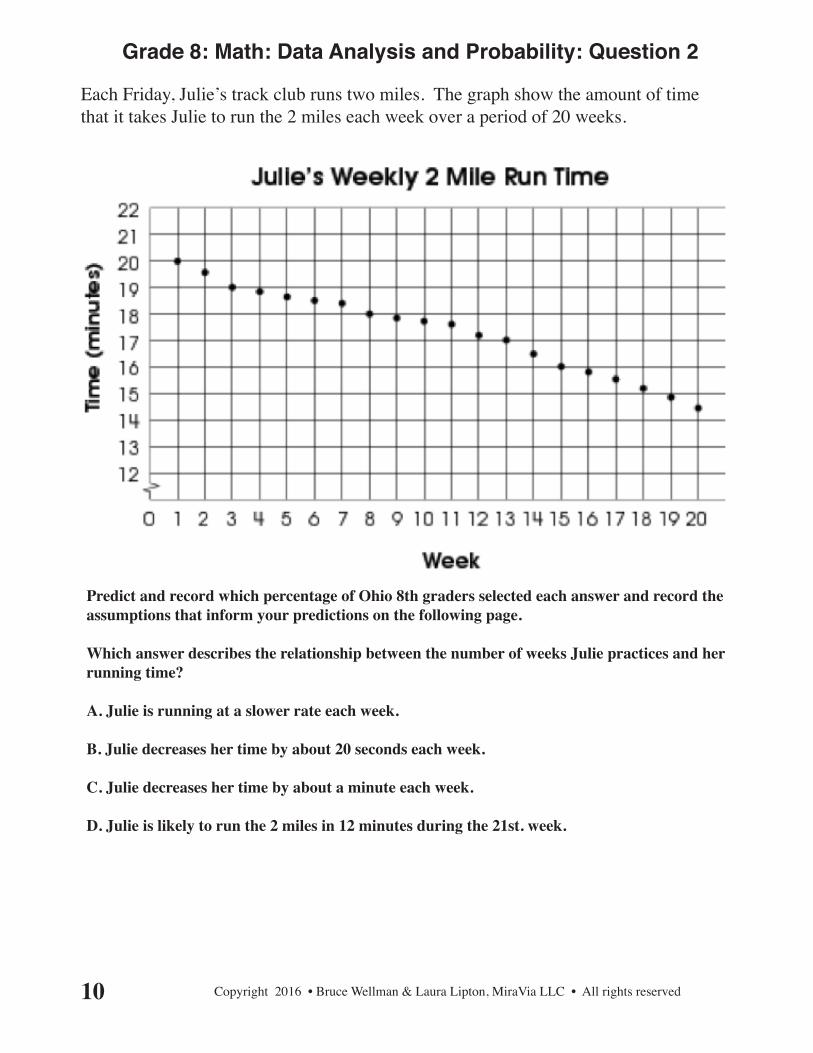
Grade 8: Math: Data Analysis and Probability: Question 2
Each Friday, Julie’s track club runs two miles. The graph show the amount of time that it takes Julie to run the 2 miles each week over a period of 20 weeks.
Predict and record which percentage of Ohio 8th graders selected each answer and record the assumptions that inform your predictions on the following page. Which answer describes the relationship between the number of weeks Julie practices and her running time?
A. Julie is running at a slower rate each week.
B. Julie decreases her time by about 20 seconds each week.
C. Julie decreases her time by about a minute each week.
D. Julie is likely to run the 2 miles in 12 minutes during the 21st. week.
11 Copyright 2016 • Bruce Wellman & Laura Lipton, MiraVia LLC • All rights reserved
Predictions & Assumptions
Your own
The group's
12 Copyright 2016 • Bruce Wellman & Laura Lipton, MiraVia LLC • All rights reserved
Theories of Causation
Circle one theory to test. In the space below, record at least three sources of data that you could use to confirm this theory.
Observation:
Use this space to record three possible theories of causation related to your observation:
1.
2.
3.
13 Copyright 2016 • Bruce Wellman & Laura Lipton, MiraVia LLC • All rights reserved
Theories of CausationBased on your learning in this session what might you: