Data Driven Policing: Data Driven Policing: Homicide Concentration Homicide Concentration and Distribution and Distribution Patterns in London Patterns in London Detective Superintendent Mark Jackson & Barak Ariel, PhD
Transcript
Data Driven Policing:Data Driven Policing:
Homicide Concentration and Homicide Concentration and Distribution Patterns in LondonDistribution Patterns in London
Detective Superintendent Mark Jackson&
Barak Ariel, PhD
All Homicide Offences (1st Apr 00 to 31st Mar 10)
• Is Homicide a random event in time?
• Is Homicide a random event in space?
• What are the possible links between homicide locations, offenders, victims and other factors, at the micro-place level?
Research Questions?
The stability of crime trends at places over time suggests a “strong coupling” of crime to place
David Weisburd, Cody W. Telep, Anthony A. Braga (2010). The Importance of Place in Policing: Empirical Evidence and Policy Recommendations. Bra Publications
Place-Based Criminology
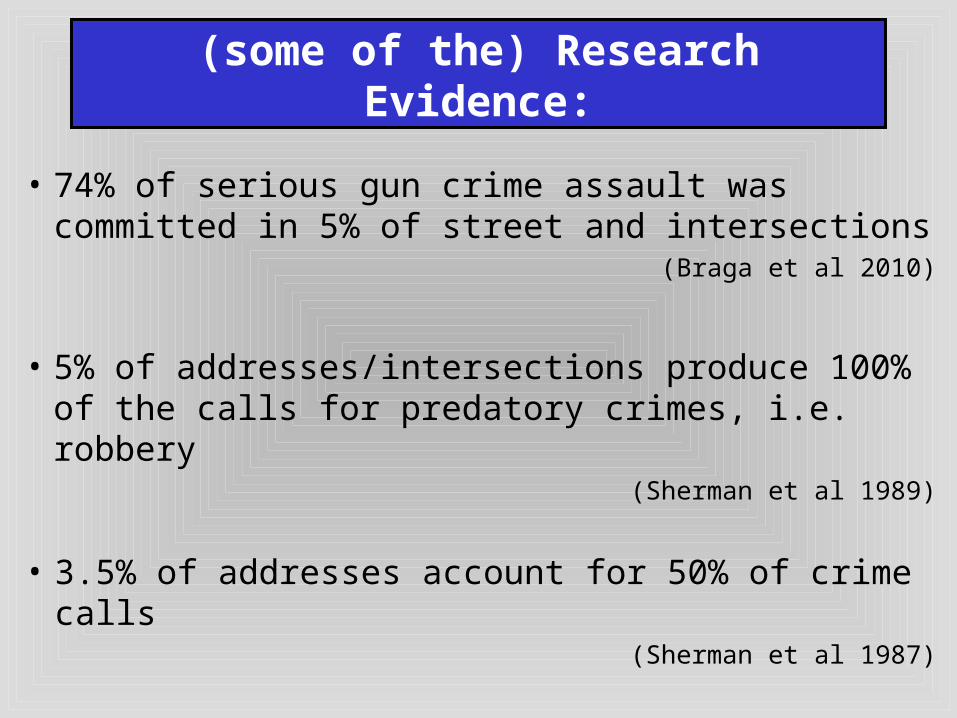
• 74% of serious gun crime assault was committed in 5% of street and intersections
(Braga et al 2010)
• 5% of addresses/intersections produce 100% of the calls for predatory crimes, i.e. robbery
(Sherman et al 1989)
• 3.5% of addresses account for 50% of crime calls (Sherman et al 1987)
(some of the) Research Evidence:
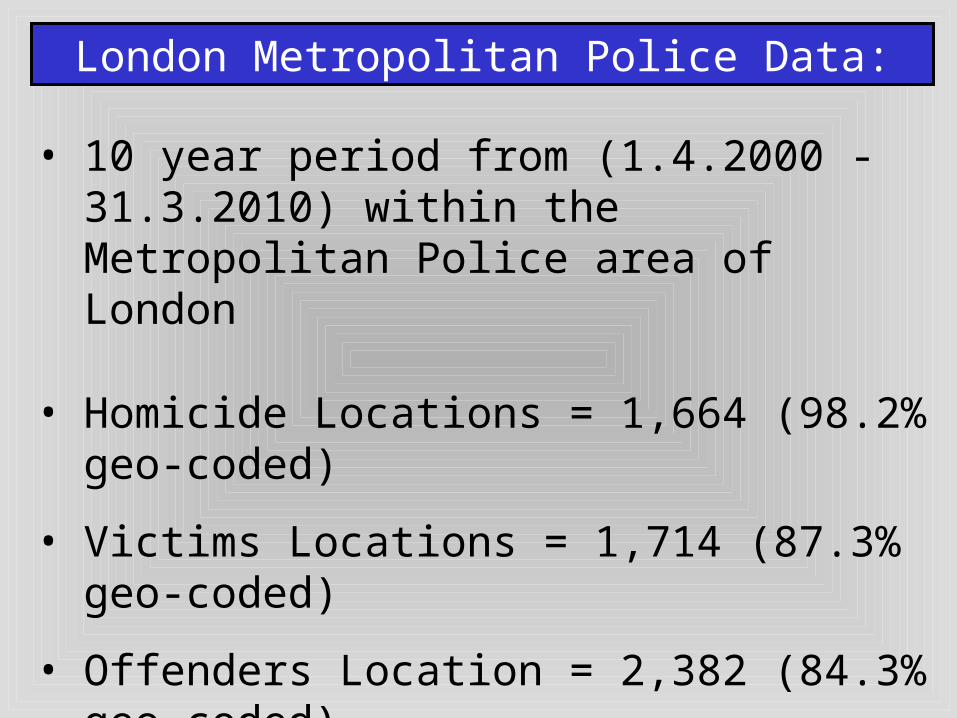
London Metropolitan Police Data:
• 10 year period from (1.4.2000 - 31.3.2010) within the Metropolitan Police area of London
• Homicide Locations = 1,664 (98.2% geo-coded)
• Victims Locations = 1,714 (87.3% geo-coded)
• Offenders Location = 2,382 (84.3% geo-coded)
• Socioeconomic Deprivation Measures for 4,760 LSOAs
Temporal Patterns
London Homicides (2000-2010) by Year (n=1,714)
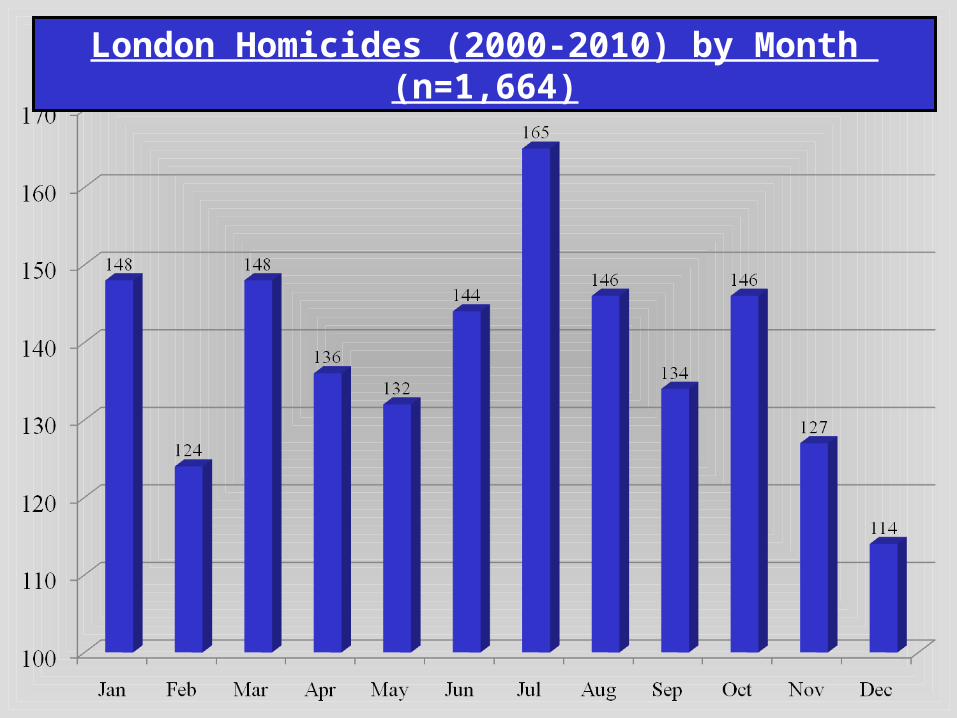
London Homicides (2000-2010) by Month (n=1,664)
London Homicides (2000-2010) by Day of Week (n=1,664)
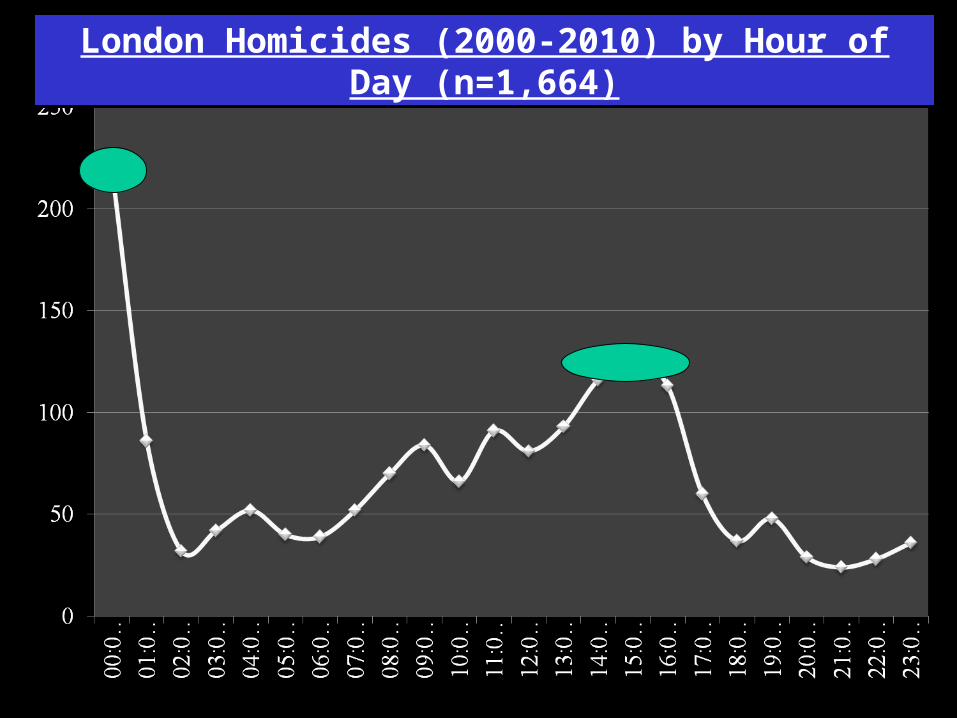
London Homicides (2000-2010) by Hour of Day (n=1,664)
Spatial Patterns
Homicide Offence locations by Borough
Offences by borough
100 to 125 (1)75 to 99 (5)50 to 74 (10)25 to 49 (10)1 to 24 (6)0 (1)
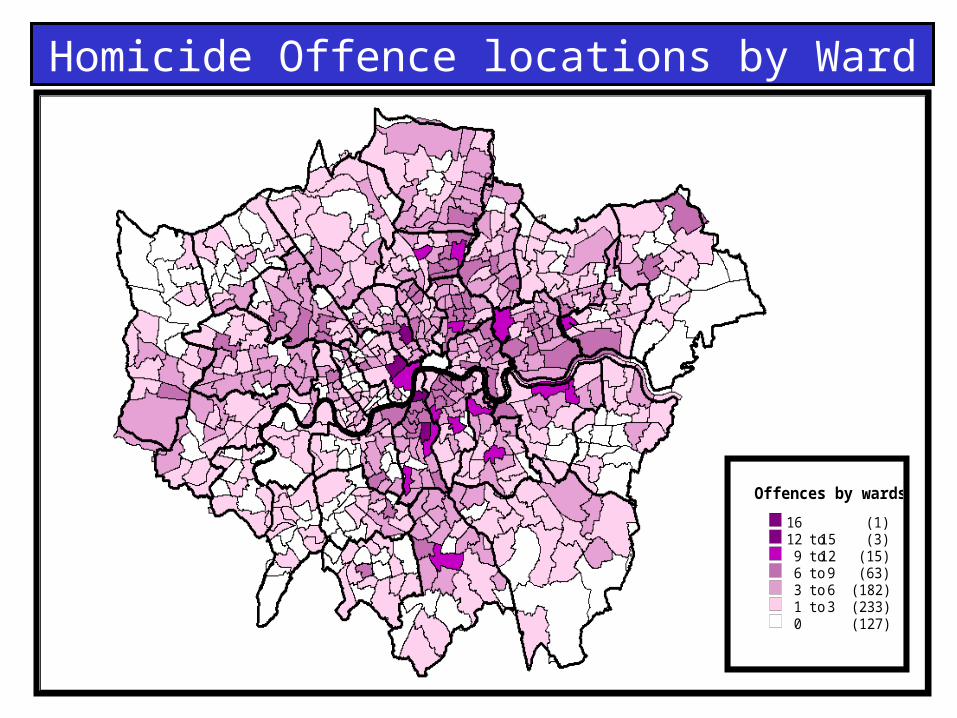
Homicide Offence locations by Ward
Offences by wards
16 (1)12 to 15 (3)9 to 12 (15)6 to 9 (63)3 to 6 (182)1 to 3 (233)0 (127)
Homicide Offence locations by LSOA
Or put it another way
Zero Homicides (1st Apr 00 to 31st Mar 10)
Homicide Offence locations in Westminster Wards
West End
St James
All Domestic Violence Homicides (1.4.00 to 31.3.10)
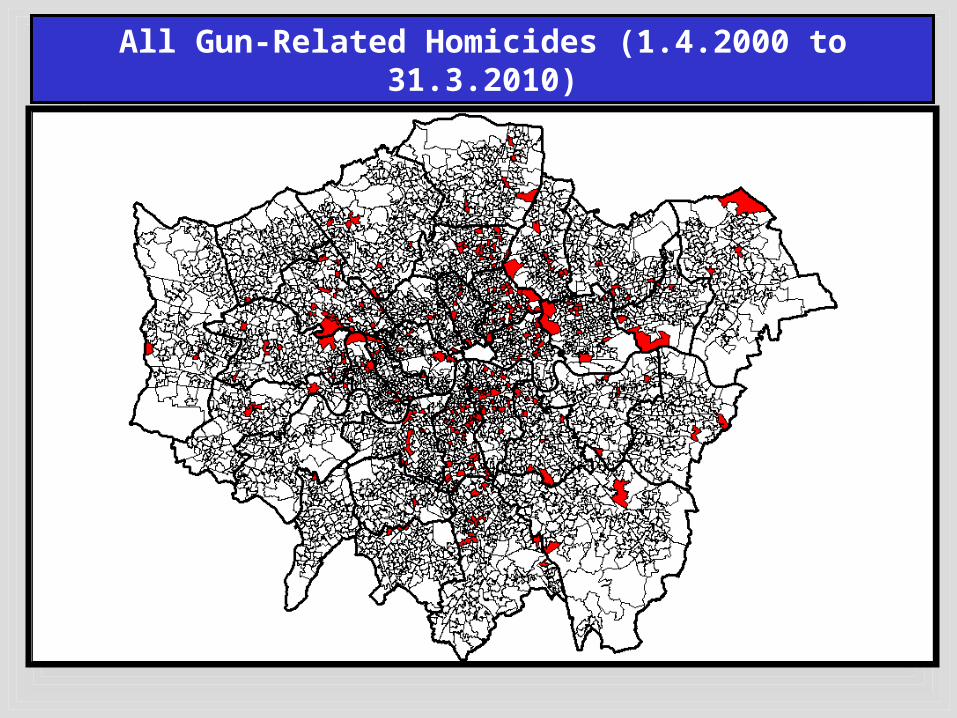
All Gun-Related Homicides (1.4.2000 to 31.3.2010)
All Knife-Related Homicides (1.4.2000 to 31.3.2010)
Connecting Homicide Places to People
at LSOA level
LSOA Characteristics
Greater
Metropolitan
City
LSOA
Homicide
Locations
LSOA
Victim
Locations
LSOA
Offender
Locations
N 4,760 1,240 1,202 1,386
Population size 7.1-7.4M 1,634 1,496 2,030
Mean N of persons 1,505-1,626 1,660 1,645 1,585
Area (Hectares) 32.9 31.4 27.4 39.4
Density rate per Hectare 84.1-90.8 93.4-101.7 97.7-105.9 69.2-73.1
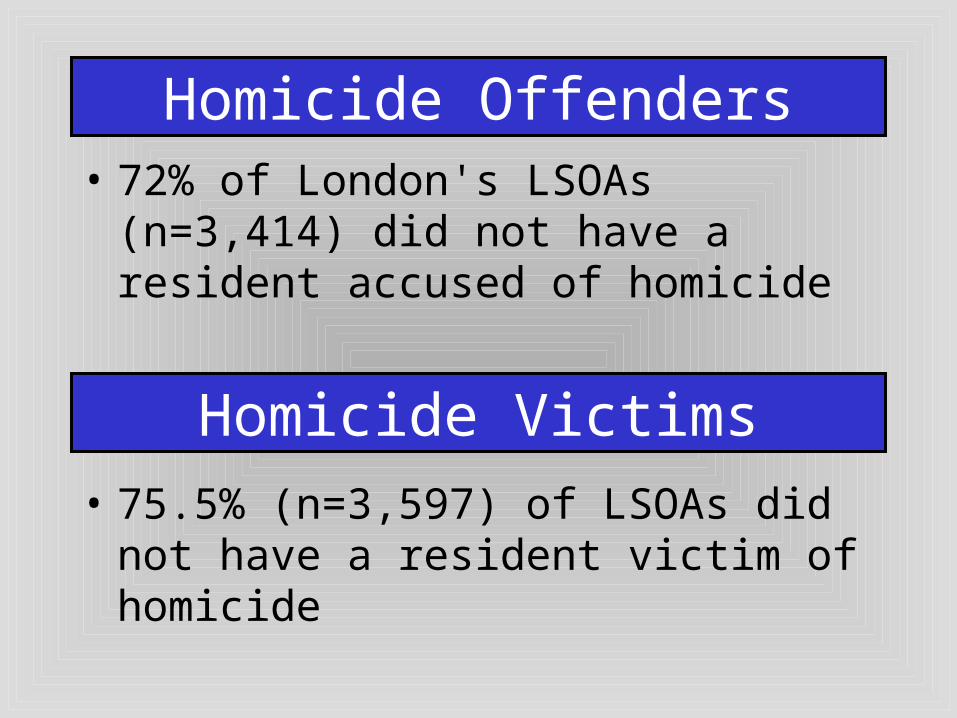
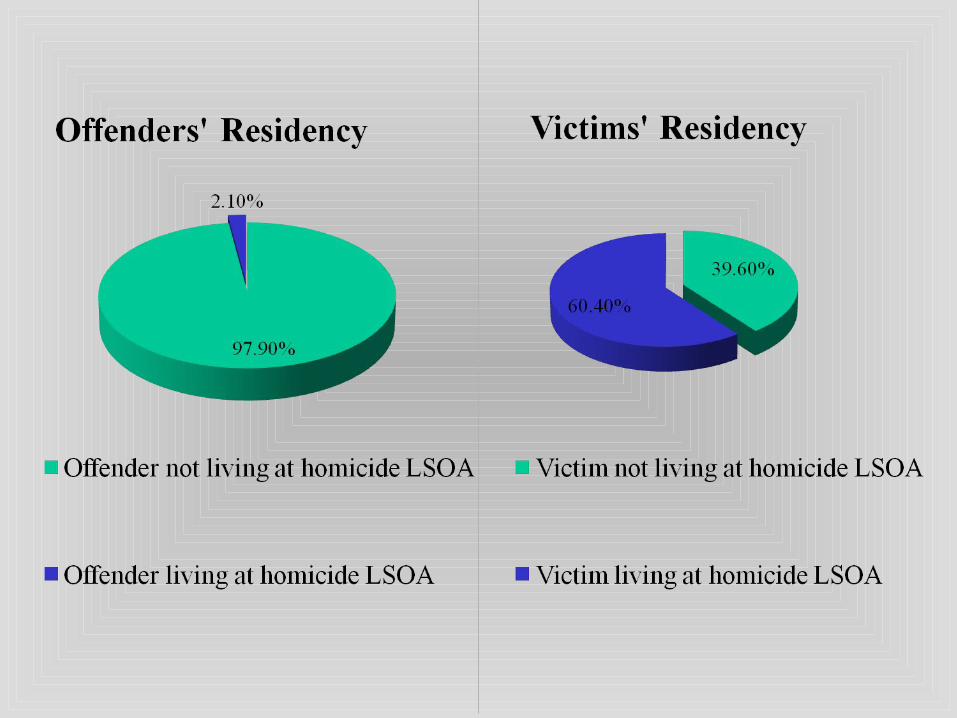
• 72% of London's LSOAs (n=3,414) did not have a resident accused of homicide
Homicide Offenders
• 75.5% (n=3,597) of LSOAs did not have a resident victim of homicide
Homicide Victims
• 6% of LSOAs contributed 42% of homicides over 10 year period
Concentrations of Homicide
• 9% of LSOAs contributed 53% of homicide offenders over 10 year period
Concentrations of Offenders
• 5% of LSOAs contributed 35% of homicide victims over 10 year period
Concentrations of Victims
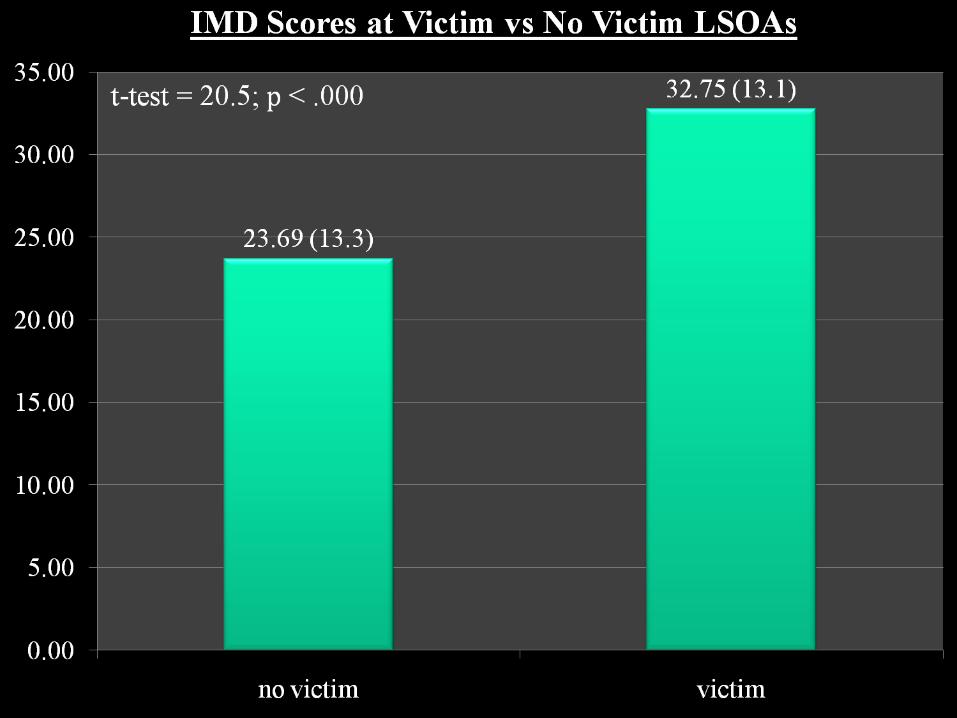
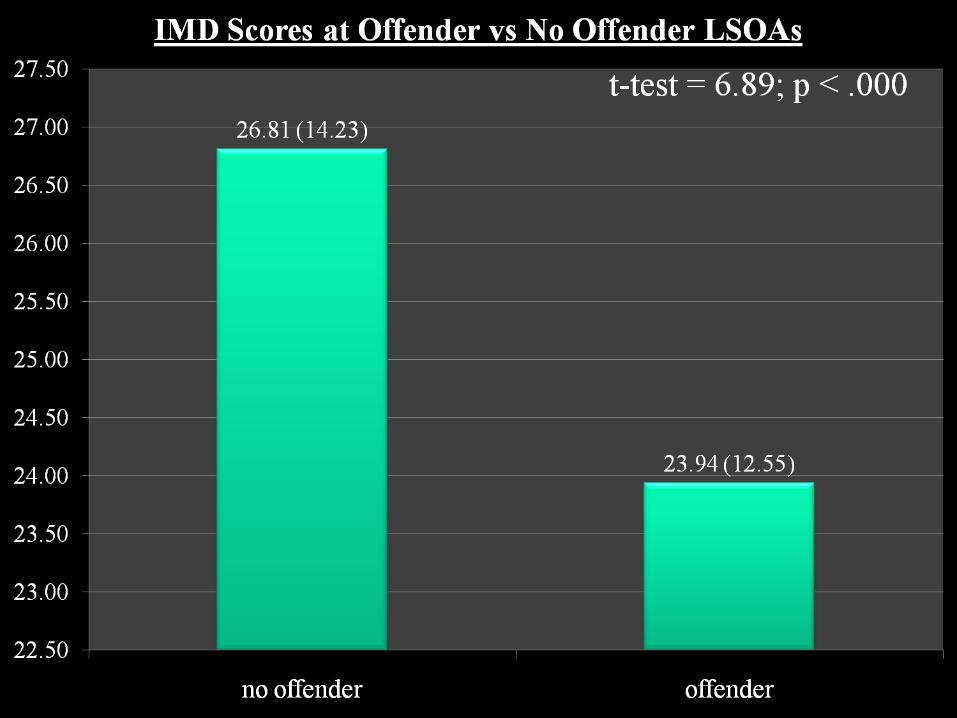
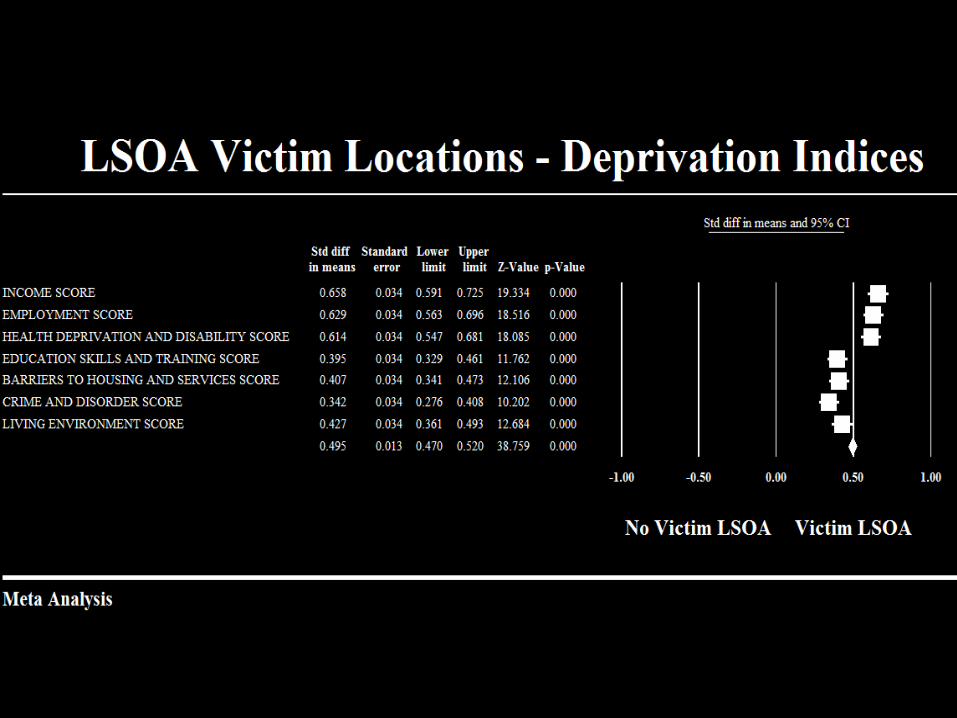
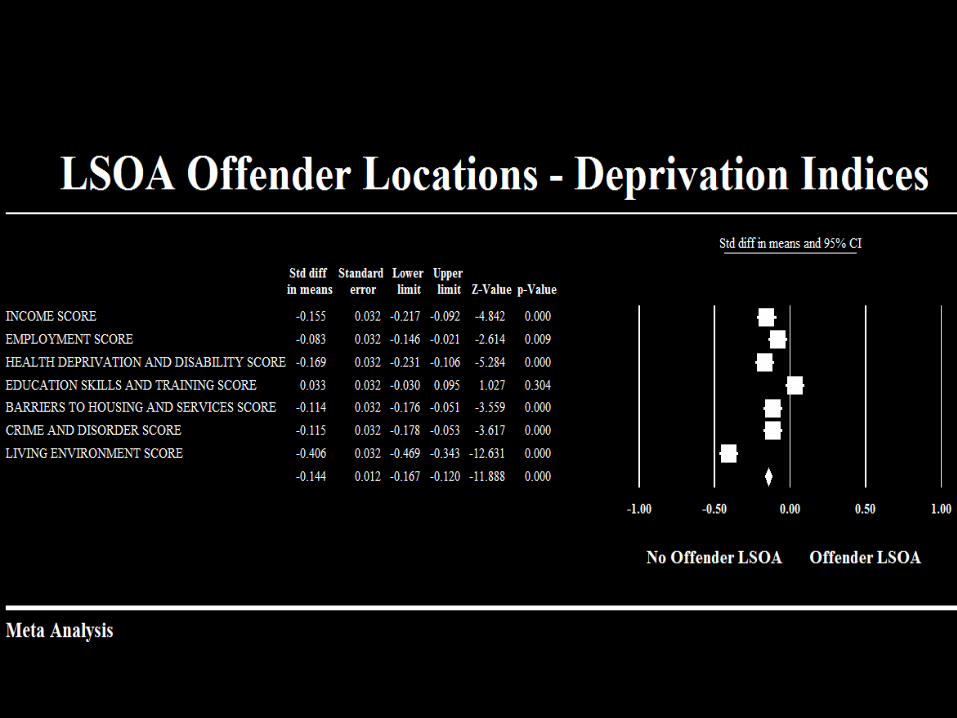
Deprivation Levels at LSOA
• There are predictable “hot times” of homicide
• The stability of homicide trends at places over time suggests a “strong coupling” of: