44
1 Data-Driven Product Development Nitzan Achsaf
| Date post: | 24-Jul-2015 |
| Category: |
Internet |
| Upload: | nitzan-achsaf |
| View: | 106 times |
| Download: | 2 times |

1
Data-Driven Product DevelopmentNitzan Achsaf

2
A Bit About Myself
General Manager, Consumer
Experience Business Unit
CEO & Founder,
SafetyNest
VP Product & Eng, Sonicbids (acquired by BackStage)
Head of Next Generation
Product Team, Yahoo Search
Strategy Consultant,
Business Consulting
Services, IBM
Marketing Strategy Manager, Consumer Electronics
Division, msystems
8200, Bachelor in Computer Science
MBA, Harvard Business School

3
Yahoo Search: $3B, 150UU/M

4
Wix: $200M, 60M+ Reg Users

5
There are different ways to gather data on users

6
Interviews or just talking w/ them (-:
Observations e.g. usability tests
Surveys
Usage DataBI-Based

7
Qualitative
Quantitative
Interviews or just talking w/ them (-:
Observations e.g. usability tests
Surveys
Usage DataBI-Based

8
Qualitative
Quantitative
Can be biased
No bias
Interviews or just talking w/ them (-:
Observations e.g. usability tests
Surveys
Usage DataBI-Based

9
First you should know your KPIs – what are you trying to measure?
STEP ONE
(This is actually the second step after understanding your business (-: )
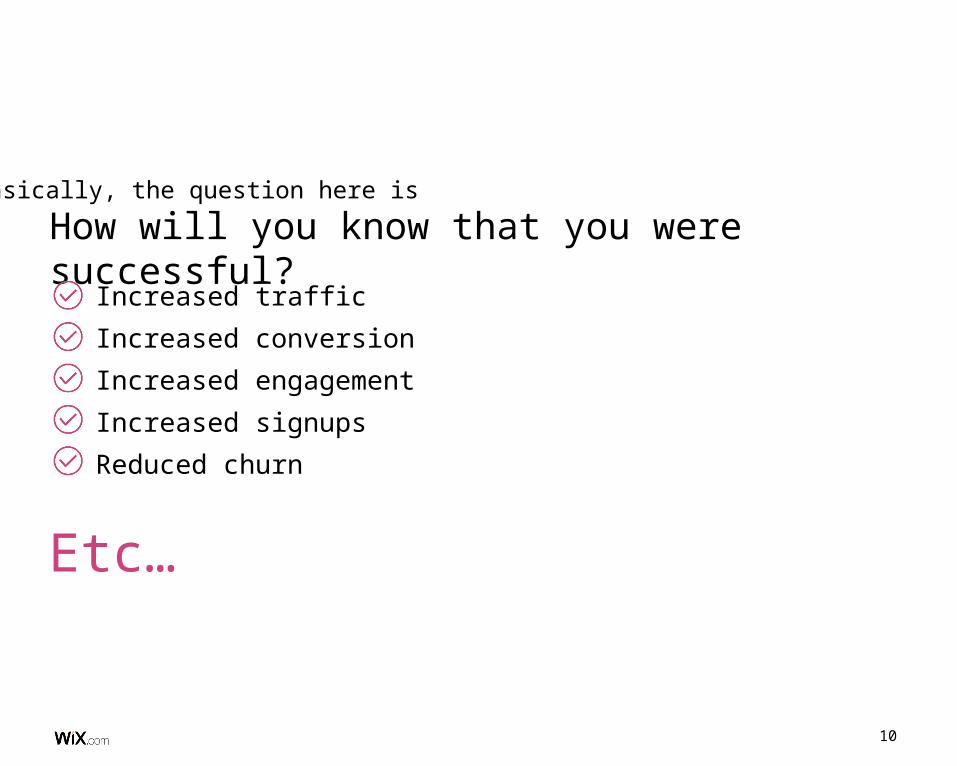
10
Increased traffic
Increased conversion
Increased engagement
Increased signups
Reduced churn
How will you know that you were successful?
Etc…
Basically, the question here is
11
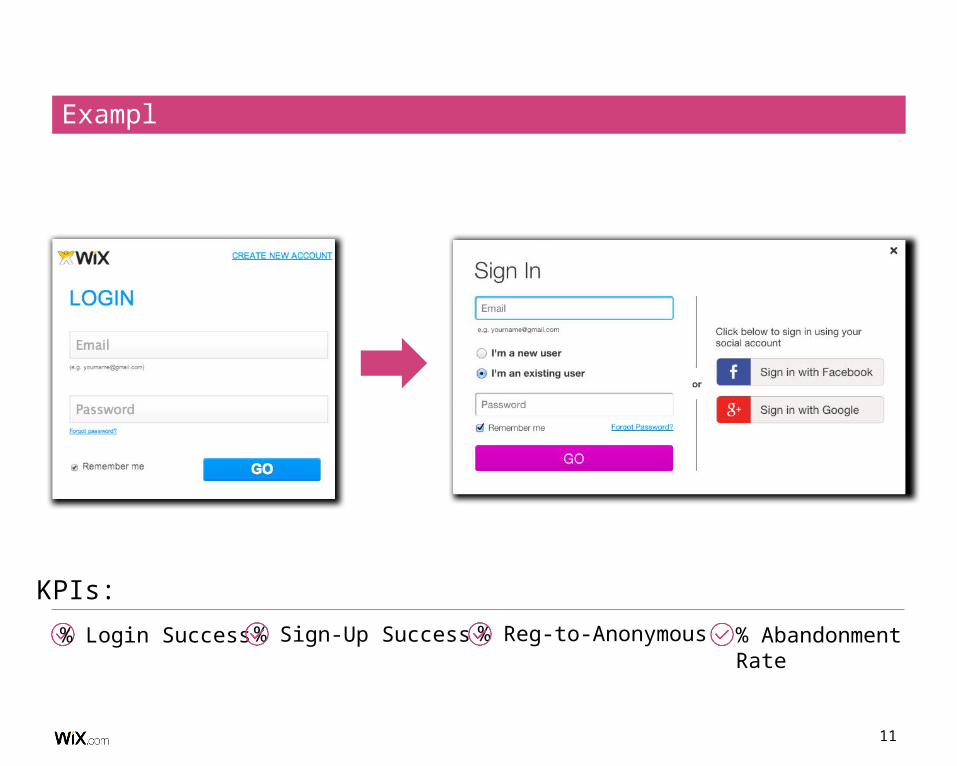
Example
% Abandonment Rate
% Login Success % Sign-Up Success % Reg-to-Anonymous
KPIs:
12
Then, before you define which BI events to add, build a mock report based on your hypothesis
STEP TWO

13
Example
64%
82%
12 MonthsPremium
Wix usersWix users
already used ShoutOut
Average Wix users’ age
1.
2.
3.4.
5.
14
After you launch your product, continue to improve via abTests & product analysis reports
STEP THREE

15
What is an abTest? (1 min overview)
A/B Testing = Running a simultaneous experiment between two or more product variants to see which performs better
statistically significant better

16
Change is signal and not noise
Use of 4 numbers (sample sizes for a & b, converted in a & b)
Confidence >95% to say that A or B won
A. B.

17
Example
100
80
60
40
20
0
2
Phase Completed
% o
f V
isit
ed
Visited Clicked Phase 1 Phase 2 Phase 3
21%
90%
95%
55%
1
4 53

18
Example
Baseline Test
20% Increase

19
To reach a global max (e.g. 3x conversion), re-think
your entire product
STEP FOUR

20
Continuing to improve the current experience / funnel will get you close to an optimal local max (i.e. Evolution)
In order to reach a global max, you need to do something significantly different (i.e. Revolution),
and not to continue to improve the current experience

21
Example
A place where you build your site
A place where you manage and grow your business

22
Understand your business / product
objectives
Define your KPIs
1

23
Understand your business / product
objectives
Define your KPIs
Build a mock report
Define your BI events
1
2

24
Understand your business / product
objectives
Define your KPIs
Continue to improve and iterate (via abTests & Reports) till you find a
better baseline
Define your BI events
Launch the experience, and measure it;
this is your baseline
Then, it will become your new baseline
1
2
3
Build a mock report

25
Understand your business / product
objectives
Define your KPIs
Build a mock report
Continue to improve and iterate (via abTests & Reports) till you find a
better baseline
To reach a global max, re-think your entire
product
Define your BI events
Launch the experience, and measure it;
this is your baseline
Then, it will become your new baseline
1
2
3
4

26
Tip #1
Don’t have enough traffic?Look at leading-indicators and/or delta trend over time

27
Anonymous
Free
Open
Publish
Package Picker
Save
Purchase Page
Example

28
Example
1 2 3 4 5 6 7 8 9 10 11 12 13 14 15 16 17 18 19
-100
0
100
200
300
400
500
600
Prem Diff Over Time
Days since Launch
Pre
miu
m D
iffere
nce
betw
een T
est
&
Base
line
29
Tip #2
Realize that most tests won’t impact $, especially in the short-term

30
Unless you add many features / new product / top funnel / payment / package picker
Sanity tests are totally fine, but set your expectations accordingly
Tests (in most cases) won’t show you an impact on churn ( use reports / monthly)

31
Tip #3
Always add common sense

32
Remember, 95% confidence, can still mean that 5 out of 100 tests can show a false-positive or false-negative result
If the results don’t make sense, try to give it more time (and use the tip #1)
33
Tip #4
Try to get a clean sample as much as possible

34
The more precise your target audience is, the less you “dilute” your signal and risk seeing nothing even when there is a change
Usually start only from “new users”
Run the test on the specific page (vs. the entire product) – i.e. only users that were actually exposed to your new feature

35
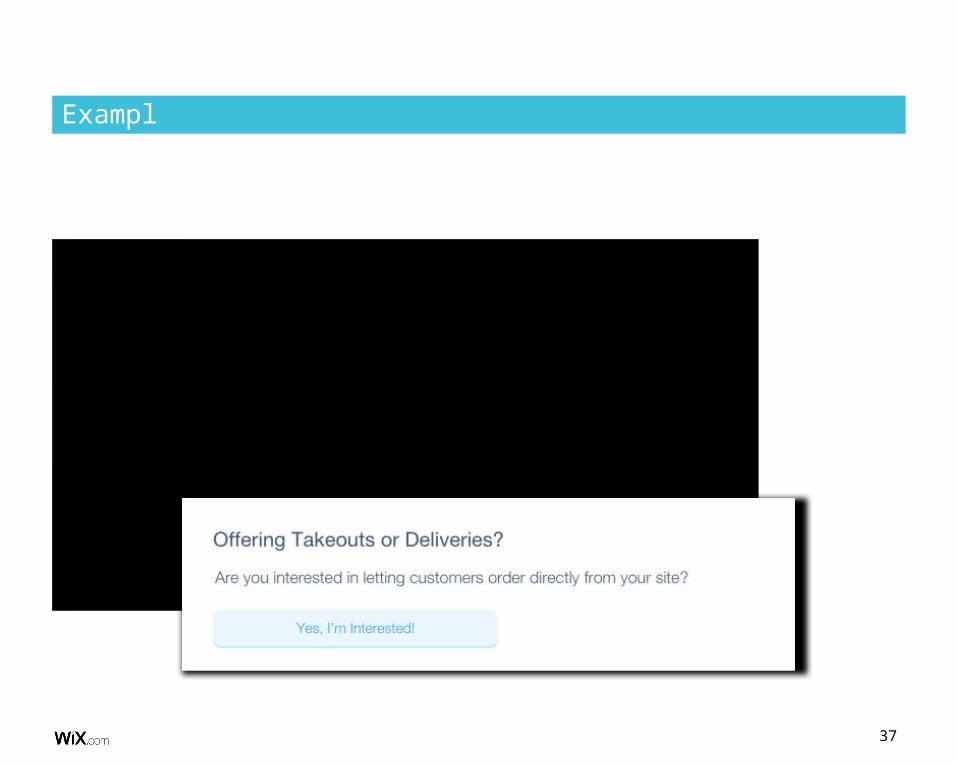
Tip #5
BI can help you understand “demand” prior to actually building the product/feature via “Ghost Links”

36
Example
37
Example

38
Example

39
Tip #6
BI is also great for “debugging”

40
Example

41
Tip #7
If you want to perform interviews / surveys / observations with a targeted audience, BI reports will help you identify it

42
For instance, only users who used feature X but not feature Y
Better understand the rational behind usage data
Investigate what is the most needed feature or biggest pain point

43
WhichTestWon.com
Cool site to follow

44
Thank You


