16
PUTTING KNOWLEDGE TO WORK The State of the Nonprofit Sector Data from Nonprofit Search January 2020

PUTTING KNOWLEDGE TO WORK
The State of the Nonprofit Sector
Data from Nonprofit Search
January 2020
We are Central
Florida’s launchpad
for high-impact
philanthropy, fueling
ideas, investment,
innovation and
collaboration that
powers relevant,
sustainable social
change.

Because we exist
Our community
leans in to and
leads the solution
for the most
critical challenges
of today, and
those on the
horizon.
Because we exist
• Strategic philanthropy is in our
DNA
• $70M and growing
• Focused philanthropy
• Stewards and shepherds of
philanthropic dollars

• Nonprofits complete profile
• CFF staff reviews information
• Find nonprofits and learn about them
• Information about nonprofits’ management, governance, financials and programs
• Make stronger giving decisions
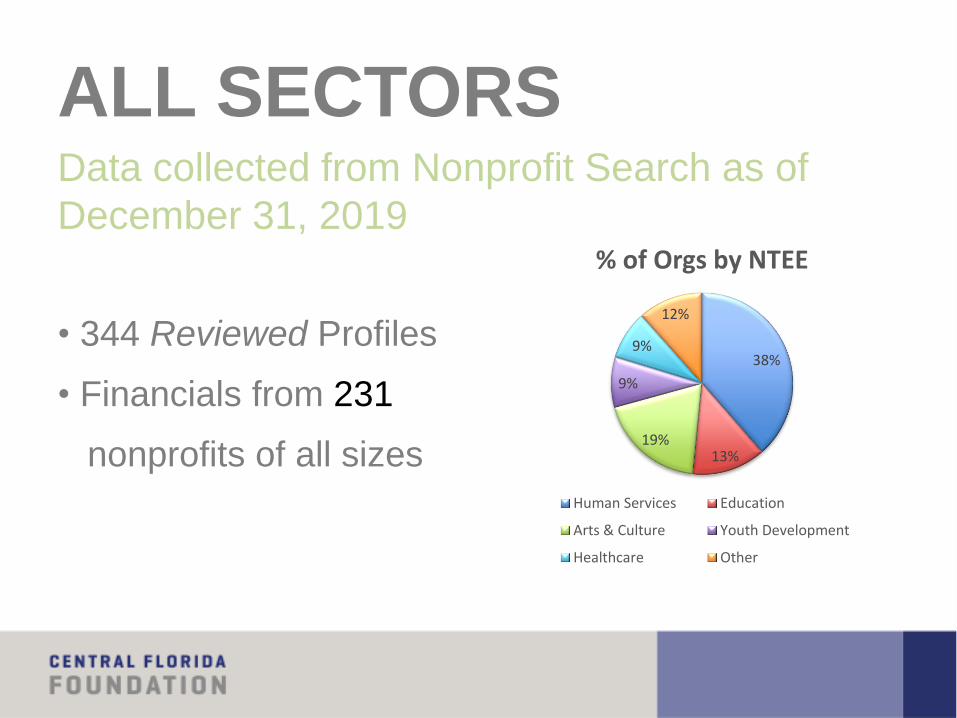
ALL SECTORSData collected from Nonprofit Search as of
December 31, 2019
• 344 Reviewed Profiles
• Financials from 231
nonprofits of all sizes
38%
13%19%
9%
9%
12%
% of Orgs by NTEE
Human Services Education
Arts & Culture Youth Development
Healthcare Other
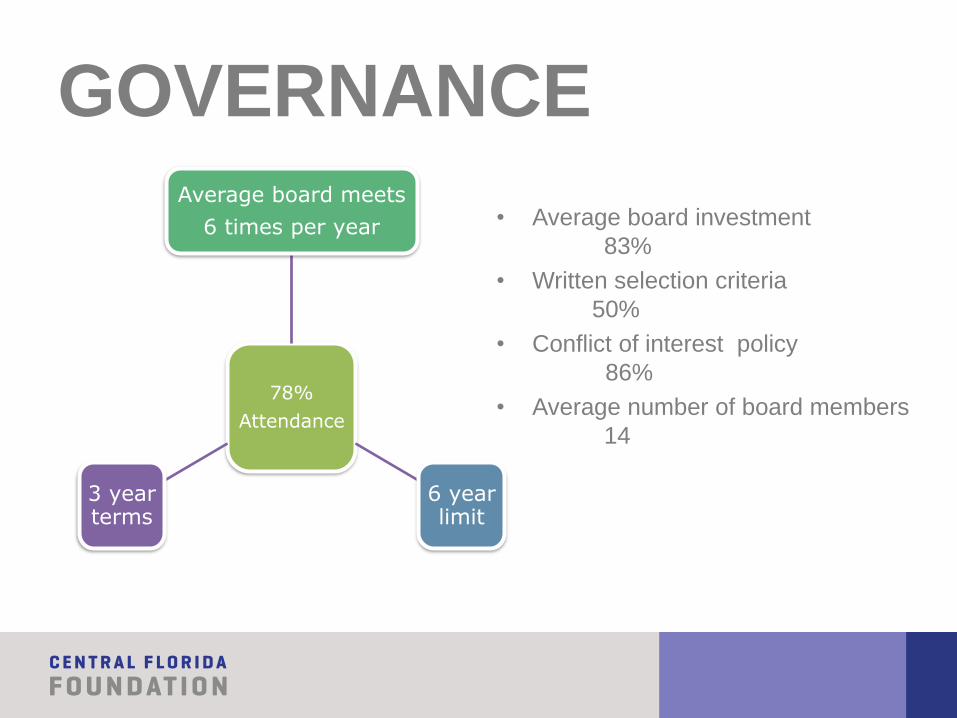
GOVERNANCE
78%
Attendance
Average board meets
6 times per year
6 year limit
3 year terms
• Average board investment
83%
• Written selection criteria
50%
• Conflict of interest policy
86%
• Average number of board members
14

BOARD DEMOGRAPHICS
Caucasian77%
African American
11%Hispanic8%
Asian2%
Other2%
Boards still lack diversity
46%
54%
Women on
boards decrease
by 2% over
2018. Men
increased by 2%

LEADERSHIP
• CEOs performance review 73%
• Performance review of senior staff 68%
• Annual CEO Compensation
Under $50,000 12%
$50,001 to $75,000 14%
$75,001 to $100,000 17%
Over $100,000 32%
• Volunteer Led*1 25%
• Average CEO compensation*2 $108,896
*1 – Volunteer Led – organizations with 0 paid part-time and full time staff with non-paid CEOs
*2- Only includes an average of paid CEO’s – backs out volunteer led organizations

STAFFING
Part-time 7598
Full-time 19,085
Contract 2305
Volunteer 244,454
Staff Retention Rate is 84%

PLANNING & POLICIES
0%
10%
20%
30%
40%
50%
60%
70%
Yes No UnderDevelopment
Fundraising Plan Strategic Plan Organizational Policies

RISK MANAGEMENT
Succession Plan
25%
Business Continuity Plan
23%
Whistle Blower Policy
60%
Document Destruction Policy
54%
D&O Insurance
65%

ENDOWMENT• True Endowment - as reported in audited financial statements which
must be permanently restricted by a donor and cannot be invaded.
• 74 Nonprofits in this cohort report having endowments
Value = $622,228,720

CAPITAL CAMPAIGNSWhole Nonprofit Sector*
• 14%
• Goal - $2.0 Billion
• Raised - $1.6 Billion
* Sample: 66 organizations in Orange, Osceola, Lake, and Seminole counties

REVENUE AND EXPENSES• Total Audited Revenues 1,287,624,300 (231 nonprofits)
• Total Audited Expenses 1,220,061,073
• Total Government Funding - $313 million *1
• Total Funding from Individuals - $258 million
• Total Funding from Foundations and Corporations - $32.7 million
• Earned Revenue - $414 million
• Special Events - $25 million
• In-kind - $194 million
• Average Overhead – 8% *2
• Average Fundraising Cost – 3% *3
*1 – Total Govt. includes local, state and federal funding
*2 - Average Overhead – sample size of 225 nonprofits
*3 – Average Fundraising Cost – sample size of 225 nonprofits

LET’S STAY
CONNECTEDSign up for News at cffound.org/news
Follow us on social media @cffound


![PowerPoint Presentation · Business & Nonprofit [practical] Library My Business & Industry Nonprofit Chambers of Commerce • U.S. Chamber of Commerce Search Ad.d Business & Nonprofit](https://static.documents.pub/doc/80x56/5e7f61ca8d275a73ef1eb163/powerpoint-business-nonprofit-practical-library-my-business-industry.jpg)
