43
Data Liberation Training Data Liberation Training 2001 2001 Complex Files: Pasting and Cutting with SPSS Université de Montréal Wendy Watkins April 24, 2001
| Date post: | 02-Jan-2016 |
| Category: |
Documents |
| Upload: | polly-newton |
| View: | 215 times |
| Download: | 0 times |

Data Liberation Training Data Liberation Training 20012001
Complex Files:Pasting and Cutting
with SPSS
Université de Montréal
Wendy WatkinsApril 24, 2001

ObjectivesObjectives
To be able to recognize types of complex files
To understand the process of matching and adding files
To have enough information to warn users about how to handle complex files

Outline: ConceptsOutline: Concepts
Complex Files
Longitudinal Files
Hierarchical Files Separate Files Combined Files
“Split” Files

Outline: TasksOutline: Tasks Pasting and Cutting with
SPSS
Pasting Adding variables Adding cases
Cutting Selecting Flag Variables Weighting
Complex FilesComplex Files
Concepts

Longitudinal FilesLongitudinal Files eg. Kids, NPHS and SLID
surveys Same respondents Different variables or
variable names Data collected on a regular
schedule Provide a look at what
happens over time

Longitudinal FilesLongitudinal Files
Have a common linking variable Usually an ID number
Are combined through a matching process
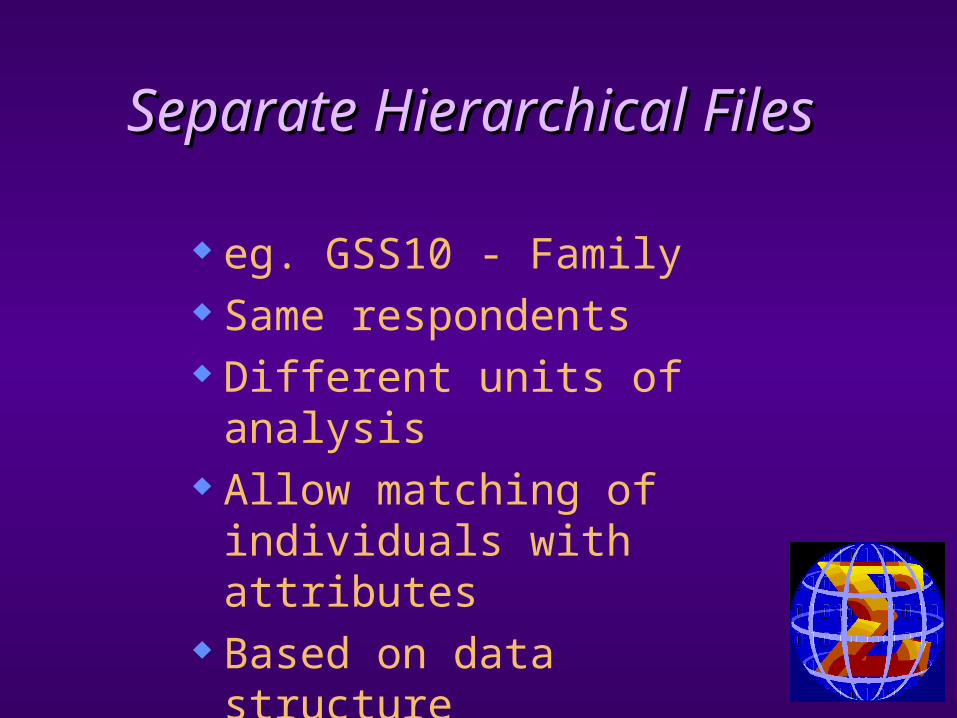
Separate Hierarchical FilesSeparate Hierarchical Files
eg. GSS10 - Family Same respondents Different units of analysis Allow matching of
individuals with attributes Based on data structure
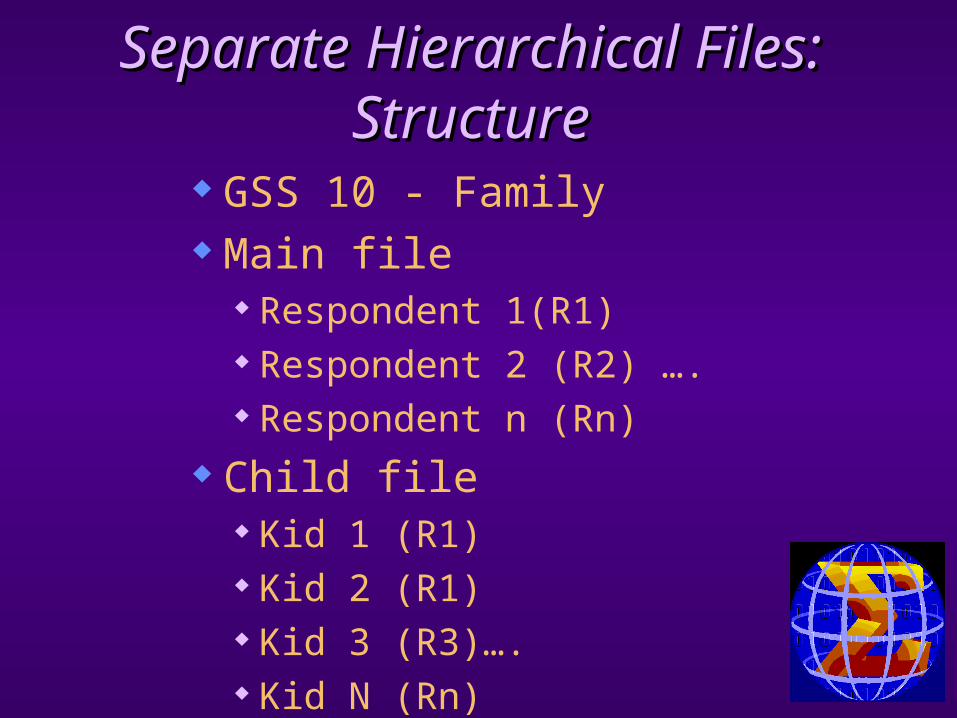
Separate Hierarchical Separate Hierarchical Files: StructureFiles: Structure
GSS 10 - Family Main file
Respondent 1(R1) Respondent 2 (R2) …. Respondent n (Rn)
Child file Kid 1 (R1) Kid 2 (R1) Kid 3 (R3)…. Kid N (Rn)
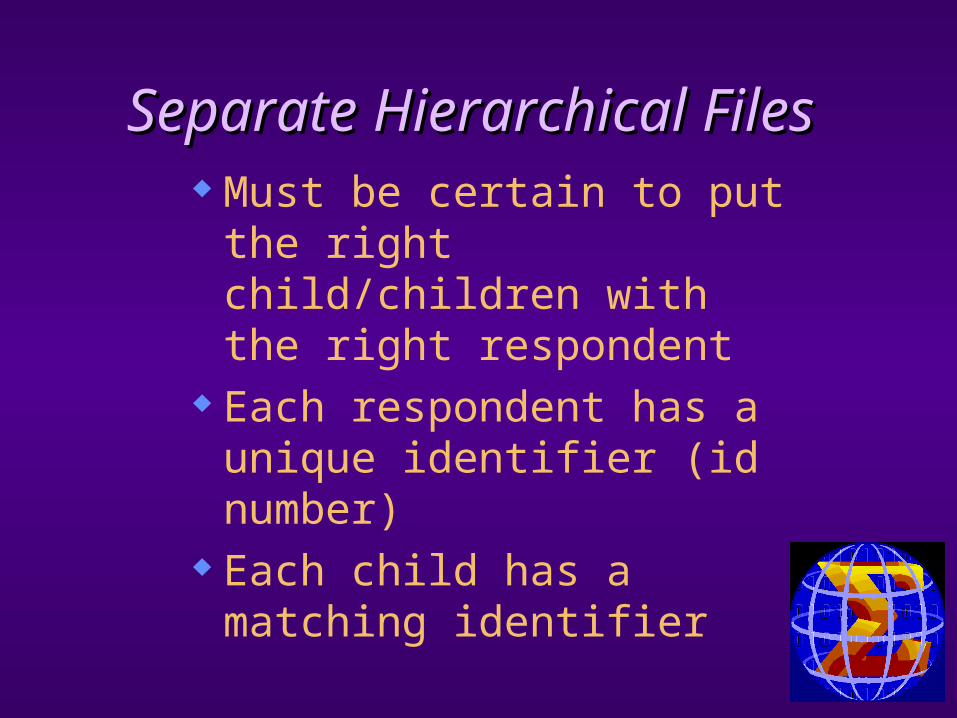
Separate Hierarchical FilesSeparate Hierarchical Files Must be certain to put the
right child/children with the right respondent
Each respondent has a unique identifier (id number)
Each child has a matching identifier

Combined Hierarchical Combined Hierarchical FilesFiles
eg. GSS 3 - Vicimization Same respondents Different units of analysis Everything in one file Based on data structure
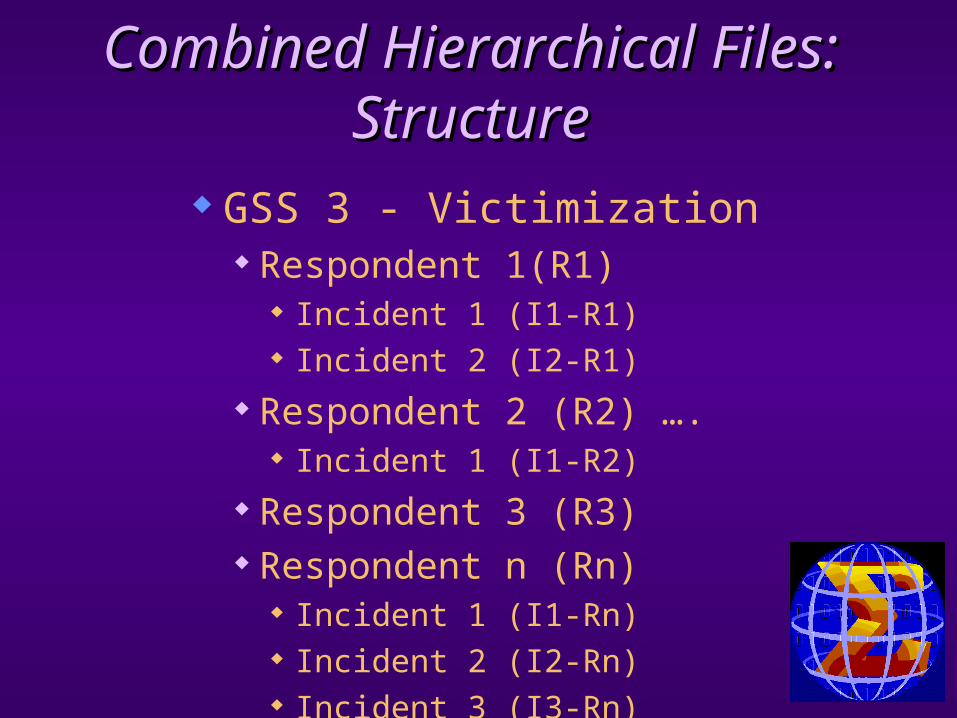
Combined Hierarchical Combined Hierarchical Files: StructureFiles: Structure
GSS 3 - Victimization Respondent 1(R1)
Incident 1 (I1-R1) Incident 2 (I2-R1)
Respondent 2 (R2) …. Incident 1 (I1-R2)
Respondent 3 (R3) Respondent n (Rn)
Incident 1 (I1-Rn) Incident 2 (I2-Rn) Incident 3 (I3-Rn)
Combined Hierarchical Combined Hierarchical FilesFiles
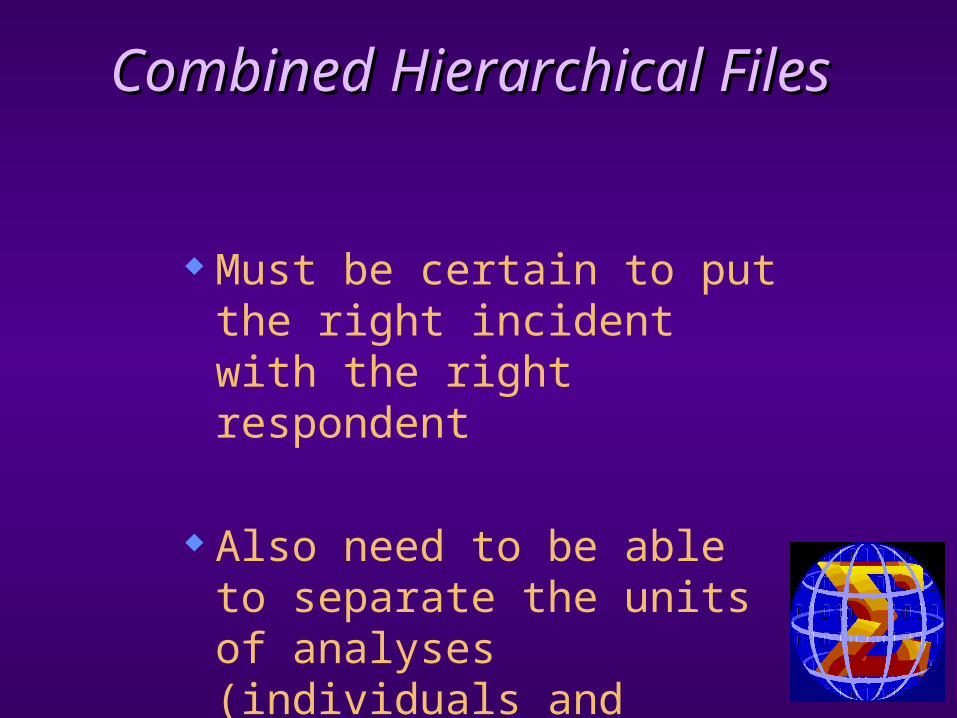
Must be certain to put the right incident with the right respondent
Also need to be able to separate the units of analyses (individuals and incidents)
Combined Hierarchical Combined Hierarchical FilesFiles
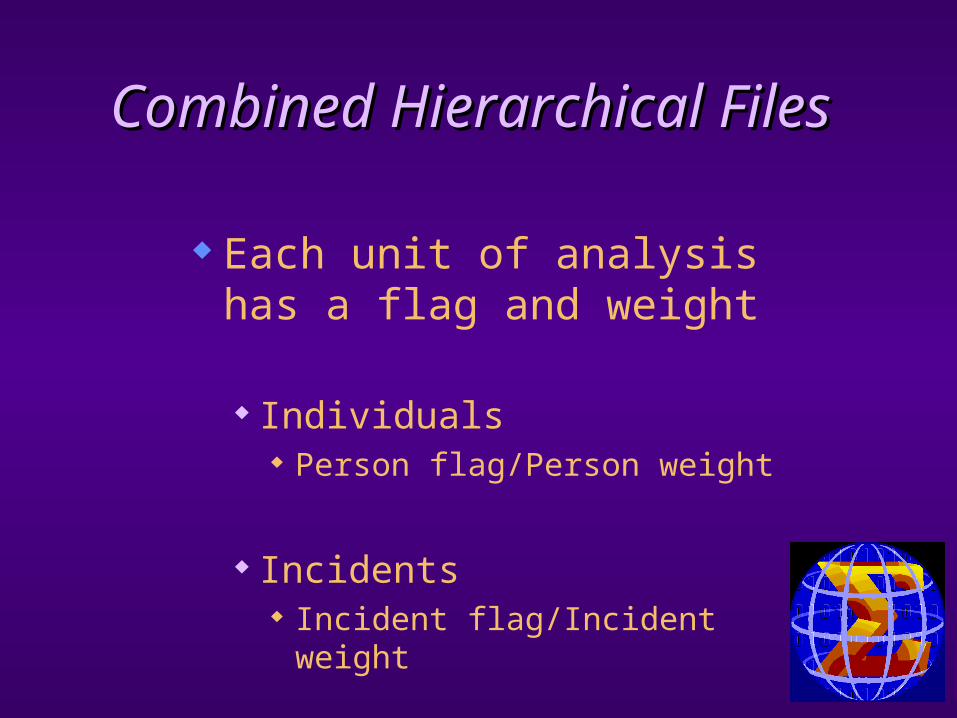
Each unit of analysis has a flag and weight
Individuals Person flag/Person weight
Incidents Incident flag/Incident weight
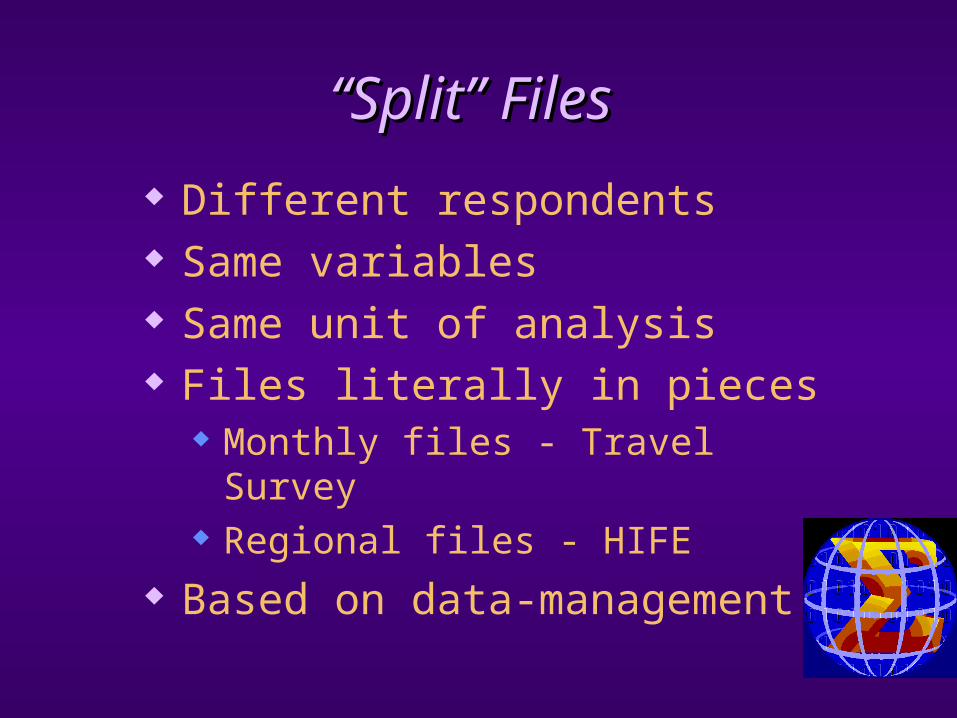
““Split” FilesSplit” Files
Different respondents Same variables Same unit of analysis Files literally in pieces
Monthly files - Travel Survey Regional files - HIFE
Based on data-management
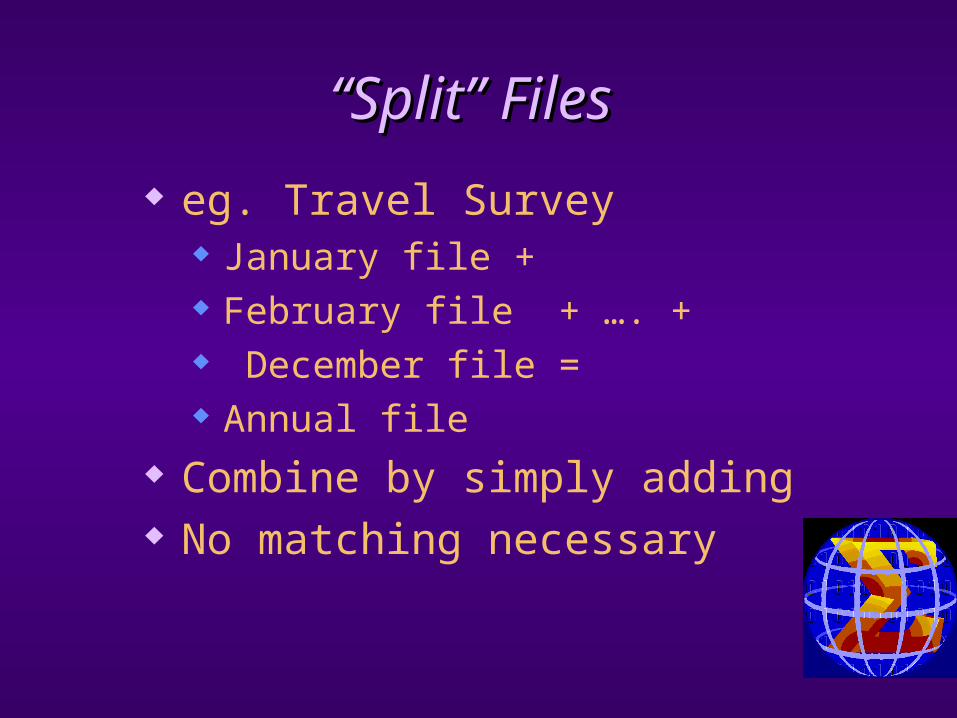
““Split” FilesSplit” Files
eg. Travel Survey January file + February file + …. + December file = Annual file
Combine by simply adding No matching necessary

Complex FilesComplex Files
Tasks:
Pasting and Cutting with SPSS

Complex FilesComplex Files NOT like word-processing
Either paste Add casesAdd variables
Or cutSelect flags and weights

Pasting with SPSSPasting with SPSS
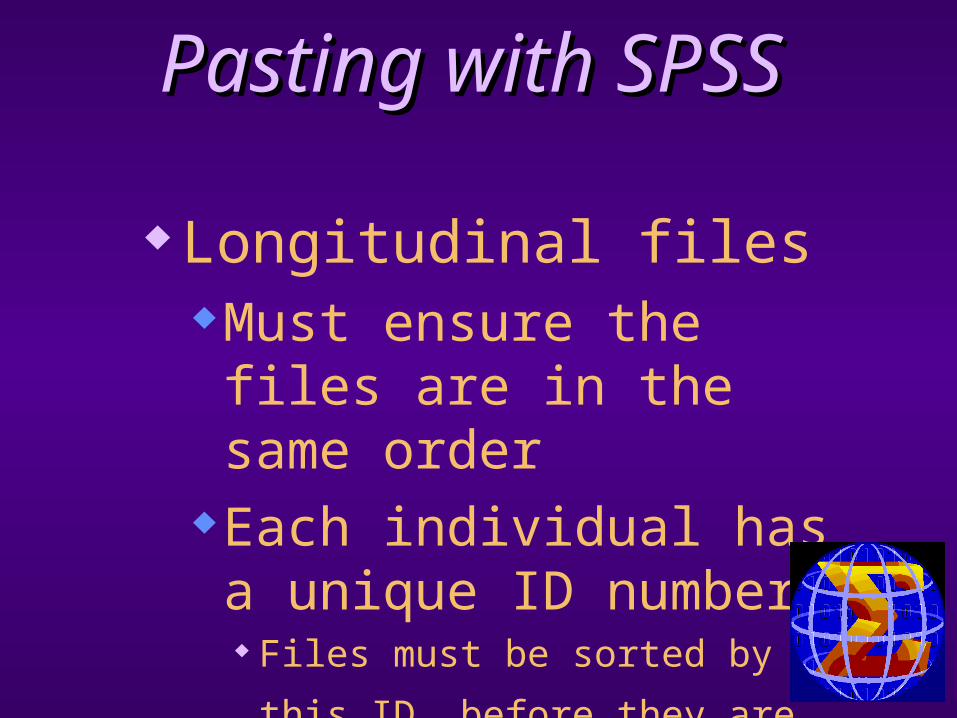
Longitudinal filesAdding variables
Same respondentsDifferent variablesSame units of analysis
Pasting with SPSSPasting with SPSS
Longitudinal filesMust ensure the files are in the same order
Each individual has a unique ID number Files must be sorted by this ID,
before they are matched

Pasting with SPSSPasting with SPSS Longitudinal files
Step 1: Sort all files by matching variable and save results

Pasting with SPSSPasting with SPSS Longitudinal files
Step 2: Merge sorted files by adding variables.

Pasting with SPSSPasting with SPSS Longitudinal files
Step 3: Match files by matching variable and save
Pasting with SPSSPasting with SPSS
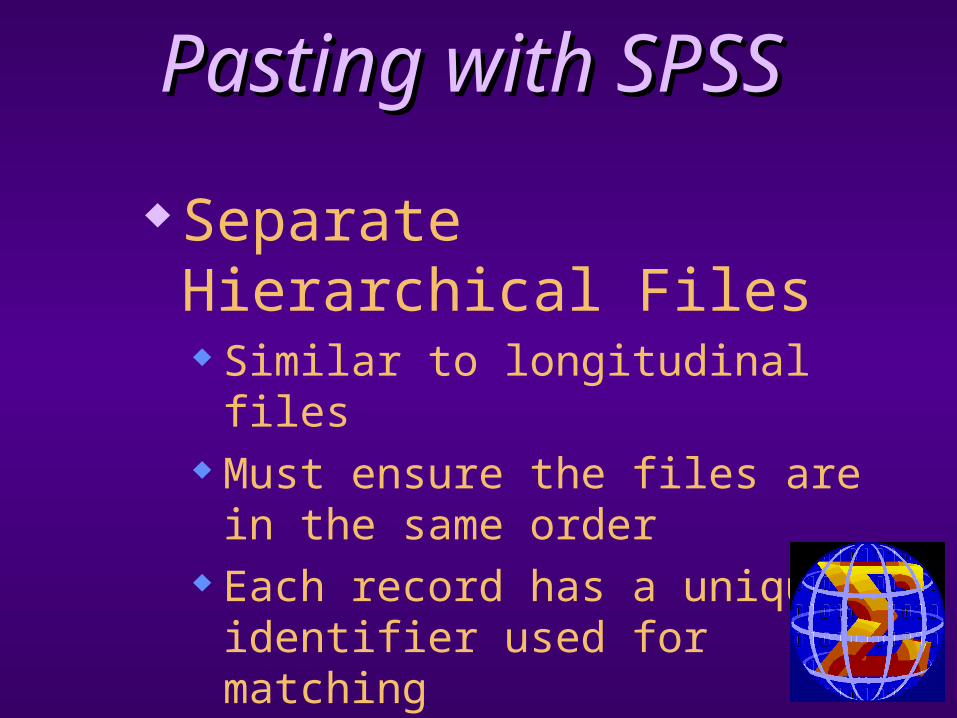
Separate Hierarchical Files Similar to longitudinal files Must ensure the files are in
the same order Each record has a unique
identifier used for matching

Pasting with SPSSPasting with SPSS
Separate Hierarchical Files Must match all attributes to
individual One respondent may have none,
one or many eg. parent / child(ren)

Pasting with SPSSPasting with SPSS
Separate Hierarchical Files Sort files by matching variable and
save results Match files by adding variables
main respondent is in TABLE attributes are in FILE

Pasting with SPSSPasting with SPSS Separate Hierarchical Files
Main respondent=keyed table

Pasting with SPSSPasting with SPSS
“Split” Files Add cases
Different respondents Same variables Same units of analysis No need to match or sort

Pasting with SPSSPasting with SPSS “Split” Files
One-step process; no sorting required
Cutting with SPSSCutting with SPSS
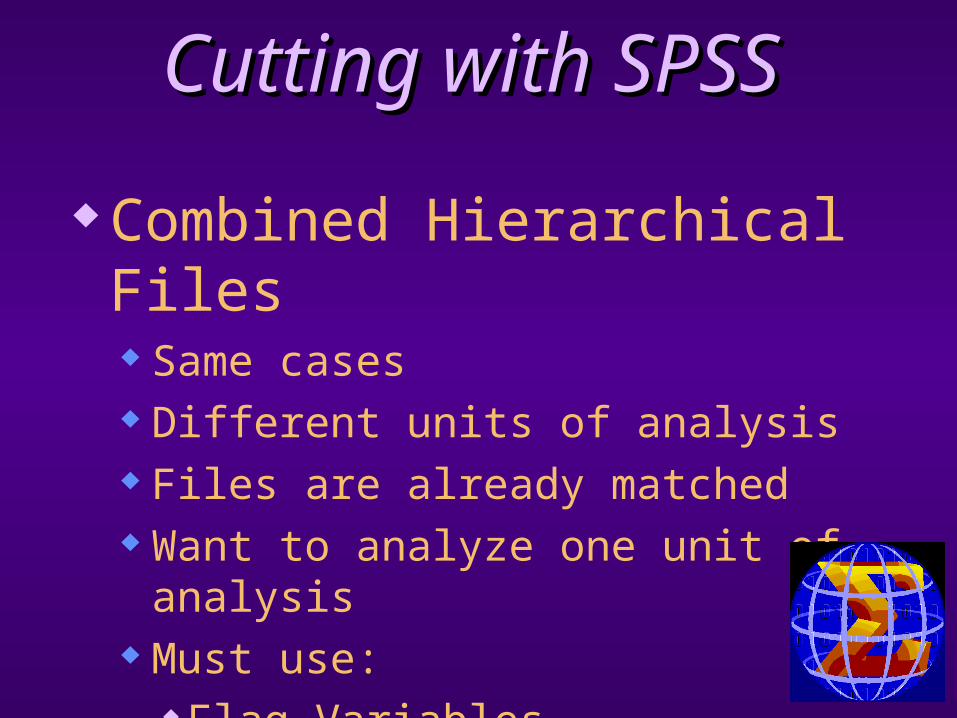
Combined Hierarchical Files Same cases Different units of analysis Files are already matched Want to analyze one unit of
analysis Must use:
Flag Variables Appropriate Weights

Cutting with SPSSCutting with SPSS Combined Hierarchical Files
Step 1: Select unit of analysis (eg. person)
Step 2: Select appropriate flag
Step 3: Apply appropriate weight

Cutting with SPSSCutting with SPSS Combined Hierarchical
FilesSteps 1 and 2

Cutting with SPSSCutting with SPSS Combined Hierarchical Files Step 3
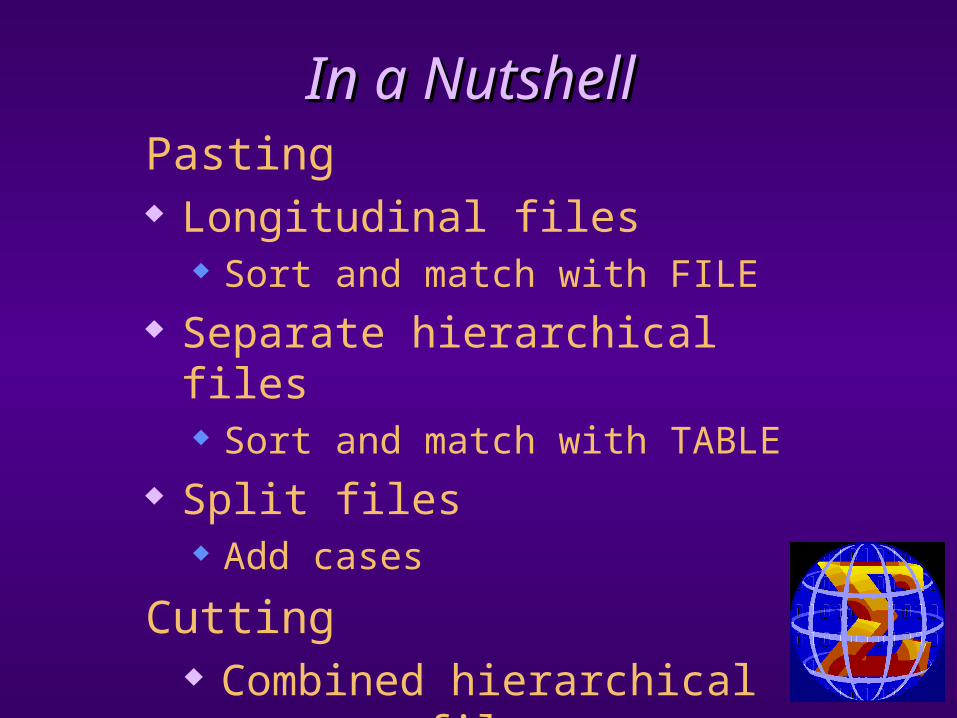
In a NutshellIn a NutshellPasting Longitudinal files
Sort and match with FILE Separate hierarchical files
Sort and match with TABLE Split files
Add cases
Cutting Combined hierarchical files
SELECT and WEIGHT
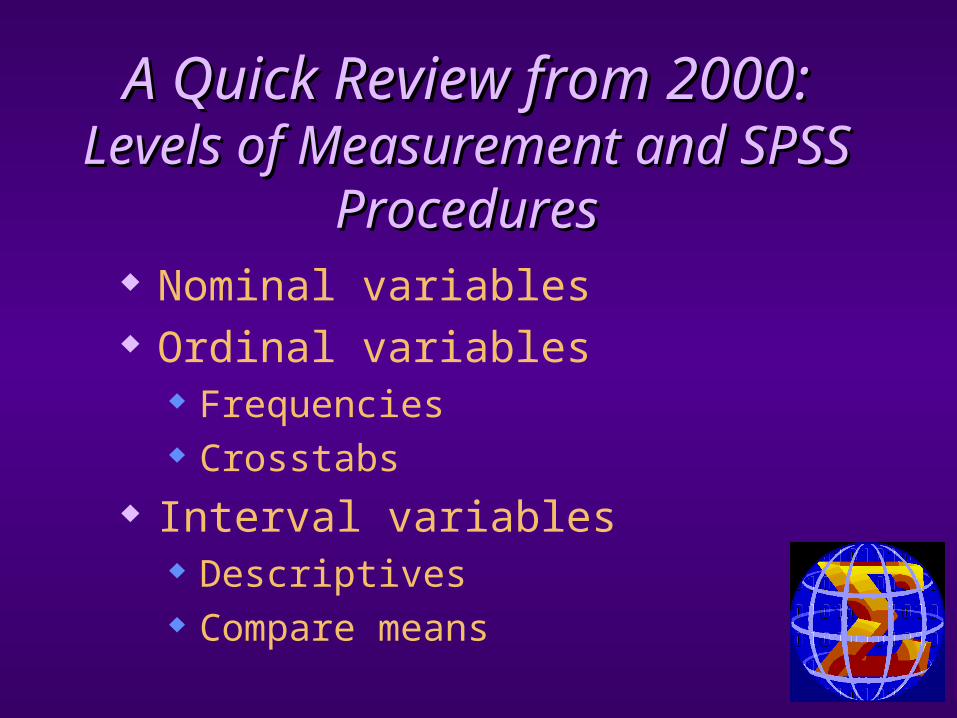
A Quick Review from A Quick Review from 2000:2000:
Levels of Measurement and Levels of Measurement and SPSS ProceduresSPSS Procedures
Nominal variables Ordinal variables
Frequencies Crosstabs
Interval variables Descriptives Compare means
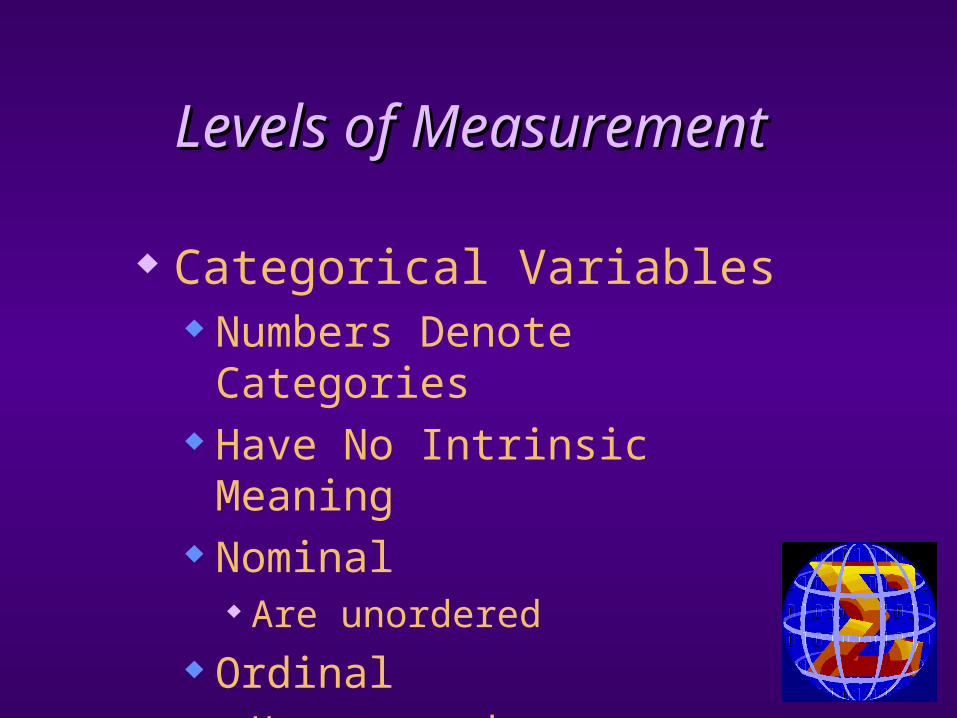
Levels of MeasurementLevels of Measurement
Categorical Variables Numbers Denote
Categories Have No Intrinsic Meaning Nominal
Are unordered Ordinal
Have an order
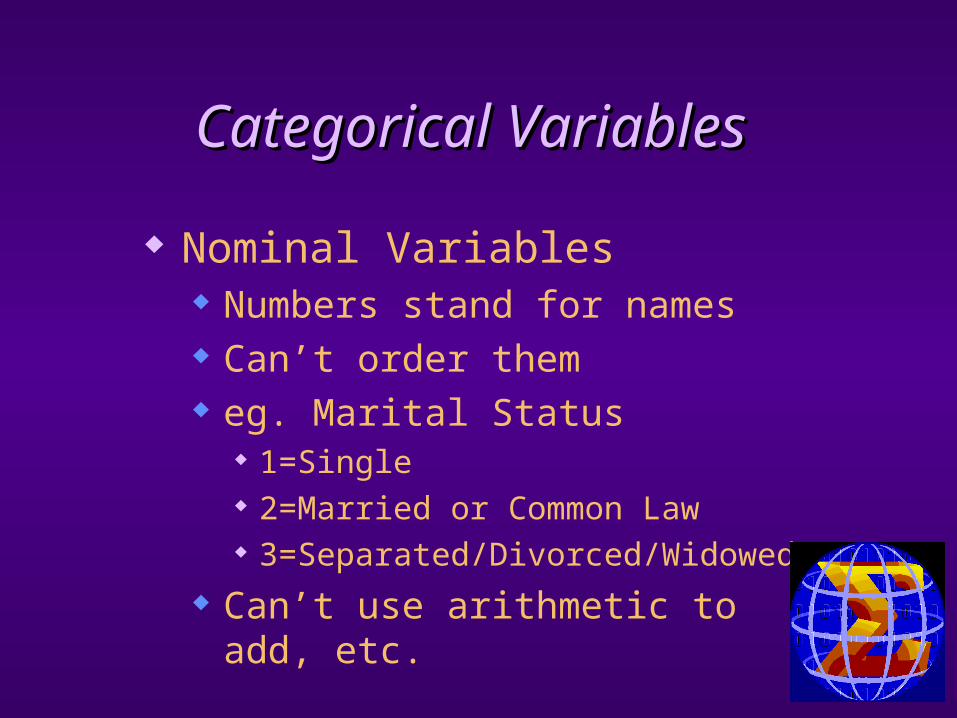
Categorical VariablesCategorical Variables
Nominal Variables Numbers stand for names Can’t order them eg. Marital Status
1=Single 2=Married or Common Law 3=Separated/Divorced/Widowed
Can’t use arithmetic to add, etc.

Categorical VariablesCategorical Variables
Ordinal Variables Numbers can be ordered Spaces between numbers
can’t be measured eg. How well do you like
Harris? 1=Not at all 2=Less still 3=Even less than that
Can’t use arithmetic to add, etc.

Continuous VariablesContinuous Variables
Interval Variables Numbers stand for what they are Spaces between numbers are
equal eg. How many children do you
have? Can use arithmetic
eg. What is the average number of children in a family?

Levels of InformationLevels of Information
Interval Variables = most information
Ordinal Variables = less information
Nominal Variables = least information

Using CrosstabsUsing Crosstabs
How does ‘x’ relate to ‘y’?
Use with nominal and ordinal measures
eg. Are men or women more likely to use computers at work?
Using MeansUsing Means Compares the average
(mean) between groups
Use when one variable is interval and the other is ordinal or nominal
eg. Who has worked longer at their job, men or women?

Time for a Break!Time for a Break!


