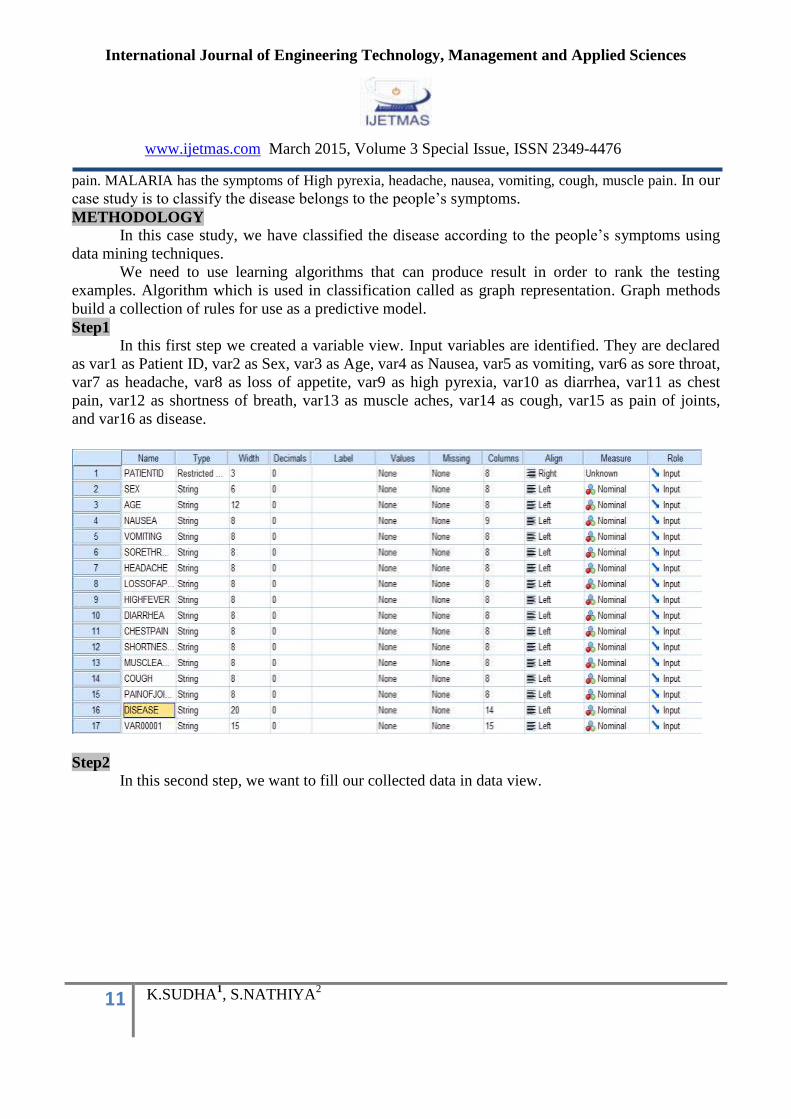
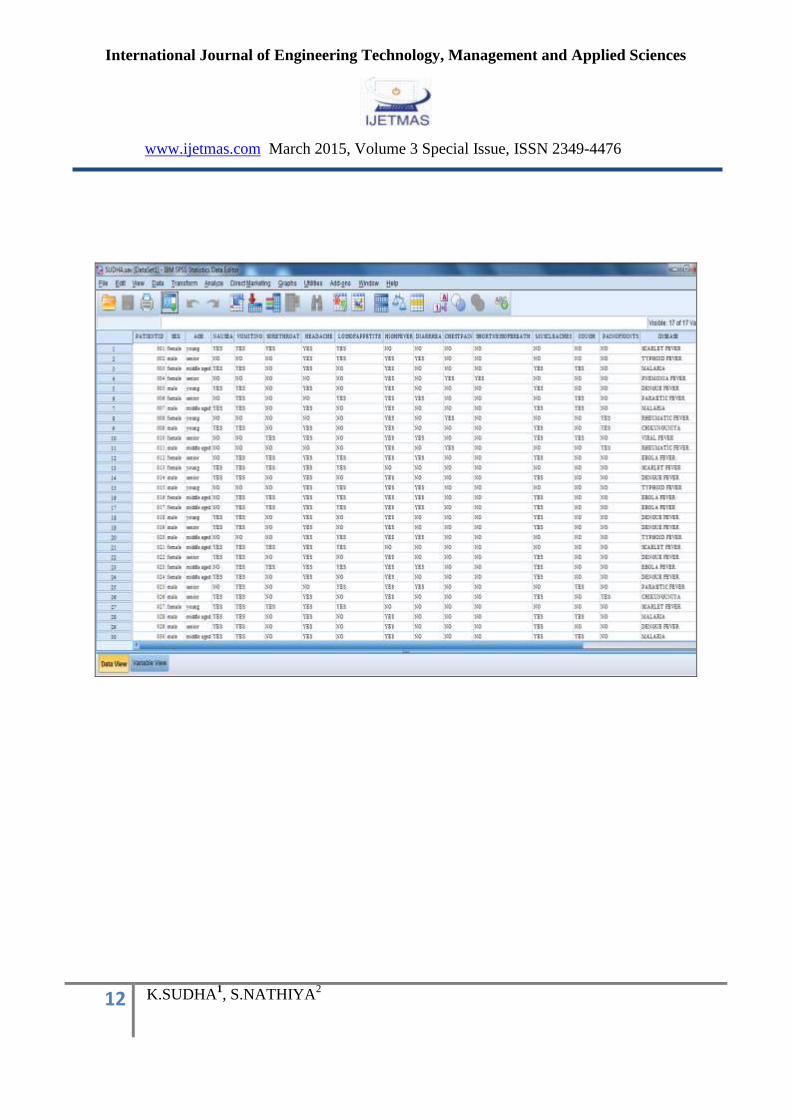
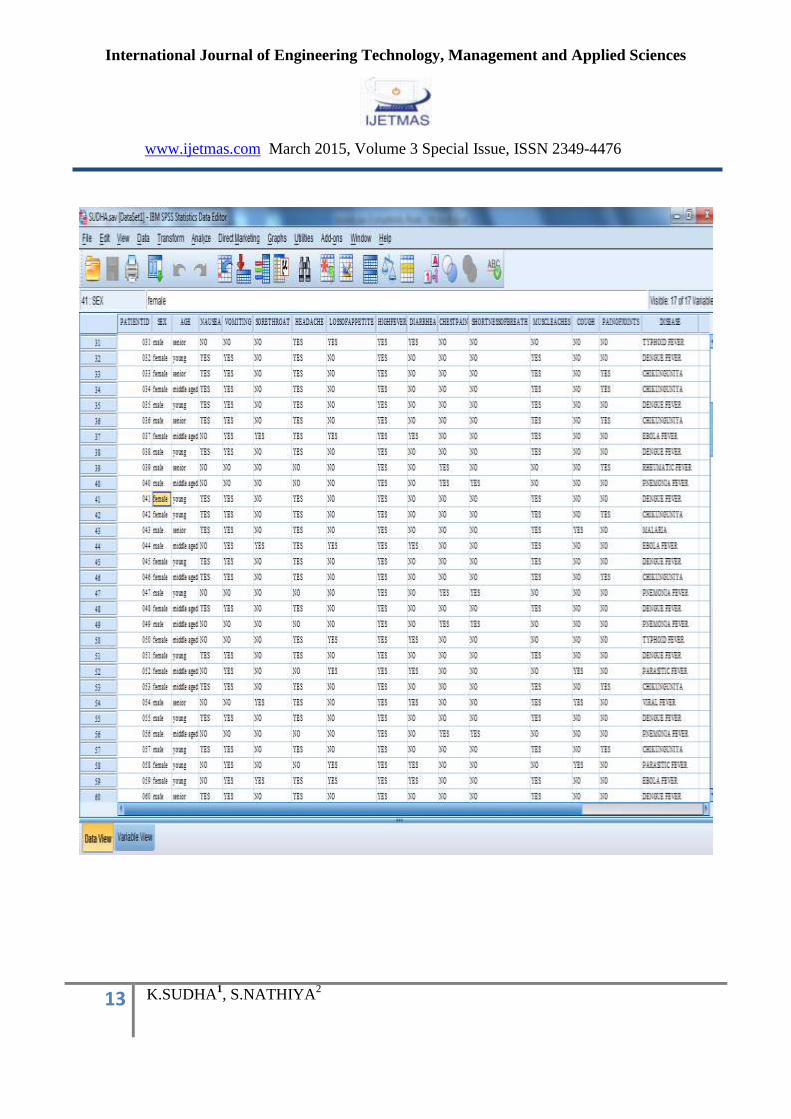
International Journal of Engineering Technology, Management and Applied Sciences www.ijetmas.com March 2015, Volume 3 Special Issue, ISSN 2349-4476 10 K.SUDHA 1 , S.NATHIYA 2 DATA MINING CLASSIFICATION APPLIED FOR TYPES OF PYREXIA ANALYSIS USING SPSS K.SUDHA 1 , S.NATHIYA 2 Assistant Professor, PG Department of Computer Sciecne, Jayaraj Annapackiam college for women (Autonomous), Periyakulam. Theni Dt. Assistant Professor, PG Department of Computer Sciecne, Jayaraj Annapackiam college for women (Autonomous), Periyakulam. Theni Dt. ABSTRACT This case study entitled as “TYPES OF PYREXIA” was done by using Statistical Package for the Social Sciences (SPSS). The main objective of this case study is to find out which predict the various classes for the people who were affected by very dangerous pyrexia. In this case study has collected the data from several peoples in Theni district. This case study helps to classify, which category of peoples are affected which type of pyrexia. In this case study had the information about all type of pyrexia like SCARLET, TYPHOID, DENGUE, EBOLA, VIRAL, PNEMONIA, RHEUMATIC, CHIKUNGUNIYA, PARASITIC, MALARIA. This process was done by using the data mining process and graph representation in SPSS. KEYWORDS: Data mining, Pyrexia, Classification Technique, Graph representation, SPSS INTRODUCTION Theni is one of the citiy in Tamilnadu. Many people were alive in that place. Each one has affected by some diseases. Here we have taken Patient ID, Sex, Age, Nausea, vomiting, sore throat, headache, loss of appetite, high pyrexia, diarrhea, chest pain, shortness of breath, muscle aches, cough, pain of joints, disease, for classification. Here we collected the data from individual person about their disease around the Theni district. In this case study predicted various classes of pyrexia such as SCARLET, TYPHOID, DENGUE, EBOLA, VIRAL, PNEMONIA, RHEUMATIC, CHIKUNGUNIYA, PARASITIC, MALARIA. In our case study is to classify the disease belongs to the people’s symptoms. For example, SCARLET pyrexia has the symptoms of Nausea, vomiting, sore throat, headache, loss of appetite. TYPHOID pyrexia has the symptoms of Loss of appetite, headache, high pyrexia and diarrhea. PNEMONIA pyrexia has the symptoms of High pyrexia, shortness of breath, chest pain. DENGUE pyrexia has the symptoms of High pyrexia, headache, nausea, vomiting, muscle aches. EBOLA pyrexia has the symptoms of High pyrexia, headache, muscle aches, loss of appetite, vomiting, diarrhea, sore throat. VIRAL pyrexia has the symptoms of High pyrexia, muscle aches, sore throat, head ache, cough, and diarrhea. CHIKUNGUNIYA has the symptoms of Head ache, nausea, vomiting, high pyrexia, pain of joints, muscle pain. PARASITIC pyrexia has the symptoms of Diarrhea, loss of appetite, cough, high pyrexia, vomiting. RHEUMATIC pyrexia had the symptoms of High pyrexia, pain of joints, chest
Transcript
International Journal of Engineering Technology, Management and Applied Sciences
www.ijetmas.com March 2015, Volume 3 Special Issue, ISSN 2349-4476
10 K.SUDHA1, S.NATHIYA
2
DATA MINING CLASSIFICATION APPLIED FOR TYPES OF
PYREXIA ANALYSIS USING SPSS
K.SUDHA1, S.NATHIYA
2
Assistant Professor, PG Department of Computer Sciecne,
Jayaraj Annapackiam college for women (Autonomous), Periyakulam.
Theni Dt.
Assistant Professor, PG Department of Computer Sciecne,
Jayaraj Annapackiam college for women (Autonomous), Periyakulam.
Theni Dt.
ABSTRACT This case study entitled as “TYPES OF PYREXIA” was done by using Statistical Package
for the Social Sciences (SPSS). The main objective of this case study is to find out which predict the
various classes for the people who were affected by very dangerous pyrexia. In this case study has
collected the data from several peoples in Theni district. This case study helps to classify, which
category of peoples are affected which type of pyrexia. In this case study had the information about
all type of pyrexia like SCARLET, TYPHOID, DENGUE, EBOLA, VIRAL, PNEMONIA, RHEUMATIC,
CHIKUNGUNIYA, PARASITIC, MALARIA. This process was done by using the data mining process
and graph representation in SPSS.
KEYWORDS: Data mining, Pyrexia, Classification Technique, Graph representation, SPSS
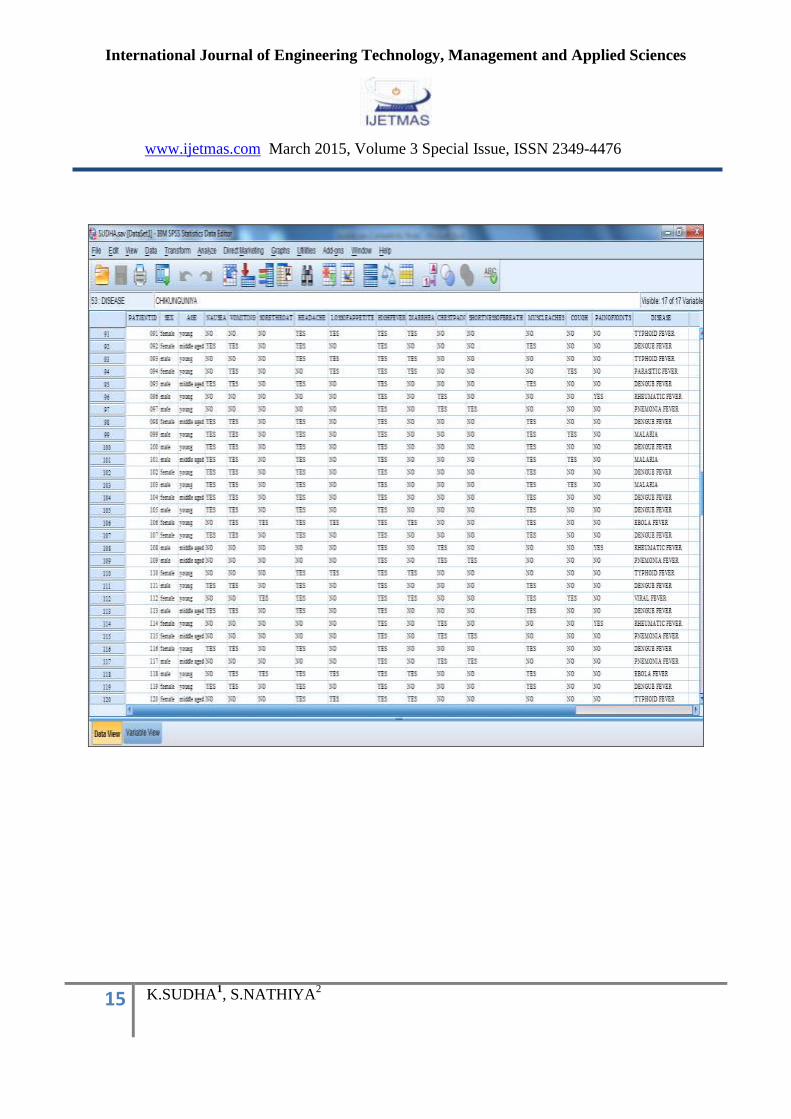
INTRODUCTION Theni is one of the citiy in Tamilnadu. Many people were alive in that place. Each one has
affected by some diseases. Here we have taken Patient ID, Sex, Age, Nausea, vomiting, sore throat,
headache, loss of appetite, high pyrexia, diarrhea, chest pain, shortness of breath, muscle aches,
cough, pain of joints, disease, for classification. Here we collected the data from individual person
about their disease around the Theni district.
In this case study predicted various classes of pyrexia such as SCARLET, TYPHOID,