Data Mining for Cyber Threat Analysis Vipin Kumar Army High Performance Computing Research Center Department of Computer Science University of Minnesota http://www.cs.umn.edu/~kumar Project Participants: A. Lazarevic, V. Kumar, J. Srivastava H. Ramanni, L. Ertoz, M. Joshi, E. Eilertson, S. Ketkar
Transcript
Data Mining for Cyber Threat Analysis
Vipin Kumar
Army High Performance Computing Research CenterDepartment of Computer Science
University of Minnesota
http://www.cs.umn.edu/~kumar
Project Participants: A. Lazarevic, V. Kumar, J. Srivastava H. Ramanni, L. Ertoz, M. Joshi, E. Eilertson, S. Ketkar
Mining Large Data Sets - Motivation
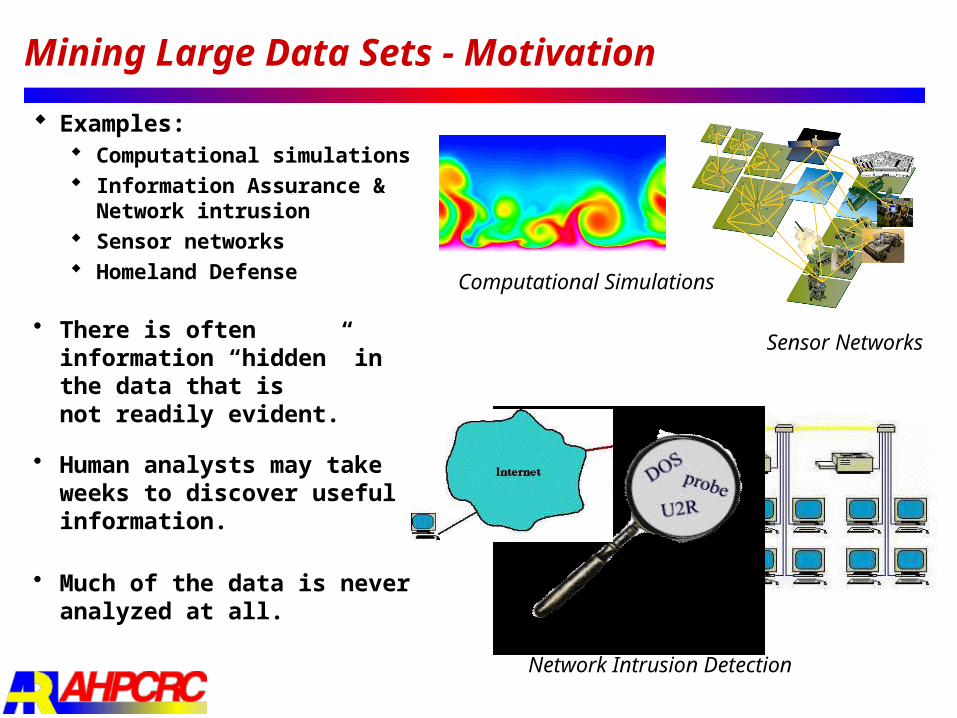
Examples: Computational simulations Information Assurance &
There is often information “hidden” in the data that is not readily evident.
Human analysts may take weeks to discover useful information.
Much of the data is never analyzed at all.
Computational Simulations
Network Intrusion Detection
Sensor Networks
Data Mining for Homeland Defense
“Data mining and data warehousing are part of a much larger FBI plan to … discover patterns and relationships that indicate criminal activity” (network intrusions, cyber attacks, terroristic calls, …)” Federal Computer Week, June 3, 2002
FBI Director Robert Mueller: “New information technology is critical top conducting business in a different way, critical to analyzing and sharing information on a real time basis”
Homeland Defense: Key issues
Information fusion from diverse data sources including intelligence, agencies, law enforcement, profile …
Data mining on this information base to uncover latent models and patterns
Visualization and display tools for understanding the relationships between persons, events and patterns of behavior
Window
Chair
Credenza
Door
Plant
Baseboard H
eater
Chair
Chair
Shelves
CulturalData
IntelligenceData
Law enforcementData
InformationFusion
Eventrecog
Assocanalysis
Threatpredictor
ThreatVisualizer
Information Assurance: Introduction
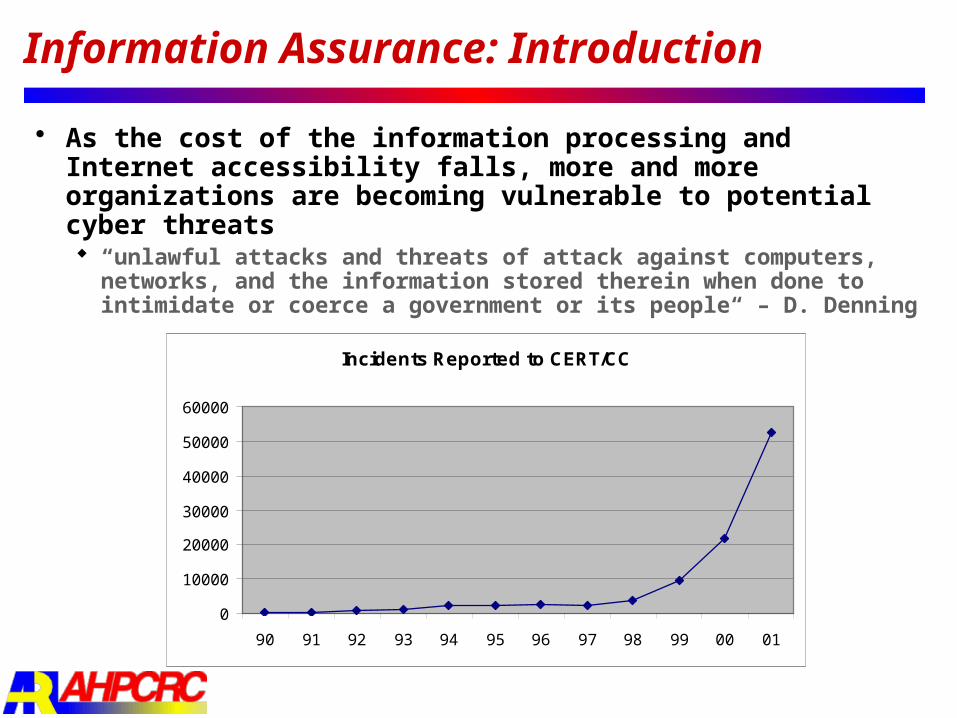
As the cost of the information processing and Internet accessibility falls, more and more organizations are becoming vulnerable to potential cyber threats “unlawful attacks and threats of attack against computers,
networks, and the information stored therein when done to intimidate or coerce a government or its people“ – D. Denning
Incidents Reported to CERT/CC
0
10000
20000
30000
40000
50000
60000
90 91 92 93 94 95 96 97 98 99 00 01
Information Assurance: Intrusion Detection Intrusion Detection: Detecting a set of actions
that compromise the integrity, confidentiality, or availability of information resources. Viruses and Internet worms
Theft of classified information from DOD computers Problem of identifying individuals
who are using computers without authorization who have legitimate access but are abusing their privileges
Intrusion Detection System (IDS) combination of software and hardware that attempts to perform
intrusion detection raise the alarm when
possible intrusion happens
Data Mining on Intelligence Databases
Purpose:Develop methods to identify potential threatsMine intelligence database
Data: social, political, economic, geographical information for pairs of countries
ratio of military capability democracy index level of trade distance
Predict: the likelihood of militarized interstate disputes (MIDs).Overall Objective: predict likely instabilities involving pairs of countries. Collaborators: Sean O’Brien, Center of Army Analysis (CAA),
Classification based on association - add frequent items as “meta-features” to original data set
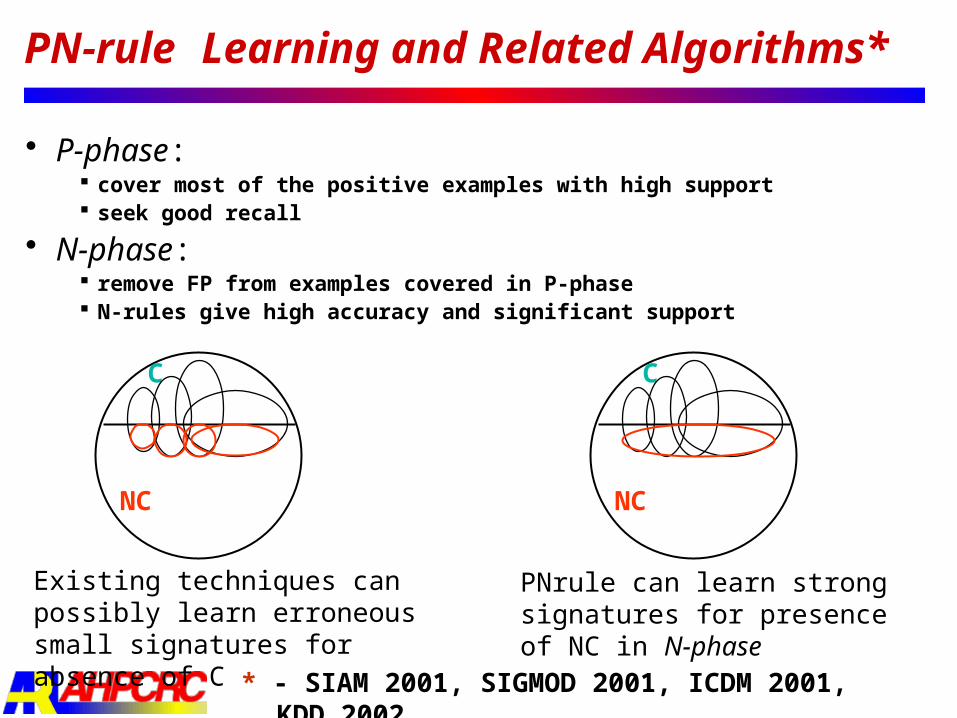
PN-rule Learning and Related Algorithms* P-phase:
cover most of the positive examples with high support seek good recall
N-phase: remove FP from examples covered in P-phase N-rules give high accuracy and significant support
Existing techniques can possibly learn erroneous small signatures for absence of C
C
NC
PNrule can learn strong signatures for presence of NC in N-phase
C
NC
* - SIAM 2001, SIGMOD 2001, ICDM 2001, KDD 2002
SMOTE and SMOTEBoost
SMOTE (Synthetic Minority Oversampling Technique) generates artificial examples from minority (rare) class along the boundary line segment
Generalization of over-sampling technique
Combination of SMOTE and boosting further improves the prediction performance or rare classes
SMOTE and SMOTEBoost Results
Experimental Results on modified KDDCup 1999 data set
Final values for recall, precision and F-value for U2R class on KDDCup-99 intrusion data set Method Recall Precision F-value Method Recall Precision F-value
Current approaches use confidence-like measures to select the best rules to be added as features into the classifiers. This may work well only if each class is well-represented in
the data set.
For the rare class problems, some of the high recall itemsets could be potentially useful, as long as their precision is not too low.
Our approach: Apply frequent itemset generation algorithm to each class. Select itemsets to be added as features based on precision,
recall and F-Measure. Apply classification algorithm, i.e., RIPPER, to the new data
set.
Experimental Results (on modified KDD Cup 1999 data)
For rare classes, rules ordered according to F-Measure produce the best results.
Original RIPPER RIPPER with high Precision rules
RIPPER with high Recall rules RIPPER with high F-measure rules
Precis ion Recall F-Measure
dos 99.50% 99.16% 99.33%
u2r 84.78% 57.35% 68.42%
r2l 96.72% 75.98% 85.11%
probe 97.22% 90.27% 93.62%
norm al 95.52% 99.30% 97.37%
Precis ion Recall F-Measure
dos 99.51% 98.95% 99.23%
u2r 90.09% 73.53% 80.97%
r2l 92.90% 75.88% 83.53%
probe 96.96% 96.69% 96.83%
norm al 96.29% 98.88% 97.57%
Precis ion Recall F-Measure
dos 99.53% 99.65% 99.59%
u2r 88.57% 68.38% 77.18%
r2l 96.54% 78.91% 86.84%
probe 97.40% 94.89% 96.13%
norm al 96.80% 99.25% 98.01%
Precis ion Recall F-Measure
dos 99.48% 99.79% 99.63%
u2r 94.17% 83.09% 88.28%
r2l 96.14% 84.31% 89.84%
probe 98.25% 92.11% 95.08%
norm al 97.18% 99.26% 98.21%
Anomaly and Outlier
Detection
Main Assumptions All anomalous activities need closer inspection Determine “normal activity profile” and flag an alarm when the
state differs from the “normal profile” Expert analyst examines suspicious activity to make final
determination whether activity is indeed an intrusion Drawbacks
Possible large number of false alarms and not recognizing attacks
Supervised (with access to normal data) vs. Unsupervised (with NO access to normal data) determining “normal behavior”
False alarm
Missed attacks
Anomalous activities
Normal profile
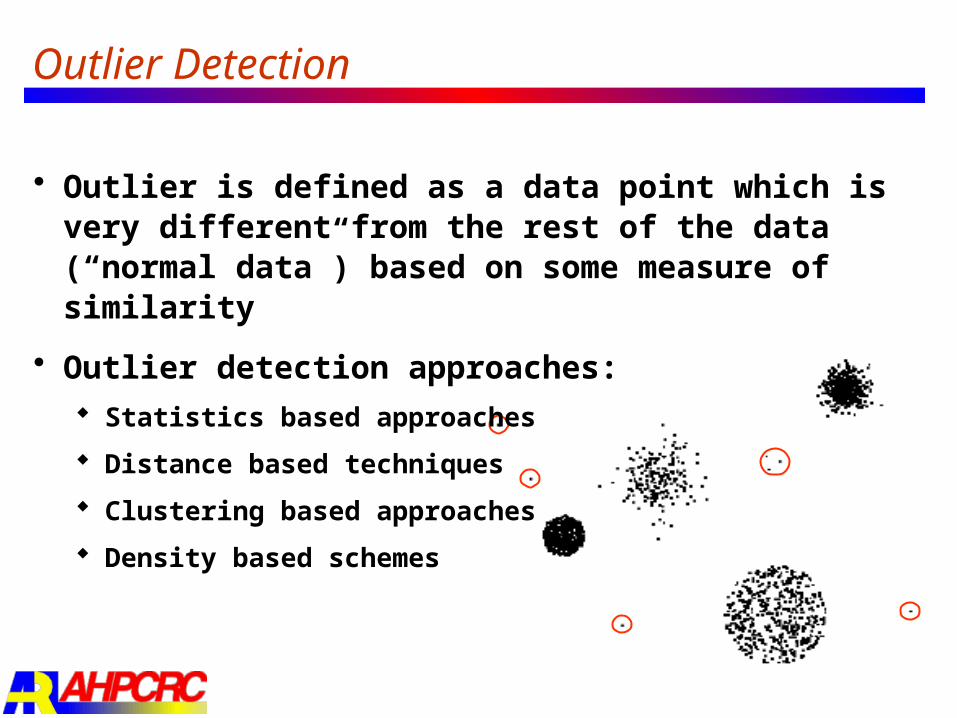
Outlier Detection
Outlier is defined as a data point which is very different from the rest of the data (“normal data”) based on some measure of similarity
Outlier detection approaches: Statistics based approaches
Distance based techniques
Clustering based approaches
Density based schemes
Distance and density based schemes
Distance based approaches (NN approach) - Outliers are points that do not have enough neighbors
Density based approach (LOF approach) finds outliers based on the densities of local neighborhoods
Concept of locality becomes difficult to define due to data sparsity in high dimensional space
Clustering based approaches define outliers as points which do not lie in clusters
Implicitly define outliers as background noise
0 10 20 30 40 50 60 70 80 90 1000
0.1
0.2
0.3
0.4
0.5
0.6
0.7
0.8
0.9
1
Connection number
Con
nect
ion
scor
e
LOF approach
NN aproach
Outlier Detection Results (on DARPA’98 data)Detection Rate (False alarm rate was fixed
Our approach Integrate our implemented outlier detection schemes into the
SNORT since it is and open source code
Improve the detection of novel intrusions and suspicious behavior by using sophisticated outlier detection schemes
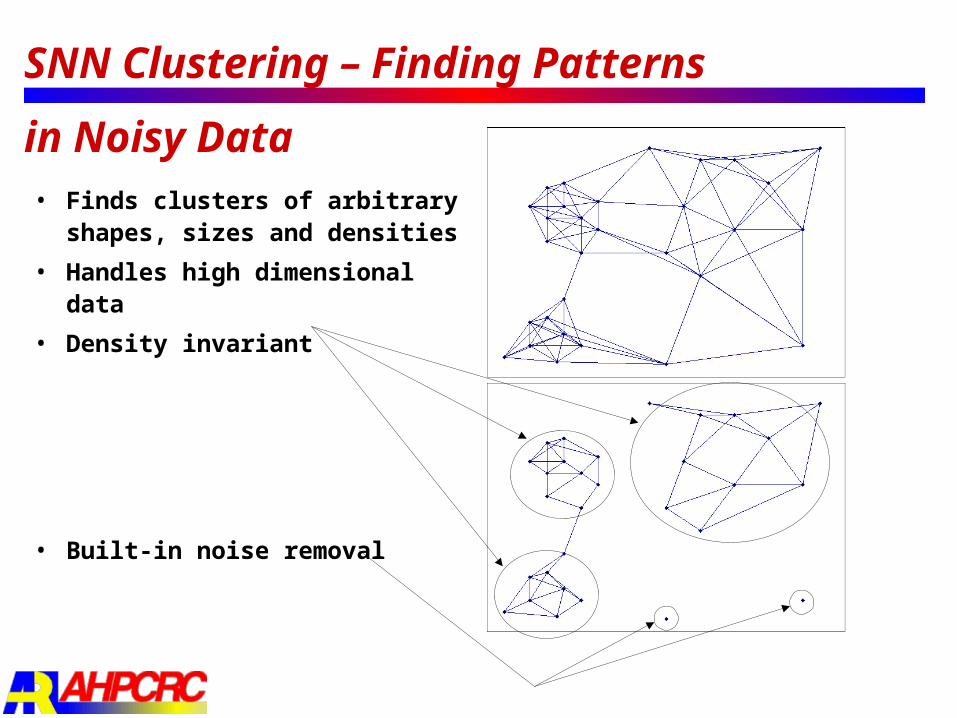
SNN Clustering – Finding Patterns
in Noisy Data• Finds clusters of arbitrary
shapes, sizes and densities
• Handles high dimensional data
• Density invariant
• Built-in noise removal
Topics from Los Angeles Times (Jan. 1989)• 3204 articles, 31472 words (LA Times, January 1989)• afghanistan embassi guerrilla kabul moscow rebel soviet troop
plant poison weapon west • ahead ball basket beate brea chri coach coache consecut el final
finish foul fourth free game grab half halftim hill host jef lead league led left los lost minut miss outscor overal plai player pointer quarter ralli rank rebound remain roundup scor score scorer season shot steal straight streak team third throw ti tim trail victori win won
• ab bengal bowl cincinnati craig dalla denver esiason field football francisco giant jerri joe miami minnesota montana nfl oppon pass pittsburgh quarterback rice rush super table taylor terri touchdown yard
Topics from FBI web site
• uss rocket cabin aircraft fuel hughes twa missile redstone • (1999 - Congressional Statement - TWA 800)
• theft art stolen legislation notices recoveries • (FBI - Art Theft Program)
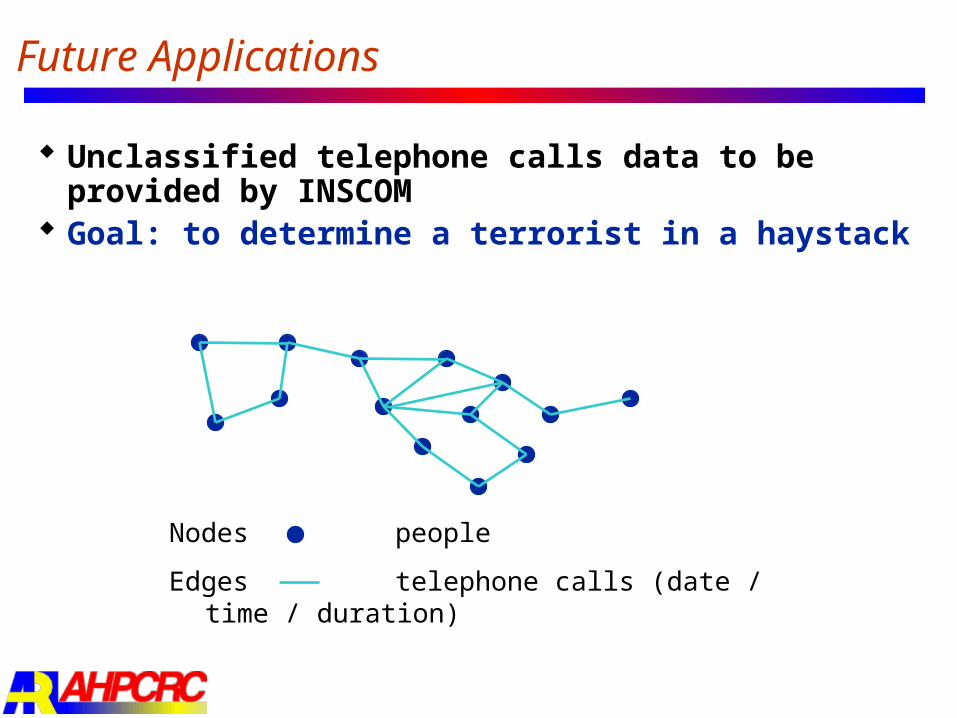
Unclassified telephone calls data to be provided by INSCOM
Goal: to determine a terrorist in a haystack
Nodes people
Edges telephone calls (date / time / duration)
Conclusions
Predictive models specifically designed for rare class can help in improving the detection of small attack types
Simple outlier detection approaches appear capable of detecting anomalies
Clustering based approaches show promise in identifying novel attack types
Integration data mining techniques into SNORT should improve the detection rate
Data Mining Process
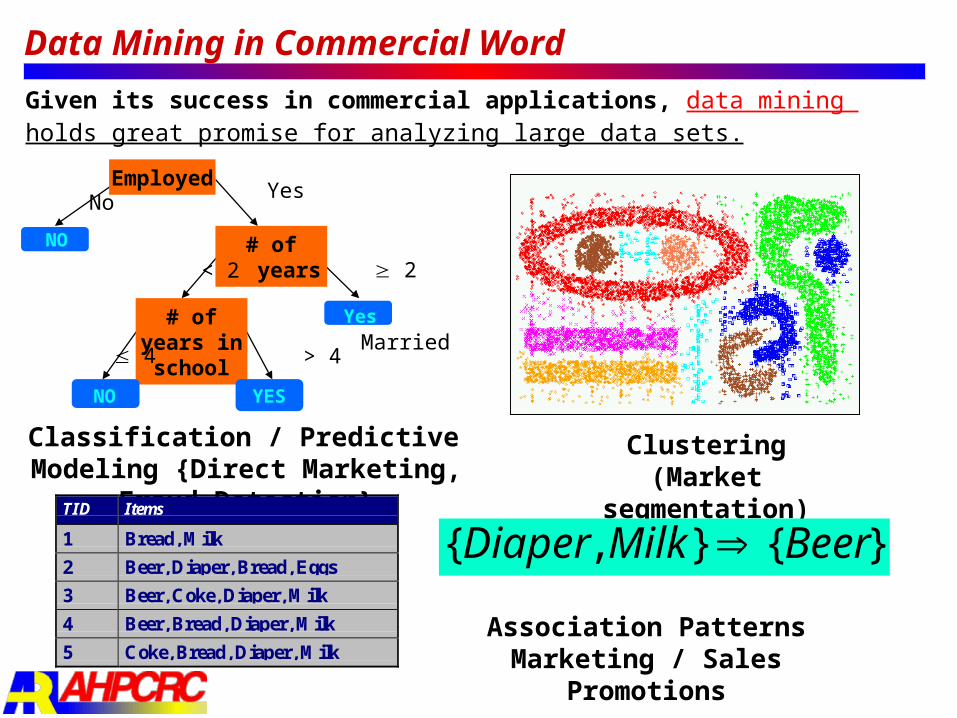
• Data mining – “non-trivial extraction of implicit, previously unknown and potentially useful information from data”
Back
Modified KDDCup 1999 Data Set
• KDDCup 1999 data is based on DARPA 1998 data set
• Remove duplicates and merge new train and test data sets
• Sample 69,980 examples from the merged data set – Sample from neptune and normal subclass. Other
subclasses remain intact.
• Divide in equal proportion to training and test sets
Back
DARPA 1998 Data Set
DARPA 1998 data set (prepared and managed by MIT Lincoln Lab) includes a wide variety of intrusions simulated in a military network environment
9 weeks of raw TCP dump data 7 weeks for training (5 million connection records) 2 weeks for training (2 million connection records)
Connections are labeled as normal or attacks (4 main categories of attacks - 38 attack types) DOS - Denial Of Service Probe - e.g. port scanning U2R - unauthorized access to root privileges, R2L - unauthorized remote login to machine,
Two types of attacks Bursty attacks - involve multiple network connections Non-bursty attacks - involve single network connections
Back to KDDCup
Back to Experiments
Terrorist Threat Analyzer & Predictor Operational Capability:•Ability to match data from multiple sources, resolving structural and semantic conflicts.•Ability to recognize events and behaviors, each of whose (partial) information is available in different data streams.•Ability to identify latent associations between suspects and their linkages to events/behaviors.•Capability to predict threatening activities and behaviors with high probability.•Ability to visualize interesting and significant events and behaviors.
Terrorist Threat Analyzer & Predictor (T-TAP)
Proposed Technical Approach: New EffortKey Technologies:•High dimensional data clustering – METIS.•Spatio-temporal change point detection.•Association analysis and belief revision.•High dimensional classification – SVM, NN, boosting.Task List:•T1: Develop data fusion algorithms to match diverse intelligence, law enforcement, and cultural data.•T2: Develop event & behavior recognition algorithms across multiple, multi-media, data streams.•T3: Association analysis algorithms to determine hidden connections between suspects, events and behaviors; develop networks of associations.•T4: Predictive models of threatening events and behaviors.•T5: Interestingness & relevance based visualization models of significant events and behaviors.
Rough Order of Magnitude Cost and Schedule:•Tasks 1, 2, 3 will each proceed in parallel for the first 12 months, with version 1 released at the end of 6 months. At this point tasks 4, 5 will start and proceed in parallel. Cross feedback across various tasks will lead to final, refined tools at the end of the 18 month period.Deliverables:•Database schema and structures to store terrain info.•Software implementation of concealed cavities prediction model.•User manuals, test reports, database schema•Quarterly technical and status reports, and final report.Corporate Information:•Vipin Kumar (POC)•Army Research Center, University of Minnesota, 1100 Washington Avenue SE, Minneapolis, MN 55455•Phone (612)626-8095; E-mail: [email protected]
AHPCRCUniversity of Minnesota
Window
Chair
Credenza
Door
Plant
Baseboard H
eater
Chair
Chair
Shelves
CulturalData
IntelligenceData
Law enforcementData
InformationFusion
Eventrecog
Assocanalysis
Threatpredictor
ThreatVisualizer
T-TAPSystem
Distributed Virtual Integrated Threat Analysis Database Operational Capability:•Global integrated view across multiple databases: integrated schema, global dictionary and directory, common ontology•Threat analysis object repository
Proposed Technical Approach: New EffortKey Technologies:•Semantic object matching•Clustering large datasets – METIS•Latent/Indirect association analyzerTask List:•T1: Data normalization through the development of wrappers/connectors for various databases.•T2: Integrated schema creation to model information found in all databases.•T3: Matching entities (suspects, events, etc.) across multiple data sources; resolving conflicting attributes values for entities across databases.•T4: Clustering of suspect profiles.•T5: Building networks of hidden associations between suspects.•T6: Constructing temporal activity tracks of events and linkage of suspects to the tracks.
Rough Order of Magnitude Cost and Schedule:•Tasks 1 and 2 will each proceed in parallel for the first 12 months, with version 1 released at the end of 6 months. At this point tasks 3,4,5,6 will start and proceed in parallel. Cross feedback across various tasks will lead to final, refined tools at the end of the 18 month period.Deliverables:•Global schema, dictionary, and directory for the integrated database.•Software that realizes the virtual integrated DB view.•User manuals, test reports, database schema•Quarterly technical and status reports, and final report.Corporate Information:•Vipin Kumar (POC)•Army Research Center, University of Minnesota, 1100 Washington Avenue SE, Minneapolis, MN 55455•Phone (612)626-8095; E-mail: [email protected]
AHPCRCUniversity of Minnesota
Window
Chair
Credenza
Door
Plant
Baseboard H
eater
Chair
Chair
Shelves
Database Connectors
Information integration:matching, clustering,profiles, networks, tracks