Spontaneous reports• Disproportionality and Bayesian smoothing• Computer environment—Drilldown, signal management• Drug interaction signals• Logistic regression on spontaneous report databases
Clinical trial safety data analyses• CDISC standard—pooling events from many trials• Multiple comparisons—Many events, many subgroups• Bayesian smoothing of rare-event probabilities• Searching for unexpected syndromes due to treatment• Subgroup analyses using Bayesian logistic regression
2
Databases of Spontaneous Adverse Drug Reaction Reports
US FDA Spontaneous Report System (SRS/AERS)• Post-Marketing Surveillance of all Drugs since 1969• Renamed AERS (Adverse Event Reporting System) in 1997
– New ADR Coding System (COSTART vs. MedDRA)
• Version without Identifiers Available Publicly
US FDA/CDC Vaccine Adverse Events (VAERS)• Stricter US Laws for Vaccine Adverse Event Reporting
Other Databases for Medical Devices, etc.
World Health Organization VIGIBASE• Includes Data from many Countries• ADR Coding System WHOART
3
Objectives and Limitations of Analyses of Spontaneous Reports
Explore for Drug-Event Associations• Estimate a Measure of Association for every Combination• How Can a Rate Be Defined without a Denominator?
– Matching External Sales or Prescription Counts Not Feasible– Construct Internal Denominators from Independence Model
• Screening Objective – All Findings Require Follow-up
Severe Limitations of Data Reliability• No Research Protocol• Adverse Event Report Rates Vary from Year to Year• Report Rates Vary by Drug and by ADR Type• No Certainty that a Reported Reaction Was Causal
4
Constructing a Denominator for N
For every DiEj pair = (Drug of Interest, Event of Interest)• Use the database to tabulate a 2 x 2 table of report counts• Compute an expected or baseline count e from (a, b, c, d)
– Based on assumption of no association between Drug and Event– e = b(a + c)/(b + d) [Proportional Reporting Ratio method]– e = bc/d [Reporting Odds Ratio method]– e = (a + b)(a + c)/(a+b+c+d) [Relative Report Rate: MGPS method]
• This method works best when adjusting for trend or demographic covariates in computation of e
• n/e = Measure of Disproportionality for this Drug and Event
Reports With Drug i
ReportsW/O Drug i Total
Reports With Event j nij = a b a + b
Reports W/O Event j c d c + d
Total a + c b + d a+b+c+d
5
Disproportionality Analyses
Although the idea of computing n/e ratios for all or some drug-event combinations is simple, its widespread use is very recent
• Computer and database advances enabled ease of use and evaluation
Biostatisticians were uncomfortable with performing formal analyses on tabulations of spontaneous reports
• Unknown reporting mechanism can lead to reporting biases• Frequent noncausal associations with indications and comorbidities• All large values of n/e require follow-up for medical validity
Small values of n and/or e require statistical sophistication• PRR requires threshold values of n and 2 x 2 table chi-squared value• Bayesian statistical methods produce “shrinkage” values of n/e
– Help avoid the “multiple comparisons” fallacy• US FDA, UK MHRA and WHO UMC have each adopted Bayesian
disproportionality methods
6
Combined Analysis of Drug-Event Counts in a Database
Large Two-Way Table with Possibly Millions of Cells• One Column for each Drug, One Row for each Event• Rows and Columns May Have Thousands of Categories• Most Cells Are Empty, even though N.. Is very Large
“Bayesian Data Mining in Large Frequency Tables”• The American Statistician (1999) (with Discussion)• SRS Database with 1398 Drugs and 952 AE Codes• Nij = Count of Reports Containing Drug i and Event j• Only 386 000 out of 1 331 000 Cells Have Nij > 0• 174 Drug-Event Combinations Have Nij > 1000• Develops and Illustrates Bayesian Estimation Method “GPS”
Assume Superpopulation Model for λ• Prior Distribution Is Mixture of 2 Gamma Distributions• Estimate the 5-Parameter Prior from All the (Nij , Eij) Pairs
Posterior Distributions of each λij Are Used to Create “Shrinkage” Estimates
• EBGM = Empirical Bayes Geometric Mean of Posterior Dist.– Estimate of µij /Eij Has Smaller Variance than Nij /Eij
• Rank Cells by EB05ij = Lower 5% Point of Posterior Dist.• More “Interesting” than Ranking Cells Based on “P-Values”
– Compare (N = 10, E = 0.1) to (N = 2000, E = 1000)
8
Plot of Classical Estimate with Conf. Int. and Bayesian “Shrinkage” Estimates [O]
HYPALGESIALIVEDAMAGAGGRALIVEDAMAGAGGRACARCINOMALIVERHEPATINONSPECIHEPATINONSPECI O
OOOOOO
OO
OOOOOOOOOOO
OOO
OO
OO
OOO
0.3 1 3 10 30 100 300 1000 10000 100000
Relative Risk
0.3 1 3 10 30 100 300 1000 10000 100000
Relative Risk
O Empirical Bayes Geometric Mean of RR ---|--- Observed RR with 99.9% Classical Conf. Int.
9
Example of Large Signal with Small N
Rotovirus Vaccine
The RV Vaccine Was Used in U.S. in 1998-99 and Was Withdrawn from the Market when the Association with Intussusception, a Severe GI Condition, Was Confirmed.
10
Computerized Safety Signal AnalysisData mining and statistical signal detection
• Empirical Bayes estimates of relative reporting rate (EBGM)• Proportional Reporting Ratios (PRR)• Graphical and tabular presentation
Access to safety report data• Drilldown to case data from data mining associations• A case series feature to organize and record evaluations• Analyses of both public and private safety databases
Modern web-based software• All processing on server• Simple web browser client – operates through firewalls
In-House Data Can Be Combined with Public Databases
11
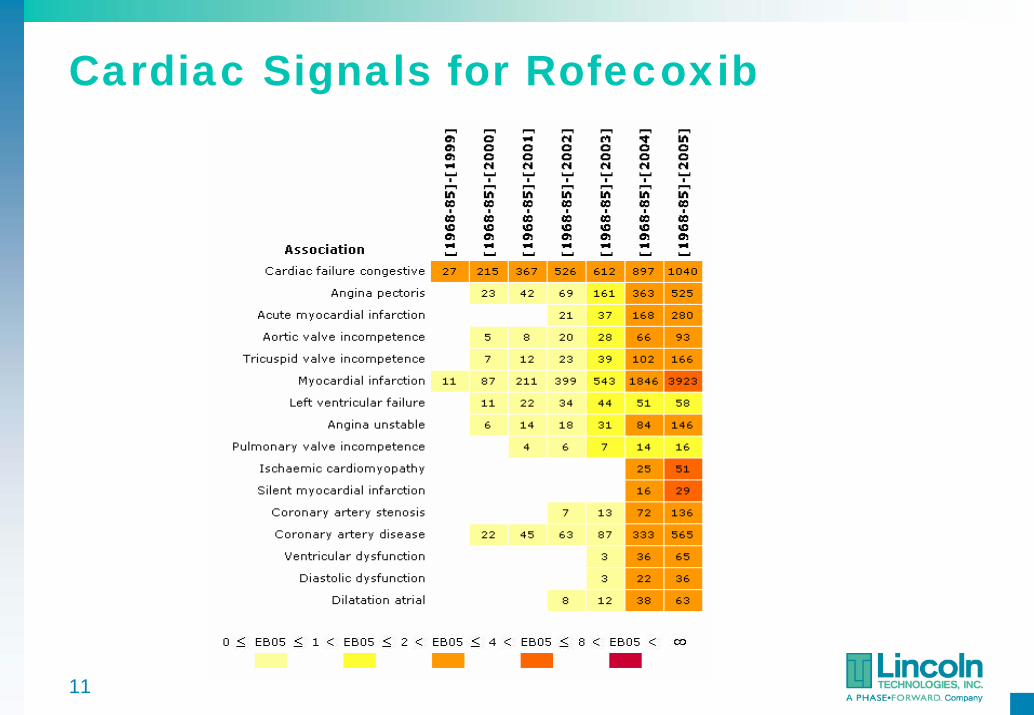
Cardiac Signals for Rofecoxib
12
Comparisons of NSAIDS in AERS
AERS to 3Q03 (Suspect drugs)
13
Importance of Studying Drug Interactions
Drug interactions cause up to 2.8% of hospital admissions
(Grymonpre et al. J Am Geriatr Soc 1988)
50% of elderly take 5 drugs/week; 12% take 10 drugs/week
(Harvard Health Letter: March 2004)
The more medications you take, the greater your chance of a drug interaction
Drug Event N EBGM PRRCisapride Torsade de pointes 92 19.525 69.919 Erythromycin Torsade de pointes 58 20.425 13.227
Cisapride-Erythromycin Torsade de pointes 18 228.733 755.355
15
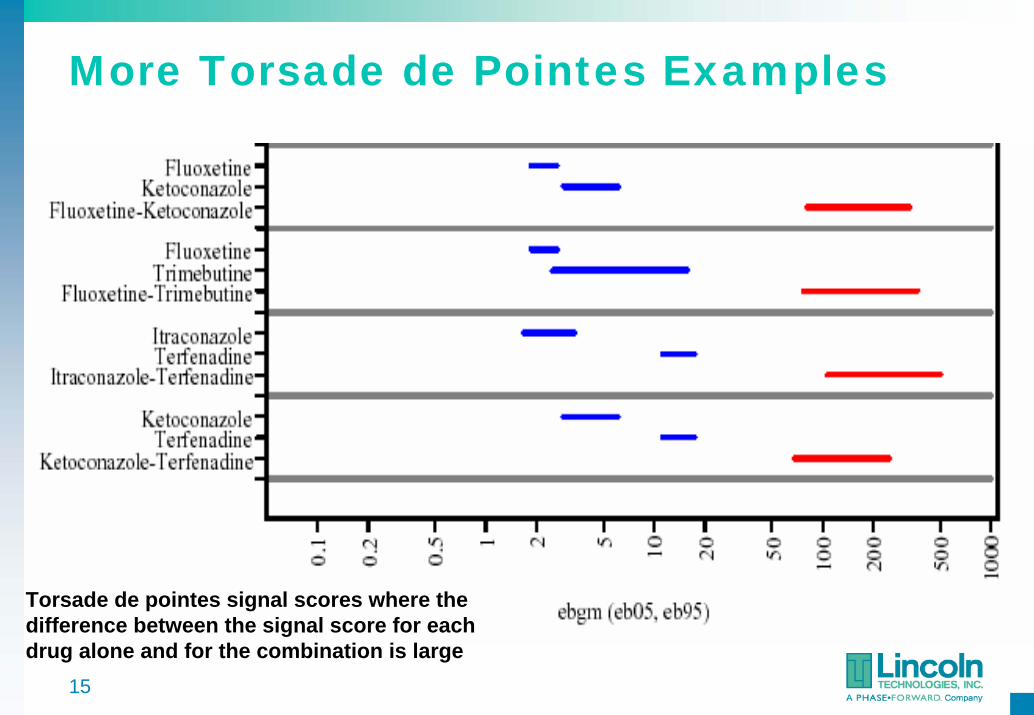
More Torsade de Pointes Examples
Torsade de pointes signal scores where the difference between the signal score for each drug alone and for the combination is large
16
Masking – Effect of Background Rate
A relative reporting rate needs a denominator• This background or “noise” rate should ideally exclude effects
of predictors having very large signals
MGPS, PRR and similar methods naively assume that all reports excluding the one drug being focused on are background noise
• The “control group” may include other drugs with very high signals for the event of interest
• Analysis should estimate the effects of more than one drug at a time
– 2 x 2 Table analysis is too simple
17
Confounding
Unless multiple predictors are themselves uncorrelated, one-predictor-at-a-time analyses can be biased
• GPS, PRR and similar methods don’t account for effect of Drug-Drug associations on Drug-Event associations
• Drugs that are often prescribed together can be confounded– Co-prescribed drugs partially inherit each other’s associations
• Synonymous terms– Signal leakage– Innocent bystander effect
Need a multivariate methodology
18
Multiple Regression AnalysisStandard method for deconfounding predictors
• Adverse event as response (dependent variable)• Stratification variables and drug presence/absence as predictors• Background noise rate automatically estimated• Can be extended to estimate drug interactions
Several variants of multiple regression are available• Logistic regression most often used when response is event
presence/absence– Assumes log[P/(1-P)] is a sum of predictor effects– Coefficients are interpreted as logs of odds ratios
• Must verify assumptions of particular regression model
Different regression fit for each adverse event• Each regression has coefficients for many different drugs
19
Shrinkage Methods for Regression
Put a Prior Distribution on the Coefficients (B1, B2, …)• The Prior Distribution Moves the Estimated Bs Toward 0
– Stabilizes the estimation when there are very many predictors– Bayesian solution to the multiple comparisons problem
• Combining regressions on different responses (events)– Medically related events (e.g. same SOC) may have similar coefficients– Bayesian hierarchical model can allow “borrowing strength” across events
Common Ways to Choose the Prior Distribution• Must Decide How Much to Shrink• Cross-Validation: Choose Prior to Fit Left-Out Data• Bayes: Fit Prior Parameters at Same Time as the Bs• Methods Are Well-Developed in Data Mining Literature
20
Szarfman (2005 FDA Science Forum)
21
Clinical Trial Safety DataSimilarities with spontaneous report data
• Could use 2 x 2 table analyses or logistic regression• Must cope with multiple comparisons
Differences• Smaller sample sizes• Usually just two treatments vs. thousands in database• Prospective study• Randomized allocation of treatment• More valid comparison group
Active surveillance studies• Large longitudinal database of medical records• Attempt to match users of two drugs with propensity scores• Maybe closer to clinical trial data than to spontaneous reports
22
Pooling Data Across Trials
Combined analysis of multiple trials comparing the same treatment
• May be the best option for studying rare adverse events• Analyses can adjust for varying background rate per trial• Similar to pooled-data meta-analyses
CDISC data format standard for clinical trials• Consortium of FDA, drug companies, and software firms• FDA has announced eventual requirement for all NDAs• Several such NDAs have been submitted already• Some FDA reviewers are now doing partial conversions to CDISC
SDTM format to allow combined safety reviews• Software to take advantage of the data standard available or under
development by various vendors
23
Bayesian Shrinkage ModelsStatistical validity of searching for extreme differences
• Most significant adverse event or patient subgroup
Classical approach to post-hoc interval estimates• Maintain centers of CI at observed differences• Expand widths of every CI • Expansion is greater the more differences you look at• If you look at too many, the CI’s are too wide to be useful
Bayesian approach • Requires a prior distribution for differences
– Can estimate it from the multiple observed differences available• Centers of CI’s are “shrunk” toward average or null difference
– High-variance differences shrink the most• Widths of CI’s usually shrink a little too• The more you look at, the better you can model the prior dist.
24
Searching for Event ClustersAn event cluster (associated with treatment) is a set of at least three AEs for which all pairs of said AEs tend to show up in Treatment patients more often than Comparator patients and also more than expected if the AEs are independent within each arm of the study
• Defining potential syndromes by event frequency distributions rather than by theoretical medical mechanisms
We declare a potential syndrome if all pairs within a cluster meet some distributional threshold
• Syndromic Odds Ratio for 2 events (Treatment vs. Comparator)– SOR(E1,E2) = OR(E1*E2)/max[OR(E1), OR(E2), 1]
• Bayesian statistical methods estimate smoothed probabilities for AEs and pairs of AEs for each arm of the studies
– EB versions of Beta-binomial model seem to work well
• Clustering algorithms find groups of events having high SORs
25
Empirical Bayes Beta-Binomial Model
Assume K different binomial distributions• Nk ~ Binomial(nk, Pk) k = 1, …, K• Pk ~ Beta(βXk1, βXk2) N, n, X known; Pk unknown
Suppose you want to shrink Nk/nk toward Xk1/(Xk1 + Xk2)• Estimate β by maximum likelihood for beta-binomial distribution • Only one parameter to estimate• Posterior mean of Pk = (Nk + βXk1)/(nk + βXk1 + βXk2)
Various choices of X for different applications• Xk1 = p0, Xk2 = 1 – p0 [Shrink every Nk/nk toward p0]
The shrinkage estimators are useful when many of the counts are 0 and you want to estimate odds ratios
• Multiple comparisons protection when searching for extreme deviations
26
Bayes Model for Event ProbabilitiesEvents 1 to K with Treatment and Comparator Groups
• nt patients in treatment group, (n – nt) in comparator group• Nkt treatment patients with event k, (Nk – Nkt) in comparator group• Pk = probability of event k in treatment group [= Nkt / nt ??]• Qk = probability of event k in comparator group [= (Nk-Nkt)/(n-nt)??]• Bayes model shrinks both Pk and Qk toward Nk / n• Equivalently, shrink every Nkt/Nk toward nt/n• “Beta-binomial” Bayesian model for proportions• Pk = (Nkt + βnt/n) / (Nk + βnt/Nk) [estimate β by EB method]• Qk = (Nk - Nkt + β (n-nt)/n) / (n-Nk + β(n-nt)/Nk) [same β for all k]
Bayes Model for Event PairsNjk = Number of patients with both AE j and AE k
• Njkt and (Njk – Njkt) in treatment and comparator groups• Pjk = probability of both event j and k in treatment patient• Qjk = probability of both event j and k in comparator patient• If AEs are independent, Pjk = PjPk and Qjk = QjQk
• Another beta-binomial model to shrink Njkt/nt toward PjPk and yet another to shrink (Njk – Njkt)/(n – nt) toward QjQk
Syndromic Odds Ratio • SORjk = ORjk / max(1, ORj, ORk)• AE pairs occur together preferentially in treatment group more
strongly than can be explained by single-AE associations
28
Finding Potential SyndromesCluster AEs using distance measure djk = 1/SORjk
Standard Hierarchical Clustering Methods• Use either complete or average linkage methods• Example uses average djk < 2/3 [SOR > 1.5]• Discard clusters with fewer than three AEs
Example from a Trial with n = 902, nt = 676• Most frequent 50 AEs are analyzed
EVENT N (Overall) N (Treatment) P (Overall) P.EB.Treatment P.EB.Comparator OR.EB OR.05 OR.95THIRSTPT 152 147 0.1685 0.2104 0.0431 5.92 3.38 10.37
Counts of Event Pairs (Treatment/Comparator) for Events Belonging to Potential Syndromes.
4 < SOR < 82 < SOR < 41 < SOR < 2
30
Example for Cluster of 4 EventsNote that Odds Ratio for Event Pair > Odds Ratio for each Event [902 patients, 676 Treated]
• Syndromic OR measures how much OR for pair exceeds maximum of OR for component events• When SOR threshold is exceeded for all pairs within a group of 3+ events, call it a potential syndrome
31
Logistic Regression for Subgroup Analyses of Multiple Events
Start from a set of Medically Related events to study• Set of events from potential signal• Set of events from SOR clusters (potential syndromes)• Set of ad-hoc events, or all events within a MedDRA SOC
Fit Logistic Regressions to each AE as a response• Use exactly the same predictor model for each AE
– Age, gender, concomitant medication, medical history, etc.
• Include treatment and interactions with treatment as predictors• Generate parameter estimates for predictors and interactions
Empirical Bayes shrinkage of estimated coefficients• Coefficients of each predictor borrow strength across AEs• Overall treatment and interaction effects shrink toward 0
32
Rationale for EB Model Across Events
Coping with fine grain of adverse event data• Compare T vs. C on 20 varieties of hepatic issues• Approach 1—separate analyses of all 20 events
– Small counts lead to non significant comparisons– Adjustment for multiple comparisons further reduces sensitivity
• Approach 2—define a single event as union of the 20 events– Significant differences may be washed out by the pooling– Even if significant, little information about original 20 differences
Compromise approach—EB hierarchical model• 20 individual estimates that “borrow strength” from each other• Let Bjk = coefficient of jth treatment effect/interaction on kth AE
– Bjk ~ N(µj, σj2) [prior distribution shrinks AEs toward each other]
• Estimated prior variances σj2 and τ2 control amount of shrinkage
– Appropriate amount of shrinkage avoids multiple comparisons fallacy
33
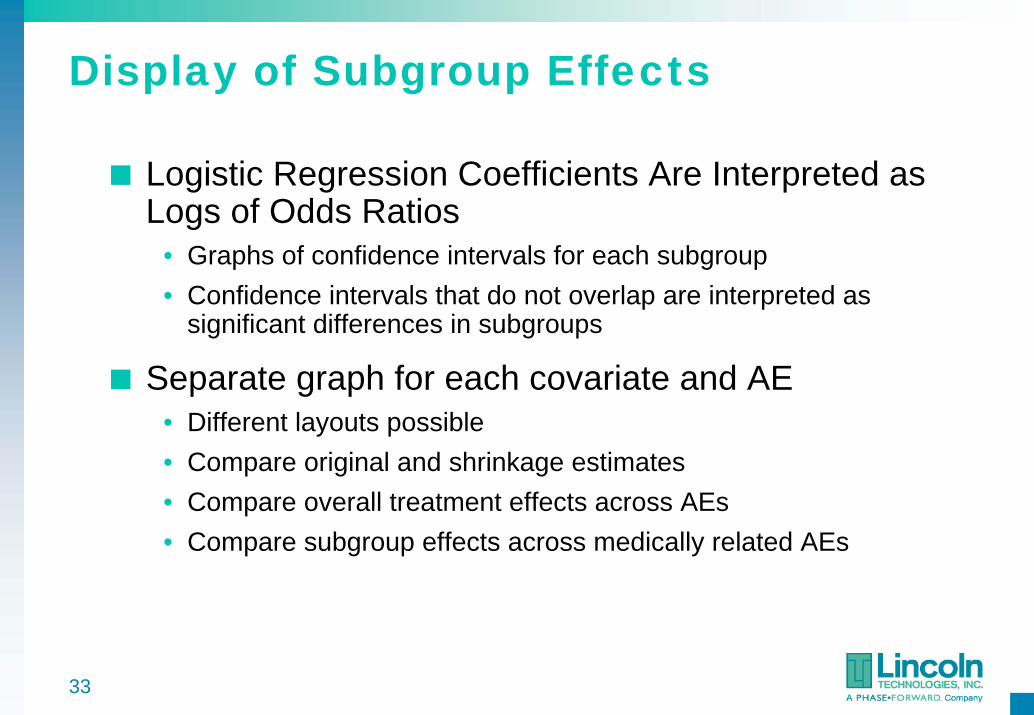
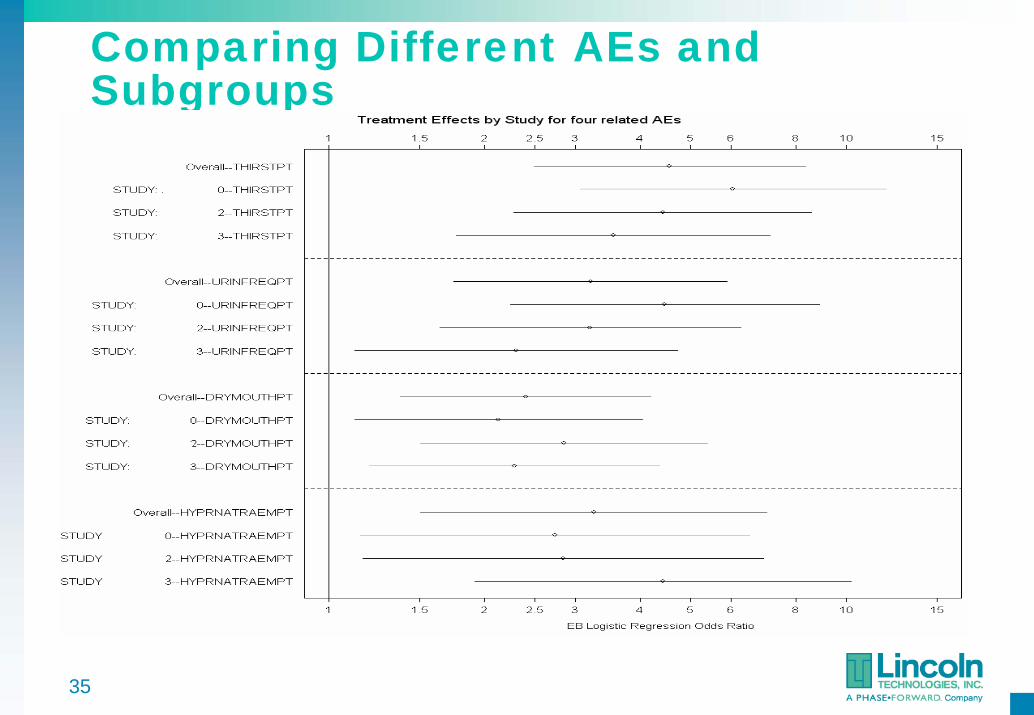
Display of Subgroup Effects
Logistic Regression Coefficients Are Interpreted as Logs of Odds Ratios
• Graphs of confidence intervals for each subgroup• Confidence intervals that do not overlap are interpreted as
significant differences in subgroups
Separate graph for each covariate and AE• Different layouts possible• Compare original and shrinkage estimates• Compare overall treatment effects across AEs• Compare subgroup effects across medically related AEs
34
Display of Subgroup Effects
35
Comparing Different AEs and Subgroups
36
Safety Analyses of Clinical DataData mining of clinical trial safety data has many of the same challenges as analysis of spontaneous reports
• Although the data will be cleaner, there will be less of it and the multiple comparisons issues are just as significant
Combined analyses of multiple trials is important• CDISC data standards make pooling data easier• This is a form of pooled-data meta-analysis
Bayesian models can be useful here too• Multivariate estimation of many possibly related AEs• Searching for potential syndromes (different AEs in the same patients) that are
associated with treatment• Searching for subgroup effects• Borrowing strength across medically related AEs
37
Safety Data Mining References (1)Almenoff, J. S., W. DuMouchel, A. Kindman, X. Yang and D. M. Fram (2003). "Disproportionality analysis using empirical Bayes data mining: a tool for the evaluation of drug interactions in the post-marketing setting." Pharmacoepidemiology and Drug Safety 12(6): 517-521.Almenoff JA, LaCroix KK, Yuen NA, Fram D, DuMouchel W (2006) Comparative Performance of Two Quantitative Safety Signalling Methods - Implications for Use in a Pharmacovigilance Department. Drug Safety, 29 (10): 875-887.Bate A, Lindquist M, Edwards IR, Orre R (2002) A Data Mining Approach for Signal Detection and Analysis. Drug Safety, 25(6): p. 393-397.DuMouchel W (1999) Bayesian data mining in large frequency tables, with an application to the FDA Spontaneous Reporting System. The American Statistician, 53(3):177-190.DuMouchel W, Pregibon D (2001) Empirical Bayes screening for multi-item associations. in 7th ACM SigKDD Intl Conference on Knowledge Discovery and Data Mining. San Francisco: ACM Press.DuMouchel W, Smith ET, Beasley R, Nelson H, Yang X, Fram D, Almenoff JA (2004) Association of asthma therapy and Churg-Strauss syndrome: an analysis of postmarketing surveillance data, Clinical Therapeutics, vol. 26, no. 7.Evans S (2002) Statistical Methods of Signal Detection in Mann R, Andrews E, Pharmacovigilance,Wiley, ISBN 0-470-49441-0Fram DM, Almenoff JS, DuMouchel W (2003) Empirical Bayesian Data Mining for Discovering Patterns in Post-Marketing Drug Safety Data Proc. ACMSIGKDD 2003 Intl. Conf. on Knowledge Discovery from Data.
38
Safety Data Mining References (2)
Niu MT, Erwin DE, Braun MM (2001) Data mining in the US Vaccine Adverse Event Reporting System (VAERS): early detection of intussusception and other events after rotavirus vaccination. Vaccine, 19: 4627-37.O'Neill RT, Szarfman A (1999) Discussion: Bayesian data mining in large frequency tables, with an application to the FDA Spontaneous Reporting System by William DuMouchel. The American Statistician 53(3):190-6.O'Neill RT, Szarfman A (2001) Some FDA perspectives on data mining for pediatric safety assessment. Curr Ther Res Clin Exp 62:650-663.Solomon R, DuMouchel W (2006) Contrast Media and Nephropathy: Findings from Systematic Analysis and Food and Drug Administration Reports of Adverse Effects. Investigative Radiology, 41(8): 651-660.Szarfman A, Machado SG, O’Neill RT (2002) Use of Screening Algorithms and Computer Systemsto Efficiently Signal Higher-Than-Expected Combinations of Drugs and Events in the US FDA’s Spontaneous Reports Database. Drug Safety 25(6): p. 381-392.van Puijenbroek EP, Diemont WL, van Grootheest K (2003) Application of Quantitative Signal Detection in the Dutch Spontaneous Reporting System for Adverse Drug Reactions Drug Safety26 (5): 293-301Yang XM (2004) Using disproportional analysis as a tool to explore severe drug-drug interactions in AERS database Pharmacoepidemiology and Drug Safety 13, supplement 1: S247