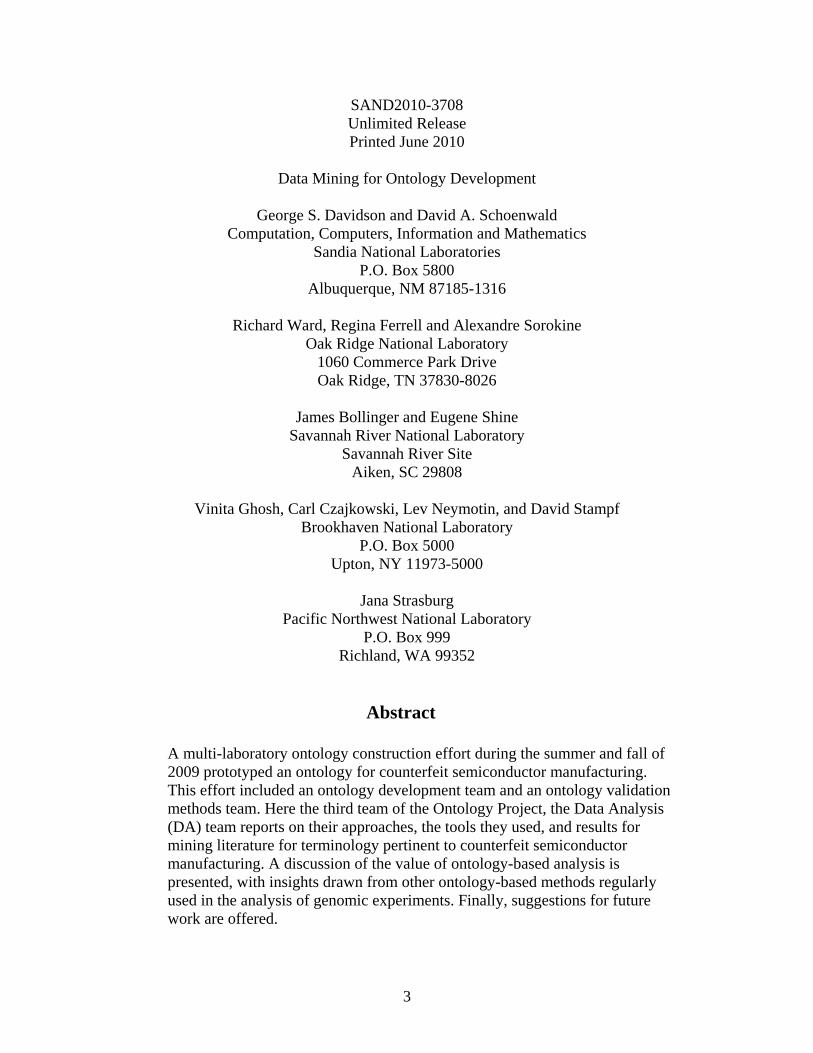
SANDIA REPORT SAND2010-3708 Unlimited Release Printed June 2010 Data Mining for Ontology Development George S. Davidson, Richard Ward, David Schoenwald, Regina Ferrell, Alexandre Sorokine, James Bollinger, Eugene Shine, Vinita Ghosh, Carl Czajkowski, Lev Neymotin, David Stampf, and Jana Strasburg Prepared by Sandia National Laboratories Albuquerque, New Mexico 87185 and Livermore, California 94550 Sandia is a multiprogram laboratory operated by Sandia Corporation, a Lockheed Martin Company, for the United States Department of Energy’s National Nuclear Security Administration under Contract DE-AC04-94AL85000. Approved for public release; further dissemination unlimited.
Transcript
SANDIA REPORT SAND2010-3708 Unlimited Release Printed June 2010
Data Mining for Ontology Development George S. Davidson, Richard Ward, David Schoenwald, Regina Ferrell, Alexandre Sorokine, James Bollinger, Eugene Shine, Vinita Ghosh, Carl Czajkowski, Lev Neymotin, David Stampf, and Jana Strasburg Prepared by Sandia National Laboratories Albuquerque, New Mexico 87185 and Livermore, California 94550
Sandia is a multiprogram laboratory operated by Sandia Corporation, a Lockheed Martin Company, for the United States Department of Energy’s National Nuclear Security Administration under Contract DE-AC04-94AL85000.
Approved for public release; further dissemination unlimited.
2
Issued by Sandia National Laboratories, operated for the United States Department of Energy by Sandia Corporation. NOTICE: This report was prepared as an account of work sponsored by an agency of the United States Government. Neither the United States Government, nor any agency thereof, nor any of their employees, nor any of their contractors, subcontractors, or their employees, make any warranty, express or implied, or assume any legal liability or responsibility for the accuracy, completeness, or usefulness of any information, apparatus, product, or process disclosed, or represent that its use would not infringe privately owned rights. Reference herein to any specific commercial product, process, or service by trade name, trademark, manufacturer, or otherwise, does not necessarily constitute or imply its endorsement, recommendation, or favoring by the United States Government, any agency thereof, or any of their contractors or subcontractors. The views and opinions expressed herein do not necessarily state or reflect those of the United States Government, any agency thereof, or any of their contractors. Printed in the United States of America. This report has been reproduced directly from the best available copy. Available to DOE and DOE contractors from U.S. Department of Energy Office of Scientific and Technical Information P.O. Box 62 Oak Ridge, TN 37831 Telephone: (865) 576-8401 Facsimile: (865) 576-5728 E-Mail: [email protected] Online ordering: http://www.osti.gov/bridge Available to the public from U.S. Department of Commerce National Technical Information Service 5285 Port Royal Rd. Springfield, VA 22161 Telephone: (800) 553-6847 Facsimile: (703) 605-6900 E-Mail: [email protected] Online order: http://www.ntis.gov/help/ordermethods.asp?loc=7-4-0#online
3
SAND2010-3708 Unlimited Release Printed June 2010
Data Mining for Ontology Development
George S. Davidson and David A. Schoenwald
Computation, Computers, Information and Mathematics Sandia National Laboratories
P.O. Box 5800 Albuquerque, NM 87185-1316
Richard Ward, Regina Ferrell and Alexandre Sorokine
Oak Ridge National Laboratory 1060 Commerce Park Drive Oak Ridge, TN 37830-8026
James Bollinger and Eugene Shine
Savannah River National Laboratory Savannah River Site
Aiken, SC 29808
Vinita Ghosh, Carl Czajkowski, Lev Neymotin, and David Stampf Brookhaven National Laboratory
P.O. Box 5000 Upton, NY 11973-5000
Jana Strasburg
Pacific Northwest National Laboratory P.O. Box 999
Richland, WA 99352
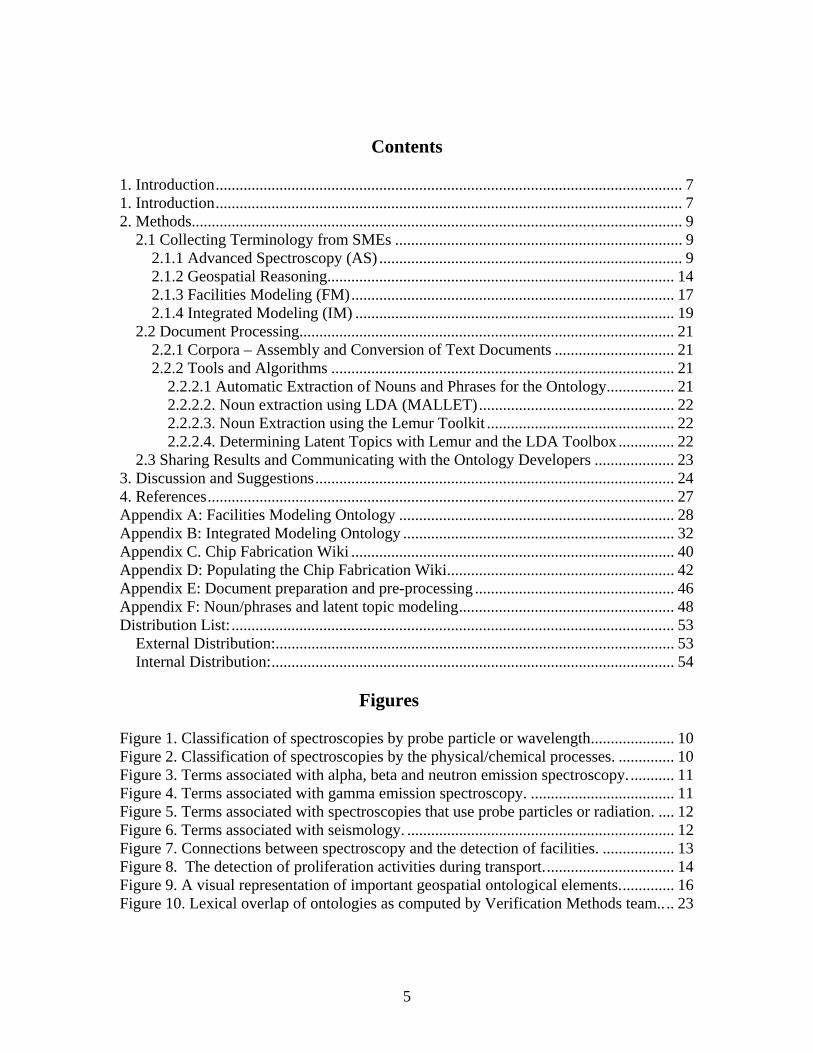
Abstract
A multi-laboratory ontology construction effort during the summer and fall of 2009 prototyped an ontology for counterfeit semiconductor manufacturing. This effort included an ontology development team and an ontology validation methods team. Here the third team of the Ontology Project, the Data Analysis (DA) team reports on their approaches, the tools they used, and results for mining literature for terminology pertinent to counterfeit semiconductor manufacturing. A discussion of the value of ontology-based analysis is presented, with insights drawn from other ontology-based methods regularly used in the analysis of genomic experiments. Finally, suggestions for future work are offered.
4
Acknowledgements
We wish to acknowledge Alexander Slepoy’s leadership and funding from the NA-22 Office and Jana Strasburg and Sandra Thompson, laboratory detailees assigned to NA-22. We also wish to acknowledge the SMEs who guided us in this effort, including Thomas E. Zipperian (SNL), Carol W. Sumpter (SNL), Thomas K. Lemp (SNL), Ken Tobin (ORNL). We also acknowledge the assistance of Craig Blackhart (LANL) in using the Chip Fabrication Wiki.
2.2 Document Processing.............................................................................................. 21 2.2.1 Corpora – Assembly and Conversion of Text Documents .............................. 21 2.2.2 Tools and Algorithms ...................................................................................... 21
2.2.2.1 Automatic Extraction of Nouns and Phrases for the Ontology ................. 21 2.2.2.2. Noun extraction using LDA (MALLET) ................................................. 22 2.2.2.3. Noun Extraction using the Lemur Toolkit ............................................... 22 2.2.2.4. Determining Latent Topics with Lemur and the LDA Toolbox .............. 22
2.3 Sharing Results and Communicating with the Ontology Developers .................... 23 3. Discussion and Suggestions .......................................................................................... 24 4. References ..................................................................................................................... 27 Appendix A: Facilities Modeling Ontology ..................................................................... 28 Appendix B: Integrated Modeling Ontology .................................................................... 32 Appendix C. Chip Fabrication Wiki ................................................................................. 40 Appendix D: Populating the Chip Fabrication Wiki ......................................................... 42 Appendix E: Document preparation and pre-processing .................................................. 46 Appendix F: Noun/phrases and latent topic modeling ...................................................... 48 Distribution List: ............................................................................................................... 53
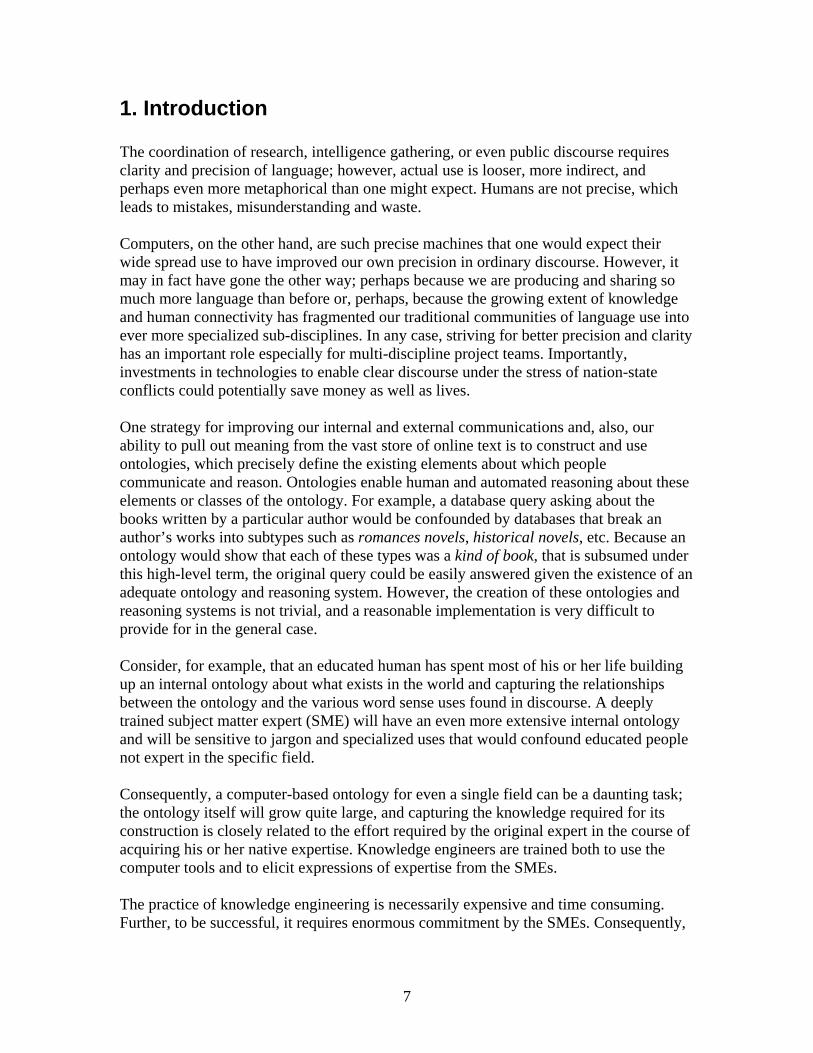
Figures Figure 1. Classification of spectroscopies by probe particle or wavelength ..................... 10 Figure 2. Classification of spectroscopies by the physical/chemical processes. .............. 10 Figure 3. Terms associated with alpha, beta and neutron emission spectroscopy. ........... 11 Figure 4. Terms associated with gamma emission spectroscopy. .................................... 11 Figure 5. Terms associated with spectroscopies that use probe particles or radiation. .... 12 Figure 6. Terms associated with seismology. ................................................................... 12 Figure 7. Connections between spectroscopy and the detection of facilities. .................. 13 Figure 8. The detection of proliferation activities during transport. ................................ 14 Figure 9. A visual representation of important geospatial ontological elements. ............. 16 Figure 10. Lexical overlap of ontologies as computed by Verification Methods team.. .. 23
6
7
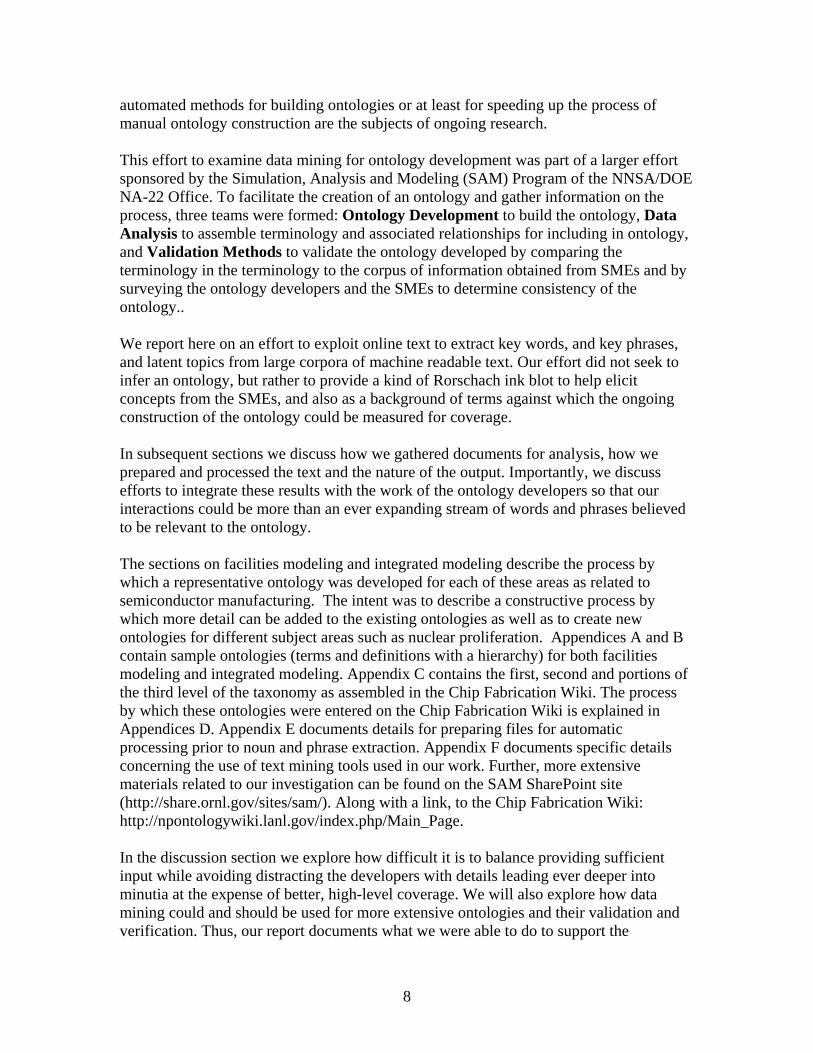
1. Introduction The coordination of research, intelligence gathering, or even public discourse requires clarity and precision of language; however, actual use is looser, more indirect, and perhaps even more metaphorical than one might expect. Humans are not precise, which leads to mistakes, misunderstanding and waste. Computers, on the other hand, are such precise machines that one would expect their wide spread use to have improved our own precision in ordinary discourse. However, it may in fact have gone the other way; perhaps because we are producing and sharing so much more language than before or, perhaps, because the growing extent of knowledge and human connectivity has fragmented our traditional communities of language use into ever more specialized sub-disciplines. In any case, striving for better precision and clarity has an important role especially for multi-discipline project teams. Importantly, investments in technologies to enable clear discourse under the stress of nation-state conflicts could potentially save money as well as lives. One strategy for improving our internal and external communications and, also, our ability to pull out meaning from the vast store of online text is to construct and use ontologies, which precisely define the existing elements about which people communicate and reason. Ontologies enable human and automated reasoning about these elements or classes of the ontology. For example, a database query asking about the books written by a particular author would be confounded by databases that break an author’s works into subtypes such as romances novels, historical novels, etc. Because an ontology would show that each of these types was a kind of book, that is subsumed under this high-level term, the original query could be easily answered given the existence of an adequate ontology and reasoning system. However, the creation of these ontologies and reasoning systems is not trivial, and a reasonable implementation is very difficult to provide for in the general case. Consider, for example, that an educated human has spent most of his or her life building up an internal ontology about what exists in the world and capturing the relationships between the ontology and the various word sense uses found in discourse. A deeply trained subject matter expert (SME) will have an even more extensive internal ontology and will be sensitive to jargon and specialized uses that would confound educated people not expert in the specific field. Consequently, a computer-based ontology for even a single field can be a daunting task; the ontology itself will grow quite large, and capturing the knowledge required for its construction is closely related to the effort required by the original expert in the course of acquiring his or her native expertise. Knowledge engineers are trained both to use the computer tools and to elicit expressions of expertise from the SMEs. The practice of knowledge engineering is necessarily expensive and time consuming. Further, to be successful, it requires enormous commitment by the SMEs. Consequently,
8
automated methods for building ontologies or at least for speeding up the process of manual ontology construction are the subjects of ongoing research. This effort to examine data mining for ontology development was part of a larger effort sponsored by the Simulation, Analysis and Modeling (SAM) Program of the NNSA/DOE NA-22 Office. To facilitate the creation of an ontology and gather information on the process, three teams were formed: Ontology Development to build the ontology, Data Analysis to assemble terminology and associated relationships for including in ontology, and Validation Methods to validate the ontology developed by comparing the terminology in the terminology to the corpus of information obtained from SMEs and by surveying the ontology developers and the SMEs to determine consistency of the ontology.. We report here on an effort to exploit online text to extract key words, and key phrases, and latent topics from large corpora of machine readable text. Our effort did not seek to infer an ontology, but rather to provide a kind of Rorschach ink blot to help elicit concepts from the SMEs, and also as a background of terms against which the ongoing construction of the ontology could be measured for coverage. In subsequent sections we discuss how we gathered documents for analysis, how we prepared and processed the text and the nature of the output. Importantly, we discuss efforts to integrate these results with the work of the ontology developers so that our interactions could be more than an ever expanding stream of words and phrases believed to be relevant to the ontology. The sections on facilities modeling and integrated modeling describe the process by which a representative ontology was developed for each of these areas as related to semiconductor manufacturing. The intent was to describe a constructive process by which more detail can be added to the existing ontologies as well as to create new ontologies for different subject areas such as nuclear proliferation. Appendices A and B contain sample ontologies (terms and definitions with a hierarchy) for both facilities modeling and integrated modeling. Appendix C contains the first, second and portions of the third level of the taxonomy as assembled in the Chip Fabrication Wiki. The process by which these ontologies were entered on the Chip Fabrication Wiki is explained in Appendices D. Appendix E documents details for preparing files for automatic processing prior to noun and phrase extraction. Appendix F documents specific details concerning the use of text mining tools used in our work. Further, more extensive materials related to our investigation can be found on the SAM SharePoint site (http://share.ornl.gov/sites/sam/). Along with a link, to the Chip Fabrication Wiki: http://npontologywiki.lanl.gov/index.php/Main_Page. In the discussion section we explore how difficult it is to balance providing sufficient input while avoiding distracting the developers with details leading ever deeper into minutia at the expense of better, high-level coverage. We will also explore how data mining could and should be used for more extensive ontologies and their validation and verification. Thus, our report documents what we were able to do to support the
9
development of a relatively small ontology covering aspects around the manufacture of illicit and counterfeit electronics and the trafficking of these products. The report also points toward how data mining might be used for larger ontology projects associated with the integrated technologies, models, and sources employed to detect and track nuclear proliferation.
2. Methods The Data Analysis team employed three methodologies for exploiting data mining for ontology development. First, we directly interviewed SMEs both within and external to our team. Second, we exploited published text and natural language processing tools to extend the lists of terms, concepts and phrases used by the SMEs. In some cases, these new words and phrases were the subject of follow-on interviews to elicit concepts that may not have been discussed in earlier interviews. Finally, we specifically worked to transfer our results to the Ontology Development Team. Some of the exchanges between our two teams were informal (cross participation in weekly team conference calls), others were more formal (exchanging word lists, concepts, and phrases via email and the SharePoint site). One important method of inter-team exchange was both formal and informal: the presentations and discussions at the project meetings in Washington, D.C. This section will briefly describe the two data mining approaches (direct discussions with SMEs, and document processing), and the inter-team exchange strategies. Details are further documented in the associated Appendices A-D. An evaluation of results and the uses of products of this work are deferred to the Discussion and Conclusions section.
2.1 Collecting Terminology from SMEs
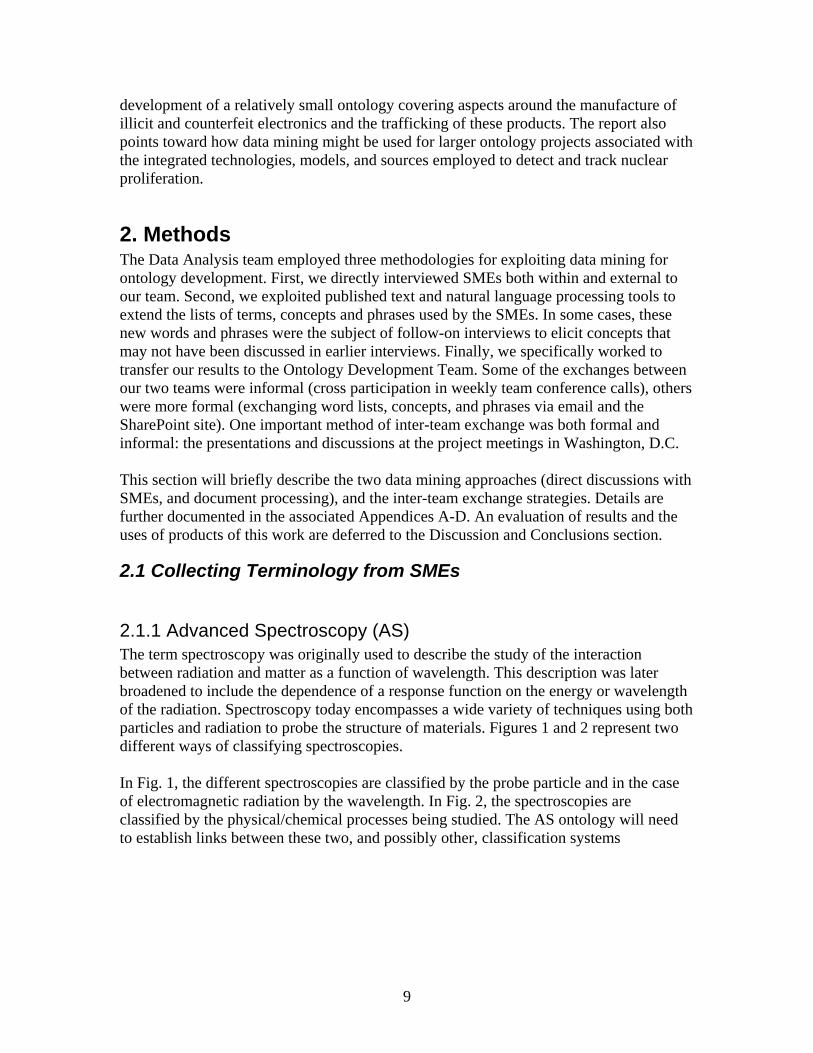
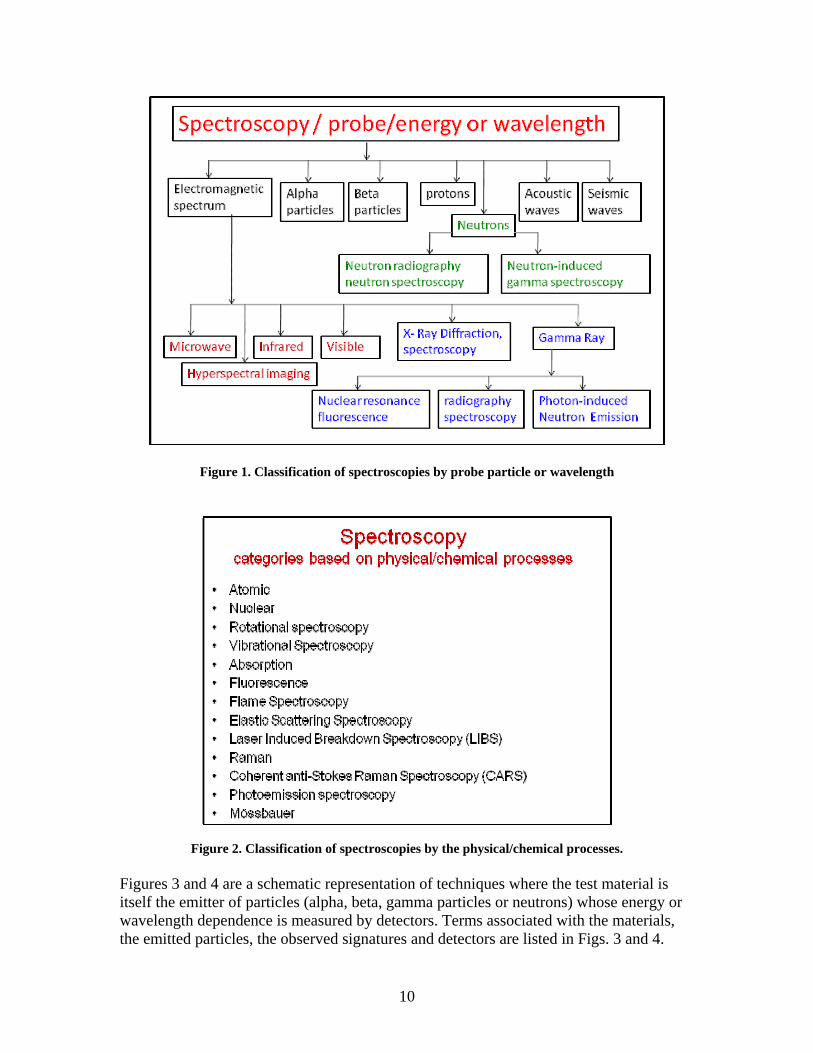
2.1.1 Advanced Spectroscopy (AS) The term spectroscopy was originally used to describe the study of the interaction between radiation and matter as a function of wavelength. This description was later broadened to include the dependence of a response function on the energy or wavelength of the radiation. Spectroscopy today encompasses a wide variety of techniques using both particles and radiation to probe the structure of materials. Figures 1 and 2 represent two different ways of classifying spectroscopies. In Fig. 1, the different spectroscopies are classified by the probe particle and in the case of electromagnetic radiation by the wavelength. In Fig. 2, the spectroscopies are classified by the physical/chemical processes being studied. The AS ontology will need to establish links between these two, and possibly other, classification systems
10
Figure 1. Classification of spectroscopies by probe particle or wavelength
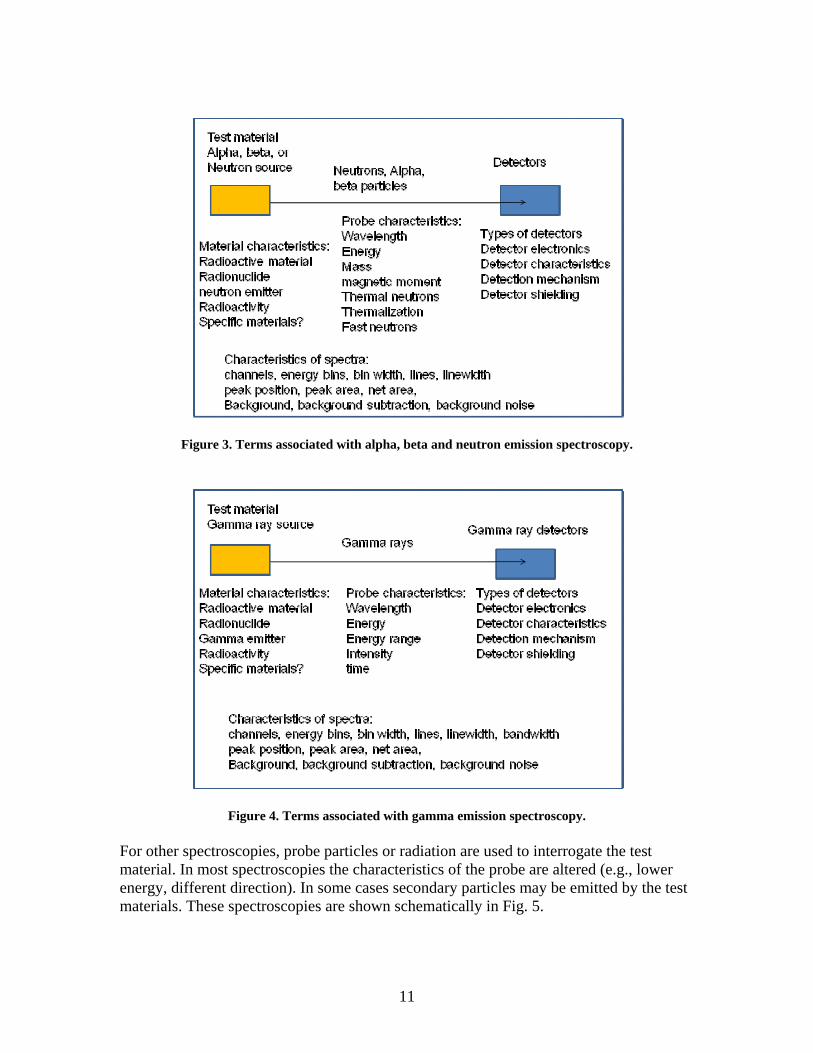
Figure 2. Classification of spectroscopies by the physical/chemical processes. Figures 3 and 4 are a schematic representation of techniques where the test material is itself the emitter of particles (alpha, beta, gamma particles or neutrons) whose energy or wavelength dependence is measured by detectors. Terms associated with the materials, the emitted particles, the observed signatures and detectors are listed in Figs. 3 and 4.
11
Figure 3. Terms associated with alpha, beta and neutron emission spectroscopy.
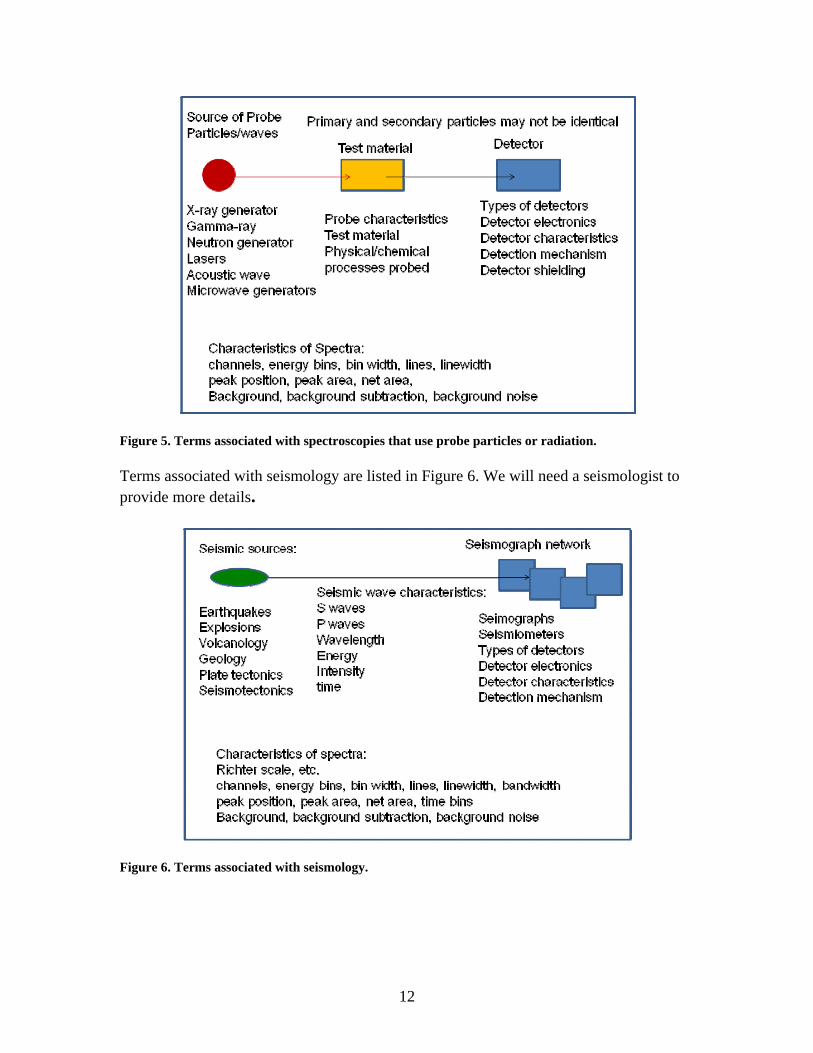
Figure 4. Terms associated with gamma emission spectroscopy. For other spectroscopies, probe particles or radiation are used to interrogate the test material. In most spectroscopies the characteristics of the probe are altered (e.g., lower energy, different direction). In some cases secondary particles may be emitted by the test materials. These spectroscopies are shown schematically in Fig. 5.
12
Figure 5. Terms associated with spectroscopies that use probe particles or radiation. Terms associated with seismology are listed in Figure 6. We will need a seismologist to provide more details.
Figure 6. Terms associated with seismology.
13
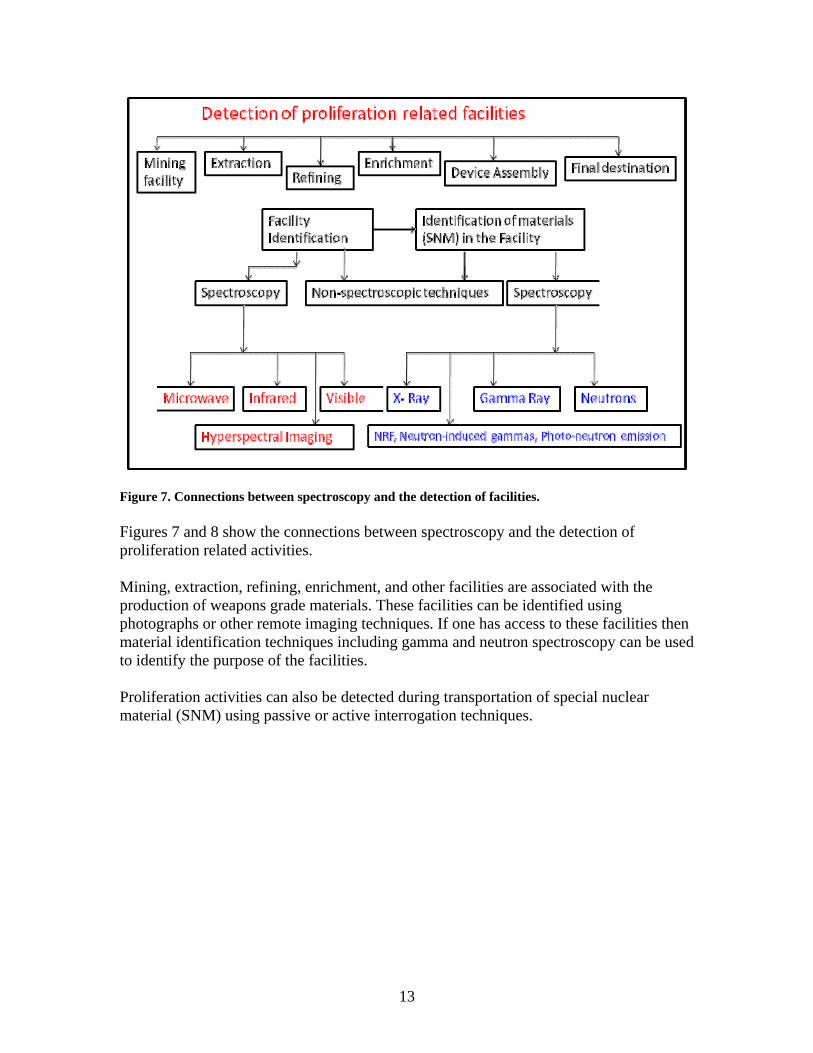
Figure 7. Connections between spectroscopy and the detection of facilities. Figures 7 and 8 show the connections between spectroscopy and the detection of proliferation related activities. Mining, extraction, refining, enrichment, and other facilities are associated with the production of weapons grade materials. These facilities can be identified using photographs or other remote imaging techniques. If one has access to these facilities then material identification techniques including gamma and neutron spectroscopy can be used to identify the purpose of the facilities. Proliferation activities can also be detected during transportation of special nuclear material (SNM) using passive or active interrogation techniques.
14
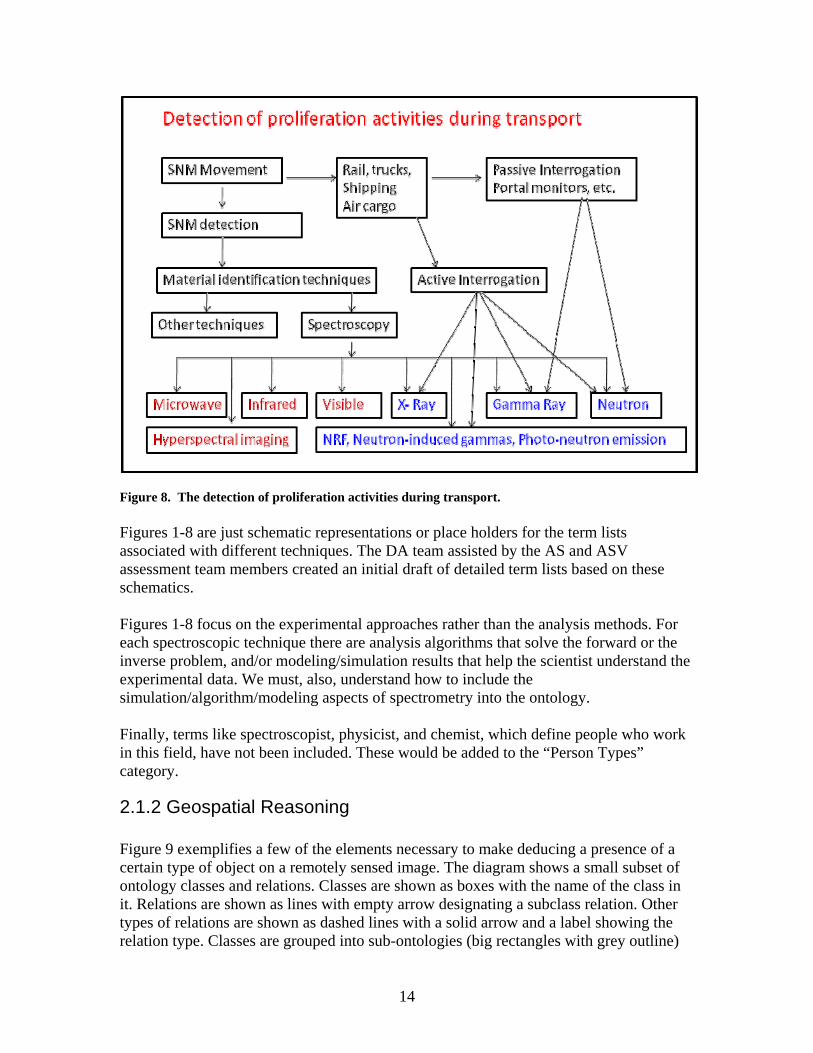
Figure 8. The detection of proliferation activities during transport. Figures 1-8 are just schematic representations or place holders for the term lists associated with different techniques. The DA team assisted by the AS and ASV assessment team members created an initial draft of detailed term lists based on these schematics. Figures 1-8 focus on the experimental approaches rather than the analysis methods. For each spectroscopic technique there are analysis algorithms that solve the forward or the inverse problem, and/or modeling/simulation results that help the scientist understand the experimental data. We must, also, understand how to include the simulation/algorithm/modeling aspects of spectrometry into the ontology. Finally, terms like spectroscopist, physicist, and chemist, which define people who work in this field, have not been included. These would be added to the “Person Types” category.
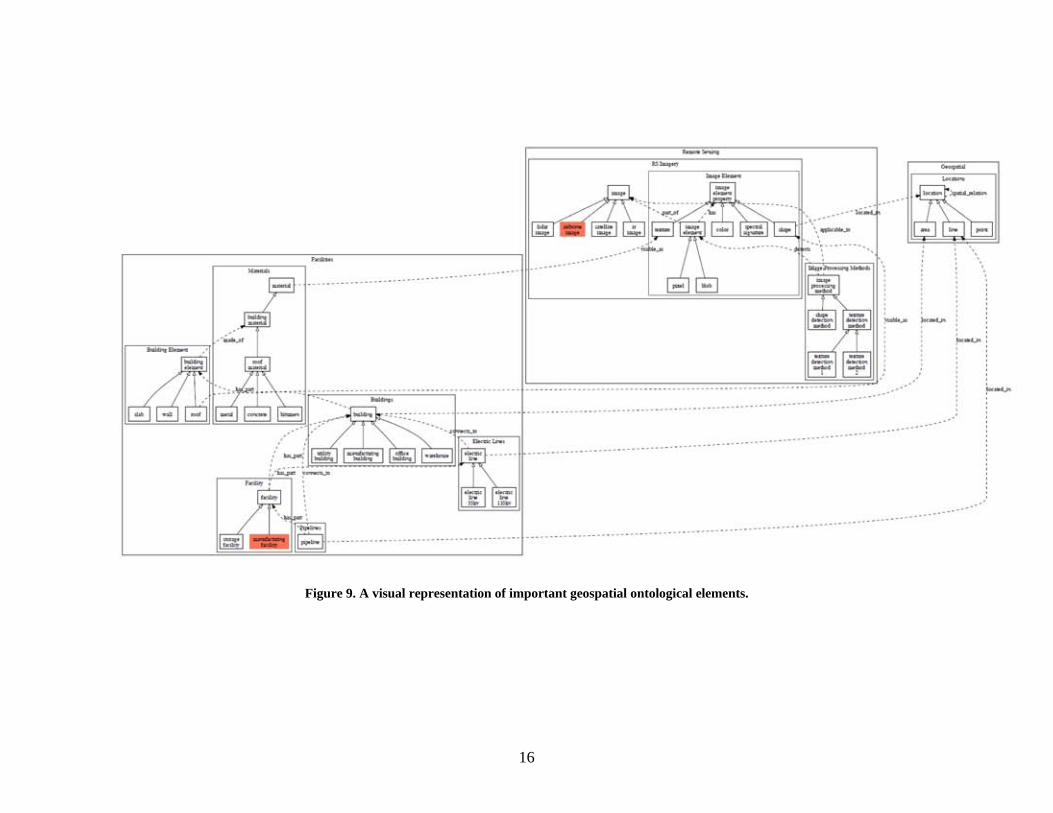
2.1.2 Geospatial Reasoning Figure 9 exemplifies a few of the elements necessary to make deducing a presence of a certain type of object on a remotely sensed image. The diagram shows a small subset of ontology classes and relations. Classes are shown as boxes with the name of the class in it. Relations are shown as lines with empty arrow designating a subclass relation. Other types of relations are shown as dashed lines with a solid arrow and a label showing the relation type. Classes are grouped into sub-ontologies (big rectangles with grey outline)
15
to ease the comprehension of the diagram. The diagram layout was generated automatically with no specific meaning assigned to the placement of the elements. In the text below single quotes are used to signify a class (e.g., 'class') and relations are shown as ‘—relation—>’. Assume that we have an airborne image and we need to determine the presence of a manufacturing facility in the image. The classes 'Airborne image' and 'manufacturing facility' are shown as red boxes on the diagram. Think of them as starting points that are connected through the pseudo-graph of relations and classes in the ontologies. Inferences starting from 'manufacturing_facility' (follow the diagram):
1. 'manufacturing_facility' is a —subclass—> of 'facility' 2. a 'facility' —has_parts—> such as 'buildings', 'pipelines' and 'electric lines' 3. a 'building' —has_parts—> 'building_elements' 4. 'building_elements' are —made_of—> 'materials' 5. 'materials' on the imagery are —visible_as—> 'texture' 6. 'texture' is a —subclass—> of 'image element property' 7. an 'image element' with a certain 'texture' can be —detected—> by a 'texture
detection method' 8. 'image_element' is a —part_of—> an 'image' 9. 'airborne image' is a —subclass—> of an 'image'
The other link (first three inferences are the same as in the previous list):
1. 'manufacturing_facility' is a —subclass—> of 'facility' 2. a 'facility' —has_parts—> such as 'buildings', 'pipelines' and 'electric lines' 3. a 'building' —has_parts—> 'building_elements' 4. 'roof' is a —subclass—> of a 'building_element' 5. 'roof' is —visible_as—> a 'shape' 6. 'shape' is a —subclass—> of 'image element property' 7. an 'image element' with a certain 'shape' can be —detected—> by a 'shape
detection method' 8. 'shape' is —located_in—> 'location' (location is understood as a geometric region
with a georeference); thus, location of a 'building' that may belong to a 'manufacturing facility' is determined
More advanced inferences can be made using —spatial_relation—> from the geospatial ontology. For example, connections between buildings through pipes or electric lines can be inferred.
16
Figure 9. A visual representation of important geospatial ontological elements.
17
2.1.3 Facilities Modeling (FM) This section describes the methodology by which the Facilities Modeling (FM) Ontology was generated and lessons learned from this process that can be applied to future FM ontology development. In Appendix A, the FM Ontology is listed in a flat text format. The chip fabrication wiki site contains the FM ontology in its more complete form. Note that not all the terms are defined. Some of these terms overlap with other ontologies (e.g. Integrated Modeling (IM), and Advanced Spectroscopic (AS)). These terms are linked to the other ontologies on the actual wiki site. A few other terms were not defined since it was not the point of the ontology development to define every term. Future ontology development efforts will add more terms and definitions as needed. Initially, many of the terms were obtained from the IM ontology with modifications to make them more relevant to FM. Thus, the IM ontology served as a starting point for the FM ontology. Some of the IM terms are used in FM as well, but with different meanings and connotations. Examples would be “modeling uncertainty” and “data streams” which in IM are broad-based terms that encompass more subject fields than how they pertain to facilities modeling. The list in Appendix A does not show the links to other ontologies as this was done in the process of adding content to the chip fabrication wiki (Appendix D). Before a formal list of terms was generated, effort was spent on classification and categorization within the FM list. As can be seen from the FM list in Appendix A, a three-level hierarchy was employed. This was done to capture some level of detail without expending too much effort getting into minute details for each sub-level of terminology. The high levels represented a first cut at capturing high level resolution for facilities modeling. Five such high level categories were chosen: analysis, facilities modeling facilitators, facilities specific terminology, physical objects, and modeling methodology. These categories were not meant to be exhaustive and some may change on the wiki site. Within each high level category there were several mid-level categories and within those there were low level terms. No attempt was made to go beyond three levels due to geometrically exploding complexity of the ontology. Definitions are only supplied for the lowest level terms. Continuing down to the mid-level categories, these were chosen to be logical sub-divisions of the high level categories. For instance, “Analysis” was broken down into “Facilities Characterization”, “Facilities Detection”, and “Conclusions” since these are the three most important analysis tasks that relate to facilities modeling. Likewise, the other high level categories were further subdivided into mid-level categories, some into more mid-level categories than others. The point was not to be exhaustive but to choose representative categories that help in generating the lowest level terms. From the mid-level categories, low level terms were listed that represent a cross-section of the mid-level category. Again, these terms are not exhaustive but represent a reasonable sampling of terms for the mid-level category. These lowest level terms comprise the most specific terms in the list, and thus it was for many of these terms that definitions were supplied. Note that the construction of the FM ontology was done in a “top- down” fashion in
18
which the highest level categories were generated first then on down to the lowest level terms. This is not necessarily the only way to generate the list. Indeed, the IM ontology was largely generated in reverse, i.e. “bottom up”, as explained in the next section. Finally, definitions for these low level terms were supplied. For the FM ontology, approximately 32 term definitions were supplied. The definitions were obtained primarily using one of two techniques. For some of the terms, the definitions were self-generated. That is, the authors supplied definitions based on their expertise and experience with the terminology and how it is used in facilities modeling. The remaining definitions were generated using a combination of author knowledge and reference sources. The most commonly used reference source was Wikipedia [http://www.wikipedia.org] on the internet. But many of these definitions had to be modified to make them more relevant to FM. The search engine, Google [http://www.google.com] was also used as an entry to other sites that use these terms and have definitions that were tailored by the authors to be relevant to FM. Other reference sources were textbooks, journal articles, and handbooks. From the FM ontology list in Appendix A, these definitions were added to the wiki site following the directions in Appendix D, and more will be added in the future (both new terms and new definitions). The process of generating the FM ontology was instructive. Some lessons have already been learned from feedback from the larger FM team as well as the larger Ontology team. First among these is that it would help to obtain more input from the ultimate users of the ontology. That is, the FM team provided feedback on categories, terms, and definitions in the FM ontology, but they also wanted more guidance on how they could use the ontology in further FM tasks. This would require a tighter feedback loop between the ontology developers and the teams that will ultimately make use of the ontologies. The second lesson learned is that it would benefit the FM ontology generation process if more SMEs would comment on the ontology and provide recommendations for more FM-relevant categorization, terminology, and definitions. Finally, and related to the above, is the lesson that the FM ontology is still not specific enough to FM needs. Many of the categories, terms, and definitions are still too generic to be immediately useful to the FM team. Some modifications have already been made, but further tailoring of the FM ontology is needed. Given the above feedback, several recommendations for future FM ontology development can be provided. First, more engagement of the larger FM team at the onset of the process and more inclusion of their feedback into the process will help improve the process. Second, some background information (possibly including interviews, seminars, literature search, etc.) on the needs of the end-users (SMEs, analysts, etc.) to make sure that the list is relevant to their needs. Finally, more specificity needs to be injected into the FM ontology generation process. This recommendation can be ensured by following the first two recommendations.
19
2.1.4 Integrated Modeling (IM) This section describes the methodology by which the Integrated Modeling (IM) Ontology was generated and lessons learned from this process that can be applied to future IM ontology development. In Appendix B, the IM Ontology is listed in a flat text format. The chip fabrication wiki site contains the IM ontology in its more complete form. As with the FM Ontology, not all the terms are defined. Some of these terms overlap with other ontologies (e.g. Facilities Modeling (FM), and Advanced Spectroscopic (AS)). These terms are linked to the other ontologies on the actual wiki site. A few other terms were not defined since it was not the point of the ontology development to define every term. Future IM ontology development efforts will add more terms and definitions as needed. Initially, many of the terms were obtained from a strawman IM term list. This list was generated by the Ontology team (e.g., Cliff Joslyn) as a starter list for non-proliferation and modeling related terms. From this list, some new terms were added and others were removed in order to generate a more IM-specific term list. Hence the initial IM term list was primarily generated from the “bottom up”. The lowest level terms were the starting point. From this list, natural categories were created at the next higher level (e.g. the mid-level). Then from the mid-level, the high level categories were generated. For instance, the terms “Absorption Spectroscopy”, “Emission Spectroscopy”, “Geospatial Image”, “Image”, and “Scattering Spectroscopy” were all examples of “Physical Data”. Likewise the terms “Metadata”, “Source”, “Spectral Line”, “Spectroscopy”, and “Spectrum” were more conceptual terms and therefore listed under the mid-level category “Data Concepts”. Finally, these two mid-level categories were deemed to fit under the high level category “Sensor Data”. This is not a foolproof means of generating the term list with hierarchies, but it is easy to edit the list. As more terms are added, other categories and hierarchies may be identified and the ontology can be adjusted accordingly. In addition, there will be overlap with other ontologies (e.g. FM and AS in particular), and these can be identified and linked in a later step. The list in Appendix B does not show the links to other ontologies as this was done in the process of adding content to the chip fabrication wiki (Appendix D). Like the FM list, a three-level hierarchy was employed. This was done to capture some level of detail without expending too much effort getting into minute details for each sub-level of terminology. But unlike the FM list (as explained above), the list was primarily generated using a “bottom up” procedure instead of “top down”. The high levels represented a first cut at capturing high level resolution for integrated modeling. Nine such high level categories were chosen: analysis tools, IM enabling technologies, IM facilitators, mathematical modeling techniques, modeling objects, modeling paradigms, modeling tools, semantics, and sensor data. These categories were not meant to be exhaustive and some may change on the wiki site. Within each high level category there were several mid-level categories and within those there were low level terms. No attempt was made to go beyond three levels due to the geometrically exploding complexity of the ontology. Definitions are only supplied for the lowest level terms.
20
Finally, definitions for these low level terms were supplied. For the IM ontology, approximately 62 term definitions were supplied. As with the FM ontology, the definitions were obtained using one of two techniques. For some of the terms, the definitions were self-generated. That is, the authors supplied definitions based on their expertise and experience with the terminology and how it is used in integrated modeling. The remaining definitions were generated using a combination of author knowledge and reference sources. The most commonly used reference source was Wikipedia [http://www.wikipedia.org] on the internet. But many of these definitions had to be modified to make them more relevant to IM. The search engine, Google [http://www.google.com] was also used as an entry to other sites that use these terms and have definitions that were tailored by the authors to be relevant to IM. Other reference sources were textbooks, journal articles, and handbooks. From the IM ontology list in Appendix B, these definitions were added to the wiki site following the directions in Appendix D, and more will be added in the future (both new terms and new definitions). Many of the specific mathematical modeling techniques were defined in the IM list, but these are used in the other ontologies as well. Those links will be noted on the wiki site. The process of generating the IM ontology was meant to be constructive so that further additions and groupings can be done in some organized fashion. Several lessons learned have become obvious. First among these is that it would help to obtain more feedback from the overall IM team on categories, terms, and definitions in the IM ontology, both in breadth and specificity to IM. This would require a tighter feedback loop between the ontology developers and the teams that will ultimately make use of the ontologies. The second lesson learned goes in the other direction. The ontology developers should provide guidance to the larger IM team on how to benefit from the use of the IM ontology and recommendations on how to use it. Finally, and related to the above, is the lesson that the IM ontology is still not specific enough to IM needs. This is true both in the breadth and the depth of the terminology. Many of the categories, terms, and definitions are not exhaustive enough in scope to be immediately useful to the IM team. Some modifications have already been made, but further tailoring and building out of the IM ontology is needed. Given the above feedback, several recommendations for future IM ontology development can be provided. First, more engagement of the larger IM team at the onset of the process and more inclusion of their feedback into the process will help improve the process. Second, the IM ontology developers should be providing guidance to the larger IM team on how to benefit from the IM ontology and how to use it. Finally, more specificity and relevance needs to be injected into the IM ontology generation process. This can be done by obtaining some background information (possibly including interviews, seminars, literature search, etc.) on the needs of the end-users (SMEs, analysts, etc.) to make sure that the list is relevant to their needs.
21
2.2 Document Processing
2.2.1 Corpora – Assembly and Conversion of Text Documents We assembled a wide collection of documents, ranging from notes following interviews of SME to PDF files of technical reports, journal papers, and handbook chapters. Most of our data mining tools required a translation from PDF to simple text before processing, and sharing the results. These steps for converting PDF to text documents are briefly described in Appendix E (for further details see the SAM SharePoint site).
2.2.2 Tools and Algorithms Several tools were used in order to process plain, unstructured text files. Piranha [5,6] can extract significant phrases, noun phrases, entities, etc. in addition to simple word-stem based processing and clustering. MALLET [McCullum, 2002] is an open-source machine-learning toolkit centered mostly on language analysis, and it provides topic-modeling capabilities that can be applied directly to unstructured text corpora. The Lemur Toolkit [3] is another open-source package that has parsing, stemming, indexing, and modeling capabilities.
2.2.2.1 Automatic Extraction of Nouns and Phrases for the Ontology A number of different approaches were investigated for extraction of nouns and phrases from documents for inclusion in the taxonomy. Specifically, two different approaches were used, one involving the use of the software Piranha and the other involving the use of Latent Dirichlet Allocation (LDA) which is a Bayesian generalization of latent semantic indexing (LSI).The two different implementations of LDA used are described in this section.
Phrase Extraction using Piranha Using Piranha, extract all phrases between stop words and print list. Piranha [Reed, et al., 2006] ] is launched to do this extraction, not run from script. A simple method for phrase extraction in Piranha was utilized to form an initial list of phrases found between a specified list of stopwords (words pre-specified as unimportant to the document analysis under consideration; these includes things like articles, prepositions, and any number of words that the analyst desires to remove from consideration). This approach is a completely unsupervised discovery process. Noun and Phrase Extraction using Piranha Next, a noun-phrase extractor consisting of a conditional-random-field model [Lafferty and McCullum, 2001] was used to extract all noun phrases from documents of interest.
22
This approach to phrase extraction is supervised in the sense that training sentence with their noun-phrases labeled by hand were used to train the model. Noun-phrase extraction is one of the most basic forms of natural language processing, but more complex tasks that considering linguistic structure are most useful in the application of a predefined ontology, as opposed to the creation of one. Details of the use of Piranha for noun and phrase extraction are shown in Appendix F.
2.2.2.2. Noun extraction using LDA (MALLET) It quickly became apparent that the number of phrases produced by the phrase extractors from any moderately large document set was going to be too large to be especially useful. Therefore, the next approach focused on topic modeling [Steyvers and Griffiths, 2007] via MALLET [McCullum, 2002], which is designed to pull out terms (or phrases) that are most characteristic of potential topics in the corpus. Topic modeling is unsupervised, but the results are highly dependent upon the number of topics specified (often arbitrarily) by the user. In applying the default number of topics (10) to a group of semiconductor documents, one is able to see term groupings that seem to characterize general topics of interests; e.g. secure transport. Each should work differently depending on the mix of topics in your documents and the number of topics you chose. If you put half semiconductor documents and half cooking-related documents and choose two as the number of topics, then it should find two very broad sets of terms (topics) that cover those two areas). However, if you just give it semiconductor documents, you will get other types of topics, like secure transport.
2.2.2.3. Noun Extraction using the Lemur Toolkit The open source tools in Lemur [The Lemur Project] are available from: http://www.lemurproject.org/. We used this package to parse the plain text files into individual words, one per line; to remove pre-fix and suffixes leaving only stemmed words, and to remove stop words.
2.2.2.4. Determining Latent Topics with Lemur and the LDA Toolbox Finally, MATLAB software [Steyvers and Griffiths 2009] was used to compute latent topics using the Latent Dirichlet Allocation (LDA) algorithm [Steyvers and Griffiths 2007] . An application program that uses this software is shown in Appendix F.
23
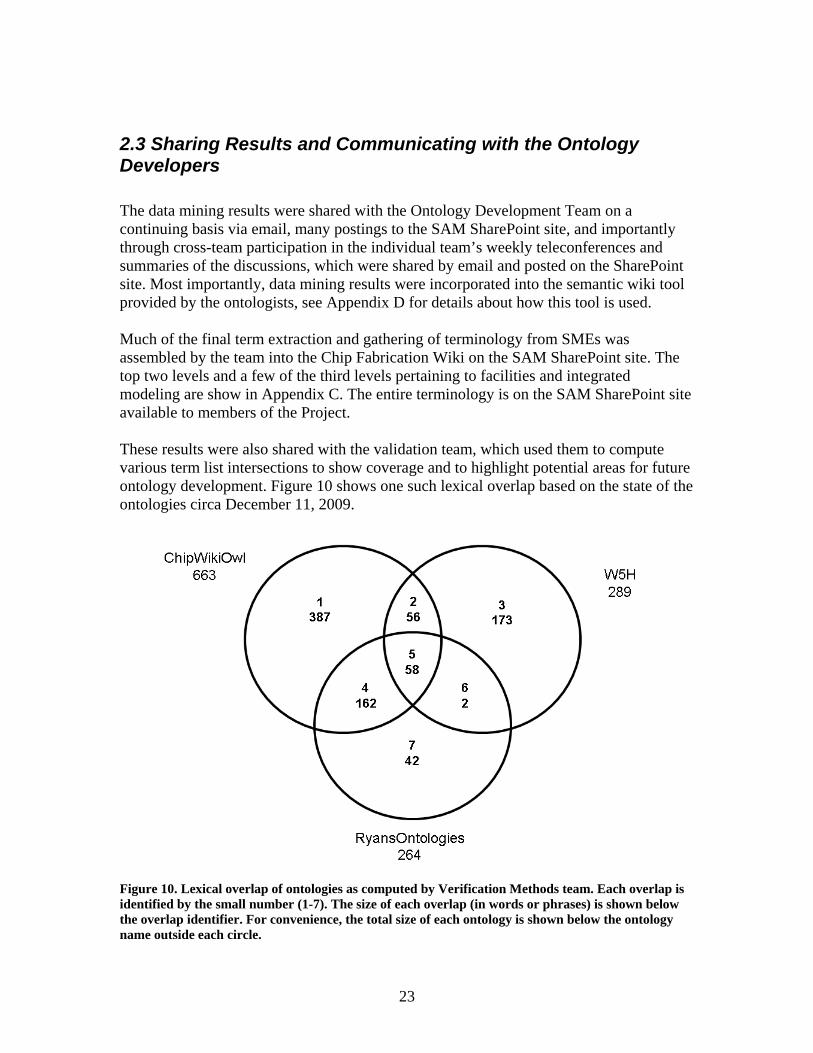
2.3 Sharing Results and Communicating with the Ontology Developers The data mining results were shared with the Ontology Development Team on a continuing basis via email, many postings to the SAM SharePoint site, and importantly through cross-team participation in the individual team’s weekly teleconferences and summaries of the discussions, which were shared by email and posted on the SharePoint site. Most importantly, data mining results were incorporated into the semantic wiki tool provided by the ontologists, see Appendix D for details about how this tool is used. Much of the final term extraction and gathering of terminology from SMEs was assembled by the team into the Chip Fabrication Wiki on the SAM SharePoint site. The top two levels and a few of the third levels pertaining to facilities and integrated modeling are show in Appendix C. The entire terminology is on the SAM SharePoint site available to members of the Project. These results were also shared with the validation team, which used them to compute various term list intersections to show coverage and to highlight potential areas for future ontology development. Figure 10 shows one such lexical overlap based on the state of the ontologies circa December 11, 2009.
Figure 10. Lexical overlap of ontologies as computed by Verification Methods team. Each overlap is identified by the small number (1-7). The size of each overlap (in words or phrases) is shown below the overlap identifier. For convenience, the total size of each ontology is shown below the ontology name outside each circle.
24
3. Discussion and Suggestions The Data Analysis team of the SAM Ontology Project employed three methodologies for exploiting data mining for ontology development: direct interviews with SMEs, both within and external to our team, application of natural language processing tools to published texts to extend the list of terms, concepts and phrases, and interaction with the ontology team to transfer the terminology to the ontology. The team interviewed SMEs throughout the project, without which it would have been nearly impossible to have assembled truly relevant documents for our work. This report captures some of the knowledge assembled about the tools and methods so that they are preserved for future work. We described our efforts to exploit online text to extract key words, and key phrases, and latent topics from large corpora of machine readable text. And described how we gathered documents for analysis, prepared and processed the text and the nature of the output. We described how we developed terminology specific to facilities modeling and integrated modeling as related to semiconductor manufacturing. This terminology was entered into the Chip Fabrication Wiki supported by the Ontology Development team. Finally, we discussed efforts to integrate our work of the ontology developers so that our interactions could be more than an ever expanding stream of words and phrases believed to be relevant to the ontology. Appendices A and B capture sample terms and definitions in a hierarchical structure for both facilities modeling and integrated modeling. Appendix E contains top level terminology as it appears in the Chip Fabrication Wiki. The future ontology opportunities will depend on the actual value of ontologies for internal, classified and unclassified DOE projects. Fortunately, there are good examples in several fields, including genomics, which have pointed the way toward applications built around ontologies. We would like to offer one small vision of how an ontology could be useful in finding signatures of nuclear proliferation. Of course the example is not inclusive; in fact it barely scratches the surface of potential applications. When the biologists went ‘post-genomic’ an explosion of data overwhelmed researchers used to studying only a single gene, or perhaps a handful of genes, across their working careers. An organism is considered post-genomic once its genome has been sequenced, and knowledge of the DNA sequence for every gene makes possible many new, high throughput measurement techniques including microarrays. These microarrays are able to take a snapshot of the relative gene expression in the cells for all of the genes (typically on the order of 10-50 thousand different measurements at once), and there are hundreds, even thousands, of different cases many of which require time course studies with many gene expression snapshots. Consequently, the resulting data can be huge. Even the simple, early experiments broke all of the traditional tools that
25
were available before these high throughput experiments became available. However, dealing the volume of data turned out to be the simple problem. As the tools were developed for these new measurement instruments, the biologists faced an even more daunting problem: they had no idea how to think about or internally assimilate the meaning of so many measurements at once. Ontologies came to play a central role in their ability to do so. A typical microarray experiment measures the change between two conditions (a before and after experiment). The results are tables of up and down regulated genes intensities. Many of these genes, even now, have no known or clear function. However, a growing number of genes do have known functions in various cellular processes, for example in energy utilization, in cellular division, or in signaling throughout the cell. An ontology (the Gene Ontology) was constructed describing the hierarchy of cellular details, their physical organization, the processes they cycle through, and the signals they use to control these process [Ashburner and Ball, 2000]. The goal of the Gene Ontology (GO) Consortium is to produce a dynamic, controlled vocabulary that can be applied to all eukaryotes even as knowledge of gene and protein roles in cells is accumulating and changing. To this end, three independent ontologies accessible on the World-Wide Web (http://www.geneontology.org) are being constructed: biological process, molecular function and cellular component. Importantly, biologists were able to assign GO categories, basically ontological elements, to many but not all of the genes. However, even with incomplete gene assignments, the ontologies are immensely helpful. The biologist may find that hundreds of genes have changed by, say, two-fold increases or decreases across their experiment. To estimate what these changes mean, they can take gene names and ask which GO categories are significantly enriched for their list. Of course, only the genes with GO category assignments are used for this computation. However, when the list is discovered to be enriched with specific ontological terms, say ‘cellular differentiation’, ‘cell division’, or ‘glucose metabolism’, the biologist is given a huge clue about the physical processes that were affected in the particular experiment. Consider, now, how the set of measurements and features that can be extracted from remote sensing can be analogous to a ‘gene’ and how that analogy can be exploited. After segmentation, an image may have many ‘features’ with texture or physical attributes. Consequently, the image has a high dimensional description in the attribute space, where each attribute is associated with the number of times it is seen in the image. This description is similar to the genomic description of the cells where the intensity for each gene is one of the many dimensions in the description. Remotely gathered images and other measurements, like the biologist’s experiment, offer up a large vector of values, no one of which is likely to be definitive for understanding what is happening on the ground, just as changes in a single gene’s intensity is seldom sufficient to understand the experiment.
26
By further analogy, an ontology describing the elements of proliferation events can be used to compute how enriched an image is with respect to the particular proliferation categories. This enrichment figure is only a clue to the analysts, but it can be used by automatic methods to bring unexpected things to human attention; especially in cases not previously encountered. Our prototype ontology project is too incomplete to demonstrate the power of these techniques. However, by inference we can expect them to be most useful in the more complicated cases; especially, in those situations where active methods may have been taken to hide evidence. We recommend that an effort be funded to scope how extensive a proliferation ontology would have to be for it to become useful in filtering measurements for proliferation intent inferences, in the same way that biologists make probabilistic inferences about cells based on GO terms. Following this work, we would know the number of terms required to reach this desired capability. We would understand how to address issues of classification, and have example use cases, demonstrable applications of the ontology. Consequently, the work would be more than a continuation of the existing ontology development; it would be a step toward a powerful new capability.
27
4. References Ashburner, M., C. A. Ball, et al. (2000). "Gene Ontology: tool for the unification of biology." Nature Genetics 25(1): 25-29. Lafferty, J., A. McCallum, et al. (2001). Conditional Random Fields: Probabilistic Models for Segmenting and Labeling Sequence Data. Proceedings of the 18th International Conference on Machine Learning. McCallum, Andrew Kachites. "MALLET: A Machine Learning for Language Toolkit." See: http://mallet.cs.umass.edu. University of Massachusetts, Amerherst. 2002. J.W. Reed, Y. Jiao, T.E. Potok, B.A. Klump, M.T. Elmore, and A.R. Hurson, "TF-ICF: A new term weighting scheme for clustering dynamic data streams," In Proc. of the 5th International Conference on Machine Learning and Applications (ICMLA’06), pp.258-263, 2006. [Piranha Software:, Applied Software Enginnering Group, Oak Ridge National Laboratory, See:: http://aser.ornl.gov/piranha.shtml] Steyvers, M. and T. Griffiths (2007). Probabilistic topic models. Latent Semantic Analysis: A Road to Meaning. T. Landauer, D. McNamara, S. Dennis and W. Kintsch. Mahwah, N.J., Laurence Erbaum. Steyvers, M. and T. Griffiths (2009). MATLAB Topic Modeling Toolbox 1.3.2. See http://psiexp.ss.uci.edu/research/programs_data/toolbox.htm. The Lemur Project (2001-2008) See: www.lemurproject.org), University of Massachusetts and Carnegie Mellon University, Sept. 21, 2009. .
28
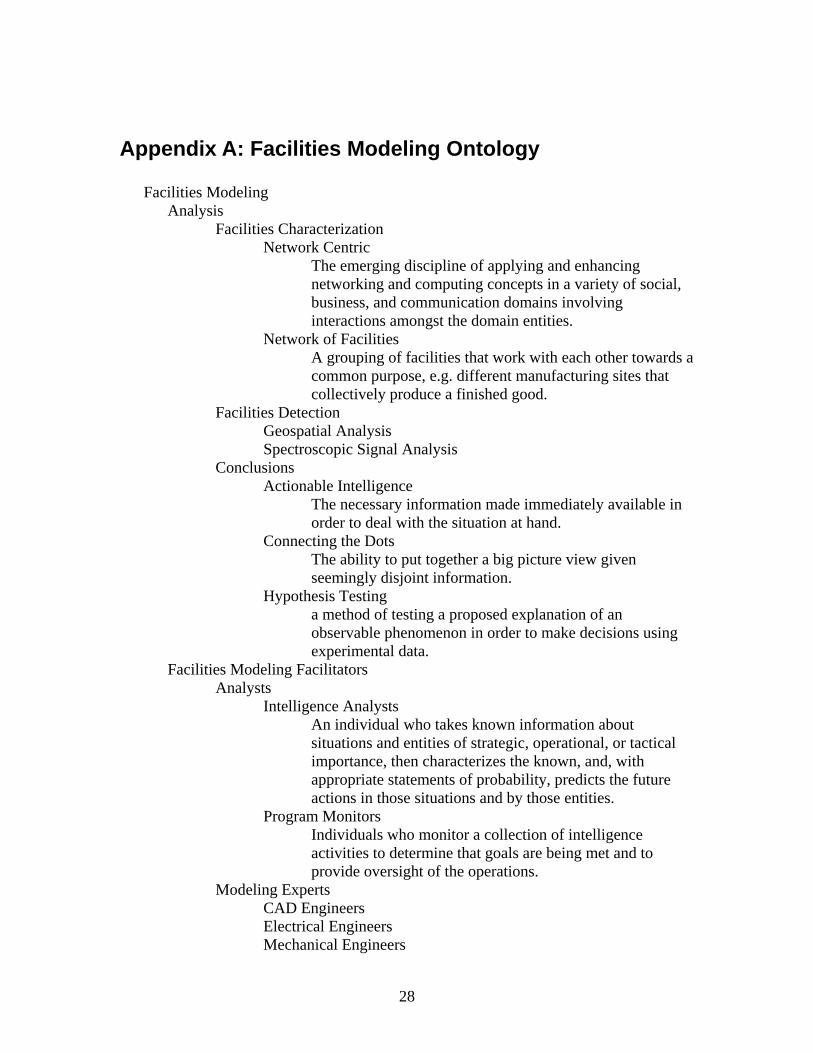
Appendix A: Facilities Modeling Ontology
Facilities Modeling Analysis
Facilities Characterization Network Centric
The emerging discipline of applying and enhancing networking and computing concepts in a variety of social, business, and communication domains involving interactions amongst the domain entities.
Network of Facilities A grouping of facilities that work with each other towards a common purpose, e.g. different manufacturing sites that collectively produce a finished good.
Facilities Detection Geospatial Analysis Spectroscopic Signal Analysis
Conclusions Actionable Intelligence
The necessary information made immediately available in order to deal with the situation at hand.
Connecting the Dots The ability to put together a big picture view given seemingly disjoint information.
Hypothesis Testing a method of testing a proposed explanation of an observable phenomenon in order to make decisions using experimental data.
Facilities Modeling Facilitators Analysts
Intelligence Analysts An individual who takes known information about situations and entities of strategic, operational, or tactical importance, then characterizes the known, and, with appropriate statements of probability, predicts the future actions in those situations and by those entities.
Program Monitors Individuals who monitor a collection of intelligence activities to determine that goals are being met and to provide oversight of the operations.
Building/Facilities Experts Individuals whose expertise is the construction, operation, management, or development of particular buildings and facilities types.
Data Miners Individuals who comb documents and other text sources to produce specific information useful to a particular purpose.
Nuclear Engineers Nuclear Physicists Spectroscopic Signature Analysts Text Analysts
Individuals who analyze documents and other text sources for specific data and to construct scenarios of how the text might fit into a larger purpose.
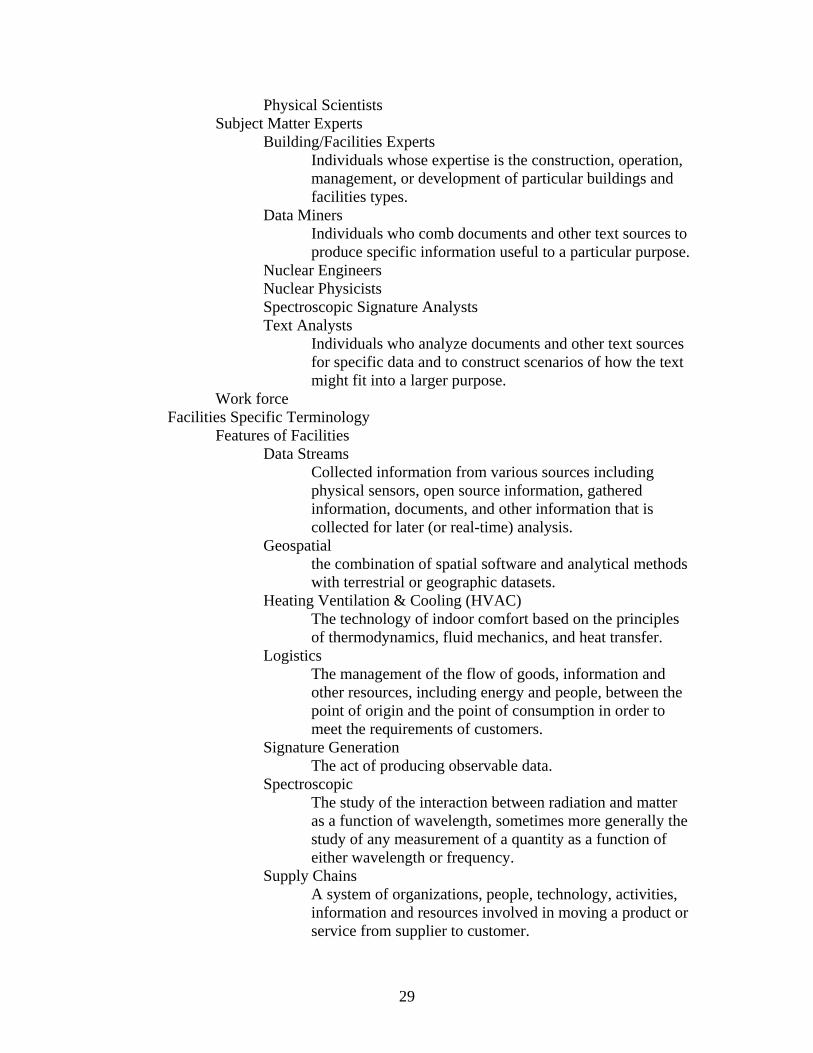
Work force Facilities Specific Terminology
Features of Facilities Data Streams
Collected information from various sources including physical sensors, open source information, gathered information, documents, and other information that is collected for later (or real-time) analysis.
Geospatial the combination of spatial software and analytical methods with terrestrial or geographic datasets.
Heating Ventilation & Cooling (HVAC) The technology of indoor comfort based on the principles of thermodynamics, fluid mechanics, and heat transfer.
Logistics The management of the flow of goods, information and other resources, including energy and people, between the point of origin and the point of consumption in order to meet the requirements of customers.
Signature Generation The act of producing observable data.
Spectroscopic The study of the interaction between radiation and matter as a function of wavelength, sometimes more generally the study of any measurement of a quantity as a function of either wavelength or frequency.
Supply Chains A system of organizations, people, technology, activities, information and resources involved in moving a product or service from supplier to customer.
30
Generic Facilities Commercial Businesses
For-profit firms that produce goods for consumers. Educational Facilities
Facilities developed for the purpose of providing education and training services to individuals or firms.
Industrial Parks Space provided for business that engage in manufacturing activities usually with some shared infrastructure.
Manufacturing The act of producing goods and services for consumers.
Military Bases Space set aside for the training, staging, and storage associated with military personnel, operations, and materiel.
Power Plants Manufacturing facilities that produce power (primarily electricity) for customers or dedicated facilities.
Residential Regions of an urban area set aside primarily for housing of its citizens.
Warehouses Facilities used for the storage of goods at various stages of the manufacturing process including finished goods.
Nuclear Facilities Nonproliferation
The process by which the spread of nuclear weapons, fissile material, and weapons-applicable nuclear technology and information, to nations which are not recognized as Nuclear Weapon States is prevented, mitigated, or impeded.
Proliferation The spread of nuclear weapons, fissile material, and weapons-applicable nuclear technology and information, to nations which are not recognized as "Nuclear Weapon States" by the Treaty on the Nonproliferation of Nuclear Weapons, also known as the Nuclear Nonproliferation Treaty or NPT.
Wacker Chart A graphical chart which shows the various processes associated with the nuclear fuel and weaponization complexes.
Weaponization The process by which the peaceful uses of a technology are subverted into the creation of a weapon or weapons complex using that technology.
Weapons Complex
31
A network of facilities used to create military (e.g. nuclear) weapons.
Modeling Methodology Modeling Techniques
Agent-Based Modeling Discrete Event Systems Evolutionary Computation High Fidelity Models Markov Chains Monte Carlo Simulation Physics-Based Models Recursive Least Squares Semantic Data Structures Stochastic Approximation
Anomaly Detection A process by which exceptional circumstances, results, features, objects, etc are recognized in modeling and simulation analysis.
Data Mining The process of extracting patterns from data.
Exploratory Data Analysis An approach to analyzing data for the purpose of formulating hypotheses worth testing, complementing the tools of conventional statistics for testing hypotheses.
Geospatial analysis Pattern Mining
This is a data mining technique that involves finding existing patterns in data.
Pattern Recognition The act of taking in raw data and taking an action based on the category of the pattern, especially to classify data based either on a priori knowledge or on statistical information extracted from the patterns (e.g. learning).
Schema Management Systems specification Systems Specification Formulation State Evaluation Process Expert Elicitation
Expert elicitation is a process by which opinions from experts are gathered and synthesized to help quantify uncertainty due to insufficient or unattainable data. It is a scientific consensus methodology.
Applications Analysis
The process of studying data and simulation results to empower the decision-making process within integrated modeling.
Query The process by which a hypothesis is formulated and a testing procedure is proposed using integrated modeling.
IM Enabling Technologies Analytical Tools
Pattern Language A structured method of describing good design practices within a field of expertise.
33
Pattern Library A collection of patterns that allows the sharing and changing of code and data used to recognize patterns in a modular fashion to a community of users.
Conceptual Tools High Performance Computing
Scientific computing that uses supercomputers and computer clusters to solve advanced computation problems.
The process of checking that a product, service, or system meets specifications and that it fulfills its intended purpose.
Hardware Distributed Memory Architectures
A multiple-processor computer system in which each processor has its own private memory. Computational tasks can only operate on local data, and if remote data is required, the computational task must communicate with one or more remote processors
Instrument A device used to collect scientific data.
Multi-Threaded Architectures Computers that have hardware support to efficiently execute multiple threads. Multi-threading aims to increase utilization of a single core by leveraging thread-level as well as instruction-level parallelism.
Service Oriented Architecture This is essentially a collection of services. These services communicate with each other. The communication can involve either simple data passing or it could involve two or more services coordinating some activity.
Shared Memory Architectures A computer system in which memory may be simultaneously accessed by multiple programs with an intent to provide communication among them or avoid redundant copies. Programs may run on a single processor or on multiple separate processors.
Software Middleware
Computer software that connects software components or applications. The software consists of a set of services that allows multiple processes running on one or more machines to interact.
IM Facilitators Integrated Modeling Expert
34
Subject Matter Experts (SMEs) Individuals whose knowledge in a particular area of expertise is valuable in constructing models, evaluating models, analyzing simulation results, and proposing algorithms and architectures for integrated modeling solutions.
Mathematical Modeling Techniques Dissipative
A concept by which linear and nonlinear systems are modeled using energy storage functions (sometimes called Lyapunov functions) to help design feedback control laws that ensure stability properties of the system.
Forward Modeling A method of generating system models using known physical properties of the system.
Inverse Modeling A method of generating some values of the model parameters from observed data. This type of modeling problem is typically not well-posed.
Parameterization of the system
The process of deciding and defining the parameters necessary for a complete or relevant specification of a model..
Evolutionary/genetic algorithms Heuristic search techniques inspired by evolutionary biology, which use concepts such as inheritance, mutation, selection, and crossover, to find exact or approximate solutions to optimization and search problems.
Response surfaces A statistical technique that uses a sequence of designed experiments to obtain an optimal response. Often, a second order polynomial approximation is used.
Look-Up-Tables (LUT’s) Data structures, usually an array or associative array, often used to replace a runtime computation with a simpler array indexing operation.
Markov chain A random process where future states depend only on the present state, and are independent of past states. The system changes from its current state to another state according to a probability distribution.
Monte Carlo Simulation Repeated random sampling of a simulation model used when the system under study is difficult or impossible to quantify via a deterministic algorithm.
Lagrangian relaxation
35
The process by which hard constraints of a problem are moved into the objective function so as to exact a penalty on the objective if they are not satisfied.
Bender’s decomposition An optimization technique that allows the solution of very large linear programming problems provided that they have a special block structure.
Dantzig-Wolfe decomposition An algorithm for solving linear programming problems using delayed column generation.
A class of optimization methods which iteratively refine a feasible set or objective function by means of linear inequalities, termed cuts, and traverse the interior space of the feasible region.
Hybrid optimization The use of multiple optimization techniques, either in series or in parallel (or both), to solve a particular optimization problem.
Principal component analysis A mathematical procedure that transforms a number of possibly correlated variables into a smaller number of uncorrelated variables called principal components. The first principal component accounts for as much of the variability in the data as possible, and each succeeding component accounts for as much of the remaining variability as possible.
Bayesian Networks A probabilistic model that represents a set of random variables and their conditional independencies via a directed acyclic graph.
Multi-attribute analysis A multi-criteria decision analysis technique, based on a hierarchical decomposition of comparison attributes and rating assignment using rank order centroids.
Fault Trees/Event Trees A technique of failure analysis in which an undesired state of a system is analyzed using Boolean logic to combine a series of lower-level events. Fault tree analysis is used to model and analyze failure processes of a system.
Modeling Objects Abstract Objects
Anomaly Any occurrence or object that is strange, unusual, or unique that can indicate a discrepancy or deviation from an established rule or trend.
Component model Dynamical system
36
A system that can be characterized by a mathematical formalization that describes the time dependence of a system’s state in its ambient space.
Empirical model A model based on empirical observations rather than mathematically described relationships of the system.
Enterprise model A model of the structure, processes, information and resources of an identifiable business, government body, or other large organization.
Feature A marketable behavior or property of a computer program, ideally documented in a design.
Global autonomous model (GAM) Object
In object oriented programming an object refers to a compilation of attributes (object elements) and behaviors (methods) encapsulating an entity. In more general terms, an object means any entity that can be manipulated by the commands of a programming language.
Pattern A type of theme of recurring events or objects sometimes referred to as elements of a set. These elements repeat in a predictable manner. It can be a template or model which can be used to generate things or parts of a thing, especially if the things that are created have enough in common for the underlying pattern to be inferred, in which case the things are said to exhibit the unique pattern.
Service
A service is a function that is well-defined, self-contained, and does not depend on the context or state of other services.
Software agent A software abstraction, that provides a convenient and powerful way to describe a complex entity that is capable of acting with a certain degree of autonomy in order to accomplish tasks on behalf of its user. But unlike objects, which are defined in terms of methods and attributes, an agent is defined in terms of its behavior.
Systems Uncertainty Utility Function
Social Elements Individuals Groups and organizations
37
Societies and culture Economies Governments Leadership Policies
Physical Entities Facility Facility complex Physical Model Physics model Process model Product Scenario Sensors
Modeling Paradigms Conceptual
Distributed Heterogeneous Environments The use of multiple modeling paradigms that are not necessarily connected in any way.
High Level Architecture (HLA) A U. S. Department of Defense standard architecture for distributed computer simulations that need to communicate with each other regardless of computer platforms.
Hybrid Modeling Paradigm A graphical and algorithmic modeling paradigm that allows the simultaneous use and integration of multiple modeling techniques.
Simulation The process of modeling a real-life or hypothetical situation on a computer so that it can be studied to see how the system works.
Mathematical Agent-Based Modeling
The modeling of phenomena as dynamical systems of interacting agents. Agents typically do not simultaneously perform actions at constant time-steps, rather, their actions follow discrete-event rules or a sequential schedule of interactions.
Discrete-Event Modeling The modeling of a system as a chronological sequence of events. Each event occurs at an instant in time and marks a change of state in the system.
Dynamic System Modeling The modeling of a system using differential or difference equations.
System Dynamics
38
An approach (primarily graphical) to understanding the behavior of complex systems over time by using feedback loops, stocks, and flows.
Methods for the development of information systems together with automated tools that can be used in the software development process.
Geographic Information System (GIS) A system which includes mapping software and its application to remote sensing, land surveying, aerial photography, mathematics, photogrammetry, geography, and tools that can be implemented with GIS software.
Semantics Abstraction Accreditation Attributes
Features of an object. Commercial Off The Shelf (COTS)
Computer software or hardware, technology, or computer products that are ready-made and available for sale, lease, or license to the general public.
Concepts Domain Electromagnetic Spectrum Gedanken Problem Geospatial Human Factors Lexicon Library
A library is a collection of subroutines or classes used to develop software. Libraries contain code and data that provide services to independent programs. This allows the sharing and changing of code and data in a modular fashion to a community of users.
Maturity Mereotopology Model Model Integration: Modeling Uncertainty Ontology Range Saliency Semantic Semantic network Semantic Web Social Factors
39
Semantics Taxonomy
A classification of a subject arranged in a hierarchical structure. Utility Waste Well-posedness
A mathematical term that refers to a problem with three properties: 1) A solution exists, 2) The solution is unique, and 3) The solution depends continuously on the data, in some reasonable topology. If the problem is well-posed, then it stands a good chance of solution on a computer using a stable algorithm. If it is not well-posed, it needs to be re-formulated for numerical treatment.
Validation Benchmarks Validation Metrics
Sensor Data Data Concepts
Metadata Metadata provides information about, or documentation of, other data managed within an application or environment. This commonly defines the structure or schema of the primary data.
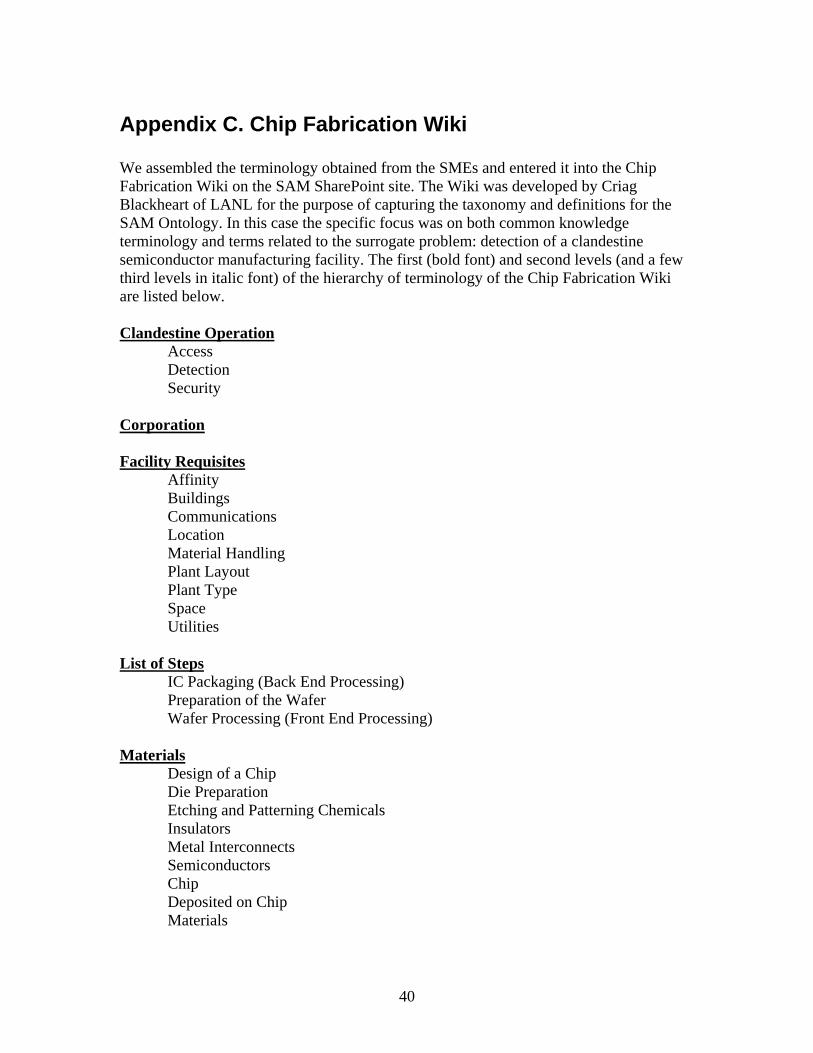
Appendix C. Chip Fabrication Wiki We assembled the terminology obtained from the SMEs and entered it into the Chip Fabrication Wiki on the SAM SharePoint site. The Wiki was developed by Criag Blackheart of LANL for the purpose of capturing the taxonomy and definitions for the SAM Ontology. In this case the specific focus was on both common knowledge terminology and terms related to the surrogate problem: detection of a clandestine semiconductor manufacturing facility. The first (bold font) and second levels (and a few third levels in italic font) of the hierarchy of terminology of the Chip Fabrication Wiki are listed below. Clandestine Operation
Access Detection Security
Corporation Facility Requisites
Affinity Buildings Communications Location Material Handling Plant Layout Plant Type Space Utilities
List of Steps
IC Packaging (Back End Processing) Preparation of the Wafer Wafer Processing (Front End Processing)
Materials
Design of a Chip Die Preparation Etching and Patterning Chemicals Insulators Metal Interconnects Semiconductors Chip Deposited on Chip Materials
41
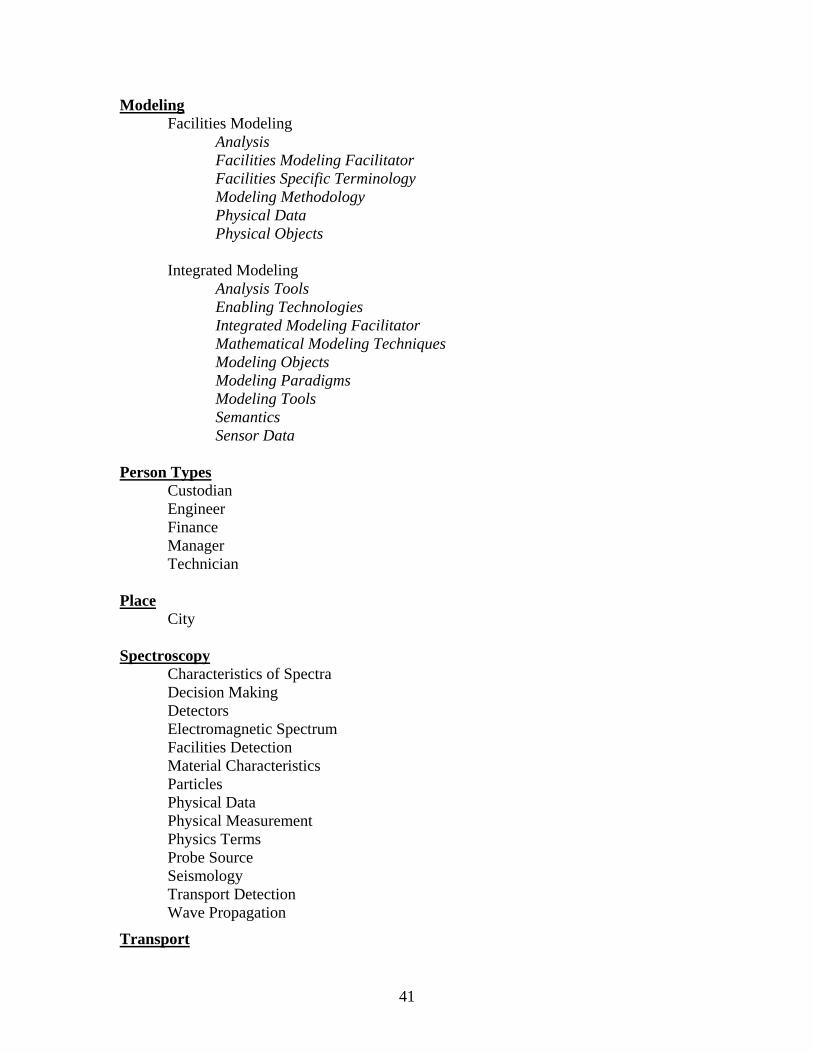
Modeling Facilities Modeling
Analysis Facilities Modeling Facilitator Facilities Specific Terminology Modeling Methodology Physical Data Physical Objects
Characteristics of Spectra Decision Making Detectors Electromagnetic Spectrum Facilities Detection Material Characteristics Particles Physical Data Physical Measurement Physics Terms Probe Source Seismology Transport Detection Wave Propagation
Transport
42
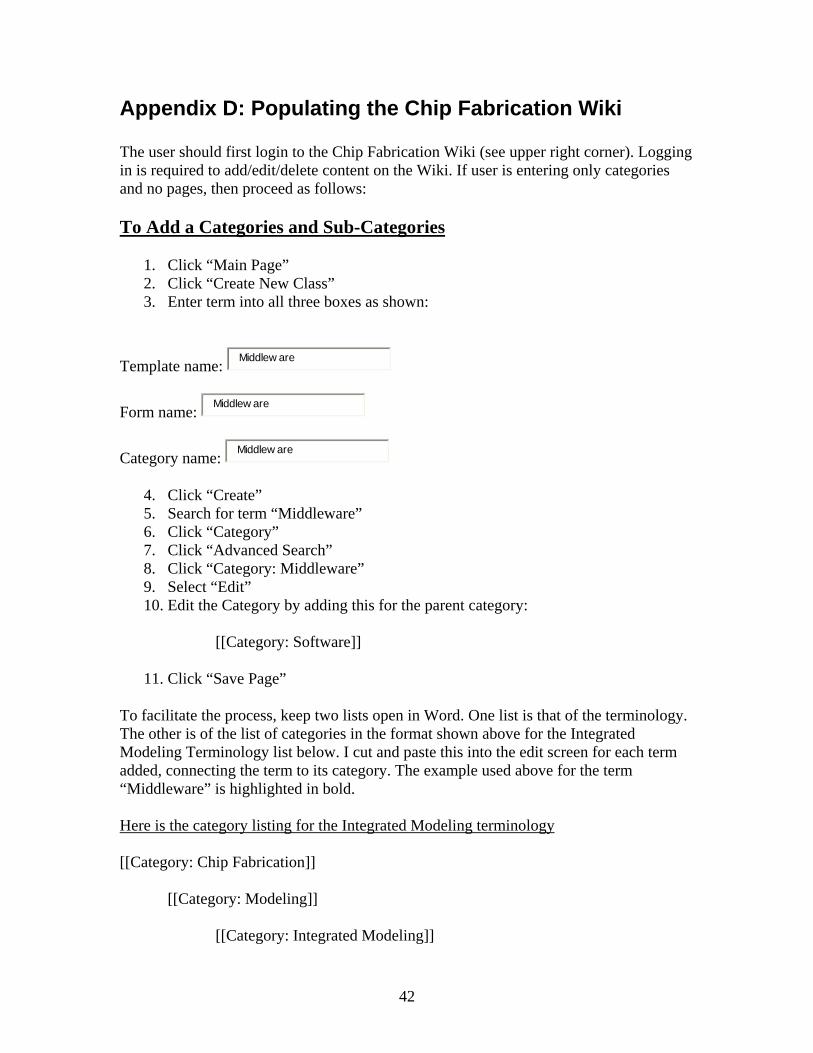
Appendix D: Populating the Chip Fabrication Wiki The user should first login to the Chip Fabrication Wiki (see upper right corner). Logging in is required to add/edit/delete content on the Wiki. If user is entering only categories and no pages, then proceed as follows: To Add a Categories and Sub-Categories
1. Click “Main Page” 2. Click “Create New Class” 3. Enter term into all three boxes as shown:
Template name: Middlew are
Form name: Middlew are
Category name: Middlew are
4. Click “Create” 5. Search for term “Middleware” 6. Click “Category” 7. Click “Advanced Search” 8. Click “Category: Middleware” 9. Select “Edit” 10. Edit the Category by adding this for the parent category:
[[Category: Software]]
11. Click “Save Page” To facilitate the process, keep two lists open in Word. One list is that of the terminology. The other is of the list of categories in the format shown above for the Integrated Modeling Terminology list below. I cut and paste this into the edit screen for each term added, connecting the term to its category. The example used above for the term “Middleware” is highlighted in bold. Here is the category listing for the Integrated Modeling terminology [[Category: Chip Fabrication]]
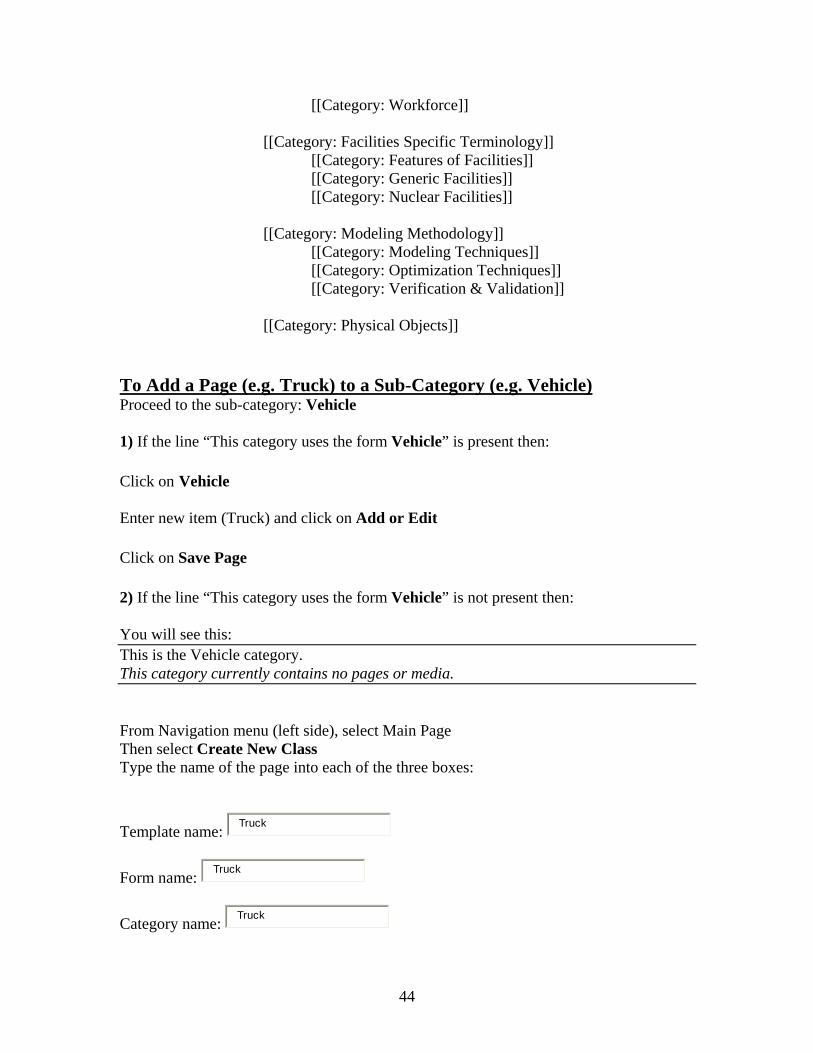
To Add a Page (e.g. Truck) to a Sub-Category (e.g. Vehicle) Proceed to the sub-category: Vehicle 1) If the line “This category uses the form Vehicle” is present then: Click on Vehicle Enter new item (Truck) and click on Add or Edit Click on Save Page 2) If the line “This category uses the form Vehicle” is not present then: You will see this: This is the Vehicle category. This category currently contains no pages or media. From Navigation menu (left side), select Main Page Then select Create New Class Type the name of the page into each of the three boxes:
Template name: Truck
Form name: Truck
Category name: Truck
45
Click the “Create” button
From Navigation menu (left side), select Special Pages
Then select Forms and select Vehicle
You will see: Form:Vehicle
Enter Truck and click Add or Edit
Save the page
To connect this form to a category:
From Navigation menu (left side), select Special Pages
The select Categories
And select Vehicle and the edit to edit the page.
Type in the following including the name of the parent category, in this case Transport
[[Category: Transport]]
And save the page. You will then be able to easily access the Vehicle sub-category and to add pages to it using the method #1 above. If you find any errors in this description please contact Richard Ward at ORNL (phone: 865-547-5449, email: [email protected])
46
Appendix E: Document preparation and pre-processing We assembled a corpus of relevant documents in pdf format. The modeling tools required that these files be converted to plain text files. This appendix documents the methods and software tools used to process the corpus from the original pdf files to lists of topics inferred from the text itself. Conversion from pdf to plain text Step 1. Use Adobe Acrobat Professional Version In a directory with many files, pdfs can be converted to plain text by using FILE > EXPORT > EXPORT MULTIPLE FILES … > Add Files followed by selecting all or some of the PDF files using the supplied GUI. This approach is particularly useful because errors are only logged, and generally don’t cause the program to fail, which can occur with various other approaches, especially with the GUI scripting language described below. This is the recommended method for converting many documents to plain text.
Step 2. Use Adobe Acrobat or Adobe Reader and “Save as Text” Most documents can be converted to text, one at a time, by simply loading them in Adobe Acrobat (or Adobe Reader) and save them as text via FILE > Save as Text.
Step 3. Use Select All and save as text file If an unlocked document is being viewed with Adobe Acrobat or Reader or one can use the mouse to select a section of the document, or, for the whole document, use “Select All” from the edit menu, then copy and paste the selection into Word or other text processor and save the document as a “txt” file. Step 4. Use pdftotext conversion program Download and install the program: pdftotext . To download the open source files see: http://www.foolabs.com/xpdf/download.html. Further instructions are located here: http://www.ire.org/training/nettour/pdf/PDFTOTEXT.pdf This was used successfully by on member of the Data Analysis sub-team to convert documents from PDF format to text format. Step 5. Use Adobe Acrobat with a GUI scripting language
47
Automating the manual pdf conversion process The GUI scripting tool, AutoIt, can be used to automate the manual process. This tool can be downloaded from http://www.autoitscript.com/ To use AutoIt, enter the following command, with appropriate file names: dir /B e:\SAND\*.pdf > e:\Process_SAND\ListOfPDFs.txt Create an empty restart file (e:\Progress.txt), which holds the name of the last successfully processed PDF file. The visual Studio Project, see e:\Process_SAND\RunAutoit, processes through the list of PDF files (e:\Process_SAND\ListOfPDFs.txt), starting at the one just after the single file name held in e:\Progress.txt. The C program writes a corresponding GUI-script (e:\Process_SAND\CheckPDF.au3) and executes it via a system command. If the script successfully completes, the restart file is updated and work continues. Unfortunately, these documents contain many non-standard elements, and there are many ways the processing can fail. Splitting book chapter into separate PDF files Extremely long and hierarchically complicated documents may need to be split into simpler, individual sections or chapter. This can be done with Adobe Acrobat Professional Version using the split document capability. There are three options:
Limit the number of pages in the individual output files, Limit the individual output file sizes to be less than a specified value, Split document using top-level bookmarks.
It is particularly nice that the output file names can be a modification of the original name, for example by adding a label and number either in front of or behind the original name. This option is found under the Output Options button at the bottom of the Split Document page.
48
Appendix F: Noun/phrases and latent topic modeling
This appendix documents the details concerning software used to parse sentences, extract nouns and phrases, recover the individual word stems (removing any prefix or suffix modifiers), and infer topics and topic mixture fractions for each document. Specifically, instructions are available for using:
Piranha for noun and phrase extraction. Mallet for topic modeling. Lemur for parsing and stemming. Lemur for topic modeling. LDA toolbox for topic modeling.
Piranha Step 1. Using Piranha, replace the “Aiden file” in ~/Resources/Minor Third with GenericNounPhrases_v1.and. Piranha is run from a script as follows: javaw –d64 –Xmx1524m –jar igui-fat.jar (for 64bit machine) javaw –Xmx1524m –jar igui-fat.jar (for 16bit machine) A value of Xmx or extended memory of 2048m is better, or even 4g if one has 4 giga bytes, but I could on use 1524 megabytes. Step 2. Under “Settings/Document Ingest” check these:
Step 3. Then drag the document folder into the area on the left (“green color”). The documents must be converted to “txt’ format to facilitate this analysis. Also, the process does not seem to work with a single document. Step 4. Click “GO” One might need to wait quite some time for this to complete, depending on the amount of extended memory used.
49
Step 5. Select “Folders View” – the forth button. Eventually you should see the nouns (words, phrases, entities) extracted on the screen. Step 6. Select “All Words” in the list. Click the right mouse button and select “Export network”. This will write an xml file to the Resources directory. The results lists were so large that I had a memory error. So make sure that you select a portion of the words or phrases at a time, if you have a machine with limited memory. Topic Modeling using MALLET The topic modeling software MALLET was also used to pull out terms and phrases that are most characteristic of potential topics in the corpus. This method is one of two approaches were examined that uses LDA. Step 1. First step is to install MALLET. Step 2. Then convert the Counterfeit Semiconductor documents to txt format Step 3. Then convert the documents to minorthird format, by running MALLET and removing stopwords. bin/mallet import-dir –input ../CounterfeitAsText/Counterfeit --output counterfeit-Bigramtopicinput.mallet --keep-sequence --remove-stopwords --gram-sizes 1,2 The last option tells it to consider phrases of length one or two. Step 4. Then simply run the topic modeling code (MALLET [McCullum, 2002]) on the produced file and have it output into a format that gives the top words for each topic. The default was 10 topics. bin/mallet train-topics --input counterfeit-Bigramtopicinput.mallet --output-topic-keys counterfeitTopicsBigrams.txt Comments. It is easy to modify it to run phrases of any length, to have a different number of topics, return a different number of top words/phrases, etc. Topic Modeling using Lemur Step 1. Get the PDF files into ap format Lemur expects each file to be surrounded by XML tags.
and there can be multiple <DOC>...</DOC> groups in a file. The SharePoint site has a Visual C project, surroundWithDocStuff, which contains the source and executable for combining all of the pdf files in a subdirectory into a single, ap-tagged input file, say foo.txt. This executable requires you to change the filenames in the source, recompile and execute. However, any simple scripting language can do the same thing in a few lines.
Step 2. Build the required parameter file The Lemur parser is controlled by a parameter file named, for example, Paramteters.sgml. Here is a typical parameter file, which specifies that
the input will be in trec-tagged format, the Krovetz stemming should be used (alternately, use Porter stemming), the list of stop words will be in a file named stopwords.txt (one per line), the output should be in the file ap_output.txt, and that 256 megabytes of memory
should be sufficient to process this input. parsetofile .\Parameters.sgml .\ap\TwoDoc.txt
Step 3. Create or modify the stopword file The stopword file specifies which words you do not want included. They should be specified one per line, and should be stemmed if you are using stemming. Step 4. Parse the input into individual, stemmed words one per line. Execute parsetofile which should be on your executable path after installation. You should be in the same directory as your parameter file, and, in this case, the input and output will be in a subdirectory named here “ap.” parsetofile .\Parameters.sgml .\ap\TwoDoc.txt
51
Step 5. Make LDA Input Files (for Latent Dirichlet Allocation, only) Computing latent topics requires a slight modification of the stream of words produced in Step 4: each line should have the document number and the index of the word in a symbol table. The symbol table itself will be needed for the final, readable list of words in each latent topic. These two files are produced by the program makeLDA_Files, which is included in the Visual Studio C project by that name on the SharePoint site. Invoking the program without parameters will produce a usage description with the most current options. LDA Toolbox and latent topic models Finally, MATLAB software [Steyvers and Griffiths 2009] was used to compute latent topics using the Latent Dirichlet Allocation (LDA) algorithm [Steyvers and Griffiths 2007] . An application program that uses this software is shown in Appendix E. The steps in using this program are outlined in Appendix E. Step 1. Make the LDA Input Files Computing latent topics requires a slight modification of the stream of words produced by the Lemur Toolkit, see Step 4, above,. Each line should have the document number, and the index of the word in a symbol table. The symbol table itself will be needed for the final, readable list of words in each latent topic. These two files are produced by the program makeLDA_Files, which is included in the Visual Studio C project by that name on the SharePoint site. Invoking the program without parameters will produce a usage description with the most current options. Step 2. Compute the Latent Topics Bring up MATLAB, making sure the Mark Steyvers LDA toolbox [Steyvers and Griffiths 2009] is on the path ,then load readFilesAndRunLDA.m, which is a harness to call the compiled LDA code (see Appendix D for a MATLAB program to run LDA). Make sure the harness correctly specifies the name of the files (variables: xxxx_vocab and xxxx_token_stream) made in Step 1, above. You may, also, want to change the number of iterations (variable: nIterations) to be run. Invoke this MATLAB function when you are ready to make the computation.
52
MATLAB Program to run LDA %%read xxxx_vocab.txt and xxxx_token_stream.txt % these files are from the c program make_LDA_Files, which itself reads % the output of lemur's parsetofile command line program. % This matlab program reads xxxx_vocab.txt and xxxx_token_stream.txt % and creates WO, DS, and WS, which are then passed to the LDA library function: % GibbsSamplerLDA % modify these file names as needed: xxxx_vocab = 'Handbook_vocab.txt'; xxxx_token_stream = 'Handbook_token_stream.txt'; nIterations = 5*1000; %specify number of iterations % for the semiconductor data (154 files of text) about 1 iteration/sec. WO = textread(xxxx_vocab, '%s', 'delimiter', '\n', 'whitespace', ''); [N, nShouldBe1] = size(WO); fprintf('File %s has %d words\n', xxxx_vocab, N); %%open the token stream file fid=fopen(xxxx_token_stream, 'r', 'l'); documentID=0; %meaning none, so far nTokensRead = 0; %%Read the values from the token_stream pairs docNum wordNum while(documentID>=0) %%in case in need to bailout, use: documentID=1 [tokenInfo,numberValuesRead]=fscanf(fid,'%d %d',2); if(numberValuesRead ~= 2) break; end nTokensRead = nTokensRead + 1; end frewind(fid); WS=1:nTokensRead; DS=1:nTokensRead; for i=1:nTokensRead [tokenInfo,numberValuesRead] = fscanf(fid, '%d %d',2); DS(i) = tokenInfo(1); WS(i) = tokenInfo(2); end %%RUN LDA T = 50; %set number of desired topics BETA = 0.01; %and use Mark Steyvers rule of thumb for alpha & beta ALPHA = 50.0 / T; SEED = 3; %a restarting point for the random number generater OUTPUT= 1; %0=no output, 1=iterations, 2=all output % RUN GibbsSamplerLDA _______________________ tic [ WP,DP,Z ] = GibbsSamplerLDA(WS, DS, T, nIterations, ALPHA, BETA, SEED, OUTPUT ); toc %put the 7 most likely words per topic in cell structure S [S] =WriteTopics( WP, BETA, WO, 7, 0.7); fprintf( '\n\nMost likely words in the first ten topics:\n' ); S( 1:min(T,10) ) %write the topics to a text file WriteTopics( WP , BETA , WO , 15 , 0.7 , 2 , 'topics.txt' ); %see WriteTopics.m fprintf('\n\nInspect the file ''topics.txt'' for a text-based summary of the topics\n' );
53
Distribution List:
External Distribution: 1 Alexander Slepoy, DOE NA221 (electronic copy) 1 Sandra Thompson, DOE NA221 (electronic copy) 1 Richard Ward, Oak Ridge National Laboratories, (electronic copy) 1 Ken Tobin, Oak Ridge National Laboratories, (electronic copy) 1 Regina Ferrell, Oak Ridge National Laboratories, (electronic copy) 1 Alexandre Sorokine, Oak Ridge National Laboratories, (electronic copy) 1 James Bollinger, Savannah River National Laboratory (electronic copy) 1 Eugene Shine, Savannah River National Laboratory (electronic copy) 1 Vinita Ghosh, Brookhaven National Laboratory (electronic copy) 1 Carl Czajkowki, Brookhaven National Laboratory (electronic copy) 1 Lev Neymotin, Brookhaven National Laboratory (electronic copy) 1 David Stampf, Brookhaven National Laboratory (electronic copy) 1 Jana Strasburg, Pacific Northwest National Laboratory (electronic copy) 1 Craig Blackhart, Los Alamos National Laboratory (electronic copy)
54
Internal Distribution: 1 MS 0899 Technical Library, 9536 (electronic copy) 1 MS-1316 George S. Davidson, 1400 (electronic copy) 1 MS-1316 Mark D. Rintoul, 1412 (electronic copy) 1 MS-0370 David A. Schoenwald (electronic copy) 1 MX-1071 Carol W. Sumpter, 1770 (electronic copy) 1 MS-1084 Tomas K. Lemp, 17461 (electronic copy) 1 MS-1077 Tomas E. Zipperian, 1740 (electronic copy)