30
Wharton Department of Statistics Data Mining with Regression Bob Stine Dept of Statistics, Wharton School University of Pennsylvania

Wharton Department of Statistics
Data Miningwith Regression
Bob StineDept of Statistics, Wharton School
University of Pennsylvania

Wharton Department of Statistics
Some Details• Office hours• Let me know and we can meet at Newberry• [email protected]
• Class notes• http://www-stat.wharton.upenn.edu/~stine/mich/
• Data• Will post ANES and others on Z drive
• JMP software• Depends on your school
2

Wharton Department of Statistics
Topics for Today• Review from last time• Any questions, comments?
• Growing regression models• Deciding which variables improve a model• Standard errors and significance
• Missing data
• Stepwise regression
3
Wharton Department of Statistics
Why use regression?• Claim• Regression is capable of matching the predictive
performance of black-box models• Just a question of having the right X’s
• Regression is familiar• Recognize then fix problems• Shares problems with black-boxes
Opportunity to appreciate what happens in less familiar, more complex models with more flexible structure.
• Familiarity allows improvements• Patches in Foster and Stine 2004
4
Wharton Department of Statistics
Review ANES Example• Start with simple regr, expand to multiple• Post FT Obama on Pre FT Obama• Add ‘Happy/Sad’ and ‘Care Who Wins’• Include interaction effect
• Visual exploration of model form• Show the effects of an interaction• What’s the interaction mean
• Calibration• Being right on average
• Tests and inference• Which terms are significant? What’s that mean?
5
profiling
avg(Y|Ŷ)=Ŷ

Wharton Department of Statistics
Modeling Question• How do we expand a regression model• Reach beyond obvious variables • Find subtle but important features
• Automate typical manual procedure• Iterative improvement• Try variable, diagnose, try another, diagnose…
• Computing allows more expansive search• Open modeling process to allow a surprise • Example: Include interactions
transformations, combinations (e.g. ratios), bundles (e.g. prin comp)
• Magnified scope also magnifies problems6

Wharton Department of Statistics
Medical Example• Numerical response
• Diagnosing severity of osteoporosis• Brittle bones due to loss of calcium• Leads to fractures and subsequent complications• Personal interest
• Response• X-ray measurement of bone density• Standardized to N(0,1) for normal• Possible to avoid expense of x-ray, triage?
• Explanatory variables• Data set designed by committee doctors, biochemists, epidemiologists
7

Wharton Department of Statistics
Osteoporosis Data• Sample of postmenopausal women• 1,232 women with 127 columns • Nursing homes in NE… Dependence? Bias?• Presence of missing data• Measurement error
• Marginal distributions• X-ray scores (zHip), weight, age...
8
ideal data?

Wharton Department of Statistics
Initial Osteo Model• Simple regression• zHip on which variable?• How would you decide…
• Impact of weight
9
Interpretation?
pick largest correlation
consult science
Wharton Department of Statistics
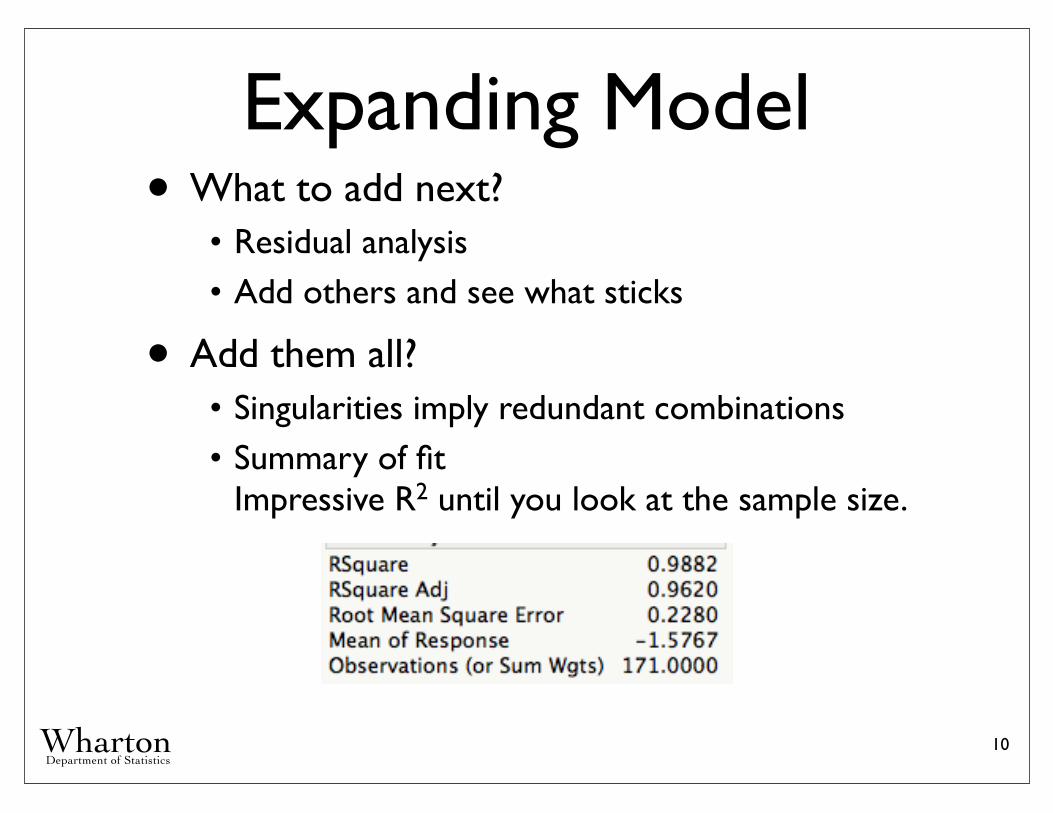
Expanding Model• What to add next?• Residual analysis• Add others and see what sticks
• Add them all?• Singularities imply redundant combinations• Summary of fit
Impressive R2 until you look at the sample size.
10
Wharton Department of Statistics
Missing Data• Fit changes when add variables• Collinearity among explanatory variables• Different subsets of cases
• What to do about the missing cases• Exclude
“Listwise deletion”“Pairwise deletion”
• Impute. Fill them in, perhaps several times
• Imputation relies on big assumption Missing cases resemble those included.
11
Real data is seldom (if ever) missing at random
Wharton Department of Statistics
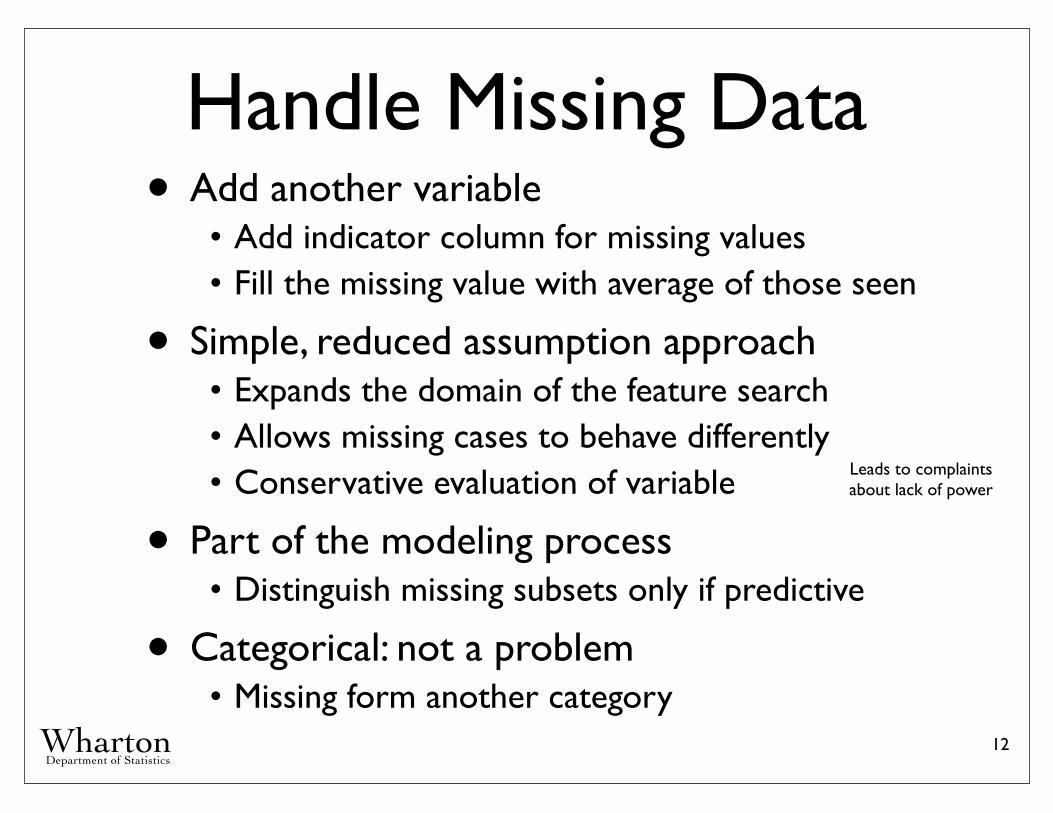
Handle Missing Data• Add another variable• Add indicator column for missing values• Fill the missing value with average of those seen
• Simple, reduced assumption approach• Expands the domain of the feature search• Allows missing cases to behave differently• Conservative evaluation of variable
• Part of the modeling process• Distinguish missing subsets only if predictive
• Categorical: not a problem• Missing form another category
12
Leads to complaints about lack of power

Wharton Department of Statistics
Example of Procedure• Simple regression, missing at random• Conservative: unbiased estimate, inflated SE• n=100, β0=0, β1=3
• 30% missing at random, β1=3
13
-10 -5 0 5 10
-40
-20
0
20
40
-10 -5 0 5 10
-40
-20
0
20
40
-10 -5 0 5 10
-40
-20
0
20
40
Est SEb0
b1
-0.25 1.03.05 0.17
Complete
Est SEb0
b1
-1.5 1.43.01 0.27
Filled In
Wharton Department of Statistics
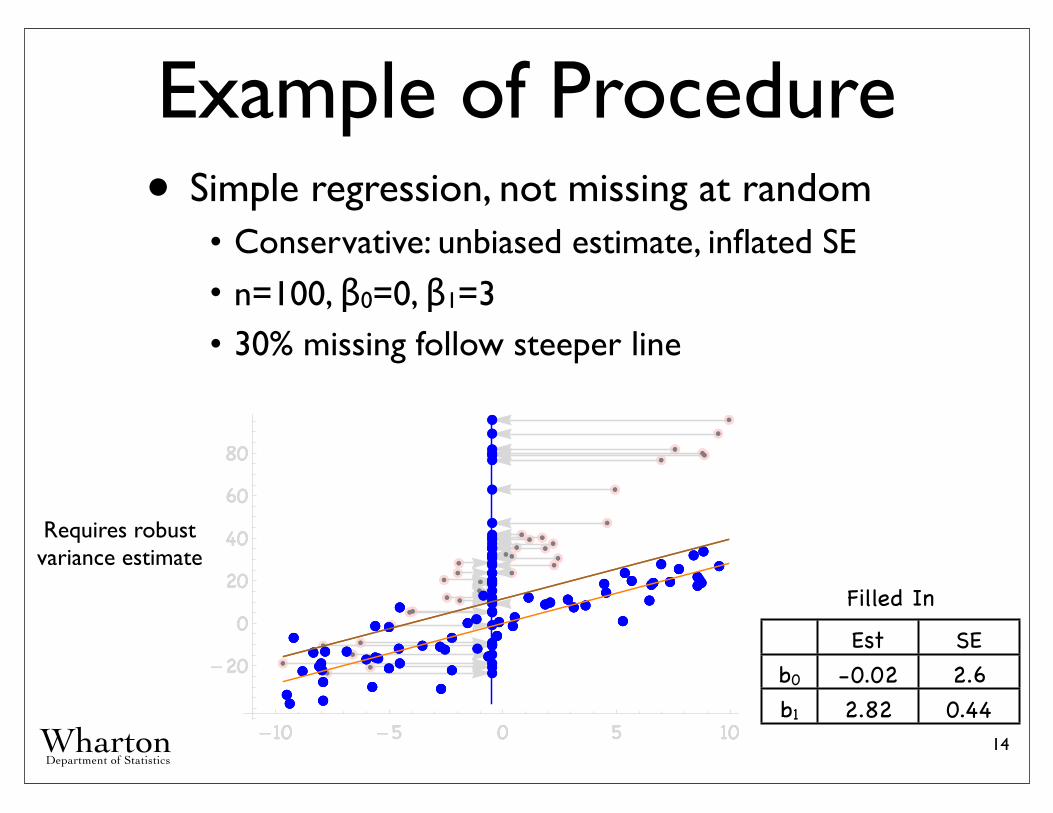
Example of Procedure• Simple regression, not missing at random• Conservative: unbiased estimate, inflated SE• n=100, β0=0, β1=3• 30% missing follow steeper line
14
Est SEb0
b1
-0.02 2.62.82 0.44
Filled In
Requires robust variance estimate
-10 -5 0 5 10
-20
0
20
40
60
80
-10 -5 0 5 10
-20
0
20
40
60
80
-10 -5 0 5 10
-20
0
20
40
60
80
-10 -5 0 5 10
-20
0
20
40
60
80

Wharton Department of Statistics
Example from R
15
Data frame with missing values
Filled in data with added indicator columns
missing_data.R
No cheating: You don’t get to fill in the y’s!
Wharton Department of Statistics
Background of Procedure• Been around for a long time• Well suited to data mining when need to search
for predictive features
• Reference• Paul Allison’s Sage monograph on Missing Data
(Sage # 136, 2002).
• For a critical view, see Jones, M. P. (1996)• J Amer. Statist. Assoc., 91, 222–230• He’s not too fond of this method, but he models
missing data as missing at random.
16

Wharton Department of Statistics
Expanded Osteo Data• Fill in missing data• Grows from 126 to 208 possible Xs
• Saturated model results • Full sample but so few significant effects
17
Do in R
Still missing interactions

Wharton Department of Statistics
Stepwise Regression• Need a better approach• Cannot always fit the saturated model• Saturated model excludes transformations such
as interactions that might be useful
• Mimic manual procedure • Find variable that improves the current model
the most• Add it if the improvement is significant.
• Greedy search• Common in data mining with many possible X’s• One step ahead, not all possible models• Requires caution to use effectively
18
Wharton Department of Statistics
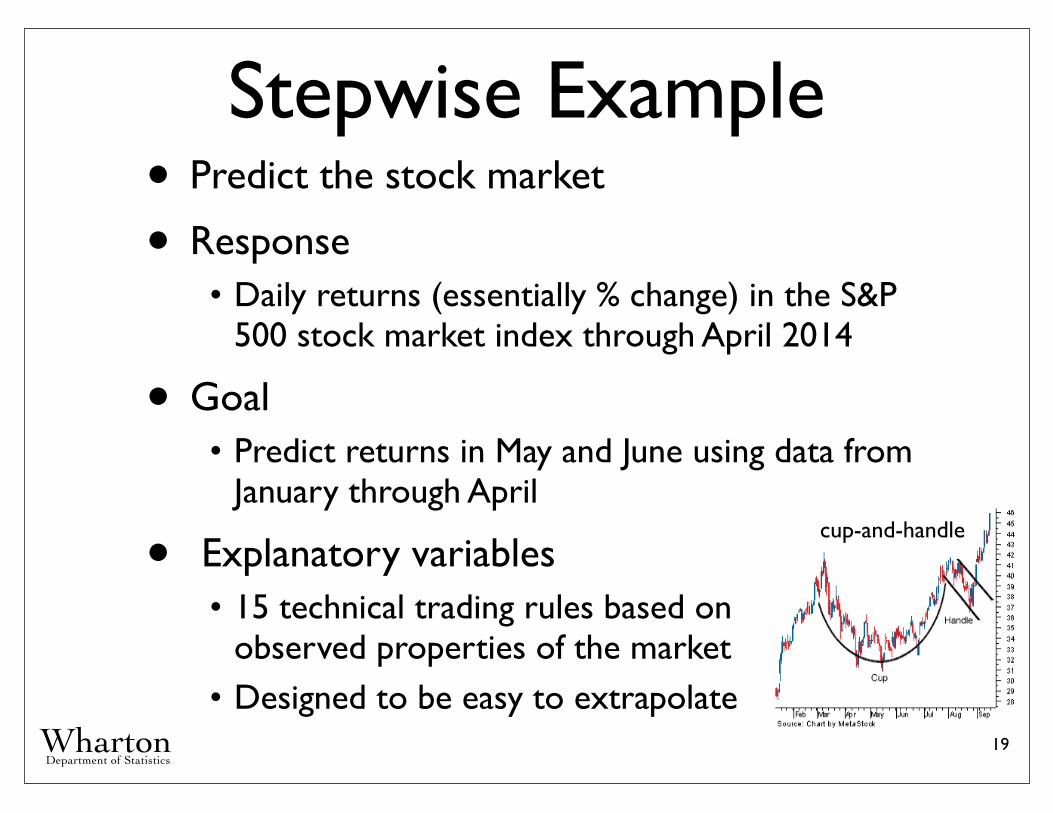
Stepwise Example• Predict the stock market
• Response• Daily returns (essentially % change) in the S&P
500 stock market index through April 2014
• Goal• Predict returns in May and June using data from
January through April
• Explanatory variables• 15 technical trading rules based on
observed properties of the market• Designed to be easy to extrapolate
19
cup-and-handle

Wharton Department of Statistics
Results• Model has quite a few X’s but is very
predictive and highly stat significant.
20Residuals diagnostics check out fine...
Wharton Department of Statistics
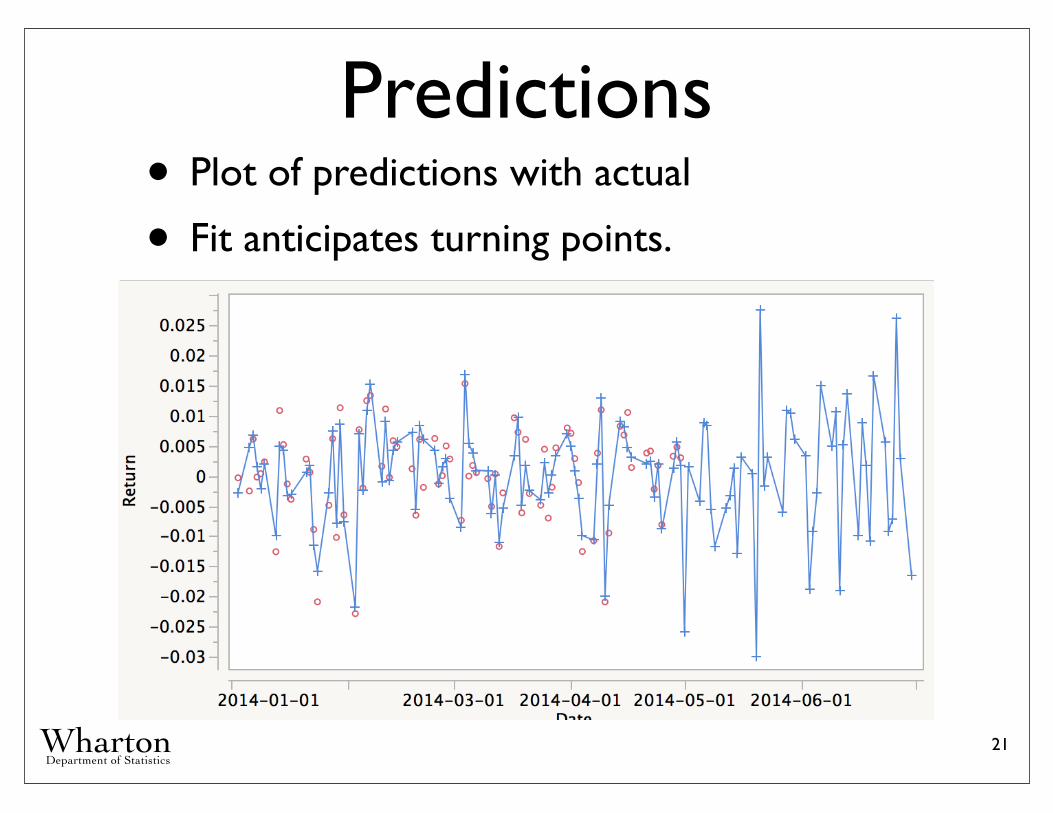
Predictions• Plot of predictions with actual
• Fit anticipates turning points.
21
Wharton Department of Statistics
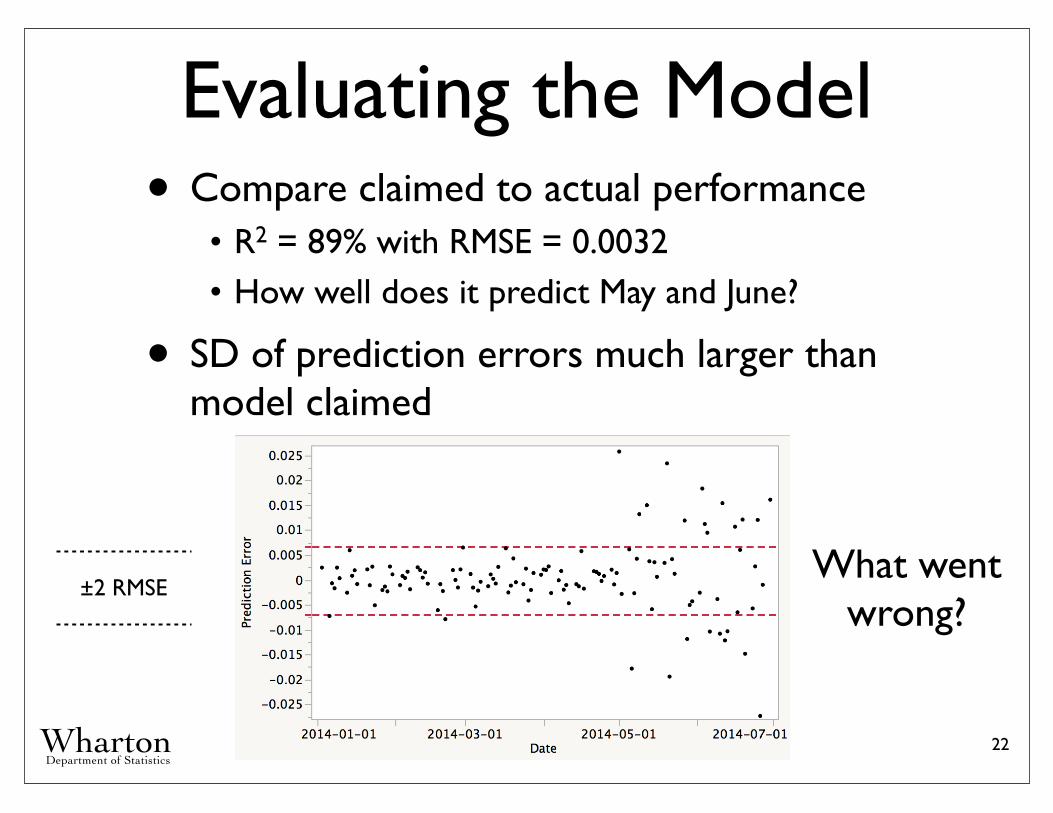
Evaluating the Model• Compare claimed to actual performance• R2 = 89% with RMSE = 0.0032• How well does it predict May and June?
• SD of prediction errors much larger than model claimed
22
What went wrong?
±2 RMSE

Wharton Department of Statistics
Forward Stepwise• Allow all possible interactions, 135 possible• Start with 15 X’s• Add 15 squares of X’s• Add 15*14/2 = 105 interactions• Principle of marginality?
• Forward search• Greedy search says to add most predictive• Problem is when to stop?
• Use statistical significance?• What threshold for the p-value?• Follow convention and set α=0.05 or larger?
23
Response surface in JMP

Wharton Department of Statistics
Explanation of Problem• Examine the definition of the technical
trading rules used in the model
• Why did the stepwise get this so wrong?• Problem is classic example of over-fitting• Tukey “Optimization capitalizes on chance”
• Problem is not with stepwise• Rather it lies with our use of classical statistics • α=0.05 intended for one test, not 135
24
Wharton Department of Statistics
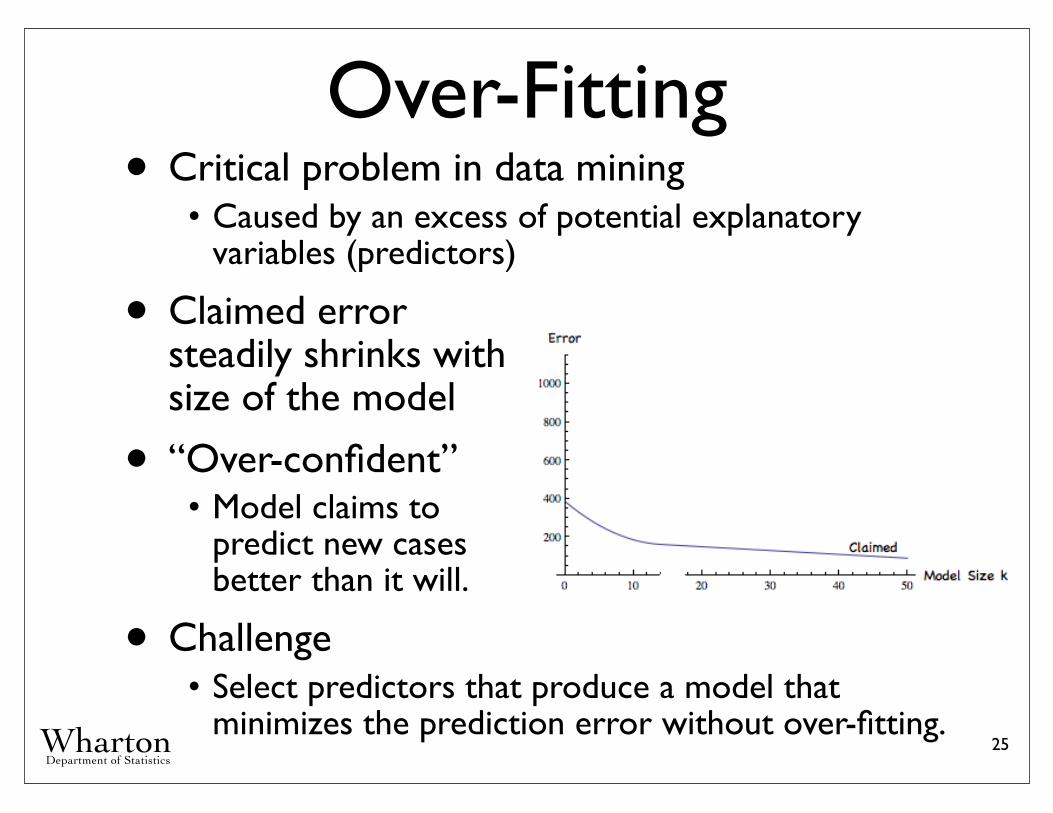
Over-Fitting• Critical problem in data mining• Caused by an excess of potential explanatory
variables (predictors)
• Claimed errorsteadily shrinks withsize of the model
• “Over-confident”• Model claims to
predict new cases better than it will.
• Challenge• Select predictors that produce a model that
minimizes the prediction error without over-fitting.25
over-fitting
Wharton Department of Statistics
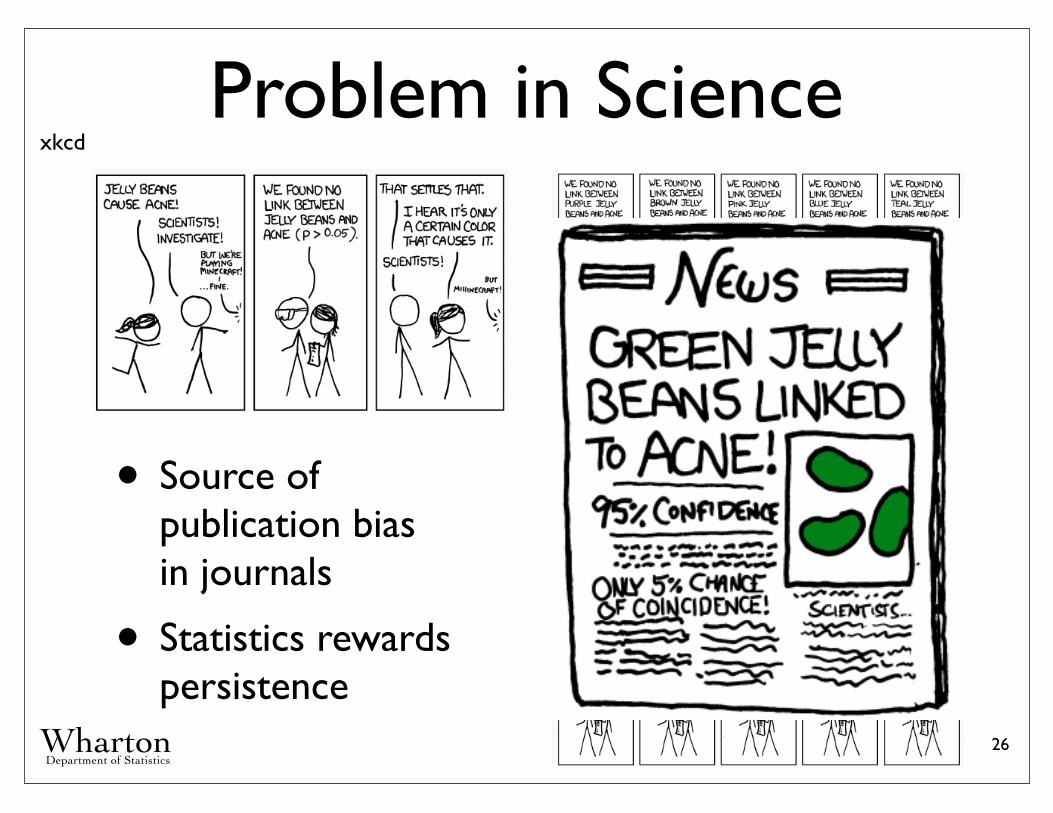
Problem in Science
• Source of publication biasin journals
• Statistics rewards persistence
26
xkcd
Wharton Department of Statistics
How to get it right?• Three approaches• Avoid stepwise (and similar methods) altogether• Reserve a validation sample (cross-validation)• Be more choosy about what to add to model
• Bonferroni rule• Set the p-value based on the scope of the search• Searching 135 variables, so set the threshold to 0.05/135 ≈ 0.00037• Result of stepwise search?
27
Bonferroni gets it right… Nothing is added to the model!

Wharton Department of Statistics
Take-Aways• Missing data• Fill in with an added indicator for missingness
• Over-fitting• Model includes things that appear to predict the
response but in fact do not
• Stepwise regression• Illustrative greedy search for features that mimics
what we do manually when modeling• Expansive scope that includes interactions• Bonferroni: Set p-to-enter = 0.05/(# possible)
28

Wharton Department of Statistics
Assignment• Missing data• What do you do with them now?
• Try doing stepwise regression with your own software.• Does your software offer robust variance
estimates (aka White or Sandwich estimates)
• Take a look at the ANES data
29

Wharton Department of Statistics
Next Time• Review of over-fitting• What it is and why it matters• Role of Bonferroni
• Other approaches to avoiding over-fitting• Model selection criteria: AIC, BIC, …• Cross-validation• Shrinkage and the lasso
30


