88
Informatica (Version 9.0.1 HotFix 2) Data Profiling Guide

Informatica (Version 9.0.1 HotFix 2)
Data Profiling Guide

Informatica Data Profiling Guide
Version 9.0.1 HotFix 2November 2010
Copyright (c) 1998-2010 Informatica. All rights reserved.
This software and documentation contain proprietary information of Informatica Corporation and are provided under a license agreement containing restrictions on use anddisclosure and are also protected by copyright law. Reverse engineering of the software is prohibited. No part of this document may be reproduced or transmitted in any form,by any means (electronic, photocopying, recording or otherwise) without prior consent of Informatica Corporation. This Software may be protected by U.S. and/or internationalPatents and other Patents Pending.
Use, duplication, or disclosure of the Software by the U.S. Government is subject to the restrictions set forth in the applicable software license agreement and as provided inDFARS 227.7202-1(a) and 227.7702-3(a) (1995), DFARS 252.227-7013©(1)(ii) (OCT 1988), FAR 12.212(a) (1995), FAR 52.227-19, or FAR 52.227-14 (ALT III), as applicable.
The information in this product or documentation is subject to change without notice. If you find any problems in this product or documentation, please report them to us inwriting.
Informatica, Informatica Platform, Informatica Data Services, PowerCenter, PowerCenterRT, PowerCenter Connect, PowerCenter Data Analyzer, PowerExchange,PowerMart, Metadata Manager, Informatica Data Quality, Informatica Data Explorer, Informatica B2B Data Transformation, Informatica B2B Data Exchange and InformaticaOn Demand are trademarks or registered trademarks of Informatica Corporation in the United States and in jurisdictions throughout the world. All other company and productnames may be trade names or trademarks of their respective owners.
Portions of this software and/or documentation are subject to copyright held by third parties, including without limitation: Copyright DataDirect Technologies. All rightsreserved. Copyright © Sun Microsystems. All rights reserved. Copyright © RSA Security Inc. All Rights Reserved. Copyright © Ordinal Technology Corp. All rightsreserved.Copyright © Aandacht c.v. All rights reserved. Copyright Genivia, Inc. All rights reserved. Copyright 2007 Isomorphic Software. All rights reserved. Copyright © MetaIntegration Technology, Inc. All rights reserved. Copyright © Oracle. All rights reserved. Copyright © Adobe Systems Incorporated. All rights reserved. Copyright © DataArt,Inc. All rights reserved. Copyright © ComponentSource. All rights reserved. Copyright © Microsoft Corporation. All rights reserved. Copyright © Rouge Wave Software, Inc. Allrights reserved. Copyright © Teradata Corporation. All rights reserved. Copyright © Yahoo! Inc. All rights reserved. Copyright © Glyph & Cog, LLC. All rights reserved.
This product includes software developed by the Apache Software Foundation (http://www.apache.org/), and other software which is licensed under the Apache License,Version 2.0 (the "License"). You may obtain a copy of the License at http://www.apache.org/licenses/LICENSE-2.0. Unless required by applicable law or agreed to in writing,software distributed under the License is distributed on an "AS IS" BASIS, WITHOUT WARRANTIES OR CONDITIONS OF ANY KIND, either express or implied. See theLicense for the specific language governing permissions and limitations under the License.
This product includes software which was developed by Mozilla (http://www.mozilla.org/), software copyright The JBoss Group, LLC, all rights reserved; software copyright ©1999-2006 by Bruno Lowagie and Paulo Soares and other software which is licensed under the GNU Lesser General Public License Agreement, which may be found at http://www.gnu.org/licenses/lgpl.html. The materials are provided free of charge by Informatica, "as-is", without warranty of any kind, either express or implied, including but notlimited to the implied warranties of merchantability and fitness for a particular purpose.
The product includes ACE(TM) and TAO(TM) software copyrighted by Douglas C. Schmidt and his research group at Washington University, University of California, Irvine,and Vanderbilt University, Copyright (©) 1993-2006, all rights reserved.
This product includes software developed by the OpenSSL Project for use in the OpenSSL Toolkit (copyright The OpenSSL Project. All Rights Reserved) and redistribution ofthis software is subject to terms available at http://www.openssl.org.
This product includes Curl software which is Copyright 1996-2007, Daniel Stenberg, <[email protected]>. All Rights Reserved. Permissions and limitations regarding thissoftware are subject to terms available at http://curl.haxx.se/docs/copyright.html. Permission to use, copy, modify, and distribute this software for any purpose with or withoutfee is hereby granted, provided that the above copyright notice and this permission notice appear in all copies.
The product includes software copyright 2001-2005 (©) MetaStuff, Ltd. All Rights Reserved. Permissions and limitations regarding this software are subject to terms availableat http://www.dom4j.org/ license.html.
The product includes software copyright © 2004-2007, The Dojo Foundation. All Rights Reserved. Permissions and limitations regarding this software are subject to termsavailable at http:// svn.dojotoolkit.org/dojo/trunk/LICENSE.
This product includes ICU software which is copyright International Business Machines Corporation and others. All rights reserved. Permissions and limitations regarding thissoftware are subject to terms available at http://source.icu-project.org/repos/icu/icu/trunk/license.html.
This product includes software copyright © 1996-2006 Per Bothner. All rights reserved. Your right to use such materials is set forth in the license which may be found at http://www.gnu.org/software/ kawa/Software-License.html.
This product includes OSSP UUID software which is Copyright © 2002 Ralf S. Engelschall, Copyright © 2002 The OSSP Project Copyright © 2002 Cable & WirelessDeutschland. Permissions and limitations regarding this software are subject to terms available at http://www.opensource.org/licenses/mit-license.php.
This product includes software developed by Boost (http://www.boost.org/) or under the Boost software license. Permissions and limitations regarding this software are subjectto terms available at http:/ /www.boost.org/LICENSE_1_0.txt.
This product includes software copyright © 1997-2007 University of Cambridge. Permissions and limitations regarding this software are subject to terms available at http://www.pcre.org/license.txt.
This product includes software copyright © 2007 The Eclipse Foundation. All Rights Reserved. Permissions and limitations regarding this software are subject to termsavailable at http:// www.eclipse.org/org/documents/epl-v10.php.
This product includes software licensed under the terms at http://www.tcl.tk/software/tcltk/license.html, http://www.bosrup.com/web/overlib/?License, http://www.stlport.org/doc/license.html, http://www.asm.ow2.org/license.html, http://www.cryptix.org/LICENSE.TXT, http://hsqldb.org/web/hsqlLicense.html, http://httpunit.sourceforge.net/doc/license.html, http://jung.sourceforge.net/license.txt , http://www.gzip.org/zlib/zlib_license.html, http://www.openldap.org/software/release/license.html, http://www.libssh2.org,http://slf4j.org/license.html, http://www.sente.ch/software/OpenSourceLicense.html, and http://fusesource.com/downloads/license-agreements/fuse-message-broker-v-5-3-license-agreement.
This product includes software licensed under the Academic Free License (http://www.opensource.org/licenses/afl-3.0.php), the Common Development and DistributionLicense (http://www.opensource.org/licenses/cddl1.php) the Common Public License (http://www.opensource.org/licenses/cpl1.0.php) and the BSD License (http://www.opensource.org/licenses/bsd-license.php).
This product includes software copyright © 2003-2006 Joe WaInes, 2006-2007 XStream Committers. All rights reserved. Permissions and limitations regarding this softwareare subject to terms available at http://xstream.codehaus.org/license.html. This product includes software developed by the Indiana University Extreme! Lab. For furtherinformation please visit http://www.extreme.indiana.edu/.
This Software is protected by U.S. Patent Numbers 5,794,246; 6,014,670; 6,016,501; 6,029,178; 6,032,158; 6,035,307; 6,044,374; 6,092,086; 6,208,990; 6,339,775;6,640,226; 6,789,096; 6,820,077; 6,823,373; 6,850,947; 6,895,471; 7,117,215; 7,162,643; 7,254,590; 7,281,001; 7,421,458; and 7,584,422, international Patents and otherPatents Pending.

DISCLAIMER: Informatica Corporation provides this documentation "as is" without warranty of any kind, either express or implied, including, but not limited to, the impliedwarranties of non-infringement, merchantability, or use for a particular purpose. Informatica Corporation does not warrant that this software or documentation is error free. Theinformation provided in this software or documentation may include technical inaccuracies or typographical errors. The information in this software and documentation issubject to change at any time without notice.
NOTICES
This Informatica product (the “Software”) includes certain drivers (the “DataDirect Drivers”) from DataDirect Technologies, an operating company of Progress SoftwareCorporation (“DataDirect”) which are subject to the following terms and conditions:
1.THE DATADIRECT DRIVERS ARE PROVIDED “AS IS” WITHOUT WARRANTY OF ANY KIND, EITHER EXPRESSED OR IMPLIED, INCLUDING BUT NOTLIMITED TO, THE IMPLIED WARRANTIES OF MERCHANTABILITY, FITNESS FOR A PARTICULAR PURPOSE AND NON-INFRINGEMENT.
2. IN NO EVENT WILL DATADIRECT OR ITS THIRD PARTY SUPPLIERS BE LIABLE TO THE END-USER CUSTOMER FOR ANY DIRECT, INDIRECT,INCIDENTAL, SPECIAL, CONSEQUENTIAL OR OTHER DAMAGES ARISING OUT OF THE USE OF THE ODBC DRIVERS, WHETHER OR NOT INFORMED OFTHE POSSIBILITIES OF DAMAGES IN ADVANCE. THESE LIMITATIONS APPLY TO ALL CAUSES OF ACTION, INCLUDING, WITHOUT LIMITATION, BREACHOF CONTRACT, BREACH OF WARRANTY, NEGLIGENCE, STRICT LIABILITY, MISREPRESENTATION AND OTHER TORTS.
Part Number: IN-PRG-90100HF2-0001

Table of Contents
Preface . . . . . . . . . . . . . . . . . . . . . . . . . . . . . . . . . . . . . . . . . . . . . . . . . . . . . . . . . . . . . . . . . . . . . . . . . . . vInformatica Resources. . . . . . . . . . . . . . . . . . . . . . . . . . . . . . . . . . . . . . . . . . . . . . . . . . . . . . v
Informatica Customer Portal. . . . . . . . . . . . . . . . . . . . . . . . . . . . . . . . . . . . . . . . . . . . . . . . v
Informatica Documentation. . . . . . . . . . . . . . . . . . . . . . . . . . . . . . . . . . . . . . . . . . . . . . . . . v
Informatica Web Site. . . . . . . . . . . . . . . . . . . . . . . . . . . . . . . . . . . . . . . . . . . . . . . . . . . . . v
Informatica How-To Library. . . . . . . . . . . . . . . . . . . . . . . . . . . . . . . . . . . . . . . . . . . . . . . . v
Informatica Knowledge Base. . . . . . . . . . . . . . . . . . . . . . . . . . . . . . . . . . . . . . . . . . . . . . . vi
Informatica Multimedia Knowledge Base. . . . . . . . . . . . . . . . . . . . . . . . . . . . . . . . . . . . . . . . vi
Informatica Global Customer Support. . . . . . . . . . . . . . . . . . . . . . . . . . . . . . . . . . . . . . . . . . vi
Part I: Overview of Profiling. . . . . . . . . . . . . . . . . . . . . . . . . . . . . . . . . . . . . . . . . . . . . . . . . . . . . . . 1
Chapter 1: Profiling Methods. . . . . . . . . . . . . . . . . . . . . . . . . . . . . . . . . . . . . . . . . . . . . 2Profiling Overview. . . . . . . . . . . . . . . . . . . . . . . . . . . . . . . . . . . . . . . . . . . . . . . . . . . . . . . . . 2
Column Profiling. . . . . . . . . . . . . . . . . . . . . . . . . . . . . . . . . . . . . . . . . . . . . . . . . . . . . . . . . . 2
Profile Options. . . . . . . . . . . . . . . . . . . . . . . . . . . . . . . . . . . . . . . . . . . . . . . . . . . . . 3
Creating a Column Profile for a Data Object. . . . . . . . . . . . . . . . . . . . . . . . . . . . . . . . . . . 4
Creating a Quick Profile. . . . . . . . . . . . . . . . . . . . . . . . . . . . . . . . . . . . . . . . . . . . . . . . 4
Creating a Custom Profile. . . . . . . . . . . . . . . . . . . . . . . . . . . . . . . . . . . . . . . . . . . . . . 5
Running a Profile. . . . . . . . . . . . . . . . . . . . . . . . . . . . . . . . . . . . . . . . . . . . . . . . . . . . 5
Viewing Profile Results. . . . . . . . . . . . . . . . . . . . . . . . . . . . . . . . . . . . . . . . . . . . . . . . 6
Join Analysis. . . . . . . . . . . . . . . . . . . . . . . . . . . . . . . . . . . . . . . . . . . . . . . . . . . . . . . . . . . . . 7
Creating a Profile for Join Analysis. . . . . . . . . . . . . . . . . . . . . . . . . . . . . . . . . . . . . . . . . 7
Join Analysis Results. . . . . . . . . . . . . . . . . . . . . . . . . . . . . . . . . . . . . . . . . . . . . . . . . 7
Profiling a Mapplet or Mapping Object. . . . . . . . . . . . . . . . . . . . . . . . . . . . . . . . . . . . . . . . . . . . 8
Chapter 2: Profiles and Rules. . . . . . . . . . . . . . . . . . . . . . . . . . . . . . . . . . . . . . . . . . . . . 9Configure Profiles and Rules. . . . . . . . . . . . . . . . . . . . . . . . . . . . . . . . . . . . . . . . . . . . . . . . . . 9
Rule Types. . . . . . . . . . . . . . . . . . . . . . . . . . . . . . . . . . . . . . . . . . . . . . . . . . . . . . . . . . . . . 10
Predefined Rules. . . . . . . . . . . . . . . . . . . . . . . . . . . . . . . . . . . . . . . . . . . . . . . . . . . 10
Expression Rules. . . . . . . . . . . . . . . . . . . . . . . . . . . . . . . . . . . . . . . . . . . . . . . . . . . 11
Mapplets and Rules. . . . . . . . . . . . . . . . . . . . . . . . . . . . . . . . . . . . . . . . . . . . . . . . . 12
Adding a Rule to Profile. . . . . . . . . . . . . . . . . . . . . . . . . . . . . . . . . . . . . . . . . . . . . . . . . . . . . 13
Profile Results. . . . . . . . . . . . . . . . . . . . . . . . . . . . . . . . . . . . . . . . . . . . . . . . . . . . . . . . . . . 13
Profile Summary. . . . . . . . . . . . . . . . . . . . . . . . . . . . . . . . . . . . . . . . . . . . . . . . . . . 14
Column Values. . . . . . . . . . . . . . . . . . . . . . . . . . . . . . . . . . . . . . . . . . . . . . . . . . . . 15
Column Patterns. . . . . . . . . . . . . . . . . . . . . . . . . . . . . . . . . . . . . . . . . . . . . . . . . . . 15
Column Statistics. . . . . . . . . . . . . . . . . . . . . . . . . . . . . . . . . . . . . . . . . . . . . . . . . . . 16
Table of Contents i

Viewing Profile Results. . . . . . . . . . . . . . . . . . . . . . . . . . . . . . . . . . . . . . . . . . . . . . . 16
Exporting Profile Results. . . . . . . . . . . . . . . . . . . . . . . . . . . . . . . . . . . . . . . . . . . . . . 16
Viewing and Adding Profile Comments. . . . . . . . . . . . . . . . . . . . . . . . . . . . . . . . . . . . . . . . . . . 17
Previewing a Table or File . . . . . . . . . . . . . . . . . . . . . . . . . . . . . . . . . . . . . . . . . . . . . . . . . . . 17
Wide Tables and Files. . . . . . . . . . . . . . . . . . . . . . . . . . . . . . . . . . . . . . . . . . . . . . . . . . . . . . 18
Rules and Guidelines for Profiles. . . . . . . . . . . . . . . . . . . . . . . . . . . . . . . . . . . . . . . . . . . . . . . 18
Chapter 3: Export and Import Profiles. . . . . . . . . . . . . . . . . . . . . . . . . . . . . . . . . . . . . 19Object Import and Export Overview. . . . . . . . . . . . . . . . . . . . . . . . . . . . . . . . . . . . . . . . . . . . . 19
The Import/Export XML File. . . . . . . . . . . . . . . . . . . . . . . . . . . . . . . . . . . . . . . . . . . . . . . . . . 20
Exporting Objects. . . . . . . . . . . . . . . . . . . . . . . . . . . . . . . . . . . . . . . . . . . . . . . . . . . . . . . . . 20
Importing Objects. . . . . . . . . . . . . . . . . . . . . . . . . . . . . . . . . . . . . . . . . . . . . . . . . . . . . . . . . 21
Chapter 4: Scorecards. . . . . . . . . . . . . . . . . . . . . . . . . . . . . . . . . . . . . . . . . . . . . . . . . . 22Scorecards Overview. . . . . . . . . . . . . . . . . . . . . . . . . . . . . . . . . . . . . . . . . . . . . . . . . . . . . . 22
Creating a Scorecard. . . . . . . . . . . . . . . . . . . . . . . . . . . . . . . . . . . . . . . . . . . . . . . . . . . . . . 23
Adding Columns to a Scorecard. . . . . . . . . . . . . . . . . . . . . . . . . . . . . . . . . . . . . . . . . . . . . . . . 24
Running a Scorecard. . . . . . . . . . . . . . . . . . . . . . . . . . . . . . . . . . . . . . . . . . . . . . . . . . . . . . . 24
Viewing a Scorecard. . . . . . . . . . . . . . . . . . . . . . . . . . . . . . . . . . . . . . . . . . . . . . . . . . . . . . . 25
Drilling Down on Columns. . . . . . . . . . . . . . . . . . . . . . . . . . . . . . . . . . . . . . . . . . . . . 25
Viewing Column Data in a Scorecard. . . . . . . . . . . . . . . . . . . . . . . . . . . . . . . . . . . . . . . . . . . . 25
Editing a Scorecard. . . . . . . . . . . . . . . . . . . . . . . . . . . . . . . . . . . . . . . . . . . . . . . . . . . . . . . 26
Defining Thresholds. . . . . . . . . . . . . . . . . . . . . . . . . . . . . . . . . . . . . . . . . . . . . . . . . 26
Creating a Group. . . . . . . . . . . . . . . . . . . . . . . . . . . . . . . . . . . . . . . . . . . . . . . . . . . . . . . . . 27
Moving Scores to a Group. . . . . . . . . . . . . . . . . . . . . . . . . . . . . . . . . . . . . . . . . . . . . 27
Editing a Group. . . . . . . . . . . . . . . . . . . . . . . . . . . . . . . . . . . . . . . . . . . . . . . . . . . . . . . . . . 27
Deleting a Group. . . . . . . . . . . . . . . . . . . . . . . . . . . . . . . . . . . . . . . . . . . . . . . . . . . . . . . . . 28
Viewing Trend Charts. . . . . . . . . . . . . . . . . . . . . . . . . . . . . . . . . . . . . . . . . . . . . . . . . . . . . . 28
Rules and Guidelines for Scorecards. . . . . . . . . . . . . . . . . . . . . . . . . . . . . . . . . . . . . . . . . . . . 29
Chapter 5: Reference Data. . . . . . . . . . . . . . . . . . . . . . . . . . . . . . . . . . . . . . . . . . . . . . 30Reference Data Overview. . . . . . . . . . . . . . . . . . . . . . . . . . . . . . . . . . . . . . . . . . . . . . . . . . . 30
Types of Reference Data. . . . . . . . . . . . . . . . . . . . . . . . . . . . . . . . . . . . . . . . . . . . . . . . . . . . 30
Reference Tables. . . . . . . . . . . . . . . . . . . . . . . . . . . . . . . . . . . . . . . . . . . . . . . . . . . . . . . . . 31
Reference Table Properties. . . . . . . . . . . . . . . . . . . . . . . . . . . . . . . . . . . . . . . . . . . . 31
Create Reference Tables. . . . . . . . . . . . . . . . . . . . . . . . . . . . . . . . . . . . . . . . . . . . . . 33
Importing a Reference Table. . . . . . . . . . . . . . . . . . . . . . . . . . . . . . . . . . . . . . . . . . . . 36
Reference Table Management. . . . . . . . . . . . . . . . . . . . . . . . . . . . . . . . . . . . . . . . . . 36
Audit Trail Events. . . . . . . . . . . . . . . . . . . . . . . . . . . . . . . . . . . . . . . . . . . . . . . . . . . 38
ii Table of Contents

Part II: Getting Started with Informatica Analyst. . . . . . . . . . . . . . . . . . . . . . . . . . . . . . . . . . . 40
Chapter 6: Lesson 1. Setting Up Informatica Analyst. . . . . . . . . . . . . . . . . . . . . . . . . 41Setting Up Informatica Analyst Overview. . . . . . . . . . . . . . . . . . . . . . . . . . . . . . . . . . . . . . . . . . 41
Task 1. Log In to Informatica Analyst. . . . . . . . . . . . . . . . . . . . . . . . . . . . . . . . . . . . . . . . . . . . 42
Task 2. Create a Project. . . . . . . . . . . . . . . . . . . . . . . . . . . . . . . . . . . . . . . . . . . . . . . . . . . . 42
Task 3. Create a Folder. . . . . . . . . . . . . . . . . . . . . . . . . . . . . . . . . . . . . . . . . . . . . . . . . . . . . 42
Setting Up Informatica Analyst Summary. . . . . . . . . . . . . . . . . . . . . . . . . . . . . . . . . . . . . . . . . . 43
Chapter 7: Lesson 2. Creating Data Objects. . . . . . . . . . . . . . . . . . . . . . . . . . . . . . . . . 44Creating Data Objects Overview. . . . . . . . . . . . . . . . . . . . . . . . . . . . . . . . . . . . . . . . . . . . . . . 44
Task 1. Create the Flat File Data Object. . . . . . . . . . . . . . . . . . . . . . . . . . . . . . . . . . . . . . . . . . 45
Task 2. Preview the Data. . . . . . . . . . . . . . . . . . . . . . . . . . . . . . . . . . . . . . . . . . . . . . . . . . . . 45
Creating Data Objects Summary. . . . . . . . . . . . . . . . . . . . . . . . . . . . . . . . . . . . . . . . . . . . . . . 46
Chapter 8: Lesson 3. Creating Quick Profiles. . . . . . . . . . . . . . . . . . . . . . . . . . . . . . . 47Creating Quick Profiles Overview. . . . . . . . . . . . . . . . . . . . . . . . . . . . . . . . . . . . . . . . . . . . . . . 47
Task 1. Create and Run a Quick Profile. . . . . . . . . . . . . . . . . . . . . . . . . . . . . . . . . . . . . . . . . . . 48
Task 2. View the Profile Results. . . . . . . . . . . . . . . . . . . . . . . . . . . . . . . . . . . . . . . . . . . . . . . 48
Creating Quick Profiles Summary. . . . . . . . . . . . . . . . . . . . . . . . . . . . . . . . . . . . . . . . . . . . . . . 49
Chapter 9: Lesson 4. Creating Custom Profiles. . . . . . . . . . . . . . . . . . . . . . . . . . . . . . 50Creating Custom Profiles Overview. . . . . . . . . . . . . . . . . . . . . . . . . . . . . . . . . . . . . . . . . . . . . 50
Task 1. Create a Custom Profile. . . . . . . . . . . . . . . . . . . . . . . . . . . . . . . . . . . . . . . . . . . . . . . 51
Task 2. Run the Profile. . . . . . . . . . . . . . . . . . . . . . . . . . . . . . . . . . . . . . . . . . . . . . . . . . . . . 51
Task 3. Drill Down on Profile Results. . . . . . . . . . . . . . . . . . . . . . . . . . . . . . . . . . . . . . . . . . . . 52
Creating Custom Profiles Summary. . . . . . . . . . . . . . . . . . . . . . . . . . . . . . . . . . . . . . . . . . . . . 52
Chapter 10: Lesson 5. Creating Expression Rules. . . . . . . . . . . . . . . . . . . . . . . . . . . . 53Creating Expression Rules Overview. . . . . . . . . . . . . . . . . . . . . . . . . . . . . . . . . . . . . . . . . . . . 53
Task 1. Create Expression Rules and Run the Profile. . . . . . . . . . . . . . . . . . . . . . . . . . . . . . . . . . 54
Task 2. View the Expression Rule Output. . . . . . . . . . . . . . . . . . . . . . . . . . . . . . . . . . . . . . . . . 54
Task 3. Edit the Expression Rules. . . . . . . . . . . . . . . . . . . . . . . . . . . . . . . . . . . . . . . . . . . . . . 55
Creating Expression Rules Summary. . . . . . . . . . . . . . . . . . . . . . . . . . . . . . . . . . . . . . . . . . . . 55
Chapter 11: Lesson 6. Creating and Running Scorecards. . . . . . . . . . . . . . . . . . . . . . 56Creating and Running Scorecards Overview. . . . . . . . . . . . . . . . . . . . . . . . . . . . . . . . . . . . . . . . 56
Task 1. Create a Scorecard from the Profile Results. . . . . . . . . . . . . . . . . . . . . . . . . . . . . . . . . . 57
Task 2. Run the Scorecard. . . . . . . . . . . . . . . . . . . . . . . . . . . . . . . . . . . . . . . . . . . . . . . . . . . 58
Task 3. View the Scorecard. . . . . . . . . . . . . . . . . . . . . . . . . . . . . . . . . . . . . . . . . . . . . . . . . . 58
Task 4. Edit the Scorecard. . . . . . . . . . . . . . . . . . . . . . . . . . . . . . . . . . . . . . . . . . . . . . . . . . . 58
Task 5. Configure Thresholds. . . . . . . . . . . . . . . . . . . . . . . . . . . . . . . . . . . . . . . . . . . . . . . . . 59
Table of Contents iii

Task 6. View Score Trend Charts. . . . . . . . . . . . . . . . . . . . . . . . . . . . . . . . . . . . . . . . . . . . . . . 59
Creating and Running Scorecards Summary. . . . . . . . . . . . . . . . . . . . . . . . . . . . . . . . . . . . . . . 59
Chapter 12: Lesson 7. Creating Reference Tables from Profile Columns. . . . . . . . . . 60Creating Reference Tables from Profile Columns Overview. . . . . . . . . . . . . . . . . . . . . . . . . . . . . . 60
Task 1. Create a Reference Table from Profile Columns. . . . . . . . . . . . . . . . . . . . . . . . . . . . . . . . 61
Task 2. Edit the Reference Table. . . . . . . . . . . . . . . . . . . . . . . . . . . . . . . . . . . . . . . . . . . . . . . 62
Creating Reference Tables from Profile Columns Summary. . . . . . . . . . . . . . . . . . . . . . . . . . . . . . 62
Chapter 13: Lesson 8. Creating Reference Tables. . . . . . . . . . . . . . . . . . . . . . . . . . . . 63Creating Reference Tables Overview. . . . . . . . . . . . . . . . . . . . . . . . . . . . . . . . . . . . . . . . . . . . 63
Task 1. Create a Reference Table. . . . . . . . . . . . . . . . . . . . . . . . . . . . . . . . . . . . . . . . . . . . . . 64
Creating Reference Tables Summary. . . . . . . . . . . . . . . . . . . . . . . . . . . . . . . . . . . . . . . . . . . . 64
Part III: Getting Started with Informatica Developer (Data Quality). . . . . . . . . . . . . . . . . . 65
Chapter 14: Lesson 1. Setting Up Informatica Developer. . . . . . . . . . . . . . . . . . . . . . 66Setting Up Informatica Developer Overview. . . . . . . . . . . . . . . . . . . . . . . . . . . . . . . . . . . . . . . . 66
Task 1. Start Informatica Developer. . . . . . . . . . . . . . . . . . . . . . . . . . . . . . . . . . . . . . . . . . . . . 67
Task 2. Add a Domain. . . . . . . . . . . . . . . . . . . . . . . . . . . . . . . . . . . . . . . . . . . . . . . . . . . . . . 67
Task 3. Add a Model Repository. . . . . . . . . . . . . . . . . . . . . . . . . . . . . . . . . . . . . . . . . . . . . . . 68
Task 4. Create a Project. . . . . . . . . . . . . . . . . . . . . . . . . . . . . . . . . . . . . . . . . . . . . . . . . . . . 68
Task 5. Create a Folder. . . . . . . . . . . . . . . . . . . . . . . . . . . . . . . . . . . . . . . . . . . . . . . . . . . . . 68
Task 6. Select a Default Data Integration Service. . . . . . . . . . . . . . . . . . . . . . . . . . . . . . . . . . . . 69
Setting Up Informatica Developer Summary. . . . . . . . . . . . . . . . . . . . . . . . . . . . . . . . . . . . . . . . 69
Chapter 15: Lesson 2. Importing Physical Data Objects. . . . . . . . . . . . . . . . . . . . . . . 70Importing Physical Data Objects Overview. . . . . . . . . . . . . . . . . . . . . . . . . . . . . . . . . . . . . . . . . 70
Task 1. Import the Boston_Customers Flat File Data Object. . . . . . . . . . . . . . . . . . . . . . . . . . . . . . 71
Task 2. Import the LA_Customers Flat File Data Object. . . . . . . . . . . . . . . . . . . . . . . . . . . . . . . . 71
Task 3. Importing the All_Customers Flat File Data Object. . . . . . . . . . . . . . . . . . . . . . . . . . . . . . . 72
Importing Physical Data Objects Summary. . . . . . . . . . . . . . . . . . . . . . . . . . . . . . . . . . . . . . . . . 73
Chapter 16: Lesson 3. Profiling Data. . . . . . . . . . . . . . . . . . . . . . . . . . . . . . . . . . . . . . 74Profiling Data Overview. . . . . . . . . . . . . . . . . . . . . . . . . . . . . . . . . . . . . . . . . . . . . . . . . . . . . 74
Task 1. Perform a Join Analysis on Two Data Sources. . . . . . . . . . . . . . . . . . . . . . . . . . . . . . . . . 75
Task 2. View Join Analysis Results. . . . . . . . . . . . . . . . . . . . . . . . . . . . . . . . . . . . . . . . . . . . . . 76
Task 3. Run a Profile on a Data Source. . . . . . . . . . . . . . . . . . . . . . . . . . . . . . . . . . . . . . . . . . . 76
Task 4. View Column Profiling Results. . . . . . . . . . . . . . . . . . . . . . . . . . . . . . . . . . . . . . . . . . . 76
Profiling Data Summary. . . . . . . . . . . . . . . . . . . . . . . . . . . . . . . . . . . . . . . . . . . . . . . . . . . . . 77
Index. . . . . . . . . . . . . . . . . . . . . . . . . . . . . . . . . . . . . . . . . . . . . . . . . . . . . . . . . . . . . . . 78
iv Table of Contents

PrefaceThe Informatica Data Quality Profiling Guide is is written for Informatica Analyst and Informatica Developer users.It contains information about how to perform data quality analysis and related tasks.
Informatica Resources
Informatica Customer PortalAs an Informatica customer, you can access the Informatica Customer Portal site at http://mysupport.informatica.com. The site contains product information, user group information, newsletters,access to the Informatica customer support case management system (ATLAS), the Informatica How-To Library,the Informatica Knowledge Base, the Informatica Multimedia Knowledge Base, Informatica ProductDocumentation, and access to the Informatica user community.
Informatica DocumentationThe Informatica Documentation team takes every effort to create accurate, usable documentation. If you havequestions, comments, or ideas about this documentation, contact the Informatica Documentation team throughemail at [email protected]. We will use your feedback to improve our documentation. Let usknow if we can contact you regarding your comments.
The Documentation team updates documentation as needed. To get the latest documentation for your product,navigate to Product Documentation from http://mysupport.informatica.com.
Informatica Web SiteYou can access the Informatica corporate web site at http://www.informatica.com. The site contains informationabout Informatica, its background, upcoming events, and sales offices. You will also find product and partnerinformation. The services area of the site includes important information about technical support, training andeducation, and implementation services.
Informatica How-To LibraryAs an Informatica customer, you can access the Informatica How-To Library at http://mysupport.informatica.com.The How-To Library is a collection of resources to help you learn more about Informatica products and features. Itincludes articles and interactive demonstrations that provide solutions to common problems, compare features andbehaviors, and guide you through performing specific real-world tasks.
v

Informatica Knowledge BaseAs an Informatica customer, you can access the Informatica Knowledge Base at http://mysupport.informatica.com.Use the Knowledge Base to search for documented solutions to known technical issues about Informaticaproducts. You can also find answers to frequently asked questions, technical white papers, and technical tips. Ifyou have questions, comments, or ideas about the Knowledge Base, contact the Informatica Knowledge Baseteam through email at [email protected].
Informatica Multimedia Knowledge BaseAs an Informatica customer, you can access the Informatica Multimedia Knowledge Base at http://mysupport.informatica.com. The Multimedia Knowledge Base is a collection of instructional multimedia filesthat help you learn about common concepts and guide you through performing specific tasks. If you havequestions, comments, or ideas about the Multimedia Knowledge Base, contact the Informatica Knowledge Baseteam through email at [email protected].
Informatica Global Customer SupportYou can contact a Customer Support Center by telephone or through the Online Support. Online Support requiresa user name and password. You can request a user name and password at http://mysupport.informatica.com.
Use the following telephone numbers to contact Informatica Global Customer Support:
North America / South America Europe / Middle East / Africa Asia / Australia
Toll FreeBrazil: 0800 891 0202Mexico: 001 888 209 8853North America: +1 877 463 2435 Standard RateNorth America: +1 650 653 6332
Toll FreeFrance: 00800 4632 4357Germany: 00800 4632 4357Israel: 00800 4632 4357Italy: 800 915 985Netherlands: 00800 4632 4357Portugal: 800 208 360Spain: 900 813 166Switzerland: 00800 4632 4357 or 0800 463200United Kingdom: 00800 4632 4357 or 0800023 4632 Standard RateBelgium: +31 30 6022 797France: 0805 804632Germany: 01805 702702Netherlands: 030 6022 797
Toll FreeAustralia: 1 800 151 830New Zealand: 1 800 151 830Singapore: 001 800 4632 4357 Standard RateIndia: +91 80 4112 5738
vi Preface

Part I: Overview of ProfilingThis part contains the following chapters:
¨ Profiling Methods, 2
¨ Profiles and Rules, 9
¨ Export and Import Profiles, 19
¨ Scorecards, 22
¨ Reference Data, 30
1

C H A P T E R 1
Profiling MethodsThis chapter includes the following topics:
¨ Profiling Overview, 2
¨ Column Profiling, 2
¨ Join Analysis, 7
¨ Profiling a Mapplet or Mapping Object, 8
Profiling OverviewA profile is an analysis of the content and structure of data. Create and run a profile to identify data quality issuesin data. Use profiles to create scorecards and to create and update reference data tables.
Data profiling is often the first step in a project. You can run a profile to evaluate the structure of data and verifythat data columns contain the information you expect. If a profile reveals problems in data, you can define steps inyour project to fix those problems.
You can perform profiling tasks in the Developer tool and Analyst tool, and you can save profile objects to theModel repository from both tools. Use the Analyst tool to profile columns in a data object. Use the Developer toolto profile columns and to validate the joins between columns.
In the Analyst tool, use the Navigator to find column profiles. In the Developer tool, use the Object Explorer tofind column profiles and join analyses.
You can also apply rules to a profile. A rule is business logic that defines conditions applied to the data when yourun a profile.
Column ProfilingYou can perform column profiling on a data object and on an object in a mapping.
Column profiling provides the following facts about data:
¨ The number of unique and null values in each column, expressed as a number and a percentage.
¨ The patterns of data in each column, and the frequencies with which these values occur.
¨ Statistics about the column values, such as the maximum and minimum lengths of values and the first and lastvalues in each column.
2

Profile OptionsYou can create quick and custom profiles for a data object. You configure the profile columns, sampling, anddrilldown options when you create a profile.
Use a quick profile to include all columns for a data object and use the default profile options. Use a custom profileto select the columns for a data object and to configure the profile results, sampling, and drilldown options.
Profile Results OptionThe following table describes the profile results option for a profile:
Option Description
Discard profiling results for columns and rules notselected for re-profiling
The Analyst tool discards the profile results for previouslyprofiled columns from the profiling warehouse and displaysresults for the columns and rules selected for the latest profilerun. Do not select this option if you want the Analyst tool todisplay profile results for previously profiled columns.
Sampling OptionsThe following table describes the sampling options for a profile:
Option Description
All Rows The Analyst tool profiles all rows in the data object. This is thedefault option for a quick profile.
First <number> Rows Number of rows that the Analyst tool profiles. The Analyst toolchooses the rows from the first rows in the table or file.
Random Sample <number> Rows Number of rows to randomly sample in the table or file.Random sampling forces the drill down to be performed onstaged data stored in the profiling warehouse that can slowdrill down performance.
Random sample The Analyst tool chooses the sample size, based on thenumber of rows in the data object. Random sampling forcesthe drill down to be performed on staged data stored in theprofiling warehouse that can slow drill down performance.
Drilldown OptionsThe following table describes the drilldown options for a profile:
Options Description
Enable Row Drilldown Drill down to row data in the profile results.
Select Columns Click Select Columns to identify columns for drilldown thatyou did not select for profiling.
Column Profiling 3
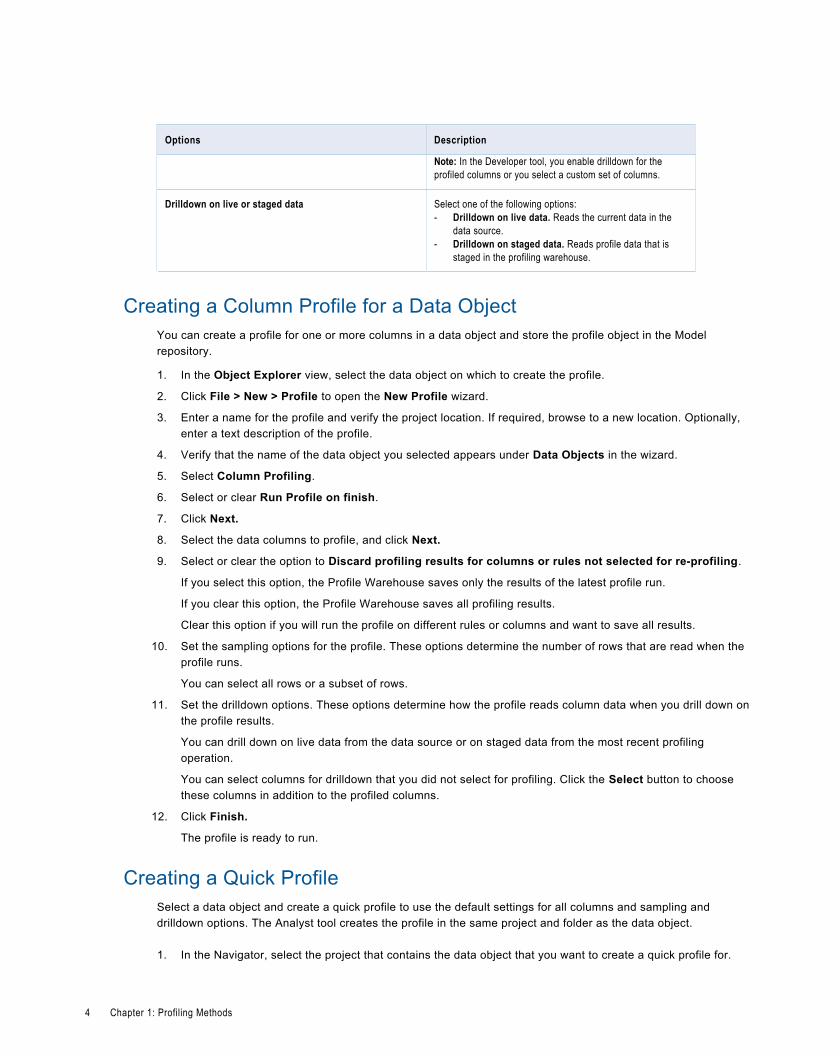
Options Description
Note: In the Developer tool, you enable drilldown for theprofiled columns or you select a custom set of columns.
Drilldown on live or staged data Select one of the following options:- Drilldown on live data. Reads the current data in the
data source.- Drilldown on staged data. Reads profile data that is
staged in the profiling warehouse.
Creating a Column Profile for a Data ObjectYou can create a profile for one or more columns in a data object and store the profile object in the Modelrepository.
1. In the Object Explorer view, select the data object on which to create the profile.
2. Click File > New > Profile to open the New Profile wizard.
3. Enter a name for the profile and verify the project location. If required, browse to a new location. Optionally,enter a text description of the profile.
4. Verify that the name of the data object you selected appears under Data Objects in the wizard.
5. Select Column Profiling.
6. Select or clear Run Profile on finish.
7. Click Next.
8. Select the data columns to profile, and click Next.
9. Select or clear the option to Discard profiling results for columns or rules not selected for re-profiling.
If you select this option, the Profile Warehouse saves only the results of the latest profile run.
If you clear this option, the Profile Warehouse saves all profiling results.
Clear this option if you will run the profile on different rules or columns and want to save all results.
10. Set the sampling options for the profile. These options determine the number of rows that are read when theprofile runs.
You can select all rows or a subset of rows.
11. Set the drilldown options. These options determine how the profile reads column data when you drill down onthe profile results.
You can drill down on live data from the data source or on staged data from the most recent profilingoperation.
You can select columns for drilldown that you did not select for profiling. Click the Select button to choosethese columns in addition to the profiled columns.
12. Click Finish.
The profile is ready to run.
Creating a Quick ProfileSelect a data object and create a quick profile to use the default settings for all columns and sampling anddrilldown options. The Analyst tool creates the profile in the same project and folder as the data object.
1. In the Navigator, select the project that contains the data object that you want to create a quick profile for.
4 Chapter 1: Profiling Methods

2. In the Contents panel, select the data object.
Do not click the link for the object.
3. Click Actions > New Profile.
The New Profile wizard appears.
4. Select Quick Profile.
5. Click Next.
6. Click Save to create the profile or click Save & Run to create the profile and then run the profile.
Creating a Custom ProfileSelect a data object and create a custom profile to configure the columns and sampling and drilldown options. TheAnalyst tool creates the profile in the same project and folder as the data object.
1. In the Navigator, select the project that contains the data object that you want to create a custom profile for.
2. In the Contents panel, select the data object.
Do not click the link for the object.
3. Click Actions > New Profile.
The New Profile wizard appears.
4. Select Custom Profile.
5. Click Next.
6. Enter a name and an optional description for the profile.
7. In the Folders panel, select the project or folder where you want to create the profile.
The Analyst tool displays the project that you selected and shared projects that contain folders where you cancreate the profile. The profile objects in the folder appear in the Profiles panel.
8. Click Next.
9. In the Columns panel, select the columns you want to profile. The columns include any rules you applied tothe profile. The Analyst tool lists the name, datatype, precision, and scale for each column.
Optionally, select Name to select all columns.
10. Accept the default option in the Profile Results Options panel.
The first time you run the profile, the Analyst tool displays profile results for all columns selected for profiling.
11. In the Sampling Options panel, configure the sampling options.
12. In the Drilldown Options panel, configure the drilldown options.
Optionally, click Select Columns to select columns to drill down on. In the Drilldown Columns window,select the columns for drill down and click OK.
13. Click Save to create the profile or click Save & Run to create the profile and then run the profile.
Running a ProfileRun a profile to analyze a data source for content and structure and select columns and rules for drill down. Youcan drill down on live or staged data for columns and rules. You can profile a column or rule without profiling allthe source columns again after running the profile.
1. In the Navigator, select the project or folder that contains the profile you want to run.
2. Click the profile to open it.
Column Profiling 5

The profile appears in a tab.
3. Click Actions > Run Profile.
The Column Profile window appears.
4. In the Columns panel, select the columns you want to profile. The columns include rules you applied to theprofile.
Optionally, select Name to select all columns. The Analyst tool lists the name, datatype, precision, and scalefor each column.
5. Optionally, in the Profile Results Options panel, select the option to discard profile results for previouslyprofiled columns and rules.
The first time you run a profile, the Analyst tool displays profile results for all columns selected for profiling.
6. In the Sampling Options panel, configure the sampling options.
7. In the Drilldown Options panel, configure the drilldown options.
8. Optionally, click Select Columns to select columns to drill down on. In the Drilldown Columns window,select the columns for drill down.
9. Click OK.
10. Click Run.
The Analyst tool displays the profile results.
Viewing Profile ResultsView profile results to see a summary of the columns and rules in the profile and the values, patterns, andstatistics for columns and rules. You can view the rows from the data source that represent a specific value orpattern in the profile results.
1. In the Navigator, select the project or folder that contains the profile.
2. Click the profile to open it.
The profile appears in a tab.
3. In the Summary view, select a column name to view the profile results for the column.
The values, patterns, and statistics for the column appear in the Results panel. Optionally, you can sort onthe Values and Patterns for the column.
4. Select a column value on the Values tab or select a column pattern on the Patterns tab. Use CONTROL andSHIFT keys to select multiple values.
Optionally, on the Values tab, sort on the Value and Frequency. Optionally, on the Patterns tab, sort on thePattern and Frequency.
5. Click Actions > Show Matching Rows to view the rows of data.
The Drilldown panel displays the rows that contain the values or patterns. The column value or patternappears at the top of the panel.
Note: You can chose to drill down on live data or staged data.
6 Chapter 1: Profiling Methods

Join AnalysisYou can perform join analysis on a data object in the Developer tool.
Join analysis describes the degree of overlap between two data columns. It displays results as a Venn diagramand as a percentage value. Use join analysis profiles to validate or identify problems in column join conditions.
Creating a Profile for Join AnalysisYou can analyze potential joins on columns in two data objects and store the analysis in the Model repository.
1. Click File > New > Profile to open the New Profile wizard.
2. Enter a name for the profile and verify the project location. If required, browse to a new location. Optionally,enter a text description of the profile.
3. Click Add.
The Data Objects dialog box opens.
4. Browse the repository and select a data object for join analysis.
Click OK.
5. Click Add to open the Data Objects dialog box and select additional data objects.
Click OK.
6. Verify that the names of the data objects appear under Data Objects in the wizard.
7. Select Join Analysis.
8. Select or clear Run Profile on finish.
9. Click Next.
10. Select the data columns to include in the profile results, and click Next.
If required, scroll down the data objects to view all available columns.
11. Click Add. The Join Condition dialog box opens.
12. Click the New button to activate the column selection fields.
13. Select the data objects and columns to validate.
14. Verify that the Left and Right join columns are prefixed with the correct data object names.
15. Click Finish.
Join Analysis ResultsThe join analysis Results tab provides information about the number and percentage of parent orphan rows, childorphan rows, and join rows. Join analysis results also include Venn diagrams that show the relationships betweencolumns.
The following table describes the properties shown on the Results tab.
Property Description
Left Table Name of the left table and columns used in the join analysis
Right Table Name of the right table and columns used in the join analysis
Parent Orphan Rows Number of rows in the left table that cannot be joined.
Join Analysis 7

Property Description
Child Orphan Rows Number of rows in the right table that cannot be joined.
Join Rows Number of rows included in the join.
Select a join condition to view a Venn diagram that shows the relationships between columns. The area below theVenn diagram also displays the number and percentage of orphaned, null, and joined values in columns.
Double-click a section in the Venn diagram to view the records that the section represents. These records open inthe Data Viewer view. You can export the list of records from the Data Viewer view to a flat file.
Profiling a Mapplet or Mapping ObjectRun a profile on a mapplet or mapping object when you want to verify the design of the mapping or mapplet andyou do not need to save the profile results.
This profiling operation runs on all data columns and enables drill-down operations on data that has been stagedfor the data object.
1. Open a mapplet or mapping.
2. Verify that the mapplet or mapping is valid.
3. Right-click a data object or transformation and select Profile Now.
The profile results appear on the Results tab of the profile.
The profile traces the source data through the mapping to the output ports of the object you selected. It analyzesthe data that would appear on those ports if you ran the mapping.
8 Chapter 1: Profiling Methods

C H A P T E R 2
Profiles and RulesThis chapter includes the following topics:
¨ Configure Profiles and Rules, 9
¨ Rule Types, 10
¨ Adding a Rule to Profile, 13
¨ Profile Results, 13
¨ Viewing and Adding Profile Comments, 17
¨ Previewing a Table or File , 17
¨ Wide Tables and Files, 18
¨ Rules and Guidelines for Profiles, 18
Configure Profiles and RulesWhen you create a profile, you select the columns in the data object for which you want to profile data. You canset or configure sampling and drilldown options for faster profiling. After you run the profile, you can examine theprofiling statistics to understand the data. You can add a rule to the profile to cleanse, modify, or validate the data.Run the profile again to view the data.
The following steps describe how to configure a profile and add rules to perform data quality analysis on the data:
1. Create a profile. Use the New Profile window to create a profile by selecting the columns in the data objectthat you want to profile data for. You can create a profile in a project, create a custom profile, or a quickprofile.
2. Save and run the profile.
3. View the profile results and examine the profiling statistics to understand the data. You can determine if thedata has unique values, data patterns, minimum and maximum values, and look for rows that match selectedpatterns or values.
4. After you examine the data, you can determine which rule to add to the profile. For example, you can add arule because you want a cleansed version of one or more of the data object columns. You can add a lookuprule that provides information that the source data does not provide. You can add a rule to validate thecorrectness of a cleansing rule that you intend to use in a data quality or data integration project.
5. Add the rule to the profile. You can select a predefined rule, or create an expression rule.
6. Save and run the profile.
7. View the profile results.
9

Rule TypesYou can add rules after you create a profile. You can add predefined rules to a profile or create expression rules toadd to a profile. After you create an expression rule, you can make it reusable.
Add rules to a profile by selecting a predefined rule or create an expression rule.
You can create or apply the following rule types for a profile:
¨ Expression rules. Use expression functions and columns to define rule logic. Create expression rules in theAnalyst tool.
¨ Predefined rules. Includes system-defined, user-defined, and reusable rules. System-defined rules arepackaged with the content installer for the Developer tool and can appear as reusable rules in the Analyst tool.Rules that are created in the Developer tool as mapplets can appear in the Analyst tool as user-defined rules.An analyst can create an expression rule and promote it to a reusable rule that other analysts can use inmultiple profiles.
After you add a rule to a profile, you can choose to run the profile again for the rule column. The Analyst tooldisplays profile results for the rule column. You can modify the rule and run the profile again to view changes tothe profile results.
The output of a rule can be one or more virtual columns. The virtual columns exist only in the profile results. TheAnalyst tool profiles the virtual columns. For example, you use a predefined rule that splits a column that containsfirst and last names into FIRST_NAME and LAST_NAME virtual columns. The Analyst tool profiles theFIRST_NAME and LAST_NAME columns.
Note: If you delete a rule object that other object types reference, the Analyst tool displays a message that liststhe object types being referenced. Determine the impact of deleting the rule before you choose to delete it.
Predefined RulesPredefined rules are rules created in the Developer tool or provided with the Developer tool and the Analyst tool.Apply predefined rules to the Analyst tool profiles to modify or validate source data.
Predefined rules use transformations to define rule logic. You can use predefined rules with multiple profiles. Inthe Model repository, a predefined rule is a mapplet with an input group, an output group, and transformations thatdefine the rule logic.
You can apply the following types of predefined rules:
¨ System-defined. Packaged with the content installer for the Developer tool and can appear as reusable rulesin the Analyst tool.
¨ User-defined. Created in the Developer tool as a mapplet and validated as a rule. Can appear as reusablerules in the Analyst tool.
Use the New Rule wizard to apply a predefined rule to a profile. You must open a profile before you apply apredefined rule. When you apply a predefined rule, you configure the name and description for the rule andconfigure the columns in the profile or reference tables as parameters for the rule. You can then include the rule inprofile results and configure sampling and drilldown options.
Applying a Predefined RuleUse the New Rule Wizard to apply a predefined rule to a profile. When you apply a predefined rule, you select therule and configure the input and output columns for the rule. Apply a predefined rule to use a rule promoted as areusable rule or use a rule created by a developer.
1. In the Navigator, select the project or folder that contains the profile that you want to add the rule to.
10 Chapter 2: Profiles and Rules

2. Click the profile to open it.
The profile appears in a tab.
3. Click Actions > Add Rule.
The New Rule window appears.
4. Select the option to Apply a Rule.
5. Click Next.
6. In the Rules panel, select the rule that you want to apply.
The name, datatype, descripton, and precision columns appear for the Inputs and Outputs columns in theRules Parameters panel.
7. Click Next.
8. In the Inputs section, select an input column. The input column is a column name in the profile.
9. Optionally, in the Outputs section, configure the label of the output columns.
10. Click Next.
11. In the Columns panel, select the columns you want to profile. The columns include any rules you applied tothe profile. Optionally, select Name to include all columns.
The Analyst tool lists the name, datatype, precision, and scale for each column.
12. In the Sampling Options panel, configure the sampling options.
13. In the Drilldown Options panel, configure the drilldown options.
14. Click Save to apply the rule or click Save & Run to apply the rule and then run the profile.
Expression RulesExpression rules use expression functions and columns to define rule logic. Create expression rules and add themto a profile in the Analyst tool.
Use expression rules to modify or validate values for columns in a profile. You can create one or more expressionrules to use in a profile.
Expression functions are SQL-like functions used to transform source data. The Analyst tool provides the followingtypes of functions that you can use to create expression rule logic:
¨ Character
¨ Conversion
¨ Data Cleansing
¨ Date
¨ Encoding
¨ Financial
¨ Numerical
¨ Scientific
¨ Special
¨ Test
Use the New Rule Wizard to create an expression rule and add it to a profile. You must open a profile before youcreate an expression rule. When you create an expression rule, you configure the name and description for therule and configure the rule logic using expression functions and columns as parameters. You can then include therule in profile results and configure sampling options.
Rule Types 11

The New Rule Wizard includes an expression editor. Use the expression editor to add expression functions,configure columns as input to the functions, validate the expression, and configure the return type, precision, andscale.
The output of an expression rule is a virtual column that uses the name of the rule as the column name. TheAnalyst tool profiles the virtual column. For example, you use an expression rule to validate a ZIP code. The rulereturns 1 if the ZIP code is valid and 0 if the ZIP code is invalid. Informatica Analyst profiles the 1 and 0 outputvalues of the rule.
Creating an Expression RuleUse the New Rule Wizard to create an expression rule and add it to a profile. Create an expression rule to modifyor validate values for columns in a profile.
1. In the Navigator, select the project or folder that contains the profile that you want to add the rule to.
2. In the Contents panel, click the profile to open it.
The profile appears in a tab.
3. Click Actions > Add Rule.
The New Rule window appears.
4. Select Create a rule.
5. Click Next.
6. Enter a name and optional description for the rule.
7. Optionally, choose to promote the rule as a reusable rule and configure the project and folder location.
If you promote a rule to a reusable rule, you or other users can use the rule in another profile as a predefinedrule.
8. In the Functions tab, select a function and click the right arrow to enter the parameters for the function.
9. In the Columns tab, select an input column and click the right arrow to add the expression in the Expressioneditor. You can also add logical operators to the expression.
10. Click Validate. You can proceed to the next step if the expression is valid.
11. Optionally, click Edit to configure the return type, precision, and scale.
12. Click Next.
13. In the Columns panel, select the columns you want to profile. The columns include any rules you applied tothe profile. Optionally, select Name to select all columns.
The Analyst tool lists the name, datatype, precision, and scale for each column.
14. In the Sampling Options panel, configure the sampling options.
15. In the Drilldown Options panel, configure the drilldown options.
16. Click Save to create the rule or click Save & Run to create the rule and then run the profile.
Mapplets and RulesA rule is business logic that defines conditions applied to source data when you run a profile. It is a midstreammapplet that you use in a profile.
A rule must meet the following requirements:
¨ It must contain an Input and Output transformation. You cannot use data sources in a rule.
12 Chapter 2: Profiles and Rules

¨ It can contain Expression transformations, Lookup transformations, and passive data quality transformations. Itcannot contain any other type of transformation. For example, a rule cannot contain a Match transformation, asit is an active transformation.
¨ It does not specify cardinality between input groups.
Note: Rule functionality is not limited to profiling. You can add any mapplet that you validate as a rule to a profilein the Analyst tool. For example, you can evaluate postal address data quality by selecting a rule configured tovalidate postal addresses and adding it to a profile.
Validating a MappletValidate a mapplet before you add it to a mapping. You can also validate a mapplet as a rule to include it in aprofile.
1. Right-click the mapplet canvas.
2. Select Validate As > Mapplet or Validate As > Rule.
The Validation Log displays mapplet error messages.
Adding a Rule to ProfileYou can add a rule to a saved profile. You cannot add a rule to a profile configured for join analysis.
Complete these steps to add a rule to a profile:
1. Browse the Object Explorer and find the profile you need.
2. Right-click the profile and select Open.
The profile opens in the editor.
3. Click the Rules tab.
4. Click Add.
The Apply Rule dialog box opens.
5. Click Browse to find the rule you want to apply.
You can select rules from the current project.
6. Click the Value column under Input Values to select an input port for the rule.
7. Click the Value column under Output Values to edit the name of the rule output port.
The rule appears in the Rules tab.
8. Save the profile.
Profile ResultsView profile results to understand the structure of the data and analyze data quality. You can view the profileresults after you run a profile. You can view a summary of the columns and rules in the profile and the values,patterns, and statistics for columns and rules. You can view properties for the profile and properties for thecolumns and rules in the profile. You can preview profile data.
Adding a Rule to Profile 13
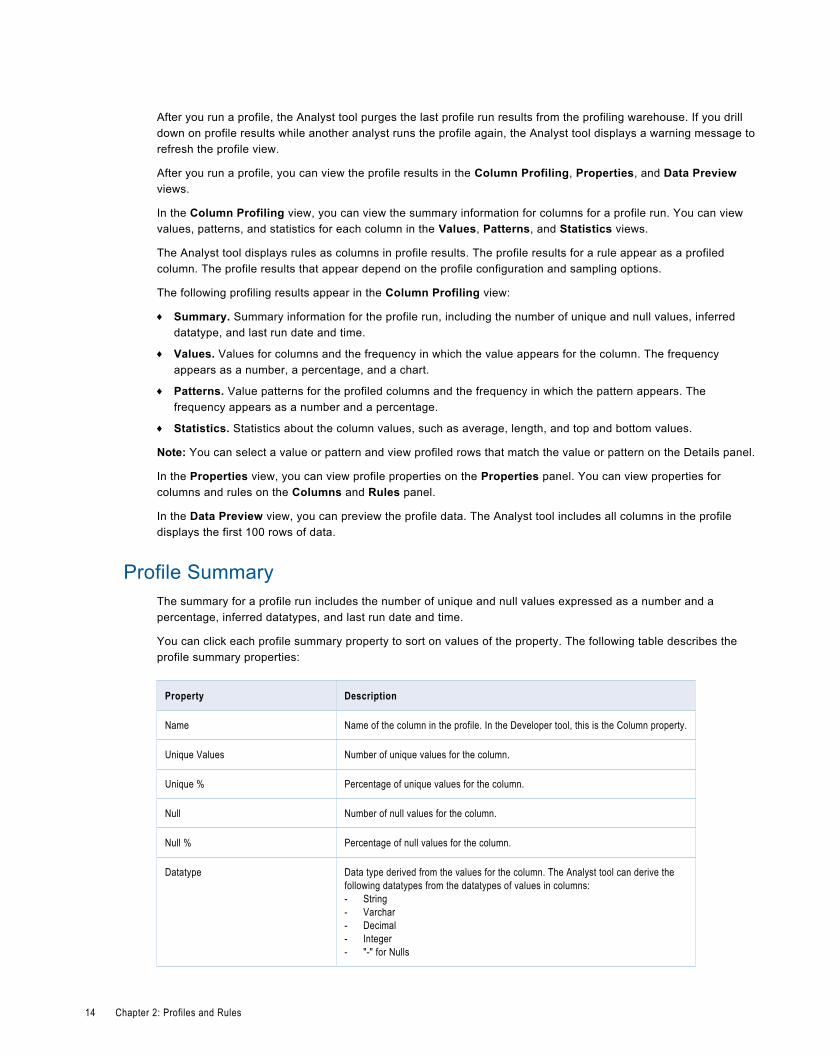
After you run a profile, the Analyst tool purges the last profile run results from the profiling warehouse. If you drilldown on profile results while another analyst runs the profile again, the Analyst tool displays a warning message torefresh the profile view.
After you run a profile, you can view the profile results in the Column Profiling, Properties, and Data Previewviews.
In the Column Profiling view, you can view the summary information for columns for a profile run. You can viewvalues, patterns, and statistics for each column in the Values, Patterns, and Statistics views.
The Analyst tool displays rules as columns in profile results. The profile results for a rule appear as a profiledcolumn. The profile results that appear depend on the profile configuration and sampling options.
The following profiling results appear in the Column Profiling view:
¨ Summary. Summary information for the profile run, including the number of unique and null values, inferreddatatype, and last run date and time.
¨ Values. Values for columns and the frequency in which the value appears for the column. The frequencyappears as a number, a percentage, and a chart.
¨ Patterns. Value patterns for the profiled columns and the frequency in which the pattern appears. Thefrequency appears as a number and a percentage.
¨ Statistics. Statistics about the column values, such as average, length, and top and bottom values.
Note: You can select a value or pattern and view profiled rows that match the value or pattern on the Details panel.
In the Properties view, you can view profile properties on the Properties panel. You can view properties forcolumns and rules on the Columns and Rules panel.
In the Data Preview view, you can preview the profile data. The Analyst tool includes all columns in the profiledisplays the first 100 rows of data.
Profile SummaryThe summary for a profile run includes the number of unique and null values expressed as a number and apercentage, inferred datatypes, and last run date and time.
You can click each profile summary property to sort on values of the property. The following table describes theprofile summary properties:
Property Description
Name Name of the column in the profile. In the Developer tool, this is the Column property.
Unique Values Number of unique values for the column.
Unique % Percentage of unique values for the column.
Null Number of null values for the column.
Null % Percentage of null values for the column.
Datatype Data type derived from the values for the column. The Analyst tool can derive thefollowing datatypes from the datatypes of values in columns:- String- Varchar- Decimal- Integer- "-" for Nulls
14 Chapter 2: Profiles and Rules

Property Description
Inferred % Percentage of values that match the data type inferred by the Analyst tool. Notdisplayed in the Developer tool.
Documented Datatype Data type declared for the column in the profiled object.
Max Value Maximum value in the column.
Min Value Minimum value in the column.
Last Profiled Date and time you last ran the profile.
Drilldown If selected, enables drilldown on live data for the column.
Column ValuesThe column values include values for columns and the frequency in which the value appears for the column.
The following table describes the properties for the column values:
Property Description
Value List of all values for the column in the profile.
Frequency Number of times a value appears for a column, expressed as a number, a percentage, and a chart.
Percent Percentage that a value appears for a column.
Chart Chart for the percentage.
Note: You can sort the Value and Frequency columns by selecting the columns. When you sort the results of theFrequency column, the Analyst tool sorts the results based on the datatype of the column.
Column PatternsThe column patterns include the value patterns for the columns and the frequency in which the pattern appears.
The profiling warehouse stores 16,000 unique highest frequency values including NULL values for profile resultsby default. If there is at least one NULL value in the profile results, the Analyst tool can display NULL values aspatterns.
The following table describes the properties for the column patterns:
Property Description
Pattern Pattern for the column in the profile.
Frequency Number of times a pattern appears for a column, expressed as a number.
Percent Percentage that a pattern appears for a column.
Chart Chart for the percentage.
Profile Results 15

Column StatisticsThe column statistics include statistics about the column values, such as average, length, and top and bottomvalues.
For a string column, the Analyst tool displays the Maximum Length, Minimum Length, Bottom, and Top statisctics.
For an integer column, the Analyst tool displays the Average, Standard Deviation, Maximum Length, MinimumLength, Bottom, and Top statistics.
The following table describes the types of column statistics:
Statistic Description
Average Average of the values for the column.
Standard Deviation The standard deviation, or variability between column values, for all values of the column.
Maximum Length Length of the longest value for the column.
Minimum Length Length of the shortest value for the column.
Bottom Lowest values for the column.
Top Highest values for the column.
Viewing Profile ResultsView profile results to see a summary of the columns and rules in the profile and the values, patterns, andstatistics for columns and rules. You can view the rows from the data source that represent a specific value orpattern in the profile results.
1. In the Navigator, select the project or folder that contains the profile.
2. Click the profile to open it.
The profile appears in a tab.
3. In the Summary view, select a column name to view the profile results for the column.
The values, patterns, and statistics for the column appear in the Results panel. Optionally, you can sort onthe Values and Patterns for the column.
4. Select a column value on the Values tab or select a column pattern on the Patterns tab. Use CONTROL andSHIFT keys to select multiple values.
Optionally, on the Values tab, sort on the Value and Frequency. Optionally, on the Patterns tab, sort on thePattern and Frequency.
5. Click Actions > Show Matching Rows to view the rows of data.
The Drilldown panel displays the rows that contain the values or patterns. The column value or patternappears at the top of the panel.
Note: You can chose to drill down on live data or staged data.
Exporting Profile ResultsYou can export the results of a profile to a CSV file to view the data in a file. For each column in the profile, youcan select the type of data to export. You can select value frequencies, pattern frequencies, or drilldown data forselected values and patterns.
16 Chapter 2: Profiles and Rules

1. In the Navigator, select the project or folder that contains the profile.
2. Click the profile to open it.
The profile opens in a tab.
3. In the Column Profiling view, select the column that you want to export.
4. Click Actions > Export Data.
The Export Data to a file window appears.
5. Enter the file name. Optionally, use the default file name.
6. Select the type of data to export.
You can select one of the following data options to export:
¨ Value frequencies for the selected column.
¨ Pattern frequencies for the selected column.
¨ Drilldown data for the selected values or pattern.
7. Enter a file format. Default format is CSV.
8. Select the code page of the file.
9. Click OK.
Viewing and Adding Profile CommentsYou can view and add comments to any profile object. Use comments to share information about profiles withother Analyst tool users.
1. In the Navigator, select the project and folder that contains the profile.
2. Click the profile to open it.
The profile appears in a tab.
3. Click Actions > Show Comments.
The Comments panel appears. All comments appear in descending order by date.
4. To add a comment, enter the text for the comment in the comment box and click Add.
The comment appears in the Comments panel.
5. Optionally, click Actions > Hide Comments to hide all comments.
Previewing a Table or FileYou can preview the rows for the table or file for a profile. You can preview the rows before or after you run theprofile. You can preview the first 100 rows.
1. In the Navigator, select the project or folder that contains the profile that you preview rows for or create aprofile.
2. Click the profile to open it.
The profile appears in a tab.
Viewing and Adding Profile Comments 17

3. Click the Data Preview view.
The rows for the data source appear in the panel.
4. Click Refresh to refresh the data.
Wide Tables and FilesYou can profile wide tables and flat files that have a large number of columns. You can profile tables with morethan 30 columns and flat files with more than 100 columns.
When you create or run a profile, you can choose to select all the columns or select each column you want toinclude for profiling. The Analyst tool displays the first 30 columns in the data preview. You can select all columnsfor drilldown and view value frequencies for these columns. You can use rules that have more than 50 outputfields and include the rule columns for profiling when you run the profile again.
Rules and Guidelines for ProfilesRules and Guidelines for working with profiles.
Use the following rules and guidelines when you work with profiles:
¨ Exporting Profile Results. The Analyst tool displays only the first 200 values for value frequencies, patternfrequencies, and drilldown data for the selected value or column. When you export the profile results, theAnalyst tool exports all values to the CSV file.
¨ Exporting Column Patterns. When you export inferred column patterns in the profile results, the Analyst toolexports a different format of the column pattern to the CSV file. For example, when you export the inferredcolumn pattern X(5), the Analyst tool displays the following format of the column pattern in the CSV file: XXXXX
¨ Inferred Datatypes. The Analyst tool cannot derive the datatype from the values of a numeric column that hasa precision greater than 38. The Analyst tool cannot derive the datatype from the values of a string column thathas a precision greater than 255.
¨ Column Patterns. The Analyst tool cannot derive the pattern for a numeric column that has a precision greaterthan 38. The Analyst tool cannot derive the pattern for a string column that has a precision greater than 255.
¨ Dataypes not included in profiling. The Analyst tool excludes the CLOB, BLOB, Raw, and Binary datatypesin column values in a profile.
¨ Column names. You cannot add a column with the same name to an existing profile. You cannot add thesame column twice to a profile even if you change the column name.
¨ Profiling multilingual data. You can profile multilingual data from different sources and view profile resultsbased on the locale settings in the browser. The Analyst tool changes the Datetime, Numeric, and Decimaldatatypes based on the browser locale.
¨ Profiling Unicode data on DB2 databases. To profile Unicode data in a DB2 database, set theDB2CODEPAGE database enviroment variable in the database and restart the Data Integration Service.
¨ Sorting on multilingual data. You can sort on multilingual data. The Anayst tool displays the sort order basedon the browser locale.
18 Chapter 2: Profiles and Rules

C H A P T E R 3
Export and Import ProfilesThis chapter includes the following topics:
¨ Object Import and Export Overview, 19
¨ The Import/Export XML File, 20
¨ Exporting Objects, 20
¨ Importing Objects, 21
Object Import and Export OverviewYou can export objects to an XML file and then import objects from the XML file. When you export objects, theDeveloper tool creates an XML file that contains the metadata of the exported objects. Use this file to import theobjects into a project or folder. You can also import application archives into a repository.
Export and import objects to accomplish the following tasks:
¨ Deploy metadata into production. After you test a mapping in a development repository, you can export it to anXML file and then import it from the XML file into a production repository.
¨ Archive metadata. You can export objects to an XML file that you no longer need before you remove them fromthe repository.
¨ Share metadata. You can share metadata with a third party. For example, you can send a mapping to someoneelse for testing or analysis.
¨ Copy metadata between repositories. You can copy objects between repositories that you cannot connect tofrom the same client. Export the object and transfer the XML file to the target machine. Then import the objectfrom the XML file into the target repository.
You can choose the objects to export. The Developer tool exports the objects and the dependent objects. TheDeveloper tool exports the last saved version of the object.
You can export multiple objects from a project to one XML file. When you import objects, you import all objects inthe XML file.
You can export and import the following objects:
¨ Projects
¨ Folders
¨ Applications
¨ Reference tables
¨ Physical data objects
19

¨ Logical data object models
¨ Reusable transformations
¨ Mapplets
¨ Mappings
¨ SQL data services
¨ Profiles
¨ Scorecards
You can also import application archive files into a repository. Application archive files contain deployedapplications.
You cannot export empty projects or empty folders.
The Import/Export XML FileWhen you export objects, the Developer tool creates an XML file that contains the metadata of the objects.
The Developer tool includes Cyclic Redundancy Checking Value (CRCVALUE) codes in the elements in the XMLfile. If you modify attributes in an element that contains a CRCVALUE code, you cannot import the object.Therefore, do not modify any exported object in the XML file.
Exporting ObjectsYou can export objects to an XML file to use in another project or folder.
1. Click File > Export.
The Export wizard appears.
2. Select Informatica > Object Export File.
3. Click Next.
4. Click Browse to select a project from which to export objects.
If you are exporting reference table data, complete the following fields:
Option Description
Reference data location Location where you want to save reference table data. Enter a path that the Data IntegrationService can write to. The Developer tool saves the reference table data as one or moredictionary .dic files.
Data service Data Integration Service on which the reference table staging database runs.
Code page Code page of the destination repository for the reference table data.
5. Click Next.
6. Select the objects to export.
7. Enter the export file name and location.
20 Chapter 3: Export and Import Profiles

8. To view the dependent objects that the Export wizard exports with the objects you selected, click Next.
The Export wizard displays the dependent objects.
9. Click Finish.
The Developer tool exports the objects to the XML file.
Importing ObjectsYou can import objects from a Developer tool XML file or application archive file. You import the objects and anydependent objects into a project or folder.
1. Click File > Import.
The Import wizard appears.
2. Select Informatica > Object Import File.
3. Click Next.
4. Click Browse to select the export file that you want to import.
5. Select the project from which to import objects.
6. Click Browse to select the target project or folder.
7. Specify how to handle duplicate objects. You can either replace existing objects with the imported objects orrename the imported objects.
8. To view all of the objects the Import wizard imports from the file, click Next.
9. Click Finish.
If you choose to rename duplicate objects, the Import wizard names the imported objects "CopyOf_<OriginalName>." You can rename the objects after you import them.
Importing Objects 21

C H A P T E R 4
ScorecardsThis chapter includes the following topics:
¨ Scorecards Overview, 22
¨ Creating a Scorecard, 23
¨ Adding Columns to a Scorecard, 24
¨ Running a Scorecard, 24
¨ Viewing a Scorecard, 25
¨ Viewing Column Data in a Scorecard, 25
¨ Editing a Scorecard, 26
¨ Creating a Group, 27
¨ Editing a Group, 27
¨ Deleting a Group, 28
¨ Viewing Trend Charts, 28
¨ Rules and Guidelines for Scorecards, 29
Scorecards OverviewA scorecard is the graphical representation of valid values for a column or the output of a rule in profile results.Use scorecards to measure data quality progress. You can create a scorecard from a profile and monitor theprogress of data quality over time.
Scorecards display the value frequency for columns in a profile as scores. Scores reflect the percentage of validvalues for a column.
For example, you can create a scorecard to measure data quality before you apply data quality rules. After youapply data quality rules, you can create another scorecard to compare the effect of the rules on data quality. Youcan monitor the progress of performing data quality on the data by setting up the scorecard to run daily. You canview the score trend chart to see how a particular score improves over time.
After you run a profile, you can add columns from the profile to a scorecard. You can add columns from multipleprofiles to a scorecard. Select the valid values for the column and run the scorecard to see the scores for thecolumns in a chart.
When you view a scorecard in the Contents view, the Analyst tool opens the scorecard in another tab. After yourun the scorecard, you can view the scores on the Scorecard view. You can select the data object and navigate tothe data object from a score within a scorecard. The Analyst tool opens the data object in another tab.
22

You can complete the following tasks with scorecards:
¨ Add columns to a scorecard. Use the Add to Scorecard Wizard to add columns from a profile to a scorecardand configure the valid values for the columns. You can add columns to an existing scorecard or you can addcolumns to a new scorecard.
¨ Run a scorecard. Run a scorecard to generate scores for columns.
¨ View a scorecard. View a scorecard to see the scores for the columns.
¨ Drill down on columns. Drilldown on the the columns for a score to select columns that appear when you viewthe valid or invalid data rows.
¨ Edit a scorecard. Edit valid values for columns in a scorecard and group related scores within a scorecard toview a set of scores for a particular business concept. You must run a scorecard before you can edit it.
¨ Define thresholds. Define thresholds that specify the ranges of bad data for that are acceptable for eachcolumn in a record.
¨ Create a group. Create a group to add related scores in a scorecard to the group.
¨ Edit a group. Edit a group to change the name and description of the group.
¨ Delete a group. Delete a group if the group is no longer valid. Before deleting the group, you can choose tomove the scores in the group to the default group.
¨ Move scores to a group. Move scores to a group within a scorecard.
¨ View trend charts. View trend charts to determine data quality progress over time.
Creating a ScorecardCreate a scorecard and add columns from a profile to the scorecard. You must run a profile before you addcolumns to the scorecard.
Complete these steps to create a scorecard:
1. In Object Explorer, select the project or folder where you want to create the scorecard.
2. Click File > New > Scorecard.
The New Scorecard dialog box appears.
3. Click Add.
The Select Profile dialog box appears. Select the profile that contains the columns you want to add.
4. Click OK, then click Next.
5. Select the columns that you want to add to the scorecard.
By default, the scorecard wizard selects the columns and rules defined in the profile. You cannot add columnsthat are not included in the profile.
6. Click Finish.
The Developer tool creates the scorecard.
7. Optionally, click Open with Informatica Analyst to connect to the Analyst tool and open the scorecard in theAnalyst tool.
You can run and edit the scorecard in the Analyst tool. You can run the scorecard on current data in the dataobject or on data stored in the staging database.
Creating a Scorecard 23

Adding Columns to a ScorecardAfter you run a profile, you can add profile columns to a scorecard. When you add profile columns that areselected for drilldown with all rows configured for sampling, the Analyst tool displays the profile columns as scoresin the scorecard. Use the Add to Scorecard Wizard to add columns from a profile to a scorecard and configurethe valid values for the columns. You can add columns to an existing scorecard or you can add columns to a newscorecard.
1. In the Navigator, select the project or folder that contains the profile.
2. Click the profile to open it.
The profile appears in a tab.
3. Click Actions > Run Profile to run the profile.
4. Click Actions > Add to Scorecard.
The Add to Scorecard Wizard appears.
5. Select the columns and rules that you want to add to a scorecard. Optionally, click the check box in the leftcolumn header to select all columns. Optionally, select Column Name to sort column names.
6. Optionally, select a score name to change the score name and add a description.
7. Click Next.
8. Select the scorecard that you want to add the columns to or click New, configure the name, description, andlocation of the scorecard in the New Scorecard window, and click OK.
9. Click Next.
10. Select each column in the Scores panel and configure the valid values from the list of all values in the Scoreusing: Values panel.
Optionally, select Is Valid to include all valid values.
11. Select each column in the Scores panel and select Set Custom Thresholds for this Score in the ScoreSettings panel to configure score thresholds.
You can set thresholds for Good, Acceptable, and Unacceptable scores.
12. Click Finish.
Running a ScorecardRun a scorecard to generate scores for columns.
1. In the Navigator, select the project or folder that contains the scorecard.
2. Click the scorecard to open it.
The scorecard appears in a tab.
3. Click Actions > Run Scorecard.
4. Select a score from the Scores panel and select the columns from the Columns panel to drill down on.
5. In the Drilldown option, choose to drill down on live data or staged data.
For optimal performance, drilldown on live data.
6. Click Run.
24 Chapter 4: Scorecards

Viewing a ScorecardView a scorecard to see the scores for each column in a record. You can select a score to view the rows of datafor each column. You can view data that is valid or not valid. You must run the scorecard to view the scores. Youcan view summary information for the scorecard including the last run date and time. For each score, you can viewthe name, total number of rows and total number of rows that are not valid. You can view the score displayed as apercentage and a bar. You can view the name of the data object from which the score originates, the data objectsource name, and the data source type.
1. Run a scorecard to view the scores.
2. Select a column that contains the score you want to view.
3. Click Actions > Show Rows to view the rows of valid or invalid data for the column.
The Analyst tool displays the rows of valid data by default in the Drilldown panel.
Drilling Down on ColumnsDrilldown on the columns for a score to select columns that appear when you view the valid or invalid data rows.The columns you select to drill down on appear in the Drilldown panel.
1. Run a scorecard to view the scores.
2. Select a column that contains the score you want to view.
3. Click Actions > Show Rowsto view the rows of valid or invalid data for the column.
4. Click Actions > Drilldown Columns.
The Drilldown Columns window appears.
5. Select the columns you want to include in the Drilldown panel.
Optionally, select the Name column to include all columns.
6. Click OK.
The columns appear in the Drilldown panel for the selected score. The Analyst tool displays the rows of validdata for the columns by default. Optionally, click Invalid to view the rows of invalid data.
Viewing Column Data in a ScorecardUse a scorecard to view statistics on the valid and invalid data in a data object. A scorecard determines data to bevalid or invalid based on the rule that the profile applies to the data source.
Complete these steps to view scorecard data in the Developer tool:
1. Browse the Object Explorer and find the scorecard you need.
2. Right-click the scorecard and select Open
The scorecard columns and statistics appear in the editor. The scorecard contains the following information:
¨ The names of the columns in the scorecard.
¨ The number of rows in each column.
¨ The number of invalid rows in each column according to the rule applied in the profile.
Viewing a Scorecard 25

¨ The score for each column. This is the percentage of valid rows in the column.
¨ A bar chart representation of the score for each column.
¨ The data object read by the underlying profile.
¨ The source column in the data object.
¨ The data source type.
¨ The drilldown setting for the column.
3. Use the Data Viewer to drill down on the data values for a column.
You can view the valid values or invalid values in the Data Viewer.
Editing a ScorecardEdit valid values for columns in a scorecard. You must run a scorecard before you can edit it.
1. In the Navigator, select the project or folder that contains the scorecard.
2. Click the scorecard to open it.
The scorecard appears in a tab.
3. Click Actions > Edit.
The Edit Scorecard window appears.
4. On the Scores tab, select each score in the Scores panel and configure the valid values from the list of allvalues in the Score using: Values panel.
5. Select Set Custom Thresholds for this Score in the Score Settings panel to configure score thresholds.
6. Click Save to save changes to the scorecard.
Defining ThresholdsYou can set thresholds for each score in a scorecard. A threshold specifies the range in percentage of bad datathat is acceptable for columns in a record. You can set thresholds for good, acceptable, or unacceptable ranges ofdata. You can define thresholds for each column when you add columns to a scorecard, or when you edit ascorecard.
Complete the following prerequisite tasks before you define thresholds for columns in a scorecard:
¨ In the Navigator, select the project or folder that contains the profile and add columns from the profile to thescorecard in the Add to Scorecard window.
¨ Optionally, in the Navigator, select the project or folder that contains the scorecard and click the scorecard toedit it in the Edit Scorecard window.
1. In the Add to Scorecard window, or the Edit Scorecard window, select each column in the Score panel.
2. Select Set Custom Thresholds for this Score in the Score Settings column.
3. Enter the thresholds that represent the upper bound of the unacceptable range and the lower bound of thegood range.
4. Click Finish or Save.
26 Chapter 4: Scorecards
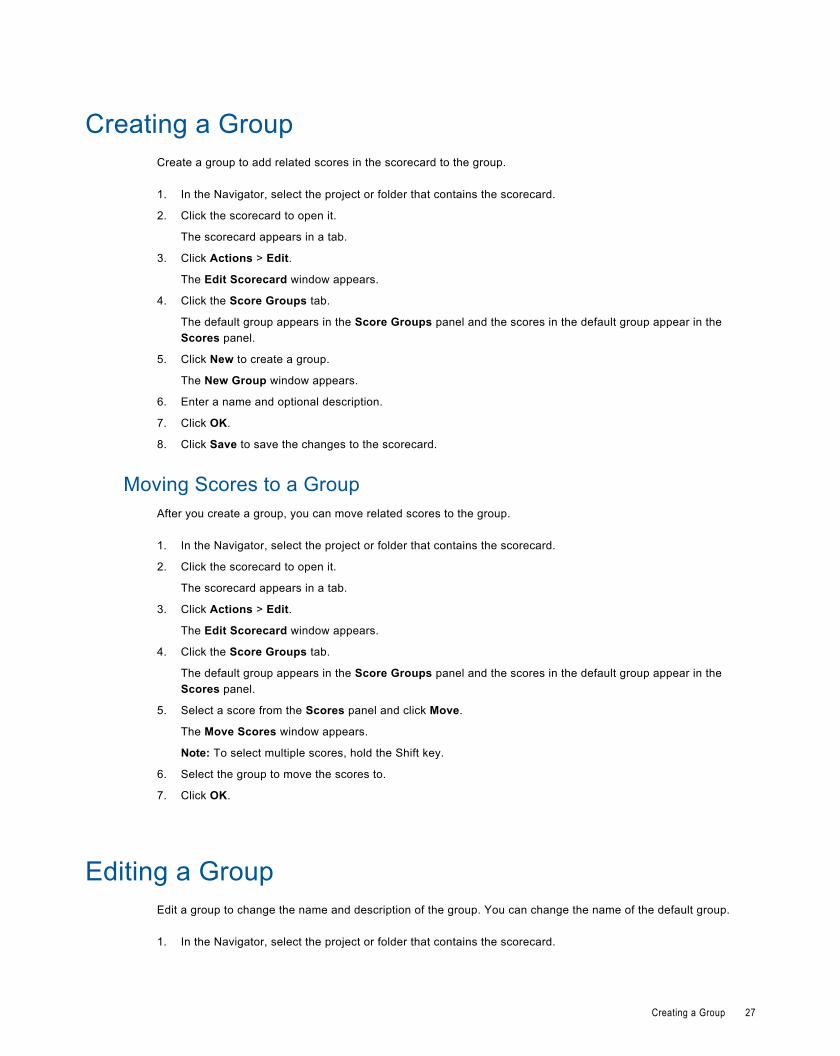
Creating a GroupCreate a group to add related scores in the scorecard to the group.
1. In the Navigator, select the project or folder that contains the scorecard.
2. Click the scorecard to open it.
The scorecard appears in a tab.
3. Click Actions > Edit.
The Edit Scorecard window appears.
4. Click the Score Groups tab.
The default group appears in the Score Groups panel and the scores in the default group appear in theScores panel.
5. Click New to create a group.
The New Group window appears.
6. Enter a name and optional description.
7. Click OK.
8. Click Save to save the changes to the scorecard.
Moving Scores to a GroupAfter you create a group, you can move related scores to the group.
1. In the Navigator, select the project or folder that contains the scorecard.
2. Click the scorecard to open it.
The scorecard appears in a tab.
3. Click Actions > Edit.
The Edit Scorecard window appears.
4. Click the Score Groups tab.
The default group appears in the Score Groups panel and the scores in the default group appear in theScores panel.
5. Select a score from the Scores panel and click Move.
The Move Scores window appears.
Note: To select multiple scores, hold the Shift key.
6. Select the group to move the scores to.
7. Click OK.
Editing a GroupEdit a group to change the name and description of the group. You can change the name of the default group.
1. In the Navigator, select the project or folder that contains the scorecard.
Creating a Group 27

2. Click the scorecard to open it.
The scorecard opens in a tab.
3. Click Actions > Edit.
The Edit Scorecard window appears.
4. Click the Score Groups tab.
The default group appears in the Score Groups panel and the scores in the default group appear in theScores panel.
5. On the Score Groups panel, click Edit.
The Edit window appears.
6. Enter a name and an optional description.
7. Click OK.
Deleting a GroupYou can delete a group that is no longer valid. When you delete a group, you can choose to move the scores inthe group to the default group. You cannot delete the default group.
1. In the Navigator, select the project or folder that contains the scorecard.
2. Click the scorecard to open it.
The scorecard opens in a tab.
3. Click Actions > Edit.
The Edit Scorecard window appears.
4. Click the Score Groups tab.
The default group appears in the Score Groups panel and the scores in the default group appear in theScores panel.
5. On the Score Groups panel, click Delete.
The Delete Groups window appears.
6. Choose the option to delete the scores in the group or the option to move the scores to the default groupbefore deleting the group.
7. Click OK.
Viewing Trend ChartsYou can view trend charts for each score to monitor how the score changes over time.
1. In the Navigator, select the project or folder that contains the scorecard.
2. Click the scorecard to open it.
The scorecard appears in a tab.
3. In the Scorecard view, select a score.
28 Chapter 4: Scorecards

4. Click Actions > Show Trend Chart.
The Trend Chart Detail window appears. You can view score values that have changed over time. TheAnalyst tool uses historical scorecard run data for each date and the latest valid score values to calculate thescore. The Analyst tool uses the latest threshold settings in the chart to depict the color of the score points.
Rules and Guidelines for ScorecardsRules and guidelines for working with scorecards.
Use the following rules and guidelines when you work with scorecards:
¨ You cannot add a column with the same name to an existing scorecard.
¨ You cannot add the same column twice to a scorecard even if you change the column name.
Rules and Guidelines for Scorecards 29

C H A P T E R 5
Reference DataThis chapter includes the following topics:
¨ Reference Data Overview, 30
¨ Types of Reference Data, 30
¨ Reference Tables, 31
Reference Data OverviewSeveral transformations read reference data to perform data quality tasks.
The following transformations can read reference data:
¨ Address Validator. Reads address reference data to verify the accuracy of addresses.
¨ Case Converter. Reads reference data tables to identify strings that must change case.
¨ Comparison. Reads identity population data during duplicate analysis.
¨ Labeler. Reads reference data tables to identify and label strings.
¨ Match. Reads identity population data during duplicate analysis.
¨ Parser. Reads reference data tables to parse strings.
¨ Standardizer. Reads reference data tables to standardize strings to a common format.
Use the Data Quality Content Installer to install reference data.
You can create reference data tables from the results of column profiling. You can export reference tables as XMLfiles.
Types of Reference DataReference data installs through the Data Quality Content Installer.
The Content installer installs the following types of reference data:
¨ Reference data tables. Contain information on common business terms from several countries. The types ofreference information include telephone area codes, postcode formats, first names, social security numberformats, occupations, and acronyms.
The Content Installer writes the table structure to the Model Repository and the table data to the stagingdatabase defined during installation. You can view and edit these tables in the Developer tool.
30
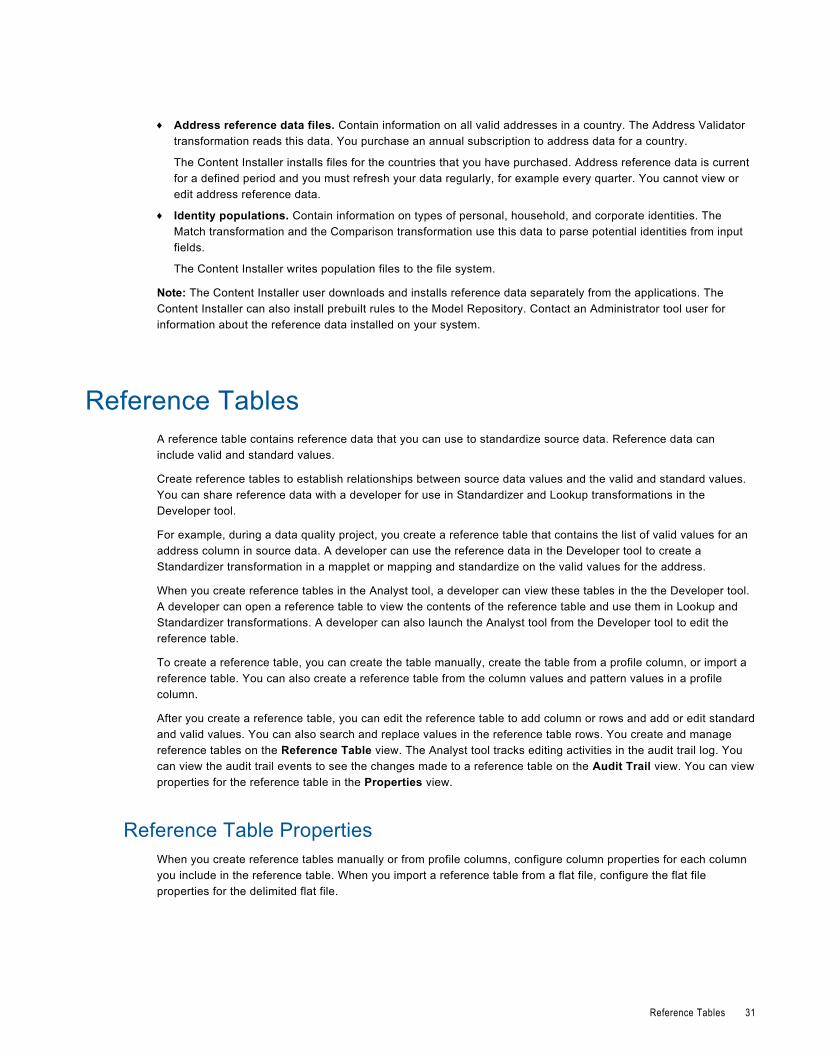
¨ Address reference data files. Contain information on all valid addresses in a country. The Address Validatortransformation reads this data. You purchase an annual subscription to address data for a country.
The Content Installer installs files for the countries that you have purchased. Address reference data is currentfor a defined period and you must refresh your data regularly, for example every quarter. You cannot view oredit address reference data.
¨ Identity populations. Contain information on types of personal, household, and corporate identities. TheMatch transformation and the Comparison transformation use this data to parse potential identities from inputfields.
The Content Installer writes population files to the file system.
Note: The Content Installer user downloads and installs reference data separately from the applications. TheContent Installer can also install prebuilt rules to the Model Repository. Contact an Administrator tool user forinformation about the reference data installed on your system.
Reference TablesA reference table contains reference data that you can use to standardize source data. Reference data caninclude valid and standard values.
Create reference tables to establish relationships between source data values and the valid and standard values.You can share reference data with a developer for use in Standardizer and Lookup transformations in theDeveloper tool.
For example, during a data quality project, you create a reference table that contains the list of valid values for anaddress column in source data. A developer can use the reference data in the Developer tool to create aStandardizer transformation in a mapplet or mapping and standardize on the valid values for the address.
When you create reference tables in the Analyst tool, a developer can view these tables in the the Developer tool.A developer can open a reference table to view the contents of the reference table and use them in Lookup andStandardizer transformations. A developer can also launch the Analyst tool from the Developer tool to edit thereference table.
To create a reference table, you can create the table manually, create the table from a profile column, or import areference table. You can also create a reference table from the column values and pattern values in a profilecolumn.
After you create a reference table, you can edit the reference table to add column or rows and add or edit standardand valid values. You can also search and replace values in the reference table rows. You create and managereference tables on the Reference Table view. The Analyst tool tracks editing activities in the audit trail log. Youcan view the audit trail events to see the changes made to a reference table on the Audit Trail view. You can viewproperties for the reference table in the Properties view.
Reference Table PropertiesWhen you create reference tables manually or from profile columns, configure column properties for each columnyou include in the reference table. When you import a reference table from a flat file, configure the flat fileproperties for the delimited flat file.
Reference Tables 31

You can configure the following column properties for each column in a reference table:
Property Description
Valid Appears when you create a reference table manually orimport it as a flat file. Table record contains a valid value touse in a Lookup or Standardizer transformation in theDeveloper tool.
Name Name of the column.
Data Type Datatype for the column. You can choose one of the followingdatatypes:- bigint- date/time- decimal- integer- stringThe values you can configure for precision and scale dependon the datatype you choose.
Precision Precision for the column. Precision is the maximum number ofdigits or the maximum number of characters that the columncan accomodate.
Scale Scale for the column. Scale is the maximum number of digitsthat a column can accommodate to the right of the decimalpoint. Applicable for decimal columns.
Description Description for the column.
You can configure the following flat file properties when you import a reference table from a delimited flat file:
Property Description
Delimiters Character used to separate columns of data. Use the Otherfield to enter a different delimiter. Delimiters must be printablecharacters and must be different from the escape characterand the quote character if selected. Default is comma.
Text Qualifier Quote character that defines the boundaries of text strings.Choose No Quote, Single Quote, or Double Quotes. If youselect a quote character, the wizard ignores delimiters withinpairs of quotes. Default is Double Quotes.
Column Names Use data in the first row for column names. Select this optionif column names appear in the first row.
Values Indicates the row number at which the wizard starts readingwhen it imports the file.
32 Chapter 5: Reference Data

Create Reference TablesUse the reference table editor, profile results, or a flat file to create reference tables. Create reference tables toshare reference data with developers in the Developer tool.
Use the following methods to create a reference table:
¨ Create a reference table manually. Use the reference table editor to create a reference table, add columns,and configure attributes.
¨ Create a reference table from profile columns. Select a column in a profile and add it to a reference table orcreate a reference table to add the column. Select a column in a profile and select the column values to add toa reference table or create a reference table to add the column values. Select a column in the profile and selectthe pattern values to add to a reference table or create a reference table to add the pattern values.
¨ Import a reference table. Import a reference table from a delimited flat file.
Creating a Reference Table ManuallyUse the New Reference Table Wizard and the reference table editor to create a reference table manually. Youcan use the reference table editor to define the structure, columns, and data for the table.
1. In the Navigator, select the project and folder where you want to create the reference table.
2. Click Actions > New Reference Table.
The New Reference Table Wizard appears.
3. Select the option to Use the reference table editor.
4. Click Next.
5. Enter the table name and optional description and default value.
The Analyst tool uses the default value for any table record that does not contain a value.
6. For each column you want to include in the reference table, click the Add New Column icon and configurethe column properties for each column.
Note: You can reorder the columns or delete columns.
7. Optionally, choose to create a description column for rows in the reference table. Configure the name andprecision for the column.
8. Optionally, enter an audit note.
The audit note appears in the audit trail log.
9. Click Finish.
Creating a Reference Table from Profile ColumnsYou can create a reference table from a profile column. You can add a profile column to an existing referencetable. The New Reference Table Wizard adds the column to the reference table.
1. In the Navigator, select the project or folder that contains the profile with the column that you want to add to areference table.
2. Click the profile name to open it in another tab.
3. In the Column Profiling view, select the column that you want to add to a reference table.
4. Click Actions > Add to Reference Table.
The New Reference Table Wizard appears.
5. Select the option to Create a new reference table.
Reference Tables 33
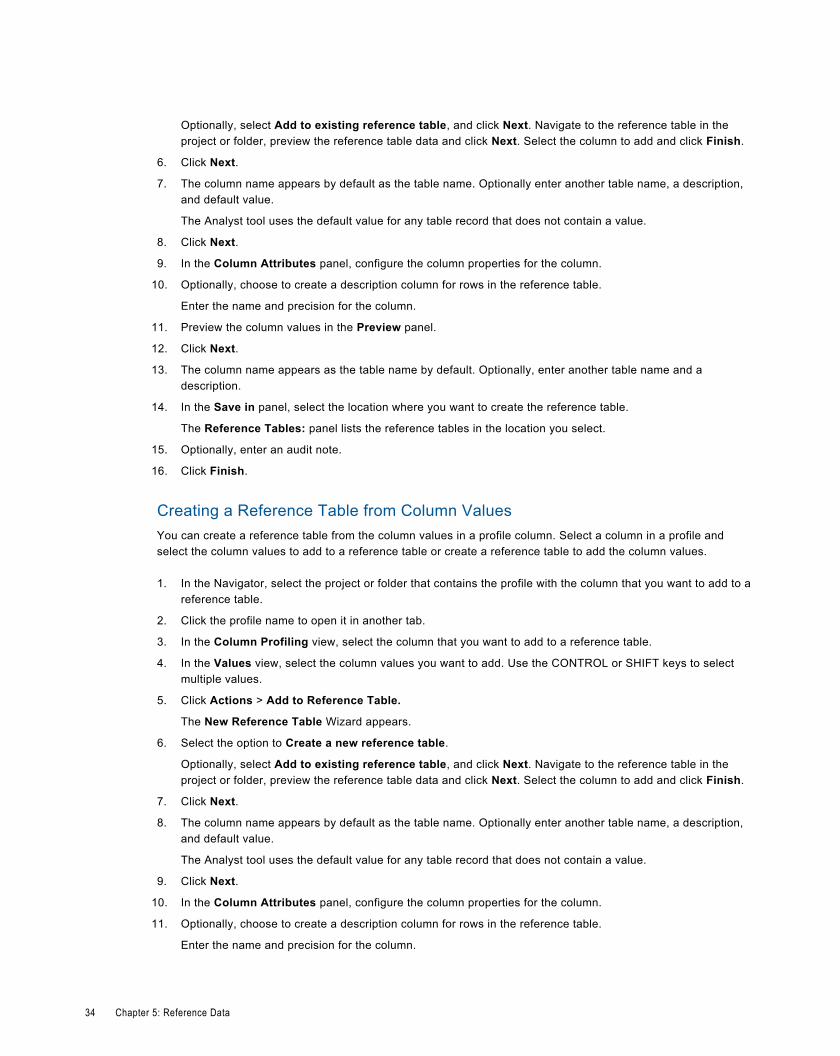
Optionally, select Add to existing reference table, and click Next. Navigate to the reference table in theproject or folder, preview the reference table data and click Next. Select the column to add and click Finish.
6. Click Next.
7. The column name appears by default as the table name. Optionally enter another table name, a description,and default value.
The Analyst tool uses the default value for any table record that does not contain a value.
8. Click Next.
9. In the Column Attributes panel, configure the column properties for the column.
10. Optionally, choose to create a description column for rows in the reference table.
Enter the name and precision for the column.
11. Preview the column values in the Preview panel.
12. Click Next.
13. The column name appears as the table name by default. Optionally, enter another table name and adescription.
14. In the Save in panel, select the location where you want to create the reference table.
The Reference Tables: panel lists the reference tables in the location you select.
15. Optionally, enter an audit note.
16. Click Finish.
Creating a Reference Table from Column ValuesYou can create a reference table from the column values in a profile column. Select a column in a profile andselect the column values to add to a reference table or create a reference table to add the column values.
1. In the Navigator, select the project or folder that contains the profile with the column that you want to add to areference table.
2. Click the profile name to open it in another tab.
3. In the Column Profiling view, select the column that you want to add to a reference table.
4. In the Values view, select the column values you want to add. Use the CONTROL or SHIFT keys to selectmultiple values.
5. Click Actions > Add to Reference Table.
The New Reference Table Wizard appears.
6. Select the option to Create a new reference table.
Optionally, select Add to existing reference table, and click Next. Navigate to the reference table in theproject or folder, preview the reference table data and click Next. Select the column to add and click Finish.
7. Click Next.
8. The column name appears by default as the table name. Optionally enter another table name, a description,and default value.
The Analyst tool uses the default value for any table record that does not contain a value.
9. Click Next.
10. In the Column Attributes panel, configure the column properties for the column.
11. Optionally, choose to create a description column for rows in the reference table.
Enter the name and precision for the column.
34 Chapter 5: Reference Data
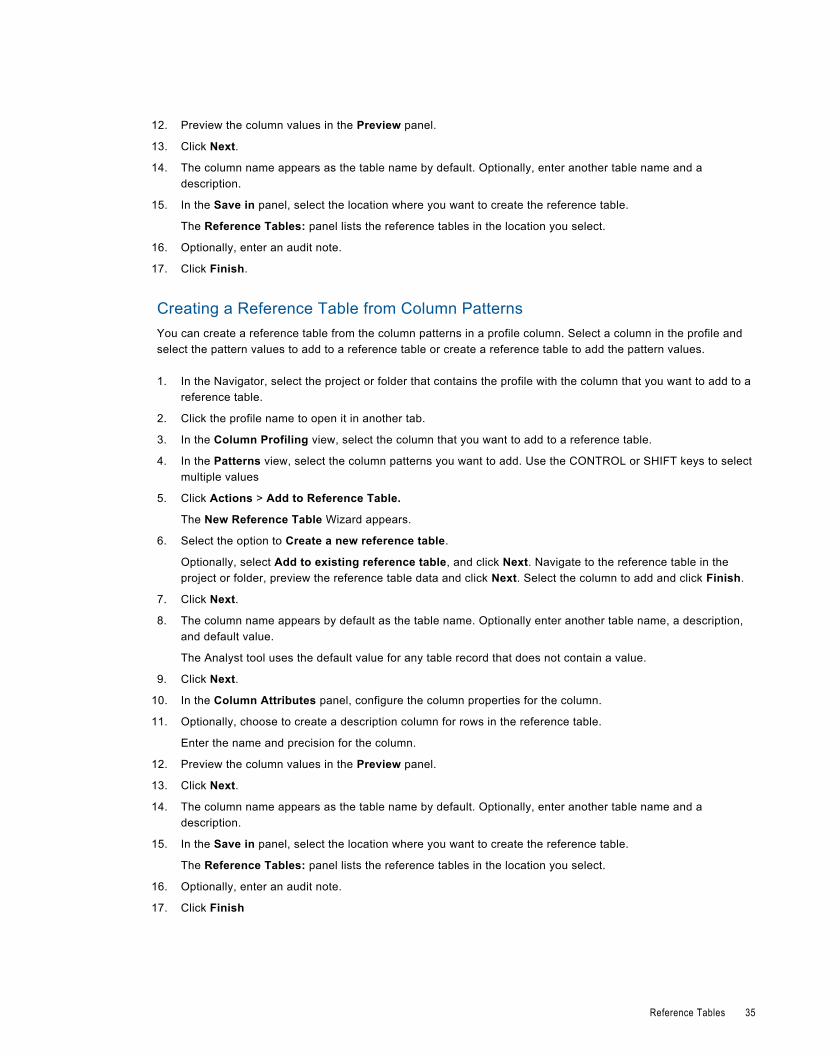
12. Preview the column values in the Preview panel.
13. Click Next.
14. The column name appears as the table name by default. Optionally, enter another table name and adescription.
15. In the Save in panel, select the location where you want to create the reference table.
The Reference Tables: panel lists the reference tables in the location you select.
16. Optionally, enter an audit note.
17. Click Finish.
Creating a Reference Table from Column PatternsYou can create a reference table from the column patterns in a profile column. Select a column in the profile andselect the pattern values to add to a reference table or create a reference table to add the pattern values.
1. In the Navigator, select the project or folder that contains the profile with the column that you want to add to areference table.
2. Click the profile name to open it in another tab.
3. In the Column Profiling view, select the column that you want to add to a reference table.
4. In the Patterns view, select the column patterns you want to add. Use the CONTROL or SHIFT keys to selectmultiple values
5. Click Actions > Add to Reference Table.
The New Reference Table Wizard appears.
6. Select the option to Create a new reference table.
Optionally, select Add to existing reference table, and click Next. Navigate to the reference table in theproject or folder, preview the reference table data and click Next. Select the column to add and click Finish.
7. Click Next.
8. The column name appears by default as the table name. Optionally enter another table name, a description,and default value.
The Analyst tool uses the default value for any table record that does not contain a value.
9. Click Next.
10. In the Column Attributes panel, configure the column properties for the column.
11. Optionally, choose to create a description column for rows in the reference table.
Enter the name and precision for the column.
12. Preview the column values in the Preview panel.
13. Click Next.
14. The column name appears as the table name by default. Optionally, enter another table name and adescription.
15. In the Save in panel, select the location where you want to create the reference table.
The Reference Tables: panel lists the reference tables in the location you select.
16. Optionally, enter an audit note.
17. Click Finish
Reference Tables 35

Importing a Reference TableImport a reference table from a delimited flat file.
1. In the Navigator, select the project or folder where you want to create the reference table.
2. Click Actions > New Reference Table.
The New Reference Table Wizard appears.
3. Select the option to Import a flat file.
4. Click Next.
5. Click Browse to select the flat file.
6. Click Upload to upload the file to a directory in the Informatica Services installation directory that the Analysttool can access.
7. Enter the table name, and optional description and default value.
The Analyst tool uses the default value for any table record that does not contain a value.
8. Select a code page that matches the data in the flat file.
9. Preview the data in the Preview of file panel.
10. Click Next.
11. Configure the flat file properties.
12. In the Preview panel, click Show to update the preview.
13. Click Next.
14. On the Column Attributes panel, configure the column properties for each column.
15. Optionally, choose to create a description column for rows in the reference table. Enter the name andprecision for the column.
16. Click Finish.
Reference Table ManagementYou can perform tasks to manage reference tables. You can find and replace column values, add or removecolumns and rows, edit column values, and export a reference table to a file.
You can perform the following tasks to manage reference tables:
¨ Manage columns. Use the Edit column properties window to add, edit, or delete columns in a referencetable.
¨ Manage rows. Use the Add Rows window to add rows and the Edit Row window to edit rows in a referencetable. Use the Delete icon to delete rows in a reference table.
¨ Find and replace values. You can find and replace values in individual reference table columns. You can finda value in a column and replace it with another value. You can replace all values in columns with another value.
¨ Export a reference table. Export a reference table to a comma-separated values (CSV) file, dictionary file, orExcel file.
Managing ColumnsUse the Edit column properties window to add, edit, or delete columns in a reference table.
1. In the Navigator, select the project or folder that contains the reference table that you want to edit.
2. Click the reference table name to open it in a tab. The Reference Table tab appears.
36 Chapter 5: Reference Data

3. Click Actions > Edit Table or click the Edit Table icon.
The Edit column properties window appears.
4. To add a column, click the Add New Column icon in the Column Attributes panel and edit the columnproperties. Or, to edit an existing column, click the property you want to edit.
You cannot edit the datatype, precision, and scale of the column. You can rename the column and change thecolumn description.
5. To delete a column, click the column and click the Delete icon.
6. Optionally, you can enter an audit note on the Audit Note panel. The audit note appears in the audit log forany action you perform in the Edit column properties window.
7. Click OK.
Managing RowsYou can add, edit, or delete rows in a reference table.
1. In the Navigator, select the project or folder containing the reference table that you want to edit.
2. Click the reference table name to open it in a tab. The Reference Table tab appears.
3. To add a row, click Actions > Add Row or click the Add Row icon. In the Add Row window, enter the valuefor each column and enter an optional audit note. Click OK.
4. To edit rows, select the rows and click Actions > Edit or click the Edit icon. In the Edit Rows window, enterthe value for each column, select the columns to apply the changes to, and enter an optional audit note.Optionally, click Previous to edit the previous row and click Next to edit the next row. Click Apply to applythe changes.
The new column values appear in the tab.
5. To delete rows, select the rows you want to delete and click Actions > Delete or click the Delete icon. In theDelete Rows window, enter an optional audit note and click OK.
Finding and Replacing ValuesYou can find and replace values in individual reference table columns.
1. In the Navigator, select the project or folder containing the reference table that you want to find and replacevalues in.
2. Click the reference table name to open it in a tab. The Reference Table tab appears.
3. Click Actions > Find and Replace or click the Find and Replace icon.
The Find and Replace toolbar appears.
4. Enter the search criteria in the Find box. Select all columns or a column that you want to find in the list. Enterthe value you want to replace with, and click one of the following buttons:
Option Description
Next/Previous Scroll through the column values that match the search criteria.
Highlight All Highlight all the column values that match the search criteria.
Replace Replace the currently highlighted column value.
Reference Tables 37

Option Description
Replace All Replace all occurrences of the search criteria in column values.
Exporting a Reference TableExport a reference table to a comma-seperated values (CSV) file, dictionary file, or Microsoft Excel file.
1. In the Navigator, select the project or folder containing the reference table that you want to view the audit trailfor.
2. Click the reference table name to open it in a tab. The Reference Table tab appears.
3. Click Actions > Export Data.
The Export data to a file window appears.
4. Configure the following options:
Option Description
File Name File name for the exported data.
File Format Format of the exported file. You can select the following formats:
¨ csv. Comma-separated values file.¨ xls. Microsoft Excel file.¨ dic. Dictionary file.
Optionally, select Export field names as first row to export the column names as a header rowin the exported file.
Code Page Code page of the reference data.
5. Click OK.
The options to save or open the file depend on your browser.
Audit Trail EventsUse the Audit Trail view for a reference table to view audit trail log events.
The Analyst tool creates audit trail log events when you make a change to a reference table and enter an audittrail note. Audit trail log events provide information about the reference tables that you manage.
38 Chapter 5: Reference Data

You can configure query options on the Audit Trail tab to filter the log events that you view. You can specify filterson the date range, type, user name, and status. The following table describes the options you configure when youview audit trail log events:
Option Description
Date Start and end dates for the log events to search for. Use the calender to choose dates.
Type Type of audit trail events. You can filter and view the following events types:- Data. Events related to data in the reference table. Events include creating, editing, deleting,
and replacing all rows.- Metadata. Events related to reference table metadata. Events include creating reference
tables, adding, deleting, and editing columns, and updating valid columns.
User User who edited the reference table and entered the audit trail comment. The Analyst toolgenerates the list of users from the Analyst tool users configured in the Administrator tool.
Status Status of the audit trail log events. Status corresponds to the action performed in the referencetable editor.
Audit trail log events also include the audit trail comments and the column values that were inserted, updated, ordeleted.
Viewing Audit Trail EventsView audit trail log events to get more information about changes made to a reference table.
1. In the Navigator, select the project or folder that contains the reference table that you want to view the audittrail for.
2. Click the reference table name to open it in a tab. The Reference Table tab appears.
3. Click the Audit Trail view.
4. Configure the filter options.
5. Click Show.
The log events for the specified query options appear.
Reference Tables 39

Part II: Getting Started withInformatica Analyst
This part contains the following chapters:
¨ Lesson 1. Setting Up Informatica Analyst, 41
¨ Lesson 2. Creating Data Objects, 44
¨ Lesson 3. Creating Quick Profiles, 47
¨ Lesson 4. Creating Custom Profiles, 50
¨ Lesson 5. Creating Expression Rules, 53
¨ Lesson 6. Creating and Running Scorecards, 56
¨ Lesson 7. Creating Reference Tables from Profile Columns, 60
¨ Lesson 8. Creating Reference Tables, 63
40

C H A P T E R 6
Lesson 1. Setting Up InformaticaAnalyst
This chapter includes the following topics:
¨ Setting Up Informatica Analyst Overview, 41
¨ Task 1. Log In to Informatica Analyst, 42
¨ Task 2. Create a Project, 42
¨ Task 3. Create a Folder, 42
¨ Setting Up Informatica Analyst Summary, 43
Setting Up Informatica Analyst OverviewBefore you start the lessons in this tutorial, you must set up the Analyst tool. To set up the Analyst tool, log in tothe Analyst tool and create a project and a folder to store your work.
The Informatica domain is a collection of nodes and services that define the Informatica environment. Services inthe domain include the Analyst Service and the Model Repository Service. The Analyst Service runs the Analysttool, and the Model Repository Service manages the Model repository. When you work in the Analyst tool, theAnalyst tool stores the objects that you create in the Model repository.
You must create a project before you can create objects in the Analyst tool. A project contains objects in theAnalyst tool. A project can also contain folders that store related objects, such as objects that are part of the samebusiness requirement.
ObjectivesIn this lesson, you complete the following tasks:
¨ Log in to the Analyst tool.
¨ Create a project to store the objects that you create in the Analyst tool.
¨ Create a folder in the project that can store related objects.
PrerequisitesBefore you start this lesson, verify the following prerequisites:
¨ An administrator has configured a Model Repository Service and an Analyst Service in the Administrator tool.
¨ You have the host name and port number for the Analyst tool.
41

¨ You have a user name and password to access the Analyst Service. You can get this information from anadministrator.
TimingSet aside 5 to 10 minutes to complete this lesson.
Task 1. Log In to Informatica AnalystLog in to the Analyst tool to begin the tutorial.
1. Start a Microsoft Internet Explorer or Mozilla Firefox browser.
2. In the Address field, enter the URL for Informatica Analyst:http[s]://<host name>:<port number>/AnalystTool
3. On the login page, enter the user name and password.
4. Select Native or the name of a specific security domain.
The Security Domain field appears when the Informatica domain contains an LDAP security domain. If you donot know the security domain that your user account belongs to, contact the Informatica domain administrator.
5. Click Login.
The welcome screen appears.
6. Click Close to exit the welcome screen and access the Analyst tool.
Task 2. Create a ProjectIn this task, you create a project to contain the objects that you create in the Analyst tool. Create a tutorial projectto contain the folder for the data quality project.
1. In the Analyst tool, select the Projects folder in the Project navigator.
The Project navigator is the left pane in the Analyst interface.
2. Click Actions > New Project in the Project navigator.
The New Project window appears.
3. Enter your name prefixed by "Tutorial_" as the name of the project.
4. Verify that Unshared is selected.
5. Click OK.
Task 3. Create a FolderIn this task, you create a folder to store related objects. You can create a folder in a project or another folder.Create a folder named Customers to store the objects related to the data quality project.
1. In the Project navigator, select the tutorial project.
42 Chapter 6: Lesson 1. Setting Up Informatica Analyst
2. Click Actions > New Folder.
3. Enter Customers for the folder name.
4. Click OK.
The folder appears under the tutorial project.
Setting Up Informatica Analyst SummaryIn this lesson, you learned that the Analyst tool stores objects in projects and folders. A Model repository containsthe projects and folders. The Analyst Service runs the Analyst tool. The Model Repository Service manages theModel repository. The Analyst Service and the Model Repository Service are application services in theInformatica domain.
You logged in to the Analyst tool and created a project and a folder.
Now, you can use the Analyst tool to complete other lessons in this tutorial.
Setting Up Informatica Analyst Summary 43
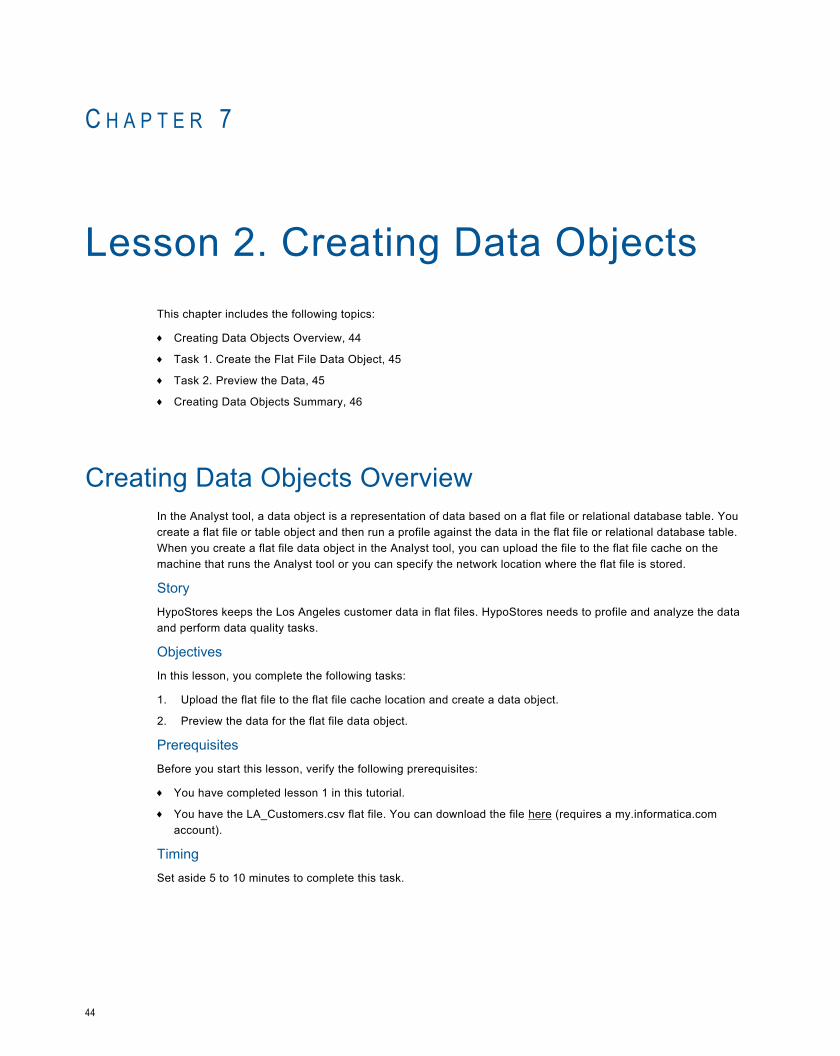
C H A P T E R 7
Lesson 2. Creating Data ObjectsThis chapter includes the following topics:
¨ Creating Data Objects Overview, 44
¨ Task 1. Create the Flat File Data Object, 45
¨ Task 2. Preview the Data, 45
¨ Creating Data Objects Summary, 46
Creating Data Objects OverviewIn the Analyst tool, a data object is a representation of data based on a flat file or relational database table. Youcreate a flat file or table object and then run a profile against the data in the flat file or relational database table.When you create a flat file data object in the Analyst tool, you can upload the file to the flat file cache on themachine that runs the Analyst tool or you can specify the network location where the flat file is stored.
StoryHypoStores keeps the Los Angeles customer data in flat files. HypoStores needs to profile and analyze the dataand perform data quality tasks.
ObjectivesIn this lesson, you complete the following tasks:
1. Upload the flat file to the flat file cache location and create a data object.
2. Preview the data for the flat file data object.
PrerequisitesBefore you start this lesson, verify the following prerequisites:
¨ You have completed lesson 1 in this tutorial.
¨ You have the LA_Customers.csv flat file. You can download the file here (requires a my.informatica.comaccount).
TimingSet aside 5 to 10 minutes to complete this task.
44

Task 1. Create the Flat File Data ObjectIn this task, you use the Add Flat File wizard to create a flat file data object from the LA customer data file.
1. In the Navigator, select the Customers folder in your tutorial project.
Note: You must select the project or folder where you want to create the flat file data object before you cancreate it.
2. Click Actions > New Flat File.
The Add Flat File wizard appears.
3. Select Browse and Upload and click Browse.
4. Browse to the location of LA_customers.csv and click Open.
5. Click Next.
6. Enter LA_Customers for the name of the flat file object and use the default value for the code page.
The Details panel shows the first 100 rows in the flat file.
7. Click Next.
8. Under Specify lines to import, select to import column names from the first non-blank line.
9. Click Show.
The details panel updates to show the column headings from the first row.
10. Click Next.
The Column Attributes panel shows the datatype, precision, scale, and format for each column.
11. For the CreateDate and MiscDate columns, click the Data Type cell and change the datatype to datetime.
12. Click Finish.
The data object appears in the folder contents for the Customers_LA folder.
Task 2. Preview the DataIn this task, you preview the data for the flat file data object to review the structure and content of the data.
1. In the Navigator, select the Customers folder in your tutorial project.
The contents of the folder appear in the Content panel.
2. Click the LA_Customers data object.
The data object opens in a tab. The Analyst tool displays the first 100 rows of the flat file data object in theData preview view.
3. Click the Properties view for the flat file data object.
The Properties view displays the name, description, and location of the data object. It also displays thecolumns and column properties for the data object.
Task 1. Create the Flat File Data Object 45

Creating Data Objects SummaryIn this lesson, you learned that data objects are representations of data based on a flat file or a relationaldatabase source. You learned that you can create a flat file data object and preview the data in it.
You uploaded a flat file and created a flat file data object, previewed the data for the data object, and viewed theproperties for the data object.
After you create a data object, you create a quick profile for the data object in Lesson 3, and you create a customprofile for the data object in Lesson 4.
46 Chapter 7: Lesson 2. Creating Data Objects

C H A P T E R 8
Lesson 3. Creating Quick ProfilesThis chapter includes the following topics:
¨ Creating Quick Profiles Overview, 47
¨ Task 1. Create and Run a Quick Profile, 48
¨ Task 2. View the Profile Results, 48
¨ Creating Quick Profiles Summary, 49
Creating Quick Profiles OverviewA profile is the analysis of data quality based on the content and structure of data. A quick profile is a profile thatyou create with default options. Use a quick profile to get profile results without configuring all columns andoptions for a profile.
Create and run a quick profile to analyze the quality of the data when you start a data quality project. When youcreate a quick profile object, you select the data object and the data object columns that you want to analyze. Aquick profile skips the profile column and option configuration. The Analyst tool performs profiling on the stagedflat file for the flat file data object.
StoryHypoStores wants to incorporate data from the newly-acquired Los Angeles office into its data warehouse. Beforethe data can be incorporated into the data warehouse, it needs to be cleansed. You are the analyst who isresponsible for assessing the quality of the data and passing the information on to the developer who isresponsible for cleansing the data. You want to view the profile results quickly and get a basic idea of the dataquality.
ObjectivesIn this lesson, you complete the following tasks:
1. Create and run a quick profile for the Customers_LA flat file data object.
2. View the profile results.
PrerequisitesBefore you start this lesson, verify the following prerequisite:
¨ You have completed lessons 1 and 2 in this tutorial.
TimingSet aside 5 to 10 minutes to complete this lesson.
47

Task 1. Create and Run a Quick ProfileIn this task, you create a quick profile for all columns in the data object and use default sampling and drilldownoptions.
1. In the Navigator, select the Customers folder in your tutorial project.
2. In the Contents panel, click to the right of the link for the Customers_LA data object.
Do not click the link for the object.
3. Click Actions > New Profile.
The New Profile wizard appears.
4. Select Quick Profile.
5. Click Save and Run to create and run the profile.
The Analyst tool creates the profile in the same project and folder as the data object.
The profile results for the quick profile appear in a new tab after you save and run the profile.
Task 2. View the Profile ResultsIn this task, you use Column Profiling view for the LA_Customers profile to get a quick overview of the profileresults.
The following table describes the information that appears for each column in a profile:
Property Description
Name Name of the column in the profile.
Unique Values Number of unique values in the column
Unique % Percentage of unique values in the column.
Null Number of null values in the column.
Null % Percentage of column values that are null.
Datatype Data type derived from the values in the column. The Analyst tool can derive the followingdatatypes from the column values:StringVarcharDecimalIntegerNull [-]
Inferred % Percentage of values that match the data type inferred by the Analyst tool.
Documented Datatype Data type declared for the column in the profiled object.
Max Value Maximum value in the column.
Min Valule Minimum value in the column.
48 Chapter 8: Lesson 3. Creating Quick Profiles

Property Description
Last Profiled Date and time you last ran the profile.
Drilldown If selected, enables drilldown on live data for the column.
1. Click the header for the Null Values column to sort the values.
Notice that the Address2, Address3, City2, CreateDate, and MiscDate columns have 100% null values.
In Lesson 4, you create a custom profile to exclude these columns.
2. Click the Full Name column. The values for the column appear in the Values view.
Notice that the first and last names do not appear in separate columns.
In Lesson 5, you create a rule to separate the first and last names into separate columns.
3. Click the CustomerTier column.
Notice that the values for the CustomerTier are inconsistent.
In Lesson 6, you create a scorecard to score the CustomerTier values. In Lesson 7, you create a referencetable that a developer can use to standardize the CustomerTier values.
4. Click the State column and then click the Patterns view.
Notice that 483 columns have a pattern of XX, which indicate valid values. Seventeen values are not validbecause they do not match the valid pattern.
In Lesson 6, you create a scorecard to score the State values.
Creating Quick Profiles SummaryIn this lesson, you learned that a quick profile shows profile results without configuring all columns and rowsampling options for a profile. You learned that you create and run a quick profile to analyze the quality of the datawhen you start a data quality project. You also learned that the Analyst tool performs profiling on the staged flatfile for the flat file data object.
You created a quick profile and analyzed the profile results. You got more information about the columns in theprofile, including null values and datatypes. You also used the column values and patterns to identify data qualityissues.
After you analyze the results of a quick profile, you can complete the following tasks:
¨ Create a custom profile to exclude columns from the profile and only include the columns you are interested in.
¨ Create an expression rule to create virtual columns and profile them.
¨ Create a reference table to include valid values for a column.
Creating Quick Profiles Summary 49

C H A P T E R 9
Lesson 4. Creating Custom ProfilesThis chapter includes the following topics:
¨ Creating Custom Profiles Overview, 50
¨ Task 1. Create a Custom Profile, 51
¨ Task 2. Run the Profile, 51
¨ Task 3. Drill Down on Profile Results, 52
¨ Creating Custom Profiles Summary, 52
Creating Custom Profiles OverviewA profile is the analysis of data quality based on the content and structure of data. A custom profile is a profile thatyou create when you want to configure the columns, sampling options, and drilldown options for faster profiling.Configure sampling options to select the sample rows in the flat file. Configure drilldown options to drill down torecords in the profile results and drilldown to data rows in the source data or staged data.
You create and run a profile to analyze the quality of the data when you start a data quality project. When youcreate a profile object, you select the data object and the data object columns that you want to profile, configurethe sampling options, and configure the drilldown options.
StoryHypoStores needs to incorporate data from the newly-acquired Los Angeles office into its data warehouse.HypoStores wants to access the quality of the customer tier data in the LA customer data file. You are the analystwho is responsible for assessing the quality of the data and passing the information on to the developer who isresponsible for cleansing the data.
ObjectivesIn this lesson, you complete the following tasks:
1. Create a custom profile for the flat file data object and exclude the columns with null values.
2. Run the profile to analyze the content and structure of the CustomerTier column.
3. Drill down into the rows for the profile results.
PrerequisitesBefore you start this lesson, verify the following prerequisite:
¨ You have completed lessons 1, 2, and 3 in this tutorial.
TimingSet aside 5 to 10 minutes to complete this lesson.
50

Task 1. Create a Custom ProfileIn this task, you use the New Profile wizard to create a custom profile. When you create a profile, you select thedata object and the columns that you want to profile. You also configure the sampling and drill down options.
1. In the Navigator, select the Customers folder in your tutorial project.
2. Click Actions > New Profile.
The New Profile wizard appears and displays the option to create a custom profile.
3. Click Next.
4. Enter Profile_LA_Customers_Custom for the name.
5. Verify that the location in the Location panel. The location shows the tutorial project and the Customersfolder.
The Profiles panel shows the Profile_LA_Customers quick profile that you created in lesson 3.
6. Click Next.
7. In the Sources panel, select the LA_Customers data object.
The Columns panel shows the columns for the data object.
8. Click Next.
9. In the Columns panel, clear the Address2, Address3, City2, CreateDate, and MiscDate columns.
10. In the Sampling Options panel, select the All Rows option.
11. In the Drilldown Options panel, verify that Enable Row Drilldown is selected and select on staged data forthe Drilldown option.
12. Click Save.
The Analyst tool creates the profile and displays the profile in another tab.
Task 2. Run the ProfileIn this task, you run a profile to perform profiling on the data object and display the profile results. The Analyst toolperforms profiling on the staged flat file for the flat file data object.
1. In the Navigator, select the Customers folder in your tutorial project.
2. In the contents panel, click the Profile_LA_Customers_Custom link.
The profile appears in a tab.
3. Click Actions > Run Profile.
The Column Profile window appears.
4. In the Columns panel, select Name to select all columns to profile.
5. In the Sampling Options panel, choose to include the default options.
6. In the Drilldown Options panel, choose to include the default options.
7. Click Run.
The Analyst tool performs profiling on the data object and displays the profile results.
Task 1. Create a Custom Profile 51

Task 3. Drill Down on Profile ResultsIn this task, you drill down on the CustomerTier column values to see the underlying rows in the data object for theprofile.
1. In the Navigator, select the Customers folder in your tutorial project.
2. Click the Profile_LA_Customers_Custom profile.
The profile opens in a tab.
3. In the Column Profiling view, click the Preview header to clear all columns.
4. Select the CustomerTier, FullName, and Company columns.
5. In the Column Profiling view, select the CustomerTier column.
The values for the column appear in the Values view.
6. Use the shift key to select the Diamond, Ruby, Emerald, and Bronze values.
The rows for the columns with a value of Diamond, Ruby, Emerald, and Bronze appear in the Drilldownpanel. Only the selected columns appear in the Drilldown panel.
7. In the Column Profiling view, enable the preview option for the CustomerID column and select the Diamond,Ruby, Emerald, and Bronze values in the Values view.
The underlying rows in the Drilldown panel now include the CustomerID column. The title bar for theDrilldown panel shows the logic used for the underlying columns.
Creating Custom Profiles SummaryIn this lesson, you learned that you can configure the columns that get profiled and that you can configure thesampling and drilldown options. You learned that you can drill down to see the underlying rows for column valuesand that you can configure the columns that are included when you view the column values.
You created a custom profile that included the CustomerTier column, ran the profile, and drilled down to theunderlying rows for the CustomerTier column in the results.
Use the custom profile object to create an expression rule in lesson 5. If you have Data Quality or Data Explorer,you can create a scorecard in lesson 6.
52 Chapter 9: Lesson 4. Creating Custom Profiles

C H A P T E R 1 0
Lesson 5. Creating ExpressionRules
This chapter includes the following topics:
¨ Creating Expression Rules Overview, 53
¨ Task 1. Create Expression Rules and Run the Profile, 54
¨ Task 2. View the Expression Rule Output, 54
¨ Task 3. Edit the Expression Rules, 55
¨ Creating Expression Rules Summary, 55
Creating Expression Rules OverviewExpression rules use expression functions and source columns to define rule logic. You can create expressionrules and add them to a profile in the Analyst tool. An expression rule can be associated with one or more profiles.
The output of an expression rule is a virtual column in the profile. The Analyst tool profiles the virtual column whenyou run the profile.
You can use expression rules to validate source columns or create additional source columns based on the valueof the source columns.
StoryHypoStores wants to incorporate data from the newly-acquired Los Angeles office into its data warehouse.HypoStores wants to analyze the customer names and separate customer names into first name and last name.HypoStores wants to use expression rules to parse a column that contains first and last names into separatevirtual columns and then profile the columns. HypoStores also wants to make the rules available to other analystswho need to analyze the output of these rules.
ObjectivesIn this lesson, you complete the following tasks:
1. Create expression rules to separate the FullName column into first name and last name columns. You createa rule that separates the first name from the full name. You create another rule that separates the last namefrom the first name. You create these rules for the Profile_LA_Customers_Custom profile.
2. Run the profile and view the output of the rules in the profile.
3. Edit the rules to make them usable for other Analyst tool users.
53
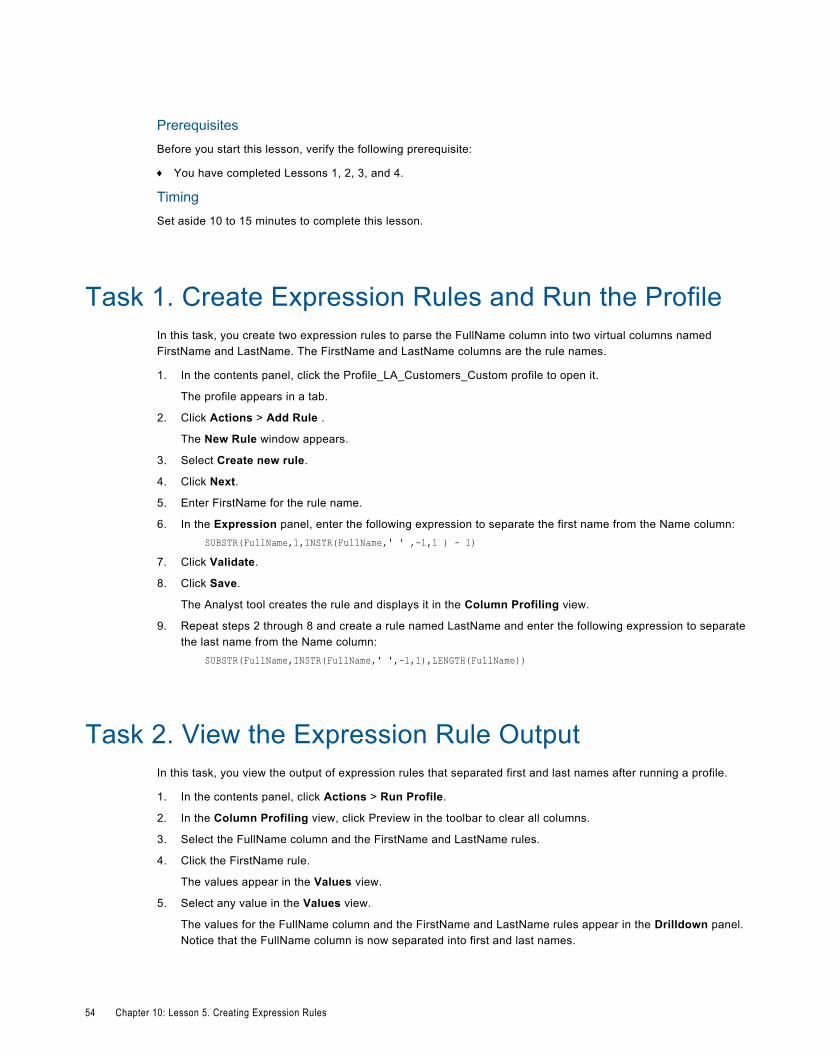
PrerequisitesBefore you start this lesson, verify the following prerequisite:
¨ You have completed Lessons 1, 2, 3, and 4.
TimingSet aside 10 to 15 minutes to complete this lesson.
Task 1. Create Expression Rules and Run the ProfileIn this task, you create two expression rules to parse the FullName column into two virtual columns namedFirstName and LastName. The FirstName and LastName columns are the rule names.
1. In the contents panel, click the Profile_LA_Customers_Custom profile to open it.
The profile appears in a tab.
2. Click Actions > Add Rule .
The New Rule window appears.
3. Select Create new rule.
4. Click Next.
5. Enter FirstName for the rule name.
6. In the Expression panel, enter the following expression to separate the first name from the Name column:SUBSTR(FullName,1,INSTR(FullName,' ' ,-1,1 ) - 1)
7. Click Validate.
8. Click Save.
The Analyst tool creates the rule and displays it in the Column Profiling view.
9. Repeat steps 2 through 8 and create a rule named LastName and enter the following expression to separatethe last name from the Name column:
SUBSTR(FullName,INSTR(FullName,' ',-1,1),LENGTH(FullName))
Task 2. View the Expression Rule OutputIn this task, you view the output of expression rules that separated first and last names after running a profile.
1. In the contents panel, click Actions > Run Profile.
2. In the Column Profiling view, click Preview in the toolbar to clear all columns.
3. Select the FullName column and the FirstName and LastName rules.
4. Click the FirstName rule.
The values appear in the Values view.
5. Select any value in the Values view.
The values for the FullName column and the FirstName and LastName rules appear in the Drilldown panel.Notice that the FullName column is now separated into first and last names.
54 Chapter 10: Lesson 5. Creating Expression Rules
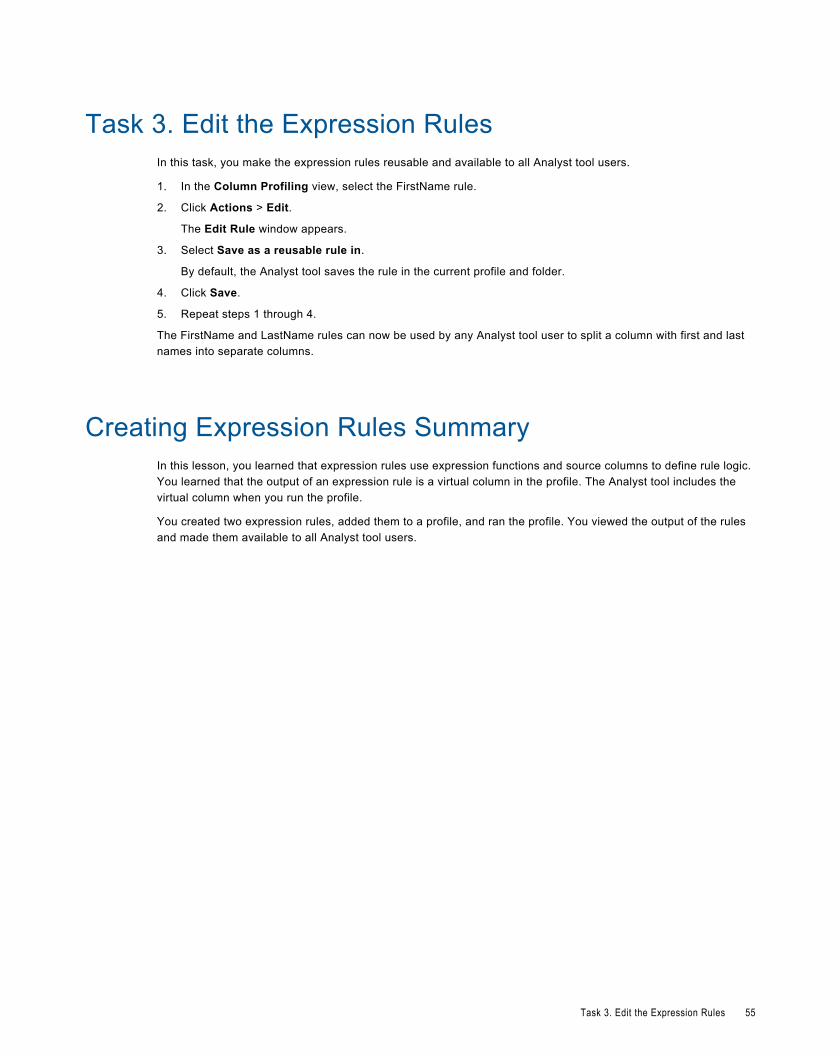
Task 3. Edit the Expression RulesIn this task, you make the expression rules reusable and available to all Analyst tool users.
1. In the Column Profiling view, select the FirstName rule.
2. Click Actions > Edit.
The Edit Rule window appears.
3. Select Save as a reusable rule in.
By default, the Analyst tool saves the rule in the current profile and folder.
4. Click Save.
5. Repeat steps 1 through 4.
The FirstName and LastName rules can now be used by any Analyst tool user to split a column with first and lastnames into separate columns.
Creating Expression Rules SummaryIn this lesson, you learned that expression rules use expression functions and source columns to define rule logic.You learned that the output of an expression rule is a virtual column in the profile. The Analyst tool includes thevirtual column when you run the profile.
You created two expression rules, added them to a profile, and ran the profile. You viewed the output of the rulesand made them available to all Analyst tool users.
Task 3. Edit the Expression Rules 55

C H A P T E R 1 1
Lesson 6. Creating and RunningScorecards
This chapter includes the following topics:
¨ Creating and Running Scorecards Overview, 56
¨ Task 1. Create a Scorecard from the Profile Results, 57
¨ Task 2. Run the Scorecard, 58
¨ Task 3. View the Scorecard, 58
¨ Task 4. Edit the Scorecard, 58
¨ Task 5. Configure Thresholds, 59
¨ Task 6. View Score Trend Charts, 59
¨ Creating and Running Scorecards Summary, 59
Creating and Running Scorecards OverviewA scorecard is the graphical representation of valid values for a column or the output of a rule in profile results.Use scorecards to measure and monitor data quality progress over time.
To create a scorecard, you add columns from the profile to a scorecard and configure the score thresholds. To runa scorecard, you select the valid values for the column and run the scorecard to see the scores for the columns.
Scorecards display the value frequency for columns in a profile as scores. Scores reflect the percentage of validvalues for a column.
StoryHypoStores wants to incorporate data from the newly-acquired Los Angeles office into its data warehouse. Beforethey merge the data they want to make sure that the data in different customer tiers and states is analyzed fordata quality. You are the analyst who is responsible for monitoring the progress of performing the data qualityanalysis You want to create a scorecard from the customer tier and state profile columns, configure thresholds fordata quality, and view the score trend charts to determine how the scores improve over time.
ObjectivesIn this lesson, you will complete the following tasks:
1. Create a scorecard from the results of the Profile_LA_Customers_Custom profile to view the scores for theCustomerTier and State columns.
56

2. Run the scorecard to generate the scores for the CustomerTier and State columns.
3. View the scorecard to see the scores for each column.
4. Edit the scorecard to specify different valid values for the scores.
5. Configure score thresholds and run the scorecard.
6. View score trend charts to determine how scores improve over time.
PrerequisitesBefore you start this lesson, verify the following prerequisite:
¨ You have completed lessons 1 through 5 in this tutorial.
TimingSet aside 15 minutes to complete the tasks in this lesson.
Task 1. Create a Scorecard from the Profile ResultsIn this task, you create a scorecard from the Profile_LA_Customers_Custom profile to score the CustomerTier andState column values.
1. Open the Profile_LA_Customers_Custom profile.
2. Click Actions > Add to Scorecard.
The Add to Scorecard wizard appears.
3. Select the CustomerTier and the State columns to add to the scorecard.
4. Click Next.
5. Click New to create a scorecard.
The New Scorecard window appears.
6. Enter sc_LA_Customer for the scorecard name, and navigate to the Customers folder for the scorecardlocation.
7. Click OK and click Next.
8. Select the CustomerTier score in the Scores panel and select the Is Valid column for all values in the Scoreusing: Values panel.
9. Select the State score in the Scores panel and select the Is Valid column for those values that have twoletter state codes in the Score using: Values panel.
10. For each score in the Scores panel, accept the default settings for the score thresholds in Score Settingspanel.
11. Click Finish.
Task 1. Create a Scorecard from the Profile Results 57

Task 2. Run the ScorecardIn this task, you run the sc_LA_Customer scorecard to generate the scores for the CustomerTier and Statecolumns.
1. Click the sc_LA_Customer scorecard to open it.
The scorecard appears in a tab.
2. Click Actions > Run Scorecard.
The Scorecard view displays the scores for the CustomerTier and State columns.
Task 3. View the ScorecardIn this task, you view the sc_LA_Customer scorecard to see the scores for the CustomerTier and State columns.
1. Select the State column that contains the State score you want to view.
2. Click Actions > Show Rows.
The valid scores for the State column appear in the Valid view. Click Invalid to view the invalid scores for theState column. In the Scores panel, you can view the score name and score percentage. You can view thescore displayed as a bar, the data object of the score, and the source and source type of the score.
3. Repeat steps 1 through 2 for the CustomerTier column.
All scores for the CustomerTier column are valid.
Task 4. Edit the ScorecardIn this task, you will edit the sc_LA_Customer scorecard to specify the Ruby value as not valid for theCustomerTier score.
1. Click Actions > Edit.
The Edit Scorecard window appears.
2. Select the CustomerTier score in the Scores panel.
3. In the Score using: Values panel, clear Ruby from the Is Valid column.
Accept the default settings in the Score Settings panel.
4. Click Save to save the changes to the scorecard and run it.
5. View the CustomerTier score again.
58 Chapter 11: Lesson 6. Creating and Running Scorecards

Task 5. Configure ThresholdsIn this task, you configure thresholds for the State score in the sc_LA_Customer scorecard to determine theacceptable ranges for the data in the State column. Values with a two letter code, such as CA are acceptable, andcodes with more than two letters such as Calif are not acceptable.
1. In the Edit Scorecard window, select the State score in the Scores panel.
2. In the Score Settings panel, enter the following ranges for the Good and Unacceptable scores in SetCustom Thresholds for this Score: 90 to 100% Good; 0 to 50% Unacceptable. 51% to 89% are Acceptable.
The thresholds represent the lower bounds of the acceptable and good ranges.
3. Click Save to save the changes to the scorecard and run it.
In the Scores panel, view the changes to the score percentage and the score displayed as a bar for the Statescore.
Task 6. View Score Trend ChartsIn this task, you view the trend chart for the State score. You can view trend charts to monitor scores over time.
1. In the Navigator, select the Customers folder in your tutorial project.
2. Click the sc_LA_Customer scorecard to open it.
The scorecard appears in a tab.
3. In the Scorecard view, select the State score.
4. Click Actions > Show Trend Chart.
The Trend Chart Detail window appears. You can view the Good, Acceptable, and Unacceptable thresholdsfor the score. The thresholds change each time you run the scorecard after editing the values for scores in thescorecard.
Creating and Running Scorecards SummaryIn this lesson, you learned that you can create a scorecard from the results of a profile. A scorecard contains thecolumns from a profile. You learned that you can run a scorecard to generate scores for columns. You edited ascorecard to configure valid values and set thresholds for scores. You also learned how to view the score trendchart.
You created a scorecard from the CustomerTier and State columns in a profile to analyze data quality for thecustomer tier and state columns. You ran the scorecard to generate scores for each column. You edited thescorecard to specify different valid values for scores. You configured thresholds for a score and viewed the scoretrend chart.
Task 5. Configure Thresholds 59

C H A P T E R 1 2
Lesson 7. Creating ReferenceTables from Profile Columns
This chapter includes the following topics:
¨ Creating Reference Tables from Profile Columns Overview, 60
¨ Task 1. Create a Reference Table from Profile Columns, 61
¨ Task 2. Edit the Reference Table, 62
¨ Creating Reference Tables from Profile Columns Summary, 62
Creating Reference Tables from Profile ColumnsOverview
A reference table contains reference data that you can use to standardize source data. Reference data caninclude valid and standard values. Create reference tables to establish relationships between source data valuesand the valid and standard values.
You can create a reference table from the results of a profile. After you create a reference table, you can edit thereference table to add columns or rows and add or edit standard and valid values. You can view the changesmade to a reference table in an audit trail.
StoryHypoStores wants to profile the data to uncover anomalies and standardize the data with valid values. You are theanalyst who is responsible for standardizing the valid values in the data. You want to create a reference tablebased on valid values from profile columns.
ObjectivesIn this lesson, you complete the following tasks:
1. Create a reference table from the CustomerTier column in the Profile_LA_Customers_Custom profile byselecting valid values for columns.
2. Edit the reference table to configure different valid values for columns.
PrerequisitesBefore you start this lesson, verify the following prerequisite:
¨ You have completed lessons 1 through 6 in this tutorial.
60

TimingSet aside 15 minutes to complete the tasks in this lesson.
Task 1. Create a Reference Table from Profile ColumnsIn this task, you create a reference table and add the CustomerTier column from theProfile_LA_Customers_Custom profile to the reference table.
1. Click the Profile_LA_Customers_Custom profile.
The profile appears in a tab.
2. In the Column Profiling view, select the CustomerTier column that you want to add to the reference table.
You can drill down on the value and pattern frequencies for the CustomerTier column to inspect records thathave non-standard customer category values.
3. In the Values view, select the valid customer tier values you want to add. Use the CONTROL or SHIFT keysto select the following multiple values: Diamond, Gold, Silver, Bronze, Emerald.
4. Click Actions > Add to Reference Table.
The New Reference Table wizard appears.
5. Select the option to Create a new reference table.
6. Click Next.
7. Enter Reftab_CustTier_HypoStores as the table name.
8. Enter a description and set 0 as the default value.
The Analyst tool uses the default value for any table record that does not contain a value.
9. Click Next.
10. In the Column Attributes panel, configure the following column properties for the CustomerTier column:
Property Description
Name CustomerTier
Datatype String
Precision 10
Scale 0
Description Reference customer tier values
11. Optionally, choose to create a description column for rows in the reference table. Enter the name andprecision for the column.
12. Preview the CustomerTier column values in the Preview panel.
13. Click Next.
The Reftab_CustomerTier_HypoStores reference table name appears. You can enter an optional description.
14. In the Save in panel, select your tutorial project where you want to create the reference table.
The Reference Tables: panel lists the reference tables in the location you select.
Task 1. Create a Reference Table from Profile Columns 61

15. Enter an optional audit note.
16. Click Finish.
Task 2. Edit the Reference TableIn this task, you edit the Reftab_CustomerTier_HypoStores table to add alternate values for the customer tiers.
1. In the Navigator, select the Customers folder in your tutorial project.
2. Click the Reftab_CustomerTier_HypoStores reference table.
The reference table opens in a tab.
3. To edit a row, select the row and click Actions > Editor click the Edit icon.
The Edit Row window appears. Optionally, select multiple rows to add the same alternate value to each row.
4. Enter the following alternate values for the Diamond, Emerald, Gold, Silver, and Bronze rows: 1, 2, 3, 4, 5.
Enter an optional audit note.
5. Click Apply to apply the changes.
Creating Reference Tables from Profile ColumnsSummary
In this lesson, you learned how to create reference tables from the results of a profile to configure valid values forsource data.
You created a reference table from a profile column by selecting valid values for columns. You edited thereference table to configure different valid values for columns.
62 Chapter 12: Lesson 7. Creating Reference Tables from Profile Columns

C H A P T E R 1 3
Lesson 8. Creating ReferenceTables
This chapter includes the following topics:
¨ Creating Reference Tables Overview, 63
¨ Task 1. Create a Reference Table, 64
¨ Creating Reference Tables Summary, 64
Creating Reference Tables OverviewA reference table contains reference data that you can use to standardize source data. Reference data caninclude valid and standard values. Create reference tables to establish relationships between the source datavalues and the valid and standard values.
You can manually create a reference table using the reference table editor. Use the reference table to define andstandardize the source data. You can share the reference table with a developer to use in Standardizer andLookup transformations in the Developer tool.
StoryHypoStores wants to standardize data with valid values. You are the analyst who is responsible for standardizingthe valid values in the data. You want to create a reference table to define standard customer tier codes thatreference the LA customer data. You can then share the reference table with a developer.
ObjectivesIn this lesson, you complete the following task:
¨ Create a reference table using the reference table editor to define standard customer tier codes that referencethe LA customer data.
PrerequisitesBefore you start this lesson, verify the following prerequisite:
¨ You have completed lessons 1 and 2 in this tutorial.
TimingSet aside 10 minutes to complete the task in this lesson.
63

Task 1. Create a Reference TableIn this task, you will create the Reftab_CustomerTier_Codes reference table to standardize the valid values for thecustomer tier data.
1. in the Navigator, select the Customer folder in your tutorial project where you want to create the referencetable.
2. Click Actions > New Reference Table.
The New Reference Table wizard appears.
3. Select the option to Use the reference table editor.
4. Click Next.
5. Enter the Reftab_CustomerTier_Codes as the table name and enter an optional description and set thedefault value of 0.
The Analyst tool uses the default value for any table record that does not contain a value.
6. For each column you want to include in the reference table, click the Add New Column icon and configurethe column properties for each column.
Add the following column names: CustomerID, CustomerTier, and Status. You can reorder the columns ordelete columns.
7. Click Finish.
8. Open the Reftab_CustomerTier_Codes reference table and click Actions > Add Row to populate eachreference table column with four values.
CustomerID = LA1, LA2, LA3, LA4
CustomerTier = 1, 2, 3, 4, 5.
Status= Active, Inactive
Creating Reference Tables SummaryIn this lesson, you learned how to create reference tables using the reference table editor to create standard validvalues to use with source data.
You created a reference table using the reference table editor to standardize the customer tier values for the LAcustomer data.
64 Chapter 13: Lesson 8. Creating Reference Tables

Part III: Getting Started withInformatica Developer (DataQuality)
This part contains the following chapters:
¨ Lesson 1. Setting Up Informatica Developer, 66
¨ Lesson 2. Importing Physical Data Objects, 70
¨ Lesson 3. Profiling Data, 74
65

C H A P T E R 1 4
Lesson 1. Setting Up InformaticaDeveloper
This chapter includes the following topics:
¨ Setting Up Informatica Developer Overview, 66
¨ Task 1. Start Informatica Developer, 67
¨ Task 2. Add a Domain, 67
¨ Task 3. Add a Model Repository, 68
¨ Task 4. Create a Project, 68
¨ Task 5. Create a Folder, 68
¨ Task 6. Select a Default Data Integration Service, 69
¨ Setting Up Informatica Developer Summary, 69
Setting Up Informatica Developer OverviewBefore you start the lessons in this tutorial, you must start and set up the Developer tool. To set up the Developertool, you add a domain. You add a Model repository that is in the domain, and you create a project and folder tostore your work. You also select a default Data Integration Service.
The Informatica domain is a collection of nodes and services that define the Informatica environment. Services inthe domain include the Model Repository Service and the Data Integration Service.
The Model Repository Service manages the Model repository. The Model repository is a relational database thatstores the metadata for projects that you create in the Developer tool. A project stores objects that you create inthe Developer tool. A project can also contain folders that store related objects, such as objects that are part of thesame business requirement.
The Data Integration Service performs data integration tasks in the Developer tool.
ObjectivesIn this lesson, you complete the following tasks:
¨ Start the Developer tool and go to the Developer tool workbench.
¨ Add a domain in the Developer tool.
¨ Add a Model repository so that you can create a project.
¨ Create a project to store the objects that you create in the Developer tool.
66

¨ Create a folder in the project that can store related objects.
¨ Select a default Data Integration Service to perform data integration tasks.
PrerequisitesBefore you start this lesson, verify the following prerequisites:
¨ You have installed the Developer tool.
¨ You have a domain name, host name, and port number to connect to a domain. You can get this informationfrom a domain administrator.
¨ A domain administrator has configured a Model Repository Service in the Administrator tool.
¨ You have a user name and password to access the Model Repository Service. You can get this informationfrom a domain administrator.
¨ A domain administrator has configured a Data Integration Service.
¨ The Data Integration Service is running.
TimingSet aside 5 to 10 minutes to complete the tasks in this lesson.
Task 1. Start Informatica DeveloperStart the Developer tool to begin the tutorial.
1. Select Start > Programs > Informatica [version] > Client > Developer Client > Launch InformaticaDeveloper from the Windows Start menu.
The Welcome page of the Developer tool appears.
2. Click the Workbench button.
The Developer tool workbench appears.
Task 2. Add a DomainIn this task, you add a domain in the Developer tool to access a Model repository.
1. Click Window > Preferences.
The Preferences dialog box appears.
2. Select Informatica > Domains.
3. Click Add.
The New Domain dialog box appears.
4. Enter the domain name, host name, and port number.
5. Click Finish.
6. Click OK.
Task 1. Start Informatica Developer 67

Task 3. Add a Model RepositoryIn this task, you add the Model repository that you want to use to store projects and folders.
1. Click File > Connect to Repository.
The Connect to Repository dialog box appears.
2. Click Browse to select a Model Repository Service.
3. Click OK.
4. Click Next.
5. Enter your user name and password.
6. Click Finish.
The Model repository appears in the Object Explorer view.
Task 4. Create a ProjectIn this task, you create a project to store objects that you create in the Developer tool. You can create one projectfor all tutorials in this guide.
1. In the Object Explorer view, select a Model Repository Service.
2. Click File > New > Project.
The New Project dialog box appears.
3. Enter your name prefixed by "Tutorial_" as the name of the project.
4. Click Finish.
The project appears under the Model Repository Service in the Object Explorer view.
Task 5. Create a FolderIn this task, you create a folder to store related objects. You can create one folder for all tutorials in this guide.
1. In the Object Explorer view, select the project that you want to add the folder to.
2. Click File > New > Folder.
3. Enter a name for the folder.
4. Click Finish.
The Developer tool adds the folder under the project in the Object Explorer view. Expand the project to seethe folder.
68 Chapter 14: Lesson 1. Setting Up Informatica Developer
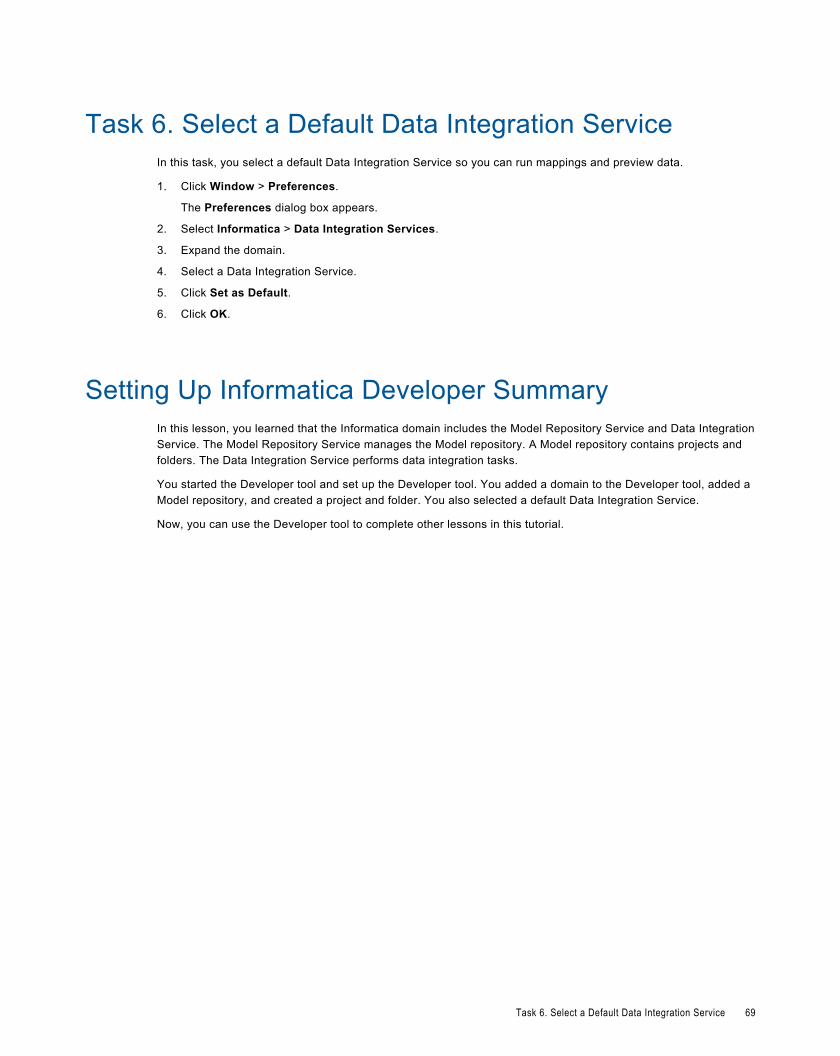
Task 6. Select a Default Data Integration ServiceIn this task, you select a default Data Integration Service so you can run mappings and preview data.
1. Click Window > Preferences.
The Preferences dialog box appears.
2. Select Informatica > Data Integration Services.
3. Expand the domain.
4. Select a Data Integration Service.
5. Click Set as Default.
6. Click OK.
Setting Up Informatica Developer SummaryIn this lesson, you learned that the Informatica domain includes the Model Repository Service and Data IntegrationService. The Model Repository Service manages the Model repository. A Model repository contains projects andfolders. The Data Integration Service performs data integration tasks.
You started the Developer tool and set up the Developer tool. You added a domain to the Developer tool, added aModel repository, and created a project and folder. You also selected a default Data Integration Service.
Now, you can use the Developer tool to complete other lessons in this tutorial.
Task 6. Select a Default Data Integration Service 69

C H A P T E R 1 5
Lesson 2. Importing Physical DataObjects
This chapter includes the following topics:
¨ Importing Physical Data Objects Overview, 70
¨ Task 1. Import the Boston_Customers Flat File Data Object, 71
¨ Task 2. Import the LA_Customers Flat File Data Object, 71
¨ Task 3. Importing the All_Customers Flat File Data Object, 72
¨ Importing Physical Data Objects Summary, 73
Importing Physical Data Objects OverviewA physical data object is a representation of data based on a flat file or relational database table. You can import aflat file or relational database table as a physical data object to use as a source or target in a mapping.
StoryHypoStores Corporation stores customer data from the Los Angeles office and Boston office in flat files. You wantto work with this customer data in the Developer tool. To do this, you need to import each flat file as a physicaldata object.
ObjectivesIn this lesson, you import flat files as physical data objects. You also set the source file directory so that the DataIntegration Service can read the source data from the correct directory.
PrerequisitesBefore you start this lesson, verify the following prerequisite:
¨ You have completed lesson 1 in this tutorial.
TimingSet aside 10 to 15 minutes to complete the tasks in this lesson.
70

Task 1. Import the Boston_Customers Flat File DataObject
In this task, you import a physical data object from a file that contains customer data from the Boston office.
1. In the Object Explorer view, select the tutorial project.
2. Click File > New > Data Object.
The New dialog box appears.
3. Select Physical Data Objects > Flat File Data Objectand click Next.
The New Flat File Data Object dialog box appears.
4. Select Create from an Existing Flat File.
5. Click Browse and navigate to Boston_Customers.csv in the following directory: <Informatica InstallationDirectory>\clients\DeveloperClient\Tutorials
6. Click Open.
The wizard names the data object Boston_Customers.
7. Click Next.
8. Verify that the code page is MS Windows Latin 1 (ANSI), superset of Latin 1.
9. Verify that the format is delimited.
10. Click Next.
11. Verify that the delimiter is set to comma.
12. Select Import column names from first line.
13. Click Finish.
The Boston_Customers physical data object appears under Physical Data Objects in the tutorial project.
14. Click the Read view and select the Output transformation.
15. Click the Runtime tab on the Properties view.
16. Set the Source File Directory to the following directory on the Data Integration Service machine: <InformaticaInstallation Directory>\server\Tutorials
17. Click File > Save.
Task 2. Import the LA_Customers Flat File Data ObjectIn this task, you import a physical data object from a flat file that contains customer data from the Los Angelesoffice.
1. In the Object Explorer view, select the tutorial project.
2. Click File > New > Data Object.
The New dialog box appears.
3. Select Physical Data Objects > Flat File Data Object and click Next.
The New Flat File Data Object dialog box appears.
4. Select Create from an Existing Flat File.
Task 1. Import the Boston_Customers Flat File Data Object 71

5. Click Browse and navigate to LA_Customers.csv in the following directory: <Informatica Installation Directory>\clients\DeveloperClient\Tutorials
6. Click Open.
The wizard names the data object LA_Customers.
7. Click Next.
8. Verify that the code page is MS Windows Latin 1 (ANSI), superset of Latin 1.
9. Verify that the format is delimited.
10. Click Next.
11. Verify that the delimiter is set to comma.
12. Select Import column names from first line.
13. Click Finish.
The LA_Customers physical data object appears under Physical Data Objects in the tutorial project.
14. Click the Read view and select the Output transformation.
15. Click the Runtime tab on the Properties view.
16. Set the Source File Directory to the following directory on the Data Integration Service machine: <InformaticaInstallation Directory>\server\Tutorials
17. Click File > Save.
Task 3. Importing the All_Customers Flat File DataObject
In this task, you import a physical data object from a flat file that combines the customer order data from the LosAngeles and Boston offices.
1. In the Object Explorer view, select the tutorial project.
2. Click File > New > Data Object.
The New dialog box appears.
3. Select Physical Data Objects > Flat File Data Object and click Next.
The New Flat File Data Source dialog box appears.
4. Select Create from an Existing Flat File.
5. Click Browse and navigate to All_Customers.csv in the following directory: <Informatica Installation Directory>\clients\DeveloperClient\Tutorials.
6. Click Open.
The wizard names the data object All_Customers.
7. Click Next.
8. Verify that the code page is MS Windows Latin 1 (ANSI), superset of Latin 1.
9. Verify that the format is delimited.
10. Click Next.
11. Verify that the delimiter is set to comma.
12. Select Import column names from first line.
72 Chapter 15: Lesson 2. Importing Physical Data Objects

13. Click Finish.
The All_Customers physical data object appears under Physical Data Objects in the tutorial project.
14. Click the Read view and select the Output transformation.
15. Click the Runtime tab on the Properties view.
16. Set the Source File Directory to the following directory on the Data Integration Service machine: <InformaticaInstallation Directory>\server\Tutorials
17. Click File > Save.
Importing Physical Data Objects SummaryIn this lesson, you learned that physical data objects are representations of data based on a flat file or a relationaldatabase table.
You created physical data objects from flat files. You also set the source file directory so that the Data IntegrationService can read the source data from the correct directory.
You use the data objects as mapping sources in the data quality lessons.
Importing Physical Data Objects Summary 73

C H A P T E R 1 6
Lesson 3. Profiling DataThis chapter includes the following topics:
¨ Profiling Data Overview, 74
¨ Task 1. Perform a Join Analysis on Two Data Sources, 75
¨ Task 2. View Join Analysis Results, 76
¨ Task 3. Run a Profile on a Data Source, 76
¨ Task 4. View Column Profiling Results, 76
¨ Profiling Data Summary, 77
Profiling Data OverviewA profile is a set of metadata describing the content and structure of a dataset.
Data profiling is often the first step in a project. You can run a profile to evaluate the structure of data and verifythat data columns are populated with the types of information you expect. If a profile reveals problems in data, youcan define steps in your project to fix those problems. For example, if a profile reveals that a column containsvalues of greater than expected length, you can design data quality processes to remove or fix the problem values.
A profile provides the following facts about data:
¨ The number of unique and null values in each column, expressed as a number and a percentage.
¨ The patterns of data in each column, and the frequencies with which these values occur.
¨ Statistics about the column values, such as the maximum and minimum lengths of values and the first and lastvalues in each column.
¨ For join analysis profiles, the degree of overlap between two data columns, displayed as a Venn diagram andas a percentage value. Use join analysis profiles to identify possible problems with column join conditions.
You can run a profile at any stage in a project to measure data quality and to verify that changes to the data meetyour project objectives. You can run a profile on a transformation in a mapping to indicate the effect that thetransformation will have on data.
StoryHypoStores wants to verify that customer data is free from errors, inconsistencies, and duplicate information.Before HypoStores designs the processes to deliver the data quality objectives, it needs to measure the quality ofits source data files and confirm that the data is ready to process.
74

ObjectivesIn this lesson, you complete the following tasks:
¨ Perform a join analysis on the Boston_Customers data source and the LA_Customers data source.
¨ View the results of the join analysis to determine whether or not you can successfully merge data from the twooffices.
¨ Run a profile on the All_Customers data source.
¨ View the column profiling results to observe the values and patterns contained in the data.
PrerequisitesBefore you start this lesson, verify the following prerequisite:
¨ You have completed lessons 1 and 2 in this tutorial.
Time Required¨ Set aside 20 minutes to complete this lesson.
Task 1. Perform a Join Analysis on Two Data SourcesIn this task, you perform a join analysis on the Boston_Customers and LA_Customers data sources to view thejoin conditions.
1. In the Object Explorer view, browse to the data objects in your tutorial project.
2. Select the Boston_Customers and LA_Customers data sources.
Tip: Hold down the Shift key to select multiple data objects.
3. Click File > New > Profile.
The New Profile window opens.
4. In the Name field, enter JoinAnalysis.
5. Click Next.
6. Clear all column selections by clicking the check boxes next to the Boston_Customers data source and theLA_Customers data source.
7. Select the CustomerID column in both data sources.
8. Click Next.
9. Click Add to add join conditions.
The Join Condition window opens.
10. In the Columns section, click the New button.
11. Double-click the first row in the left column and select CustomerID.
12. Double-click the first row in the right column and select CustomerID.
13. Click OK.
14. Click Finish.
The JoinAnalysis profile opens in the editor and the profile runs.
Task 1. Perform a Join Analysis on Two Data Sources 75

Task 2. View Join Analysis ResultsIn this task, you view the join analysis results in the Results view of the JoinAnalysis profile.
1. Click Window > Show View > Progress to view the progress of the JoinAnalysis profile.
The Progress view opens.
2. When the Progress view reports that the JoinAnalysis profile finishes running, click the Results view in theeditor.
3. In the Join Profile section, click the first row.
The Details section displays a Venn diagram and a key that details the results of the join analysis.
4. Verify that the Join entry in the key reports a 0% join.A 0% join indicates that none of the CustomerID fields are duplicates, suggesting you can successfully mergethe two data sources.
5. To view the CustomerID values for the LA_Customers data object, double-click the circle labeledLA_Customers in the Venn diagram.
Tip: Double-click the circles in the Venn diagram to view the data rows described by these items. In caseswhere circles intersect in the Venn diagram, double-click the intersection to view data values common to bothdata sets.
The Data Viewer displays the CustomerID values contained in the LA_Customers data object.
Task 3. Run a Profile on a Data SourceIn this task, you run a profile on the All_Customers data source to view the content and structure of the data.
1. In the Object Explorer view, browse to the data objects in your tutorial project.
2. Select the All_Customers data source.
3. Click File > New > Profile.
The New Profile window opens.
4. In the Name field, enter All_Customers.
5. Click Finish.
The All_Customers profile opens in the editor and the profile runs.
Task 4. View Column Profiling ResultsIn this task, you view the column profiling results for the All_Customers data object and examine the values andpatterns contained in the data.
1. Click Window > Show View > Progress to view the progress of the All_Customers profile.
The Progress view opens.
2. When the Progress view reports that the All_Customers profile finishes running, click the Results view in theeditor.
3. In the Column Profiling section, click the CustomerTier column.
76 Chapter 16: Lesson 3. Profiling Data

The Details section displays all values contained in the CustomerTier column and displays information abouthow frequently the values occur in the dataset.
4. In the Details section, double-click the value Ruby.
The Data Viewer runs and displays the records where the CustomerTier column contains the value Ruby.
5. In the Column Profiling section, click the OrderAmount column.
6. In the Details section, click the Show list and select Patterns.
The Details section shows the patterns found in the OrderAmount column. The string 9(5) in the Patterncolumn refers to records that contain five-figure order amounts. The string 9(4) refers to records containingfour-figure amounts.
7. In the Pattern column, double-click the string 9(4).
The Data Viewer runs and displays the records where the OrderAmount column contains a four-figure orderamount.
8. In the Details section, click the Show list and select Statistics.
The Details section shows statistics for the OrderAmount column, including the average value, the standarddeviation, maximum and minimum lengths, the five most common values, and the five least common values.
Profiling Data SummaryIn this lesson, you learned that a profile provides information about the content and structure of the data.
You learned that you can perform a join analysis on two data objects and view the degree of overlap between thedata objects. You also learned that you can run a column profile on a data object and view values, patterns, andstatistics that relate to each column in the data object.
You created the JoinAnalysis profile to determine whether data from the Boston_Customers data object can mergewith the data in the LA_Customers data object. You viewed the results of this profile and determined that all valuesin the CustomerID column are unique and that you can merge the data objects successfully.
You created the All_Customers profile and ran a column profile on the All_Customers data object. You viewed theresults of this profile to discover values, patterns, and statistics for columns in the All_Customers data object.Finally, you ran the Data Viewer to view rows containing values and patterns that you selected, enabling you toverify the quality of the data.
Profiling Data Summary 77

I N D E X
Aadding columns to a scorecard
scorecards 24adding profile comments
profile comments 17applying a predefined rule
rules 10
Ccolumn patterns
profile results 15column properties
reference tables 32column statistics
profile results 16column values
profile results 15configuring
profiles 9rules 9
creating a custom profileprofiles 5
creating a groupscorecards 27
creating a quick profileprofiles 4
creating a reference table from column patternsreference tables 35
creating a reference table from column valuesreference tables 34
creating a reference table from profile columnsreference tables 33
creating a reference table manuallyreference tables 33
creating an expression rulerules 12
Ddefining thresholds
scorecards 26deleting a group
scorecards 28drilldown columns
scorecards 25
Eediting a group
scorecards 27
editing a scorecardscorecards 26
exportobjects 20overview 19XML file 20
exporting a reference tablereference tables 38
exporting profile resultsprofiles 17
Ffinding and replacing valyes
reference tables 37flat file properties
reference tables 32
Iimport
objects 21overview 19XML file 20
importing a reference tablereference tables 36
Mmanaging columns
reference tables 36managing rows
reference tables 37mapplets
rules 12validating 13
moving scoresscorecards 27
Ppreviewing a table or file
profile results 17profile comments
adding profile comments 17profiles 17viewing profile comments 17
profile resultscolumn patterns 15column statistics 16column values 15previewing a table or file 17
78

profile summary 14viewing profile results 6, 16
profile summaryprofile results 14
profilesconfiguring 9creating a custom profile 5creating a quick profile 4exporting profile results 17profile comments 17running a profile 5
Profilesprofile results 14
Rreference tables
column properties 32creating a reference table from column patterns 35creating a reference table from column values 34creating a reference table from profile columns 33creating a reference table manually 33exporting a reference table 38finding and replacing values 37flat file properties 32importing a reference table 36managing columns 36managing rows 37viewing audit trail tables 39
rulesapplying a predefined rule 10configuring 9creating an expression rule 12
running a profileprofiles 5
running a scorecardscorecards 24
Sscorecards
adding columns to a scoredard 24creating a group 27defining thresholds 26deleting a group 28drilldown columns 25editing a group 27editing a scorecard 26moving scores 27running a scorecard 24viewing a scorecard 25viewing trend charts 28
Vviewing a scorecard
scorecards 25viewing audit table events
reference tables 39viewing profile comments
profile comments 17viewing profile results
profile results 6, 16viewing trend charts
scorecards 28
Index 79


![Data Profiling Guide - start [Gerardnico] · PDF fileData Profiling Guide. Informatica PowerCenter Data Profiling Guide ... available at http:](https://static.documents.pub/doc/80x56/5aa4fb3a7f8b9ab4788c93d6/data-profiling-guide-start-gerardnico-profiling-guide-informatica-powercenter.jpg)

