FANTA I I I FOOD AND NUTRITION TECHNICAL ASSISTANCE Data Quality Assessment (DQA) for the Partnership for HIV-Free Survival (PHFS) Report: Uganda May 2015 THE REPUBLIC OF UGANDA MINISTRY OF HEALTH
Transcript
FANTA IIIF O O D A N D N U T R I T I O NT E C H N I C A L A S S I S TA N C E
Data Quality Assessment (DQA) for the Partnership for HIV-Free Survival (PHFS)
Report: Uganda
May 2015
THE rEpublic of uGANDAMINISTRY OF HEALTH
THE REPUBLIC OF UGANDAMINISTRY OF HEALTH
This report is made possible by the generous support of the American people through the support of the Office of Health, Infectious Diseases, and Nutrition, Bureau for Global Health, U.S. Agency for International Development (USAID), USAID Uganda, and the U.S. President’s Emeregency Plan for AIDS Relief (PEPFAR), under terms of Cooperative Agreement No. AID-OAA-A-12-00005, through the Food and Nutrition Technical Assistance III Project (FANTA), managed by FHI 360. The contents are the responsibility of FHI 360 and do not necessarily reflect the views of USAID or the United States Government.
Recommended Citation
The Ministry of Health. 2015. Data Quality Assessment (DQA) for the Partnership for HIV-Free Survival (PHFS) Report: Uganda. Contact
Ministry of Health Plot 6, Lourdel Road, Nakasero P.O. Box 7272, Kampala, Uganda T 256-340874/23563/9 Telefax 256- 231584 Telex 256-61372 HEALTH UGA [email protected] www.health.go.ug Publisher
Food and Nutrition Technical Assistance III Project (FANTA) FHI 360 1825 Connecticut Avenue, NW Washington, DC 20009-5721 T 202-884-8000 F 202-884-8432 [email protected] www.fantaproject.org
i
Acknowledgments
The Ministry of Health would like to sincerely thank all the stakeholders that participated in all the
activities that culminated in this report. Special thanks are extended to the U.S. Agency for International
Development for the continued material and technical support. We are also indebted to the Institute for
Healthcare Improvement, the U.S. President’s Emergency Plan for AIDS Relief, the U.S. Centers for
Disease Control and Prevention, and MEASURE for their support for the Partnership for HIV-Free
Survival (PHFS) initiative.
We extend our sincere gratitude to all PHFS implementing partners including the Food and Nutrition
Technical Assistance III (FANTA) Project; The AIDS Support Organization (TASO); the
Strengthening Partnerships Results and Innovations in Nutrition Globally (SPRING) Project; the
Applying Science to Strengthen and Improve Systems Project (ASSIST); and the Strengthening TB and
HIV/AIDS Responses in East Central Region of Uganda (STAR-EC) and Strengthening TB and
HIV/AIDS Responses in Southwest Region of Uganda (STAR-SW) Projects, as well as community
members who participated in the survey and field testing of the tools and the PHFS Monitoring and
Evaluation technical working groups and review committees for their contributions from the time of
inception of the indicators through the data collection processes.
Table 1. Health Facilities Assessed by Facility Level and District ......................................................... 5
Table 2. Selected PHFS Indicators for Data Quality Assessment .......................................................... 6
Table 3. Criteria for Assessing the M&E System Components .............................................................. 7
Table 4. Availability and Completeness of Registers and Accuracy of Reported Data by Facility
Type ...................................................................................................................................................... 11
Table 5a. District Level Functioning of the M&E System ................................................................... 12
Table 5b. District Level Functioning of the M&E System ................................................................... 13
Table 5c. District Level Functioning of the M&E System ................................................................... 13
Table 6. Health-facility-level functioning of the M&E System ............................................................ 14
iii
LIST OF FIGURES
Figure 1. Map of Uganda Showing the Six Districts for PHFS Intervention.......................................... 2
Figure 2. Deviation between Reported and Observed Data on Two ART Indicators ............................. 9
Figure 3. Availability and Completeness of Registers and Accuracy of Data Reported ..................... 10
Figure 4. Overall Functioning of the M&E System in the 42 Health Facilities .................................... 12
iv
Abbreviations and Acronyms
AIDS Acquired Immunodeficiency Syndrome
ANC Antenatal Care
ART Antiretroviral Therapy
ARV Antiretroviral
ASSIST Applying Science to Strengthen and Improve Systems Project
CDC U.S. Centers for Disease Control and Prevention
DQA Data Quality Assessment
EID Early Infant Diagnosis
eMTCT Elimination of Mother-to-Child Transmission of HIV
FANTA Food and Nutrition Technical Assistance III Project
HCIII Health Center Level III
HCIV Health Center Level IVHIV
HIV Human Immunodeficiency Virus
HMIS Health Management Information System
IYCF Infant and Young Child Feeding
M&E Monitoring and Evaluation
MOH Ministry of Health
NACS Nutrition Assessment, Counseling, and Support
OTC Outpatient Therapeutic Care
PCR Polymerase Chain Reaction
PHFS Partnership for HIV-Free Survival
PMTCT Prevention of Mother-to-Child Transmission of HIV
QI Quality Improvement
RDQA Routine Data Quality Assessment
SPRING Strengthening Partnerships, Results and Innovations in Nutrition Globally
STAR-EC Strengthening TB & HIV/AIDS Responses in East Central Region of Uganda
STAR-SW Strengthening TB and HIV/AIDS Responses in Southwest Region of Uganda
TASO The AIDS Support Organization
TF/SF Therapeutic or Supplementary Feeding Support
USAID U.S. Agency for International Development
WHO World Health Organization
1
1 Introduction
The Ministry of Health (MOH), together with U.S. Agency for International Development (USAID)
partners (USAID/SPRING, USAID/ASSIST, FANTA, STAR-EC, STAR-SW and DLG), have been
implementing the Partnership for HIV Free Survival (PHFS) since April 2013. The initiative employs
the nutrition assessment, counseling and support (NACS) framework to integrate nutrition into routine
health service delivery both at the facility and community level. The set of interventions encompasses
quality improvement (QI) methods to implement the 2010 World Health Organization (WHO)
guidelines on the Prevention of Mother-to-Child Transmission of HIV (PMTCT) focusing on infant
feeding. The PHFS initiative is implemented in the six districts of Ntungamo and Kisoro in southwest
Uganda, and Jinja, Tororo, Manafwa, and Namutumba district in east and east-central Uganda. This
document reports on a data quality assessment (DQA) conducted in 42 health facilities in six districts
of Uganda to measure the status quo of the three intervention themes addressing post-natal HIV
transmission: QI; elimination of mother-to-child transmission of HIV (eMTCT); and nutrition,
assessment, counseling, and support (NACS) data. The DQA was conducted in all the 24
prototype/learning phase (Phase 1) and 18 rapid district-wide, scale-up phase (Phase 2) health facilities
for the review period January – March 2014.
The Partnership for HIV-Free Survival
In response to the “Global Plan toward the Elimination of New HIV Infections among Children by 2015
and Keeping Their Mothers Alive,” the Inter-Agency Task Force Working Group on Child Survival &
Infant Feeding, The U.S. President's Emergency Plan for AIDS Relief, and other technical partners are
supporting national efforts in six countries with a high HIV burden (Kenya, Lesotho, Mozambique,
South Africa, Tanzania, and Uganda) to develop and scale up an effective campaign to provide optimal
nutrition for infants and to protect those infants from HIV infection.
The PHFS is the first step in this ambitious plan to rapidly scale up an effective intervention to achieve
HIV-free survival among infants. The PHFS interventions will test the effectiveness of a proven
framework that uses QI methods to implement the 2010 WHO guidelines on PMTCT, focusing on infant
feeding.
Together, the effectiveness of antiretroviral drugs (ARVs) to reduce HIV transmission and of
breastfeeding to reduce deaths due to malnutrition, diarrhea, and pneumonia represent an exceptional
opportunity to improve HIV-free survival of infants born to mothers living with HIV. Since
programmatic experience in implementing postnatal guidelines for care of HIV-infected mothers and
HIV-exposed infants is limited, the PHFS will first focus on a learning phase that addresses
implementation challenges and develops data systems for tracking and improving program
performance. A subsequent scale-up phase will then disseminate these learnings across entire districts.
The PHFS will also support incorporation of these learnings into country plans to rapidly scale up
implementation of the WHO guidelines.
The PHFS supports and coordinates the design of country-led projects to improve infant survival
through improved feeding practices by HIV-infected and uninfected mothers and through protection of
HIV-exposed infants through the provision of ARVs to mothers and/or infants. The partnership provides
the following support:
Design, testing, and rapid scale up of an effective approach to increasing rates of coverage of care
for mother-infant pairs in the postnatal period
Training, technical support, and guidance for the use of QI approaches and infant feeding support
2
As part of the intervention, a range of monitoring and evaluation (M&E) activities will occur to
determine if this initiative is being executed as planned, to verify data in both intervention and non-
intervention districts, and ultimately to assess whether the initiative succeeded in accelerating and
scaling up eMTCT and nutrition interventions in the countries. To accomplish this, it is critical to collect
baseline information to use as a benchmark.
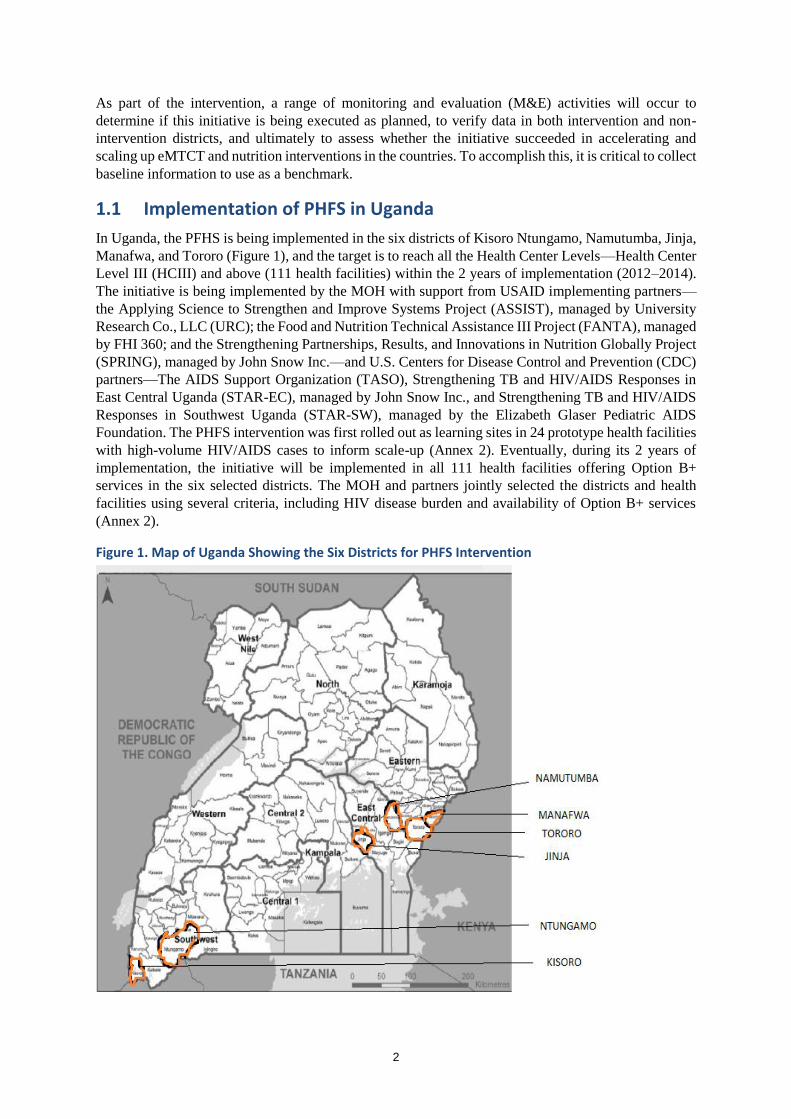
1.1 Implementation of PHFS in Uganda
In Uganda, the PFHS is being implemented in the six districts of Kisoro Ntungamo, Namutumba, Jinja,
Manafwa, and Tororo (Figure 1), and the target is to reach all the Health Center Levels—Health Center
Level III (HCIII) and above (111 health facilities) within the 2 years of implementation (2012–2014).
The initiative is being implemented by the MOH with support from USAID implementing partners—
the Applying Science to Strengthen and Improve Systems Project (ASSIST), managed by University
Research Co., LLC (URC); the Food and Nutrition Technical Assistance III Project (FANTA), managed
by FHI 360; and the Strengthening Partnerships, Results, and Innovations in Nutrition Globally Project
(SPRING), managed by John Snow Inc.—and U.S. Centers for Disease Control and Prevention (CDC)
partners—The AIDS Support Organization (TASO), Strengthening TB and HIV/AIDS Responses in
East Central Uganda (STAR-EC), managed by John Snow Inc., and Strengthening TB and HIV/AIDS
Responses in Southwest Uganda (STAR-SW), managed by the Elizabeth Glaser Pediatric AIDS
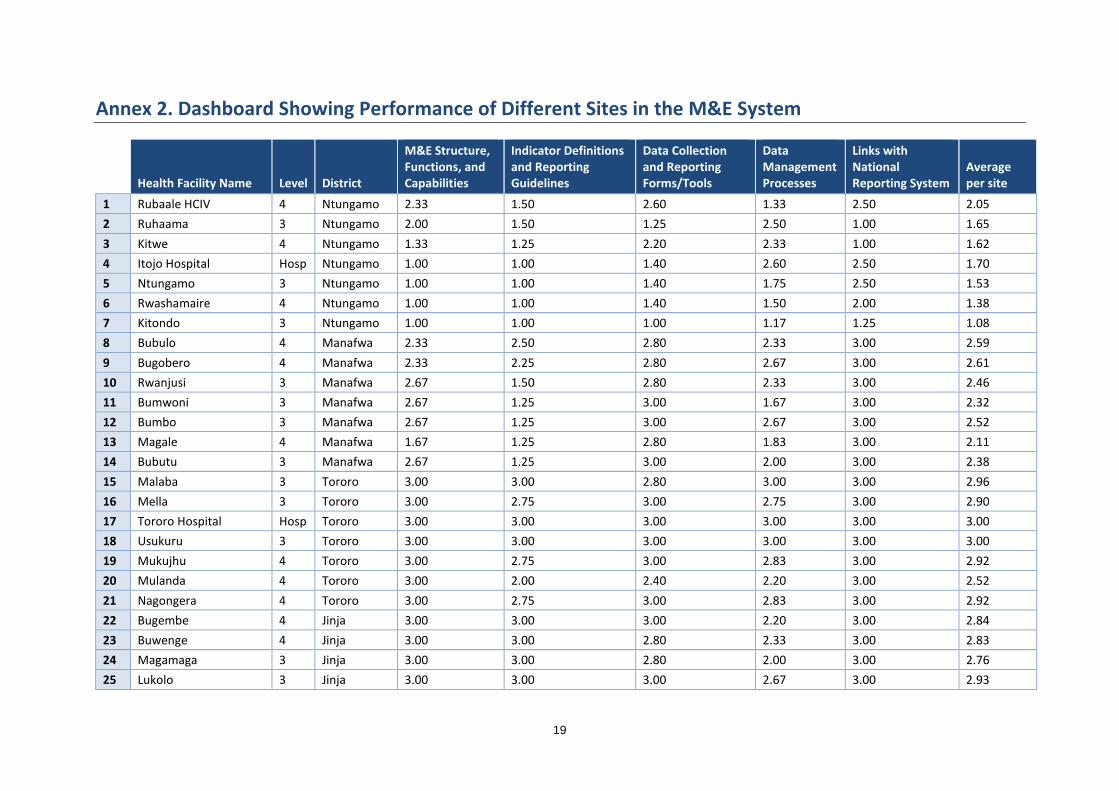
Foundation. The PHFS intervention was first rolled out as learning sites in 24 prototype health facilities
with high-volume HIV/AIDS cases to inform scale-up (Annex 2). Eventually, during its 2 years of
implementation, the initiative will be implemented in all 111 health facilities offering Option B+
services in the six selected districts. The MOH and partners jointly selected the districts and health
facilities using several criteria, including HIV disease burden and availability of Option B+ services
(Annex 2).
Figure 1. Map of Uganda Showing the Six Districts for PHFS Intervention
3
1.2 Elimination of Mother-to-Child Transmission of HIV in Uganda
(eMTCT)
In 2012, the MOH released The Integrated National Guidelines on Antiretroviral Therapy, Prevention
of Mother-to-Child Transmission of HIV and Infant & Young Child Feeding to provide guidance to
health workers in the delivery of integrated HIV prevention, care, and treatment, and in nutritional care,
treatment, and support for people living with HIV. In Option B+, all pregnant women living with HIV
are offered lifelong antiretroviral therapy (ART), starting triple ARVs at 14 weeks of pregnancy,
regardless of their CD4 count. All HIV-exposed infants are given daily nevirapine from birth through
age 4–6 weeks regardless of infant feeding method. Option B+ offers lifelong ART, lowers lifetime
transmission rate, leads to less risk of resistance, enables safer breastfeeding, and provides continuity
of treatment throughout childbearing years. The rollout of this policy involved:
Regional sensitization and coordination meetings with health officers, eMTCT focal persons, and
implementing partners
District entry meetings with the extended district health team members and the political arm
3-day training for health workers in Option B+
Mentorship visits
Provision of data collection tools
Provision of medical equipment, especially for integration of care into early infant diagnosis (EID)
Follow-up of lost mother-child pairs1
1.3 Nutrition Assessment, Counseling, and Support Implementation in
Uganda
Over the years, the MOH and development partners have provided targeted nutrition support to selected
districts and health facilities using the NACS framework. The framework includes strengthening service
providers’ skills in nutrition assessment, categorization, malnutrition treatment (provision of ready-to-
use therapeutic food), and prevention services such as infant and young child feeding (IYCF), and
facilitating linkages with other support programs. In the scale-up plan for nutrition interventions, the
MOH plans to integrate NACS into routine health services in health facilities countrywide while
improving quality of services in the startup facilities. USAID and CDC are supporting the MOH in this
scale-up plan through various partners that support provision of comprehensive HIV care across the
country.
1.4 Quality Improvement Framework for Uganda
The QI approach is used to achieve the essential steps of postnatal mother-infant care by coaching and
mentoring health workers, conducting learning sessions to compare and learn from each team,
conducting harvest sessions to compile best practices for use at all sites, and using journals to track
changes, all of which may result in excellent nutritional and HIV care for both the HIV-exposed and
non-exposed infants over the first 24 months of life. These steps are:
Retain all mother-infant pairs in care to ensure that they receive nutrition advice, counseling, and
support
Know the HIV status of every mother and infant
If HIV+, ensure optimal ARV coverage for mother and infant
1 Esiru, G. January 22, 2013. “PMTCT Implementation in Uganda: Option B+ Experience.” International Prevention
Meeting. Protea Hotel, Entebbe.
4
1.5 Rationale for the Data Quality Assessment
The purpose of a DQA is to ensure that the PHFS initiative is aware of the strengths and weaknesses of
the data in relation to five data quality dimensions (validity, reliability, integrity, timeliness, and
precision). USAID regulations require that data reporting to USAID—or for reporting externally on
USAID performance—must have conducted a DQA at some time within the 3 years before submission.
1.6 Objectives of the Data Quality Assessment
The main objectives of the DQA were to examine the M&E practices in the PHFS implementing health
facilities. Specific objectives were to:
Verify the quality of reported data for four selected indicators from the PHFS indicators
Determine the availability, completeness, and accuracy of health facility data collection tools used
to collect the PHFS indicators
Assess the capacity of the current data management systems to collect, manage, and report quality
data on four selected PHFS indicators
Highlight corrective actions needed to address significant limitations in data quality on the selected
PHFS indicators
5
2 Methodology
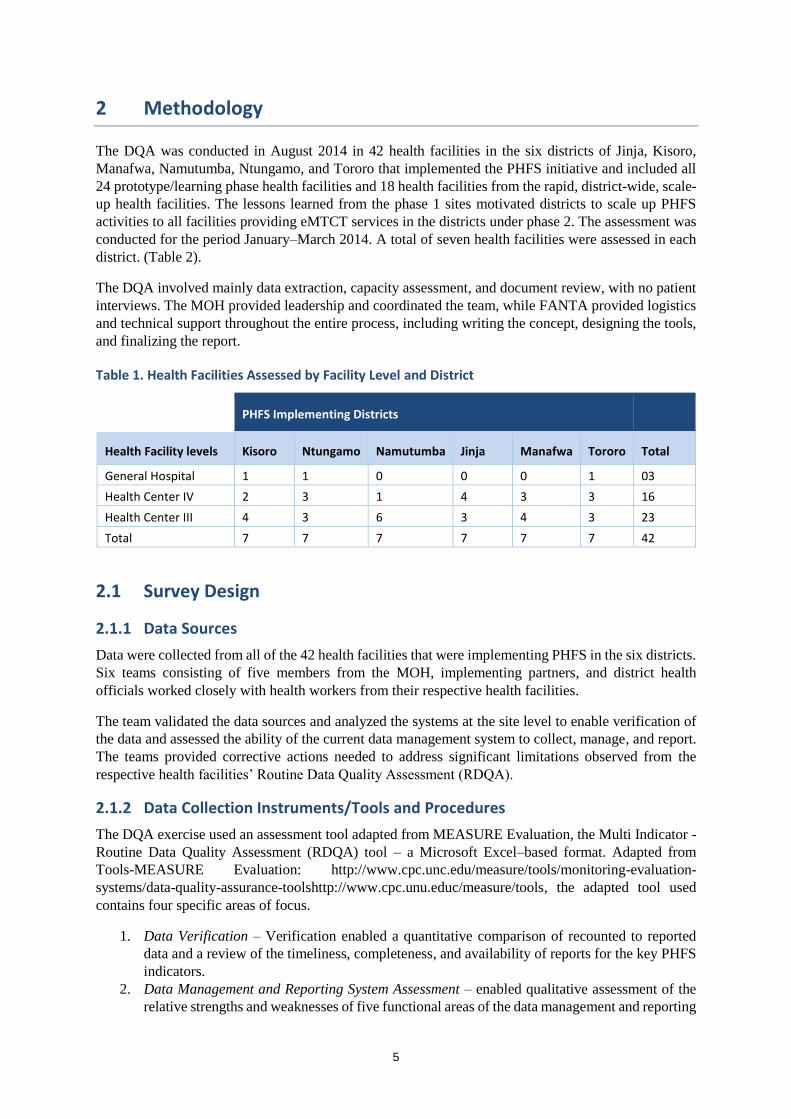
The DQA was conducted in August 2014 in 42 health facilities in the six districts of Jinja, Kisoro,
Manafwa, Namutumba, Ntungamo, and Tororo that implemented the PHFS initiative and included all
24 prototype/learning phase health facilities and 18 health facilities from the rapid, district-wide, scale-
up health facilities. The lessons learned from the phase 1 sites motivated districts to scale up PHFS
activities to all facilities providing eMTCT services in the districts under phase 2. The assessment was
conducted for the period January–March 2014. A total of seven health facilities were assessed in each
district. (Table 2).
The DQA involved mainly data extraction, capacity assessment, and document review, with no patient
interviews. The MOH provided leadership and coordinated the team, while FANTA provided logistics
and technical support throughout the entire process, including writing the concept, designing the tools,
and finalizing the report.
Table 1. Health Facilities Assessed by Facility Level and District
PHFS Implementing Districts
Health Facility levels Kisoro Ntungamo Namutumba Jinja Manafwa Tororo Total
General Hospital 1 1 0 0 0 1 03
Health Center IV 2 3 1 4 3 3 16
Health Center III 4 3 6 3 4 3 23
Total 7 7 7 7 7 7 42
2.1 Survey Design
2.1.1 Data Sources
Data were collected from all of the 42 health facilities that were implementing PHFS in the six districts.
Six teams consisting of five members from the MOH, implementing partners, and district health
officials worked closely with health workers from their respective health facilities.
The team validated the data sources and analyzed the systems at the site level to enable verification of
the data and assessed the ability of the current data management system to collect, manage, and report.
The teams provided corrective actions needed to address significant limitations observed from the
respective health facilities’ Routine Data Quality Assessment (RDQA).
2.1.2 Data Collection Instruments/Tools and Procedures
The DQA exercise used an assessment tool adapted from MEASURE Evaluation, the Multi Indicator -
Routine Data Quality Assessment (RDQA) tool – a Microsoft Excel–based format. Adapted from
systems/data-quality-assurance-toolshttp://www.cpc.unu.educ/measure/tools, the adapted tool used
contains four specific areas of focus.
1. Data Verification – Verification enabled a quantitative comparison of recounted to reported
data and a review of the timeliness, completeness, and availability of reports for the key PHFS
indicators.
2. Data Management and Reporting System Assessment – enabled qualitative assessment of the
relative strengths and weaknesses of five functional areas of the data management and reporting
6
system related to the PHFS indicators. These functional areas included M&E structure,
functions, and capabilities; indicator definitions and reporting guidelines; data-collection and
reporting forms/tools; data management processes; and links with national reporting system.
3. Recommendations - In addition to the two key assessment parts, recommendations were used
to describe necessary action points based on the identified weaknesses.
4. Dashboard – the RDQA checklists were entered directly into Excel spreadsheets. A number of
dashboards produced graphics of summary statistics for each site or level of the reporting
system.
Table 2 indicates the four selected PHFS indicators—2 for NACS and 2 for eMTCT—considered for
the DQA. It also shows the primary and secondary data sources used for data collection. These include:
Antenatal Care (ANC) Register, Maternity Register, EID Register, and the Outpatient Therapeutic Care
(OTC)/Integrated Nutrition Register as primary sources and the Dispensing Log and the Exposed Infant
Chart as secondary documents.
Table 2. Selected PHFS Indicators for Data Quality Assessment
Indicator Numerator/ Denominator
Source Document
Secondary Document
1. Percentages of pregnant women initiated on ART
# of pregnant women initiated on ART
ANC Register Dispensing Log
Total number of HIV-positive pregnant women identified who are not yet on ART (includes those counselled, tested, and given results)
2. Percentages of HIV-exposed infants given ARV prophylaxis
# of exposed babies born to HIV-positive mothers given ARVs
Maternity Register
Dispensing Log
# of exposed babies born in the facility in the reporting period
3. Percentage of exposed infants reported to be adhering to recommended IYCF practices
# of exposed infants adhering to IYCF practices
EID Register Exposed Infant Chart
# of exposed babies born in the facility in the reporting period
4. Proportion of HIV-positive mothers found to be undernourished and receiving therapeutic or supplementary feeding support (TF/SF) at any point during the reporting period
# of undernourished HIV-positive mothers on TF/SF
OTC/Integrated Nutrition Register
Not available
# of undernourished HIV-positive mothers identified
2.1.3 Data Entry and Analysis
Data collectors input data directly into the RDQA tool; the tool would then automatically consolidate
and analyze data at both district and health facility levels. Respective health facility data were submitted
to the PHFS M&E task force for central processing, analysis, and report writing from the teams.
Descriptive analysis was done where data were benchmarked at facility, district, and national level.
Findings of the exercise were presented via the RDQA tool which utilized a dashboard with various
graphs, tables, and narrative.
7
The analysis of the M&E system structure used a three-level rating scale based on a methodology
utilized by the RDQA tool to assess the functionality and status of the five components of the M&E
system (Annex 2). Where the M&E component was found to have the desired functionalities, it was
given a score of 2.5–3.0 (Green: met standards), where the component needed improvement, a score of
1.5–2.4 (Yellow: needs improvement) was given, and where the component was found to be in an
undesirable functionality, a score of less than 1.5 (Red: needs urgent remediation) was awarded. The
desired standards for each M&E components are described in Table 3.
Table 3. Criteria for Assessing the M&E System Components
M&E Structure, Functions, and Capabilities
Relevant M&E staff are trained in data management process and tools and all staff involved in the M&E processes are fully aware of their roles and responsibilities.
Indicator Definitions and Reporting Guidelines
There are written guidelines on reporting procedures.
Data-collection and Reporting Forms/Tools
Availability of clear instructions on how to complete the data collection and reporting forms/tools. The standard forms/tools are consistently used by the service delivery site. Relevant indicators are available for measuring and tracking quality of care.
Data Management Processes The data collection system maintains personal data in accordance with national or international confidentiality guidelines, avoids double-counting across service points, and tracks persons lost for follow up. Where electronic medical records systems exist, quality control procedures are in place to ensure clean data storage and regular back up.
Data are reviewed before submission to the next level and used to make decisions.
Links with National Reporting System
The relevant forms/tools are used for data-collection and reporting within the national framework.
Data were entered into the collection tool which was automated to analyze the data. Hard copies were
used for solving queries in case of discrepancies during data cleaning and processing. All partners were
responsible for data collection, entry, and analysis. Standard regulation by the MOH over the health
management information system (HMIS) data was observed.
Analysis of the data was descriptive and focused on the two themes (Option B+ and NACS). The
extracted data were presented as a dashboard, tables, and graphs. Data will be kept at the MOH Resource
Center for at least 3 years for future reference.
2.1.4 Ethical Considerations
All FHI360 staff who participated in the DQA had a valid standard online FHI 360’s Research Ethics
Certificate prior to the assessment. This process equipped the partners with skills for appropriate
conduct during data extraction, protection of confidentiality, and ensuring data privacy. All computer
data were encrypted on password-protected computers. Access to the data was designated to
appropriately responsible MOH staff and M&E task force members who participated in the DQA.
Assessors were trained on the use of the tools and participated in the pretest and adjustment. As the
assessment was mainly a process of data extraction, capacity assessment, and document review, the
potential risk to the clientele of the respective health facilities was minimal. The task force participated
in the development and pretesting of tools and trained data collection teams during a 1-day training on
the use of the data collection tools.
8
2.2 Assessment Limitations
Inconsistencies in the implementing partners data at the health facility level for the reporting period
were expected. As a result, the quality of the implementing partners’ data was compared with the
national database (DHIS 2) for final decisions on discrepancies in the reported data.
9
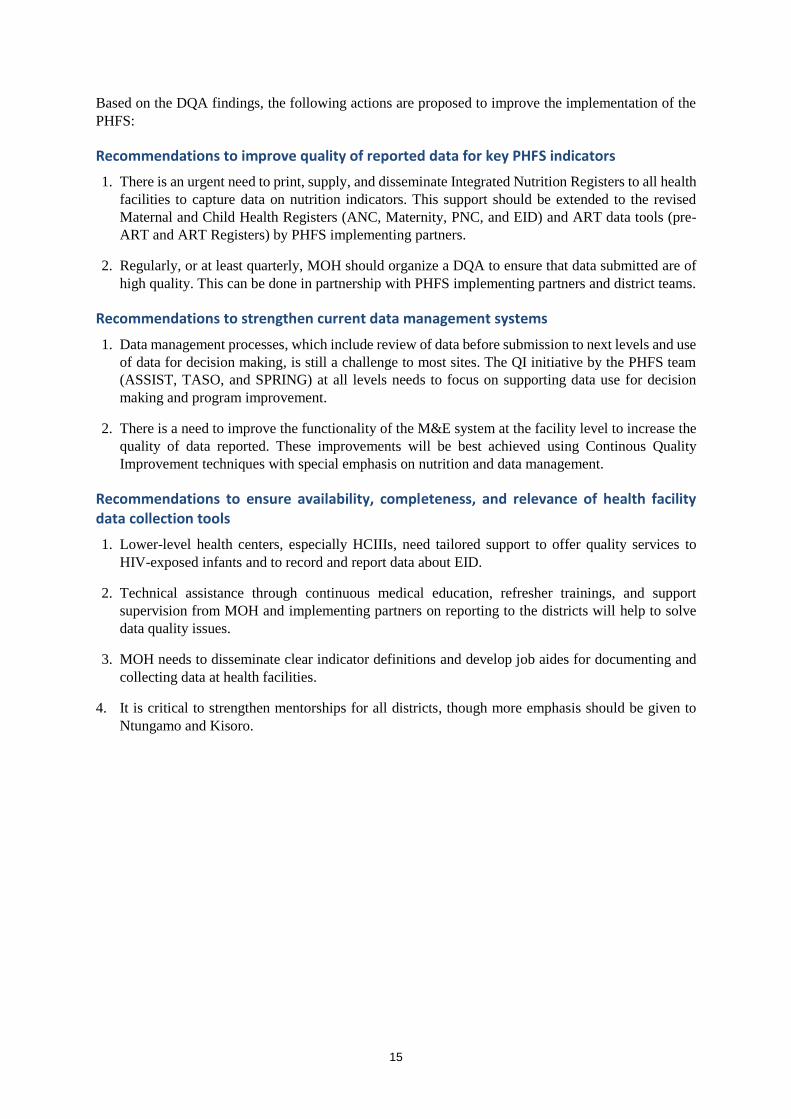
3 DQA Findings
The DQA assessment findings are aligned under the four objectives presented by the districts of Kisoro,
Ntungamo, Namutumba, Jinja, Manafwa, and Tororo. There were variations noted in the quality of data
and capacity of data management systems. Specific corrective action was provided to each health
facility. The following findings are benchmarked at national, district, and facility levels.
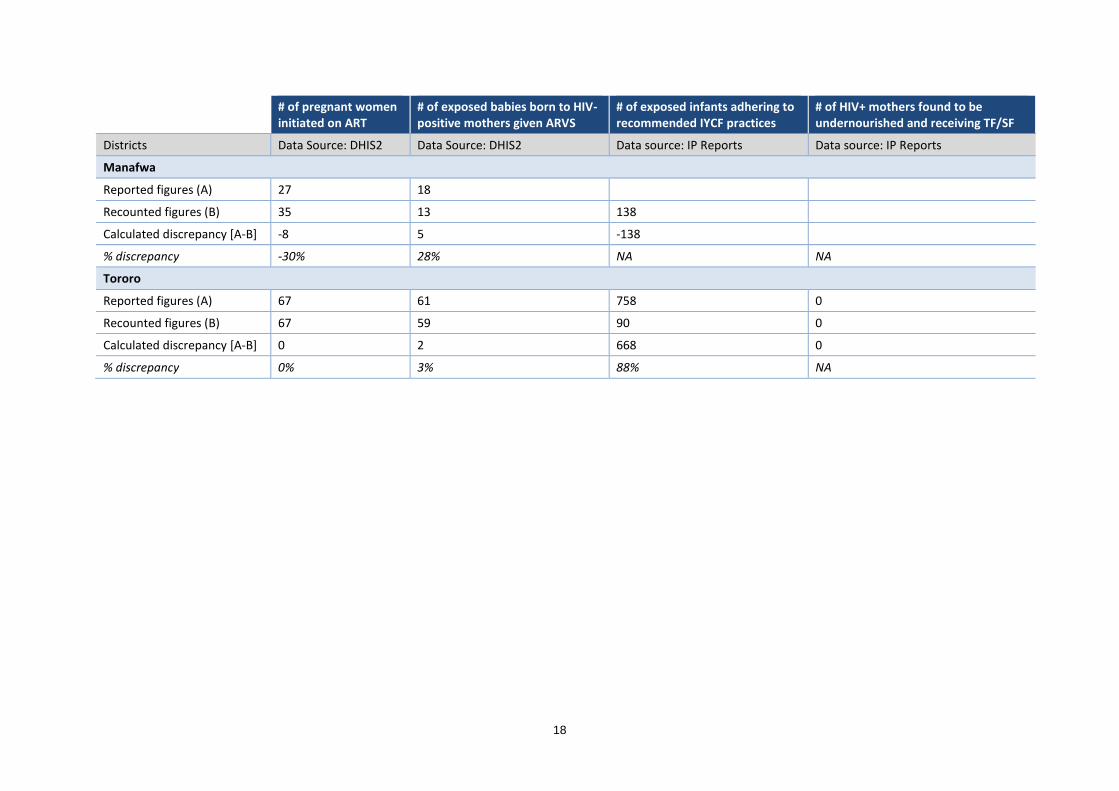
3.1 Data Validation (Accuracy)
3.1.1 Verification of Reported Numbers
Validity of data is an important element of any DQA where reported data is assessed against data from
primary source documents. Two of the nine eMTCT indicators and 2 of the 11 NACS Indicators were
used in the data validation exercise for data collected from January to March 2014 (Table 2). It should
be noted that data verification for the two NACS indicators was not possible because there were no
national tools to use. Details of the indicator performance verification is shown in Annex 1. Deviations
of 5 percent (+/-) were considered “acceptable” (taking into account errors); deviations of 5–10 percent
(+/-) were considered “fair”; and, deviations above 10 percent (+/-) were considered “unacceptable.”
Figure 2 shows performance on two selected PHFS indicators (#4 and #9) relating to ART for the period
January–March 2014 by District. Overall, Tororo district achieved acceptable performance standards
for the two indicators. Tororo had complete and accurate reporting of indicator #4—pregnant women
initiated on ART. The rest of the districts either under-reported—Jinja under-reported by 89 percent—
and over-reported by 18%—Ntungamo over-reported by 11 percent. All the districts except one
(Tororo) performed poorly on Indicator #9—exposed babies born to HIV-positive mothers given ARVs.
The highest incident of under-reporting was in Namutumba district (27 percent) and over-reporting in
Manafwa district (28 percent).
Figure 2. Deviation between Reported and Observed Data on Two ART Indicators
-12%
11%
-13%
-89%
-30%
0%
17%
26%
-27%
18%
28%
3%
-100%
-90%
-80%
-70%
-60%
-50%
-40%
-30%
-20%
-10%
0%
10%
20%
30%
40%
Kisoro Ntungamo Namutumba Jinja Manafwa Tororo
Pregnant women initiated on ART Exposed babies bornto HIV-positive mothers given ART
10
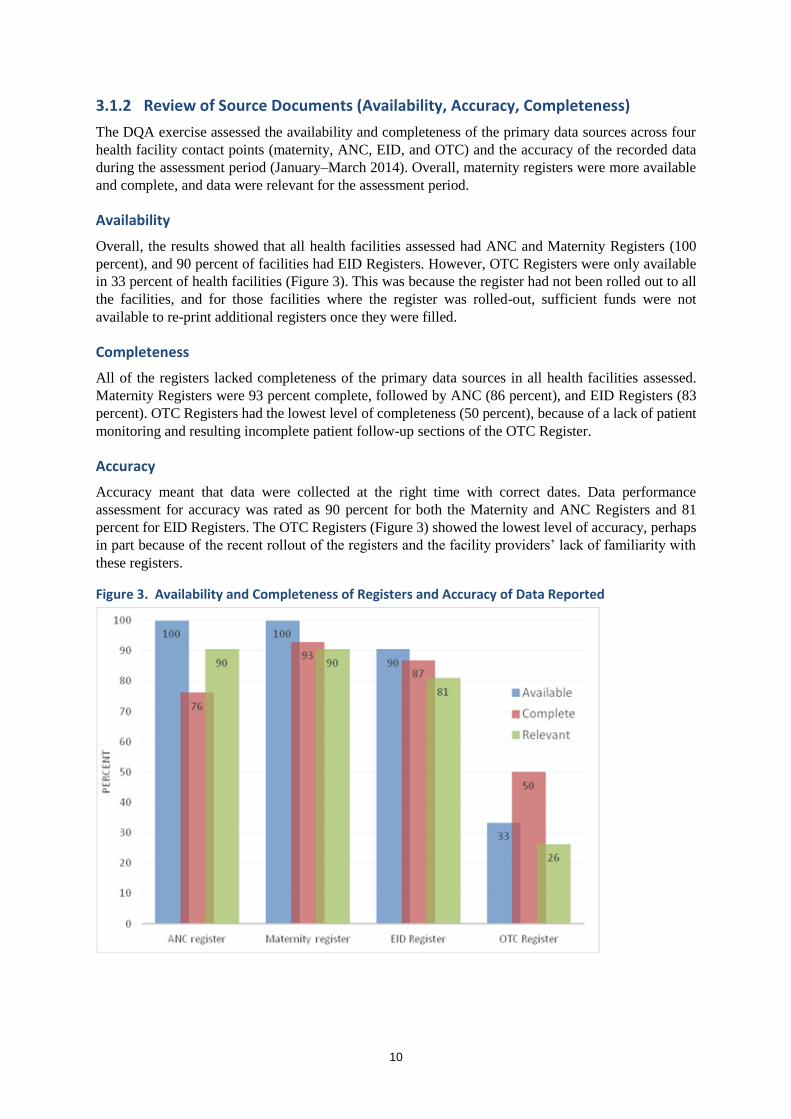
3.1.2 Review of Source Documents (Availability, Accuracy, Completeness)
The DQA exercise assessed the availability and completeness of the primary data sources across four
health facility contact points (maternity, ANC, EID, and OTC) and the accuracy of the recorded data
during the assessment period (January–March 2014). Overall, maternity registers were more available
and complete, and data were relevant for the assessment period.
Availability
Overall, the results showed that all health facilities assessed had ANC and Maternity Registers (100
percent), and 90 percent of facilities had EID Registers. However, OTC Registers were only available
in 33 percent of health facilities (Figure 3). This was because the register had not been rolled out to all
the facilities, and for those facilities where the register was rolled-out, sufficient funds were not
available to re-print additional registers once they were filled.
Completeness
All of the registers lacked completeness of the primary data sources in all health facilities assessed.
Maternity Registers were 93 percent complete, followed by ANC (86 percent), and EID Registers (83
percent). OTC Registers had the lowest level of completeness (50 percent), because of a lack of patient
monitoring and resulting incomplete patient follow-up sections of the OTC Register.
Accuracy
Accuracy meant that data were collected at the right time with correct dates. Data performance
assessment for accuracy was rated as 90 percent for both the Maternity and ANC Registers and 81
percent for EID Registers. The OTC Registers (Figure 3) showed the lowest level of accuracy, perhaps
in part because of the recent rollout of the registers and the facility providers’ lack of familiarity with
these registers.
Figure 3. Availability and Completeness of Registers and Accuracy of Data Reported
11
3.2 Analysis of Data Quality by Health Facility Type (Availability,
Completeness, Accuracy)
Analysis of three data quality dimensions by health facility type is shown in Table 4. Overall, it appears
that hospitals and Health Center Level IV (HCIVs) had stronger data quality in terms of availability,
completeness, and accuracy than HCIIIs.
Table 4. Availability and Completeness of Registers and Accuracy of Reported Data by Facility Type
Registers
HOSPITALS (3)
Performance (%)
HCIV (16)
Performance (%)
HCIII (23)
Performance (%)
Available Complete Accuracy Available Complete Accuracy Available Complete Accuracy
ANC 100 67 100 100 75 94 100 78 87
Maternity 100 67 67 100 100 94 100 91 91
EID 100 100 100 88 100 93 91 76 86
OTC 100 67 100 44 43 86 17 50 50
Average (by dimension)
100 75 91 83 80 92 77 74 79
Average (all 3 dimensions)
87 85 77
3.2.1 Availability by health facility level
While all hospitals assessed had all four registers available, HCIVs and HCIIIs only had two of the four
registers available. EID Register availability was 91 percent at HCIIIs and 88 percent at HCIVs. The
availability rates were even worse for OTC Registers at these lower health facilities, 44 percent and 17
percent, respectively.
3.2.2 Completeness by Health Facility Level
There were notable variations in data completeness by health facility level. The lower health facilities—
HCIVs and HCIIIs—performed better in completeness of the ANC and Maternity Registers compared
to hospitals (Table 4).
3.2.3 Accuracy by Health Facility Level
Results about accuracy of data observed indicate that, except for Maternity Registers, all other registers
had relevant data applicable to the DQA period for hospitals. Considerable data variation was
documented in HCIV and HCIII data across the four source documents with OTC having high accuracy
data gaps.
3.3 Functioning of the M&E system
The M&E system has five components that were assessed: 1) M&E structure and capabilities, 2)
indicator definitions and reporting guidelines, 3) data collection and reporting forms, 4) data
management processes, and 5) linkages with national reporting systems.
The overall findings of the M&E system shows that for four of the five components assessed, more than
half of the 42 health facilities met the required standards (see Figure 4). For the data management
processes, less than half of the 42 health facilities met the required standards. The low performance was
attributable to a lack of feedback to service points. The strongest component of the M&E system appears
to be the “Links with the National Reporting System” including national forms/tools (Q19) and single
reporting channel (Q20).
12
Figure 4. Overall Functioning of the M&E System in the 42 Health Facilities
3.3.1 Functioning of the M&E System (Analysis by District)
Overall, districts performed well on linkages to the national reporting system (when, what, and where
to report) with outstanding performance recorded in Namutumba and Jinja districts. All seven health
facilities in Namutumba met the M&E standards. In Jinja, data management processes needed
improvements. Ntungamo and Kisoro districts needed urgent remediation in almost all the components
of the M&E system (see Tables 5a-c).
Districts Meeting Standards (Table 5a)
All facilities in Namutumba assessed met the standards for all components of a well-functioning
M&E system.
Jinja performed similarly to Namutumba except for standards for data management processes, with
only 14 percent of facilities assessed having met the relevant standard.
Facilities in Tororo also perform strongly in meeting relevant standards for the various components
of the M&E system.
Table 5a. District Level Functioning of the M&E System
Met Standards (% of health facilities per district)
District
M&E Structure, Functions, and Capabilities
Indicator Definitions and Reporting Guidelines
Data Collection and Reporting Forms/Tools
Data Management Processes
Links with National Reporting System
Ntungamo 0 0 14 29 43
Kisoro 0 29 0 0 14
Manafwa 57 14 100 29 100
Tororo 100 86 86 86 100
Jinja 100 100 100 14 100
Namutumba 100 100 100 100 100
13
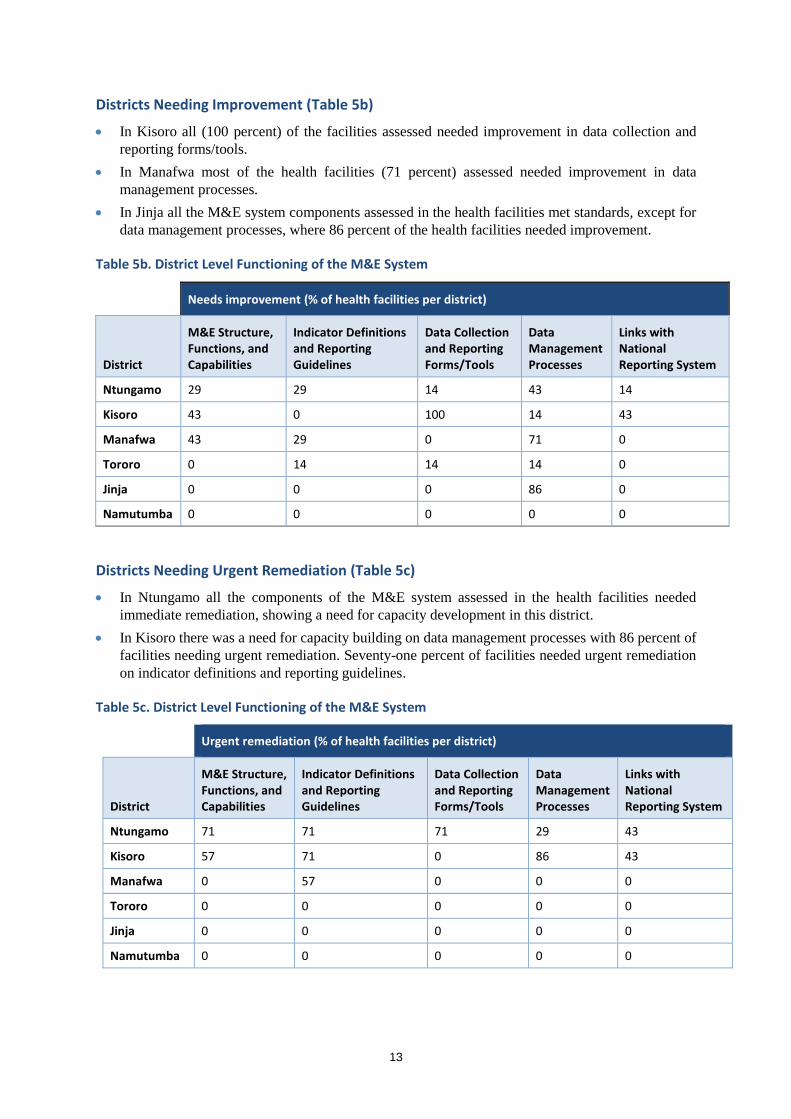
Districts Needing Improvement (Table 5b)
In Kisoro all (100 percent) of the facilities assessed needed improvement in data collection and
reporting forms/tools.
In Manafwa most of the health facilities (71 percent) assessed needed improvement in data
management processes.
In Jinja all the M&E system components assessed in the health facilities met standards, except for
data management processes, where 86 percent of the health facilities needed improvement.
Table 5b. District Level Functioning of the M&E System
Needs improvement (% of health facilities per district)
District
M&E Structure, Functions, and Capabilities
Indicator Definitions and Reporting Guidelines
Data Collection and Reporting Forms/Tools
Data Management Processes
Links with National Reporting System
Ntungamo 29 29 14 43 14
Kisoro 43 0 100 14 43
Manafwa 43 29 0 71 0
Tororo 0 14 14 14 0
Jinja 0 0 0 86 0
Namutumba 0 0 0 0 0
Districts Needing Urgent Remediation (Table 5c)
In Ntungamo all the components of the M&E system assessed in the health facilities needed
immediate remediation, showing a need for capacity development in this district.
In Kisoro there was a need for capacity building on data management processes with 86 percent of
Average (per functional area) 2.37 2.17 2.54 2.18 2.55 2.36
21
Annex 3. PHFS Quality Improvement Indicators for the Partnership for Uganda
Area Indicator Target Population Data Source
Type of Indicator
Frequency of Collection
Reporting Tool to MOH Resource Center
HIV status, testing, and treatment
Indicator 1: Number of pregnant women with HIV status known before their first ANC visit
Num: # of Pregnant women whose HIV status is known before their first ANC visit
All pregnant women who attend ANC
ANC Register
Program indicator
Monthly HMIS 105 – A16
Indicator 2: Percentage of pregnant women with known HIV status (includes women who were tested for HIV and received their results)
Num: # of pregnant women with known status + # Counseled, tested, received results
Den: Total number of 1 ANC visit attendances
All pregnant women attending ANC for the 1st
time
ANC Register
Program indicator
Monthly HMIS addendum form 009A – A4
Indicator 3: Percentage of pregnant women who were counseled, tested, and given results
Num: # of pregnant women counseled, tested, and given results
Den: # of mothers who came for ANC services (new ANC attendances)
Note: The denominator excludes those who came with known HIV status
All pregnant women attending ANC for the 1st time
ANC Register
QI indicator
Monthly HMIS addendum form 009A
Indicator 4: Percentage of pregnant women initiated on ART
Num: # of pregnant women initiated on ART
Den: Total # of HIV-positive pregnant women identified who are not yet on ART treatment (includes those counseled, tested, and given results)
All pregnant women attending ANC
ANC Register
QI indicator
Monthly HMIS addendum form 009A –A9
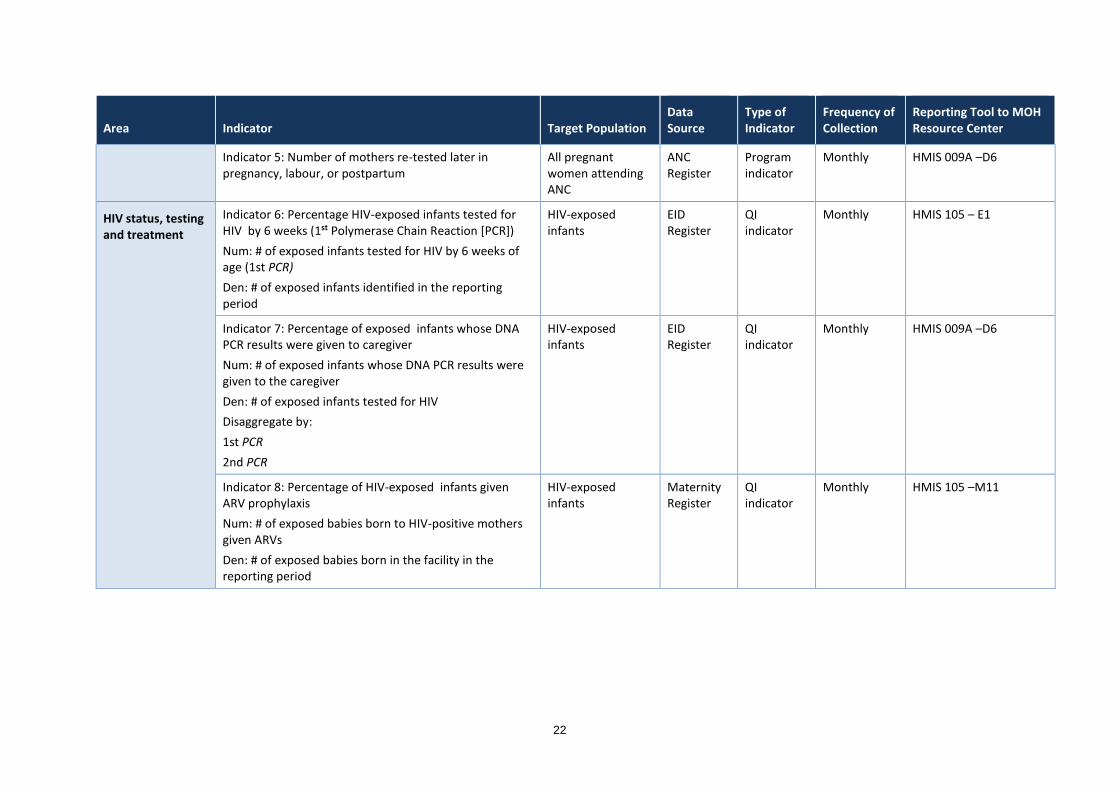
22
Area Indicator Target Population Data Source
Type of Indicator
Frequency of Collection
Reporting Tool to MOH Resource Center
Indicator 5: Number of mothers re-tested later in pregnancy, labour, or postpartum
All pregnant women attending ANC
ANC Register
Program indicator
Monthly HMIS 009A –D6
HIV status, testing and treatment
Indicator 6: Percentage HIV-exposed infants tested for HIV by 6 weeks (1st Polymerase Chain Reaction [PCR])
Num: # of exposed infants tested for HIV by 6 weeks of age (1st PCR)
Den: # of exposed infants identified in the reporting period
HIV-exposed infants
EID Register
QI indicator
Monthly HMIS 105 – E1
Indicator 7: Percentage of exposed infants whose DNA PCR results were given to caregiver
Num: # of exposed infants whose DNA PCR results were given to the caregiver
Den: # of exposed infants tested for HIV
Disaggregate by:
1st PCR
2nd PCR
HIV-exposed infants
EID Register
QI indicator
Monthly HMIS 009A –D6
Indicator 8: Percentage of HIV-exposed infants given ARV prophylaxis
Num: # of exposed babies born to HIV-positive mothers given ARVs
Den: # of exposed babies born in the facility in the reporting period
HIV-exposed infants
Maternity Register
QI indicator
Monthly HMIS 105 –M11
23
Area Indicator Target Population Data Source
Type of Indicator
Frequency of Collection
Reporting Tool to MOH Resource Center
Nutrition Indicator 9: Percentage of HIV-positive mothers who receive IYCF counseling at each visit
Num:# of HIV-positive pregnant and lactating mothers given IYCF counseling each visit
Den: # of HIV-positive pregnant and lactating mothers attending in the reporting period
All HIV-positive mothers
ANC Register, Clinic Attendance Register
QI indicator
Monthly/ Quarterly assessment
Not routinely collected so changes will have to be made
Indicator 10: Percentage of HIV-positive mothers who receive maternal nutrition counseling
Num:# of HIV positive pregnant and lactating women given maternal nutrition counseling each visit
Den: # of HIV positive pregnant and lactating attending in the reporting period
QI indicator
Monthly/ Quarterly assessment
Not routinely collected
Indicator 11: Percentage of exposed mothers initiating breastfeeding within 1 hour of birth
Num: # of exposed infants placed onto the breast within an hour of birth
Den: # of HIV-positive deliveries
All mothers Maternity Register
QI indicator
Monthly HMIS 105 –M12
Indicator 12: Percentage of exposed infants reporting to be adhering to recommended IYCF practices
Num: # of exposed infants adhering to recommended IYCF practices
Den: # of exposed infants attending the EID care point in the given month (including re-attendances)
Note: Recommended IYCF means “exclusive breastfeeding for 6 months, complementary feeding at 6 months with breastfeeding to 12 months”
All exposed infants PMTCT Register/ EID Register
QI indicator
Monthly
24
Area Indicator Target Population Data Source
Type of Indicator
Frequency of Collection
Reporting Tool to MOH Resource Center
Indicator 13: Proportion of HIV-positive pregnant and lactating mothers who at each visit receive nutrition assessment
Num: # of HIV-positive pregnant and lactating women who receive nutrition assessment at each visit
Den: # of HIV-positive pregnant and lactating mothers seen each month
All HIV-positive pregnant and lactating mothers
Register QI indicator
Monthly HMIS 106A
Indicator 14: Proportion of HIV-positive pregnant and lactating mothers who receive nutrition assessment every quarter
Num: # of HIV-positive pregnant and lactating women who receive nutrition assessment
Den: # of HIV-positive pregnant and lactating mothers active in care
All HIV-positive pregnant and lactating mothers
ART Register
Program indicator
Quarterly HMIS 106A
Indicator 15: Proportion of exposed infants who receive nutrition assessment every month
Num: # of infants who receive nutrition assessment
Den: # of exposed infants seen in the month
All exposed infants
Patient HIV monitoring card
QI indicator
Monthly
Indicator 16: Proportion of HIV-positive mothers who are found to be malnourished during the reporting period
Num: # of malnourished HIV-positive mothers who are malnourished
Den: # of HIV-positive pregnant and lactating mothers active in care
Disaggregate by Type of malnutrition:
SAM
MAM
All HIV-positive pregnant and lactating mothers
Pre-ART or ART Register
Program indicator
Quarterly HMIS 106A
25
Area Indicator Target Population Data Source
Type of Indicator
Frequency of Collection
Reporting Tool to MOH Resource Center
Indicator 17: Proportion of exposed infants found to be undernourished and receive TF/SF at any point during the reporting period
Num: # of exposed undernourished infants on TF/SF
Den: # of exposed infants found malnourished and eligible for TF/SF
All exposed infants OTC Register
QI indicator
Monthly
Indicator 18: Proportion of HIV-positive mothers found to be undernourished and receive TF/SF at any point during the reporting period
Num: # of undernourished HIV-positive mothers on TF/SF
Den: # of undernourished HIV-positive mothers identified
All HIV-positive mothers
OTC Register
QI indicator
Monthly
Indicator 19: Percentage of exposed infants with acute malnutrition at the 18-month follow-up visit
Num: # of exposed infants with acute malnutrition at the 18-month follow-up visit
Den: # of exposed infants assessed for malnutrition at the 18 month follow-up visit
All exposed infants EID Register
QI indicator
Cohort
Indicator 20: Proportion of exposed infants who are found to be malnourished at any point during the reporting period
Num: # of malnourished exposed infants who are malnourished
Den: # of exposed infants in care seen monthly
Disaggregate by age group:
0–6 months
6–12 months
Exposed infants EID Register/ Young Child Clinic register
QI indicator
Monthly
26
Area Indicator Target Population Data Source
Type of Indicator
Frequency of Collection
Reporting Tool to MOH Resource Center
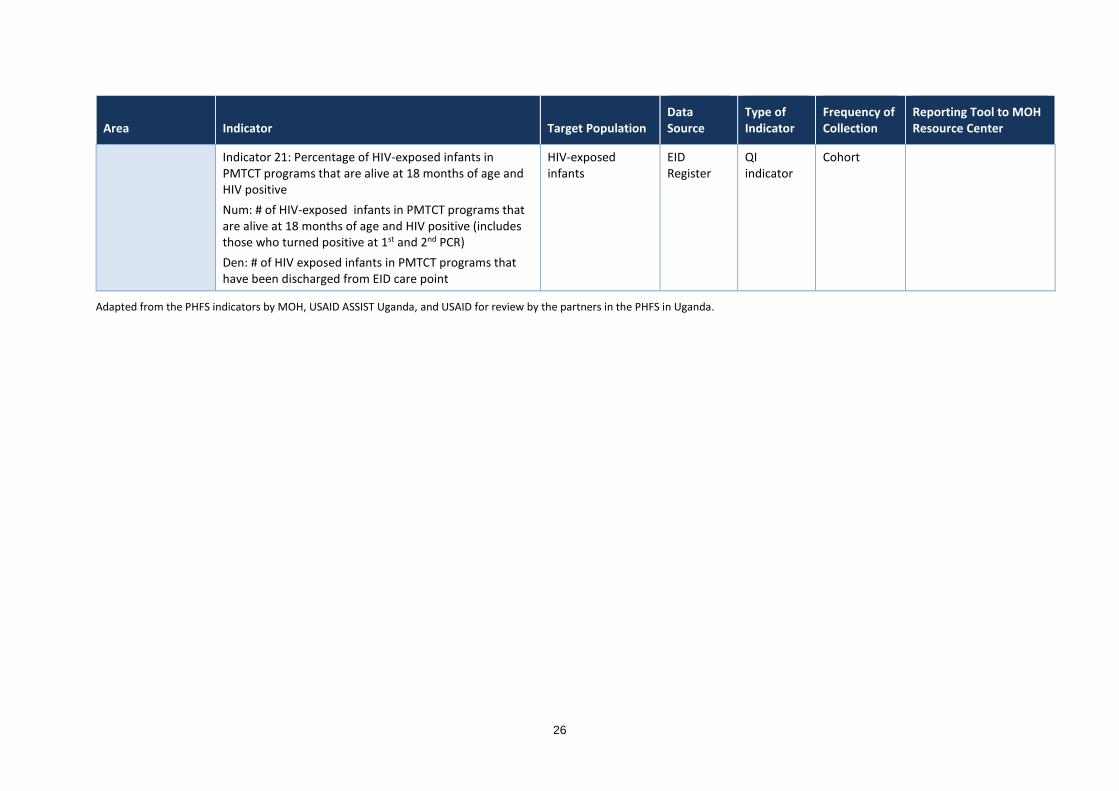
Indicator 21: Percentage of HIV-exposed infants in PMTCT programs that are alive at 18 months of age and HIV positive
Num: # of HIV-exposed infants in PMTCT programs that are alive at 18 months of age and HIV positive (includes those who turned positive at 1st and 2nd PCR)
Den: # of HIV exposed infants in PMTCT programs that have been discharged from EID care point
HIV-exposed infants
EID Register
QI indicator
Cohort
Adapted from the PHFS indicators by MOH, USAID ASSIST Uganda, and USAID for review by the partners in the PHFS in Uganda.
27
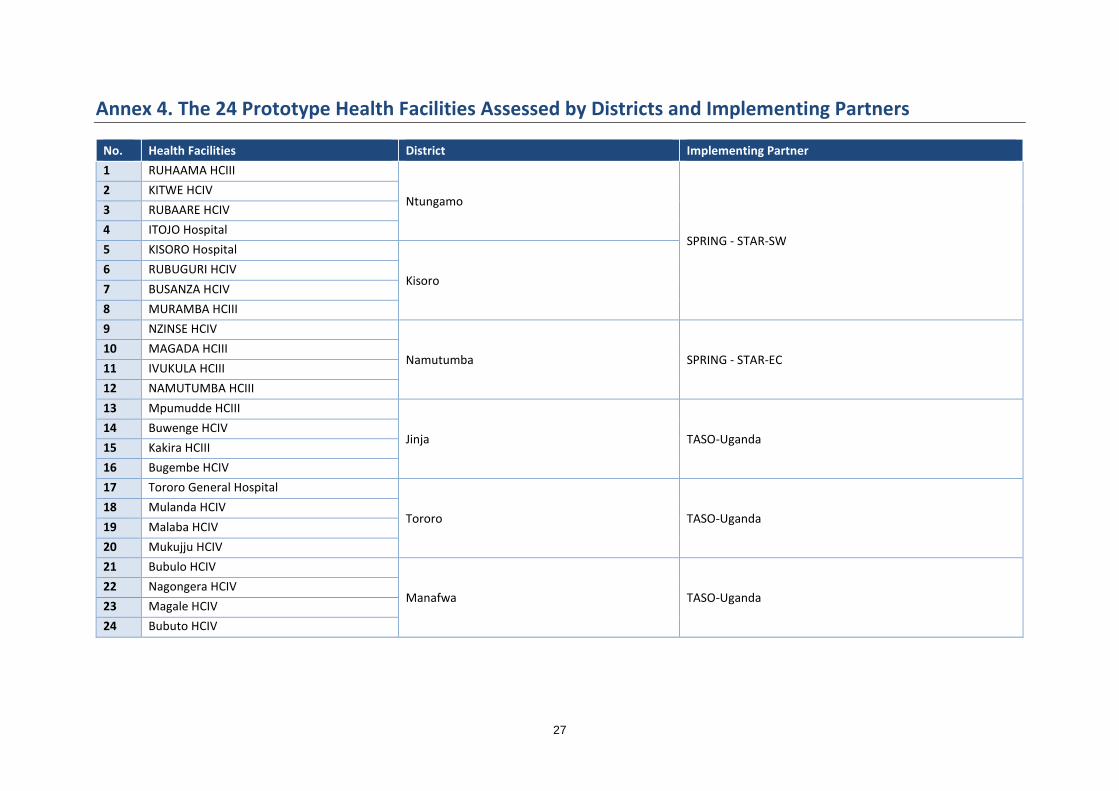
Annex 4. The 24 Prototype Health Facilities Assessed by Districts and Implementing Partners
No. Health Facilities District Implementing Partner