Data Requirements for Sediment Transport Models of Rivers In the following, guidelines about data requirements for sediment transport and morphological modelling are provided based on experience with MIKE21C and MIKE 11 sediment transport model applications. List of contents Introduction............................................................................................................................................................... 2 Geometry .................................................................................................................................................................. 2 Maps, aerial and satellite images .......................................................................................................................... 2 Depth Soundings ................................................................................................................................................... 2 Land Surveys ........................................................................................................................................................ 3 Structures .............................................................................................................................................................. 3 Hydrodynamics ......................................................................................................................................................... 4 Hydrographs.......................................................................................................................................................... 4 Water levels .......................................................................................................................................................... 5 Velocity................................................................................................................................................................. 5 Sediment Transport ................................................................................................................................................... 7 Bed samples .......................................................................................................................................................... 7 Suspended samples ............................................................................................................................................... 8 Sediment transport rates........................................................................................................................................ 9 Cohesive sediment samples ................................................................................................................................ 10 Morphology ............................................................................................................................................................ 11 Bathymetry.......................................................................................................................................................... 11 Sediment boundaries ........................................................................................................................................... 12 More information .................................................................................................................................................... 12
Transcript
Data Requirements for Sediment Transport Models of Rivers
In the following, guidelines about data requirements for sediment transport and morphological modellingare provided based on experience with MIKE21C and MIKE 11 sediment transport model applications.
List of contentsIntroduction............................................................................................................................................................... 2Geometry .................................................................................................................................................................. 2
More information.................................................................................................................................................... 12
Data Requirements.doc - 2 - DHI Water & Environment
IntroductionEvery sediment transport model application is different both in terms of time and space scale (extent ofstudy area), study objectives, required accuracy, allocated resources, background of the study team etc.Often data requirements are divided between “nice to have” and “need to have”. However, as this will bedifferent from case to case, no distinction has been made in this note. The purpose of the data isdescribed, though, so that the model user can make his/her own judgement about the importance of thedata given the actual study objectives. The equipment for field measurements is not described here.
Geometry
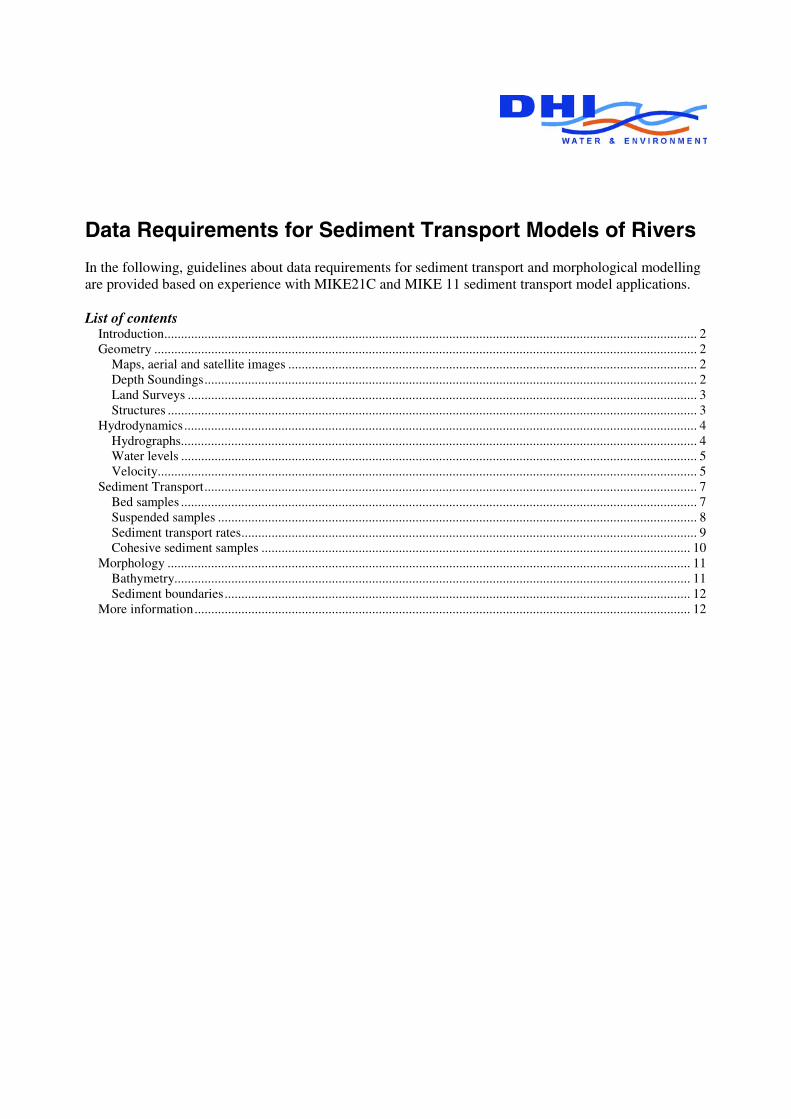
Maps, aerial and satellite imagesIt is advisable to apply maps and/or geo-referenced aerial photos or satellite images to delineate themodelling area and digitise the model boundaries for the generation of a grid (1D branches or 2Dcurvilinear grids). When the number of cross-sections is scarce, use of additional information from mapsand images is imperative. If the study objectives include assessment of large-scale bank erosion (severaltens of meters), it can be particular useful to apply (geo-referenced) aerial photos before and after thestudy period in consideration.
Figure 1 Data for geometric description
Depth SoundingsEstablishment of the sediment transport model requires good channel bathymetry data and floodplaintopography data (all together called “bathymetry” in the following).
With an echosounder, the depth is obtained along a number of transects. Obviously, they should beperpendicular to the river (cross-sections) as the cross-section shape is of particular importance. Therequired spacing between transects is typically 50-200m depending on the width of the river and therequired grid resolution of the model. With a grid spacing of 50m in a 2D sediment model, a distancebetween transects of around 100-200m would typically be sufficient (i.e. interpolation in intermediatepoints will be done during grid preparation). A meandering reach should be covered by at least 20-30cross-sections per wave length if the morphological changes in that river bend is of particular interest.
Georeferenced map
Floodplain elevation(land survey)
Depth soundings
Datum and waterlevels
Structure dimensions
Elevation of dikes,roads etc.
Data Requirements.doc - 3 - DHI Water & Environment
Specific geometric features in the river, such as a constriction, groynes, bridge, or similar, should besurveyed with higher density of survey lines.
The measured depths from echosounder are converted to bed levels by applying readings from water levelgauges along the river. It is advisable, to establish a number of temporary water level stations as thelateral (and longitudinal) variations in water level can be significant, in particular in high speed andstrongly curved flow. Accurate referencing (datum and horizontal position) of these stations is importantand requires that the datum of each benchmark be connected. This can be a particular challenge alonglong reaches never surveyed before.
Land SurveysCompared to echo sounding, land surveys of floodplains are costly, especially if the floodplains arecovered by high vegetation or similar. Use of LIDAR and/or photogrametric surveys from air is useful toestablish good floodplain topography. In addition, accurate level measurements of dividing lines in thefloodplains such as railways, roads etc. are important. Culverts and bridges below roads, dikes,embankments must be identified and measured, as they determines the flow from one flood cell toanother. The required accuracy of floodplain topography is less in connection with morphologicalmodelling as compared to detailed flood modelling on floodplains.
StructuresIn addition to survey of the bathymetry near the structures, the dimension and functionality of thestructures should also be established, especially in connection with application of the structure modules inthe MIKE models. The purpose is to calibrate the flow description. The structure itself is not included inthe sediment transport model, as this would require a refined flow model (3D CFD code such as NS3).Any morphological changes near a structure are predicted solely based on the cross-sections up- anddownstream of the structure and the predicted flow and water levels.
Figure 2 Example of interpolation of cross-section data from a river survey into a MIKE21C grid
Data Requirements.doc - 4 - DHI Water & Environment
Hydrodynamics
HydrographsIn most applications, morphological models (1D as well as 2D) require an upstream discharge boundarycondition and a downstream water level boundary condition. In addition, some parts of the channelsystem may be described as “closed boundaries”, in which case this will simply be defined with a zerodischarge boundary condition. In addition, discharge data is required in the interior of the model area toestablish the right water balance in case there is a substantial exchange of flow between channel andfloodplains (and ground infiltration, evaporation, precipitation etc.).
[meter] Water Level - 4-12-1974 09:00:00 DELTA05A.RES11
Figure 3 Data for boundary conditions
Boundary conditions for morphological modelling often cover very long time periods (decades). Old dataof water level and discharges from different stations must be collected. Discharge time series are usuallybased on rating curves, which relate a continuously measured water level with discharge measurementswith different intervals. It is advisable to review and if necessary to revise such rating curves. In particularextreme discharges can be associated with considerable uncertainty if such rated discharges are based onextrapolations from measurements at a much lower stage.
If the station of the rating curve is located at a channel constriction (often the case at a bridge), particularcaution must be exercised as the constriction is subject to scour during extreme flow events andsubsequent sedimentation during low flow periods. Furthermore, a measurement station can be subject tosubstantial morphological changes over the time period in consideration. If the rating curve is based ononly one set of discharge measurements, it may not be representative for the entire simulation period.Thus, the variation in the bed elevation at the measuring station can be necessary to consider for accurateprediction of the upstream hydrograph.
In absence of reliable discharge time series, a synthetic discharge time series can be generated as a lastoption by assuming for instance natural slope conditions at the station, and use the water level slope,water level and cross-section data to calculate the corresponding natural discharge.
If the required morphological model is only covering the main channel and floodplains are excluded (butstill important in terms of the water balance due to exchange of flow between channel and floodplain),one way to establish reliable discharge boundaries for the main channel is to establish a model (for
Closed end
Closed end
Closed end
Dischargetime series
Water leveltime series
Water leveltime series
Data Requirements.doc - 5 - DHI Water & Environment
instance a 1D model) covering the entire floodplain-channel system, and to use this model to calculatedischarges in the main channel. This extracted discharge time series can subsequently be applied asupstream boundary condition (plus possibly additional lateral inflow boundaries further downstream) inthe detailed model (e.g. 2D model) covering only the main channel.
Downstream discharge boundaries can be applied also, but they may be source of instability and shouldbe avoided: If the imposed discharge outflow boundary condition is higher than the actual conveyancecapacity of the channel at the downstream location, the boundary will be “drained”. The imbalancebetween the river models conveyance and the actual boundary condition can be caused by for instance 1)inaccurate representation of the channel bathymetry at low flow (too coarse grid), 2) inaccuratecalibration of the bed resistance, 3) morphological changes during the simulation which alters the modelsconveyance at the boundary location. Therefore, it is recommended always to apply upstream dischargeboundaries and downstream water level boundaries.
Water levelsAccurate simulation of the water level and energy slope in the morphological models requires calibrationof the bed resistance number. With an upstream discharge and downstream water level boundary, themain target parameter is the water level at various locations along the river. Therefore, a number of waterlevel measurements along the river is required, and as a minimum at the upstream boundary. The waterlevel time series do not have to be continuos or to cover the entire time period. However, they shouldpreferably cover both low flow and high flow conditions in order to provide a representative calibrationparameter.
It should be noted that simulated water levels at low flow are very sensitive to the accuracy of the modelbathymetry. One single cross-section and/or grid point may cause backwater effect, which effects thewater level in a longer reach upstream of this point. On the other hand, the simulated water level at highflow is more insensitive to local inaccuracies in the bathymetry. For morphological simulations, usuallythe high flow events are most important.
VelocityVelocity measurements are required to obtain information about the flow distribution across the riverchannel and flow patterns in bifurcations and confluences. The traditional equipment is a mechanicalpropeller. More efficient equipment for velocity measurements is ADCP, as this provides a continuos lineof velocity measurements and at various depths. Cross-sections of flow velocity are particular interestingfor calibration and validation of the hydrodynamic model in three lines: before, in the middle and after a
Water leveltime series
Data Requirements.doc - 6 - DHI Water & Environment
river bend. In addition, the distribution of flow between main channel and adjacent floodplain isimportant.
Figure 5 Example of simulated flow distribution in the main channel and the adjacent floodplains inside thesummer dikes
Furthermore, in large braided rivers, it is important to cover the transition from deeper parts of the cross-section to the shallow bars. Measurements of velocity should preferably be carried out during high flow,Ideally, measurements are carried out during rising stage, maximum stage and falling stage.
Figure 6 Data for calibration of bed resistance and eddy viscosity (flow velocity, left: observed, right:simulated in the model)
Velocity profiles
Data Requirements.doc - 7 - DHI Water & Environment
In addition to ADCP (or mechanical propeller) measurements, a continuous flow-meter mounted in theriver bed or on a bridge pier can measure the flow during the entire survey campaign period (but only atone particular point, which is often selected where the flow velocity is critical).
Sediment Transport
Bed samplesFor sediment transport modelling, it is necessary to know the characteristics of the sediment in the riverbed. Therefore it is recommended to collect a number of bed sediment grap samples. These samplesshould be analysed (sieve analyses) in terms of grain size distribution. A typical level of detail is 5 grapsamples from each cross-section in say 4 cross-sections in a study reach. In case the sediment is graded,more samples are required. In addition, samples from different depths below the surface of the riverbedmay be required. Often, this will reveal armoured layers, sand layers on top of gravel layers etc.
Figure 7 Example of the result of bed samples along a river. The d50 grain size diameter is depicted.
Bed samplesGrain size
Suspendedsediment samplesGrain size
Data Requirements.doc - 8 - DHI Water & Environment
Figure 8 Example of a river where there may be some differences in the sediment grain size from the gravelbar (in the foreground) to the main channel (in the background).
Suspended samplesDuring the velocity measurement campaign, suspended sediment samples (in case of sandy river) shouldpreferably be carried out at the same time. One approach is to apply depth integrated bottle samples,which is filled while being lowered and heaved. Point samples (at different depths) should be done withpumping, where a larger water sampler can be collected over a certain period of time and therebyminimising the uncertainty (time integrated sample). The water samples should be brought to laboratoryand analysed with respect to concentration of suspended sediment, percentage of fine sediment(washload), and with respect to grain size distribution of the remaining coarser suspended sediment.
Data Requirements.doc - 9 - DHI Water & Environment
Figure 9 A grain size distribution curve for the suspended sample (dashed line) and bed sample (full line) iscompared in order to find the scaling factor “a” which divides between wash load and suspended bedmaterial.
The concentration of suspended sediment must be divided into wash load (which is disregarded inmorphological modelling) and suspended bed load. A method to do so is as illustrated in the figure aboveto compare the grain size distribution of suspended and bed samples, respectivly.
Sediment transport ratesSediment transport is divided into different categories. The transport modes of particular relevance inmorphological modelling, where the interaction between river bed and water column is considered, aresuspended bed material load and bed load. Wash load is by definition not interacting with the sediment on
SS (mg/l)
SS-Wash load(mg/l)
SS-Suspended load(mg/l)
Representativesuspended sample
Representative bedmaterial sample
100%
0%
0.01mm 0.1mm 1.0mm 10.0mm
a
perc
enta
ge
Grain size
Suspended sampleBed sample
Data Requirements.doc - 10 - DHI Water & Environment
the river bed (however, in the floodplain, the wash load may be transformed into suspended bed materialload, as deposition can take place here).
Measurements of sediment transport rates at different locations along the river are useful for calibration ofthe sediment transport model. Equipment of this is bed load meters (e.g. Helley-Smith) and suspendedsediment samples (concentration) combined with velocity and depth measurements.
Figure 10 Establishment of sediment rating curves (sediment transport against discharge).
Such data can be difficult to establish and associated with significant uncertainty. Indirect data sources arebackfilling rates in dredged trenches and navigation channels, differences in scour depths in well-definedconstrictions (bridges) between low flow and high flow, mobility of sand bars etc. Analyses of suchindicators are useful to validate/establish sediment transport rates. Measured and simulated sedimenttransport rates can be compared as time series or as rating curves (transport rate against flow discharge).A sediment rating curve is good because it integrates all measurements in time and depict the average. Onthe other hand, hysteresis effects are not revealed. Often, the sediment transport rate can be differentduring a rising limb of the hydrograph as compared to the falling stage. Other effects such as a submergedsand bar propagating through the measurement station may have other impact on the sediment ratingcurves.
Cohesive sediment samplesIf the sediment is cohesive, a number of extra samples are required. Undisturbed core samples should becollected and analysed with respect to dry density, content of organic material, shear strength. Preferably,a profile of density is established. In a sediment laboratory, erosion and consolidation tests can beperformed. In-situ erosion tests are recommended, as this will eliminate the (large) uncertainties in
Sedimenttransport
Suspended load
Bed load
Wash load
Suspended bed material load
Sediment rating curve
Suspendedsediment:Concentration andflow
Bed loadmeasurements
Data Requirements.doc - 11 - DHI Water & Environment
reproducing natural conditions in a laboratory. SPT tests may be useful to elaborate different sedimentcharacteristics at different layers. In-situ fall velocity tests (e.g. Owen tubes) are useful for establishsettling properties. Mobility and thickness of mud layers must be surveyed.
Morphology
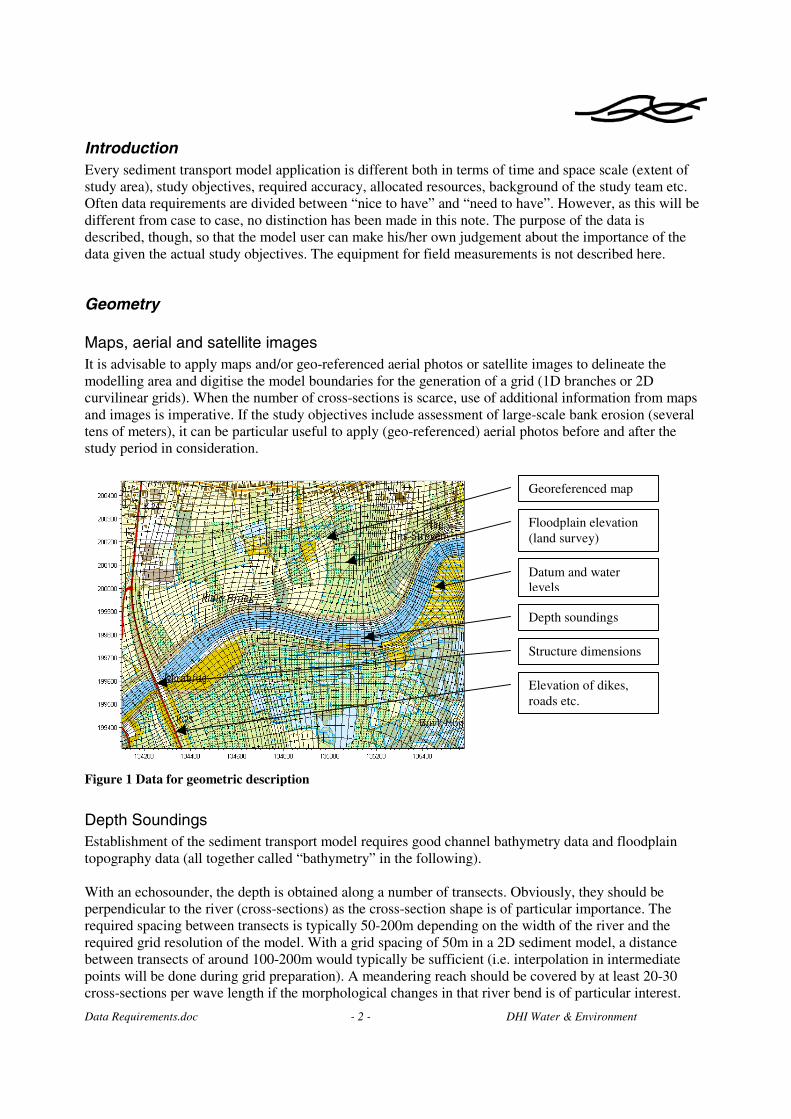
BathymetryCalibration of the morphological model is based on calibration of the hydrodynamics, and the sedimenttransport model, respectively. The validation of the morphological model is to compare simulated andobserved bed level changes. Thus, bathymetry measurements at different times are required, for instancebefore and after large flood events. Often, it is sufficient to carry out a full bathymetry covering the entirestudy area from for instance before the time period to be simulated, and to supplement this with additionalcross-section surveys in just a few transect lines at different times. There should be cross-sectioninformation before the flood event (or time period in consideration), during maximum flow, and after theflood event.
Figure 11 Examples of channel bathymetries before, during and after a major flood.
Historic information about the river bathymetry (from maps and historic surveys) further supplements thisinformation. If the bank erosion rate is very high, it is necessary to make separate measurements of thebank retreat.
Pre-flood Flood Post-Flood
Repeatedbathymetrysurveys
Data Requirements.doc - 12 - DHI Water & Environment
Sediment boundariesIn a morphological model with dynamic feedback between the hydrodynamics, sediment transport andbed level and planform changes, the upstream sediment transport boundary condition is important. Thelonger the simulation period is, the more important the boundary condition is. Basically, two types ofboundaries can be imposed: Bed levels or sediment transport rates at the boundary. The former is oftenapplied, if it can be assumed with good approximation, that the bed level remains the same at theupstream boundary. The latter is applied, if specification of sediment transport (e.g. a zero transport) canbe done accurately. This could for instance be as a sediment rating curve.
Curve fit: Qs = 0.0696Q1.4852
1
10
100
1000
0 50 100 150 200 250
Discharge (m3/s)
Sed
imen
t lo
ad (
kg/s
)
Simulated
Mw andenga
Upper bend
Low er bend
Pow er (Simulated)
Figure 12 Example of simulated and measured sediment rating curve.
More informationMore information about DHI’s sediment transport models for rivers may be found on the internetwww.dhisoftware.com/mike21c or www.dhisoftware.com/mike11 or by contacting DHI.