28
Data & Trends of the European Food and Drink Industry 2013-2014
| Date post: | 27-Jul-2018 |
| Category: |
Documents |
| Upload: | dinhkhuong |
| View: | 214 times |
| Download: | 0 times |
Data & Trends of the European Food and Drink Industry2013-2014
2 FoodDrinkEurope DaTa & TrENDs 2013-2014
Introduction
The ‘2013-2014 Data & Trends of the European food and drink industry’ report provides a comprehensive picture of the structure and economics of our industry, the largest manufacturing sector in the EU. The EU food and drink industry is a pillar of the EU economy, outperforming a large number of other EU manufacturing sectors. However, notwithstanding its strong performance, notably during the current economic downturn, the EU continues to lag behind its main trading partners on R&D investment and export market share.
To fi nd out more about FoodDrinkEurope’s proposal for an EU Industrial Policy tailored to increase the competitiveness of the food and drink sector, visit our website to download the 2013-2014 Competitiveness report.1
This publication covers the whole European food and drink industry, which is identifi ed by the
NACE rev2 codes C10 (food products) and C11 (drinks). For more information on classifi cation
and on economic indicators’ defi nition, please visit http://epp.eurostat.ec.europa.eu/portal/
page/portal/statistics/metadata.
Table of Contents
Food and drink industry fi gures 3
EU single market 4
Contribution to the EU economy 5
Employment 6
SMEs 7
Sub-sectors 8
The national picture 9
R&D and innovation 10
Consumption 11
Food supply chain 12
Trust 13
World markets 14
2012 trade fi gures 15
2012 trade fi gures by sub-sector 16
2013 trade trends 17
EU food and drink market share 18
Food and drink industries worldwide 19
Global trends in R&D 20
Future challenges 21
European and global ranking of food and drink companies 22
Glossary 24(1) http://www.fooddrinkeurope.eu/S=0/publication/competitiveness-report-promoting-an-eu-industrial-policy-
for-food-and-drink/.
3FoodDrinkEurope DaTa & TrENDs 2013-2014
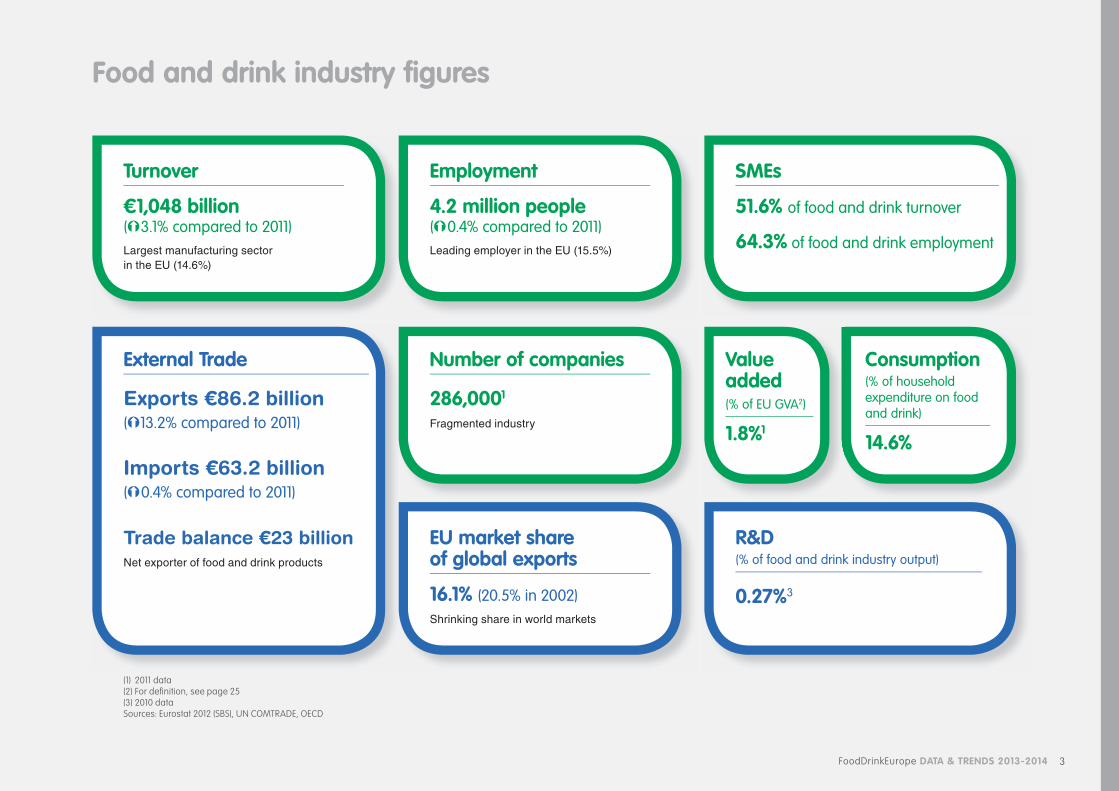
Food and drink industry fi gures
Turnover
€1,048 billion (Ý3.1% compared to 2011)Largest manufacturing sector in the EU (14.6%)
Employment
4.2 million people (Ý0.4% compared to 2011)Leading employer in the EU (15.5%)
sMEs
51.6% of food and drink turnover
64.3% of food and drink employment
External Trade
Exports €86.2 billion(Ý13.2% compared to 2011)
Imports €63.2 billion(Ý0.4% compared to 2011)
Trade balance €23 billion Net exporter of food and drink products
Number of companies
286,0001
Fragmented industry
Value added(% of EU GVA2)
1.8%1
EU market share of global exports
16.1% (20.5% in 2002)Shrinking share in world markets
r&D (% of food and drink industry output)
0.27%3
Consumption(% of household expenditure on food and drink)
14.6%
(1) 2011 data(2) For defi nition, see page 25(3) 2010 dataSources: Eurostat 2012 (SBS), UN COMTRADE, OECD
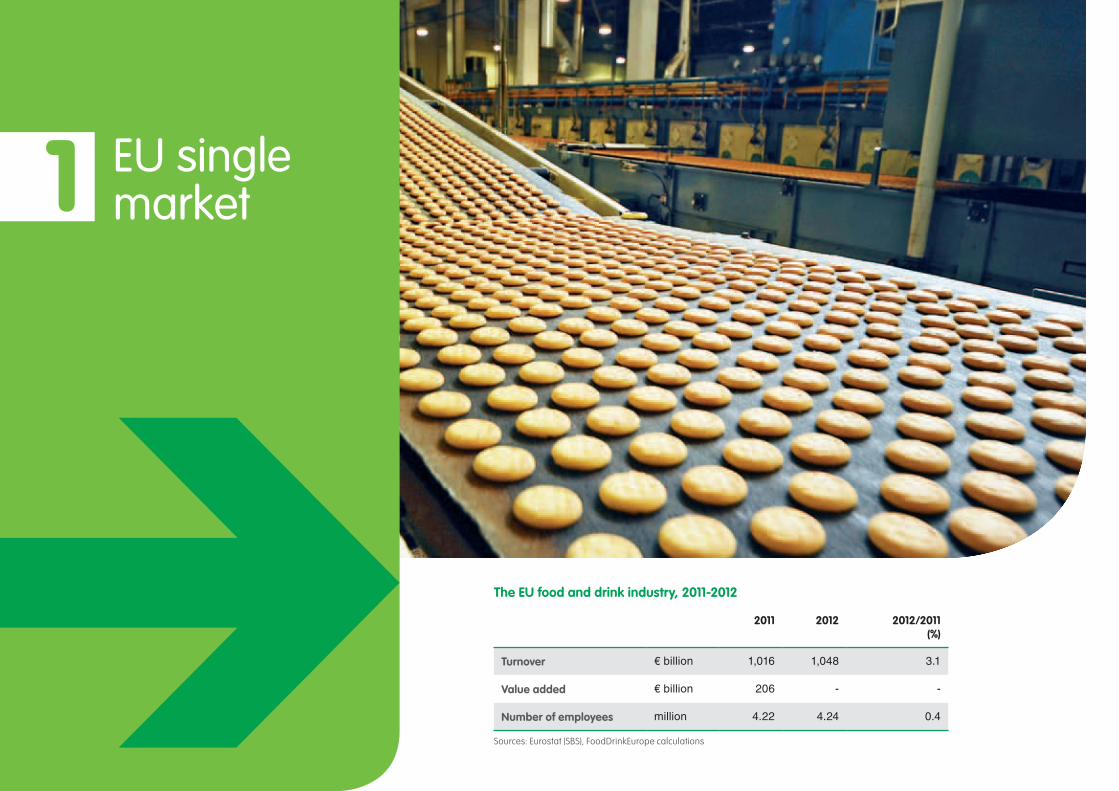
1 EU single market
The EU food and drink industry, 2011-2012
2011 2012 2012/2011 (%)
Turnover € billion 1,016 1,048 3.1
Value added € billion 206 - -
Number of employees million 4.22 4.24 0.4
Sources: Eurostat (SBS), FoodDrinkEurope calculations
5FoodDrinkEurope DaTa & TrENDs 2013-2014
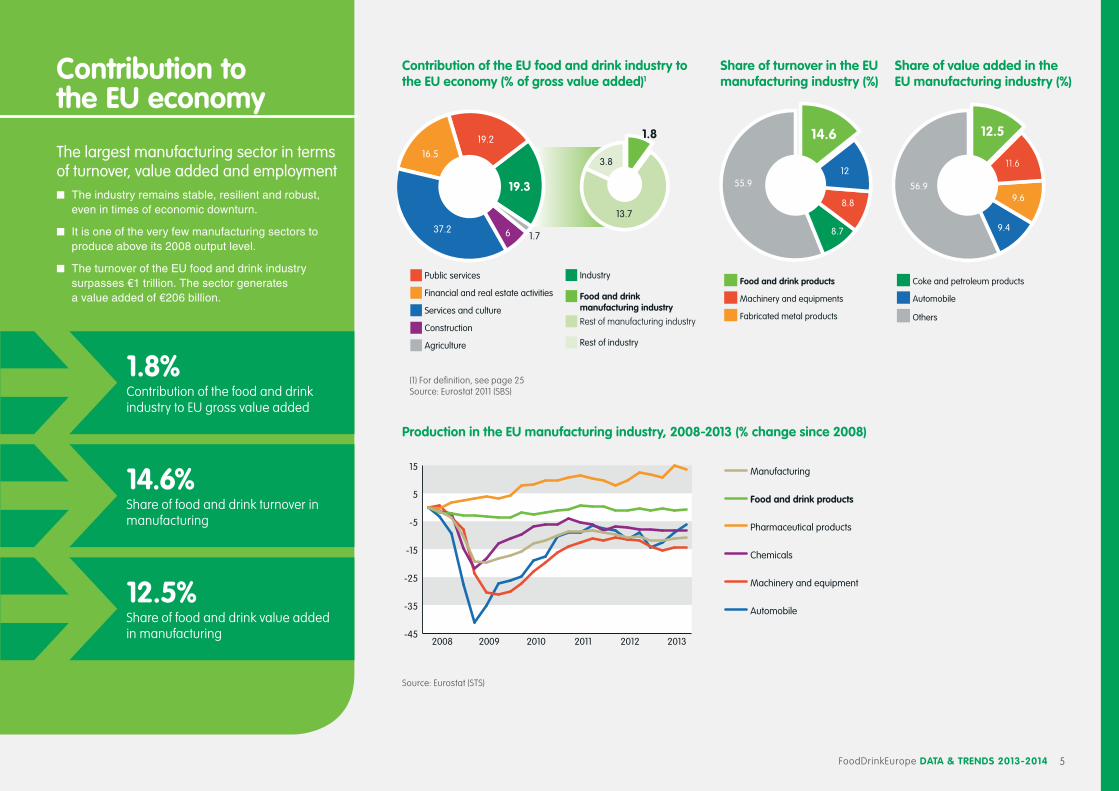
Contribution to the EU economy
The largest manufacturing sector in terms of turnover, value added and employmentn The industry remains stable, resilient and robust,
even in times of economic downturn.
n It is one of the very few manufacturing sectors to produce above its 2008 output level.
n The turnover of the EU food and drink industry surpasses €1 trillion. The sector generates a value added of €206 billion.
Contribution of the EU food and drink industry to the EU economy (% of gross value added)1
share of turnover in the EU manufacturing industry (%)
share of value added in the EU manufacturing industry (%)
Others
Automobile
Fabricated metal products
Machinery and equipments
Food and drink products Coke and petroleum products
12
8.8
8.7
55.9
14.6
11.6
12.5
9.6
9.4
56.9
1.7
19.3
37.2
16.5
19.2
Public services
Financial and real estate activities
Services and culture
Construction
Agriculture
6
Food and drink manufacturing industry
Industry
Rest of manufacturing industry
Rest of industry
1.8
3.8
13.7
(1) For definition, see page 25Source: Eurostat 2011 (SBS)
Production in the EU manufacturing industry, 2008-2013 (% change since 2008)
-45
-35
-25
-15
-5
5
15
Automobile
Machinery and equipment
Chemicals
Pharmaceutical products
Food and drink products
Manufacturing
201320122011201020092008
Source: Eurostat (STS)
14.6%Share of food and drink turnover in manufacturing
1.8%Contribution of the food and drink industry to EU gross value added
12.5%Share of food and drink value added in manufacturing
6 FoodDrinkEurope DaTa & TrENDs 2013-2014
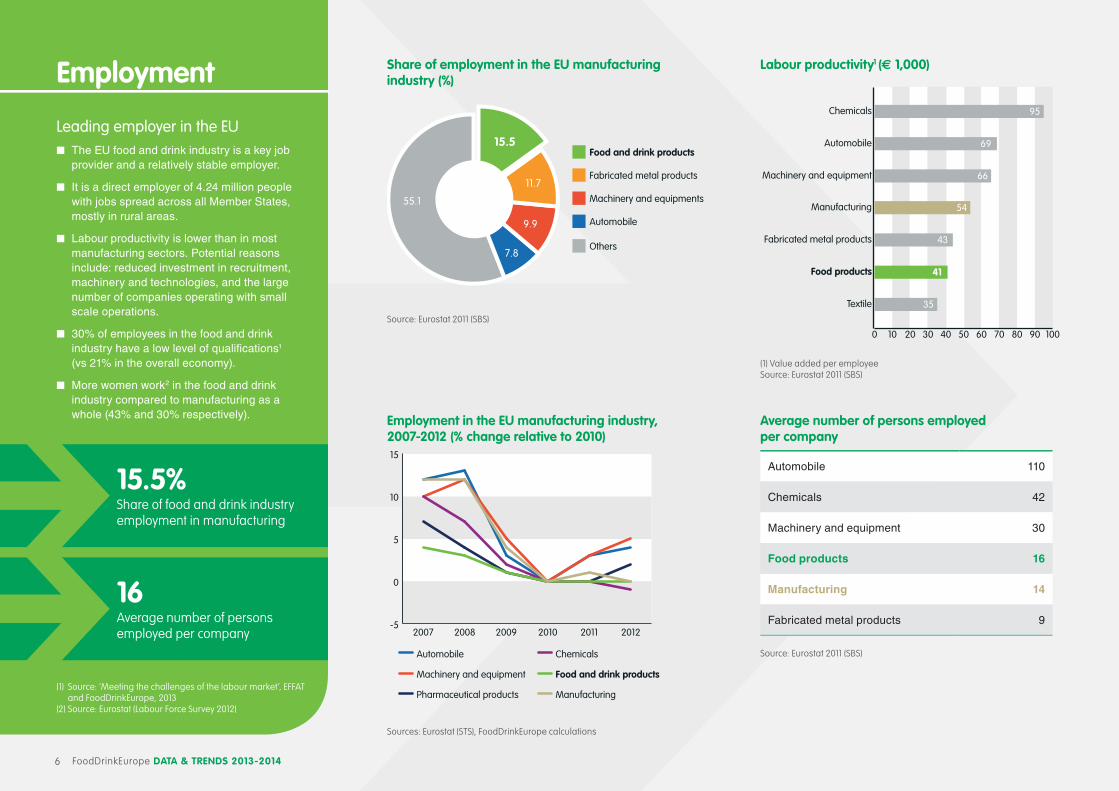
Employment
Leading employer in the EUn The EU food and drink industry is a key job
provider and a relatively stable employer.
n It is a direct employer of 4.24 million people with jobs spread across all Member States, mostly in rural areas.
n Labour productivity is lower than in most manufacturing sectors. Potential reasons include: reduced investment in recruitment, machinery and technologies, and the large number of companies operating with small scale operations.
n 30% of employees in the food and drink industry have a low level of qualifi cations1 (vs 21% in the overall economy).
n More women work2 in the food and drink industry compared to manufacturing as a whole (43% and 30% respectively). Employment in the EU manufacturing industry,
2007-2012 (% change relative to 2010)
-5
0
5
10
15
Automobile
Machinery and equipment
Pharmaceutical products
Chemicals
Food and drink products
Manufacturing
201220112010200920082007
Sources: Eurostat (STS), FoodDrinkEurope calculations
average number of persons employed per company
Automobile 110
Chemicals 42
Machinery and equipment 30
Food products 16
Manufacturing 14
Fabricated metal products 9
Source: Eurostat 2011 (SBS)
Labour productivity1 (€ 1,000)
0 10 20 30 40 50 60 70 80 90 100
Chemicals 95
Automobile 69
Machinery and equipment 66
Manufacturing 54
Fabricated metal products 43
Food products 41
Textile 35
(1) Value added per employeeSource: Eurostat 2011 (SBS)
share of employment in the EU manufacturing industry (%)
11.7
15.5
9.9
7.8Others
Automobile
Machinery and equipments
Fabricated metal products
Food and drink products
55.1
Source: Eurostat 2011 (SBS)
(1) Source: ‘Meeting the challenges of the labour market’, EFFAT and FoodDrinkEurope, 2013
(2) Source: Eurostat (Labour Force Survey 2012)
15.5%Share of food and drink industry employment in manufacturing
16Average number of persons employed per company
7FoodDrinkEurope DaTa & TrENDs 2013-2014
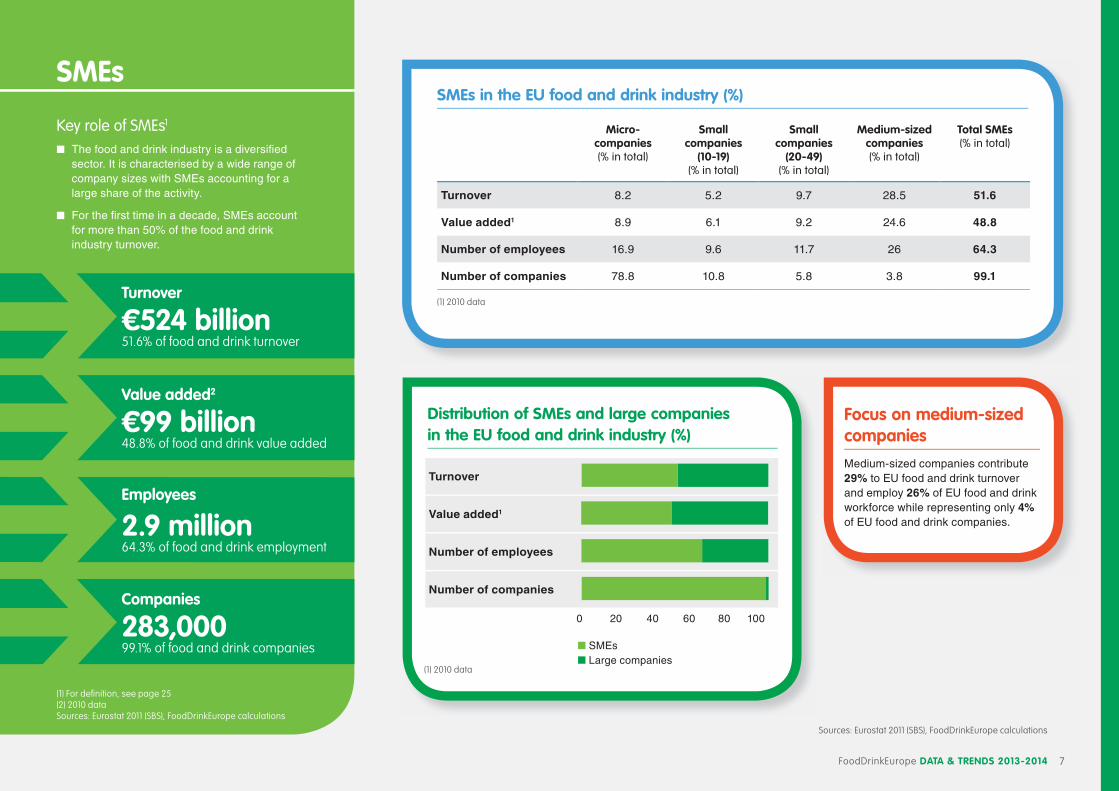
sMEs in the EU food and drink industry (%)
Micro-companies(% in total)
small companies
(10-19)(% in total)
small companies
(20-49)(% in total)
Medium-sized companies(% in total)
Total sMEs(% in total)
Turnover 8.2 5.2 9.7 28.5 51.6
Value added1 8.9 6.1 9.2 24.6 48.8
Number of employees 16.9 9.6 11.7 26 64.3
Number of companies 78.8 10.8 5.8 3.8 99.1
Focus on medium-sized companies
Medium-sized companies contribute 29% to EU food and drink turnover and employ 26% of EU food and drink workforce while representing only 4% of EU food and drink companies.
sMEs
Key role of SMEs1
n The food and drink industry is a diversifi ed sector. It is characterised by a wide range of company sizes with SMEs accounting for a large share of the activity.
n For the fi rst time in a decade, SMEs account for more than 50% of the food and drink industry turnover.
Turnover
€524 billion 51.6% of food and drink turnover
Value added2
€99 billion 48.8% of food and drink value added
Employees
2.9 million 64.3% of food and drink employment
Companies
283,00099.1% of food and drink companies
(1) For defi nition, see page 25(2) 2010 dataSources: Eurostat 2011 (SBS), FoodDrinkEurope calculations
(1) 2010 data
Turnover
Value added1
Number of employees
Number of companies
(1) 2010 data
0 20 40 60 80 100
n SMEs
n Large companies
Sources: Eurostat 2011 (SBS), FoodDrinkEurope calculations
Distribution of sMEs and large companies in the EU food and drink industry (%)
8 FoodDrinkEurope DaTa & TrENDs 2013-2014
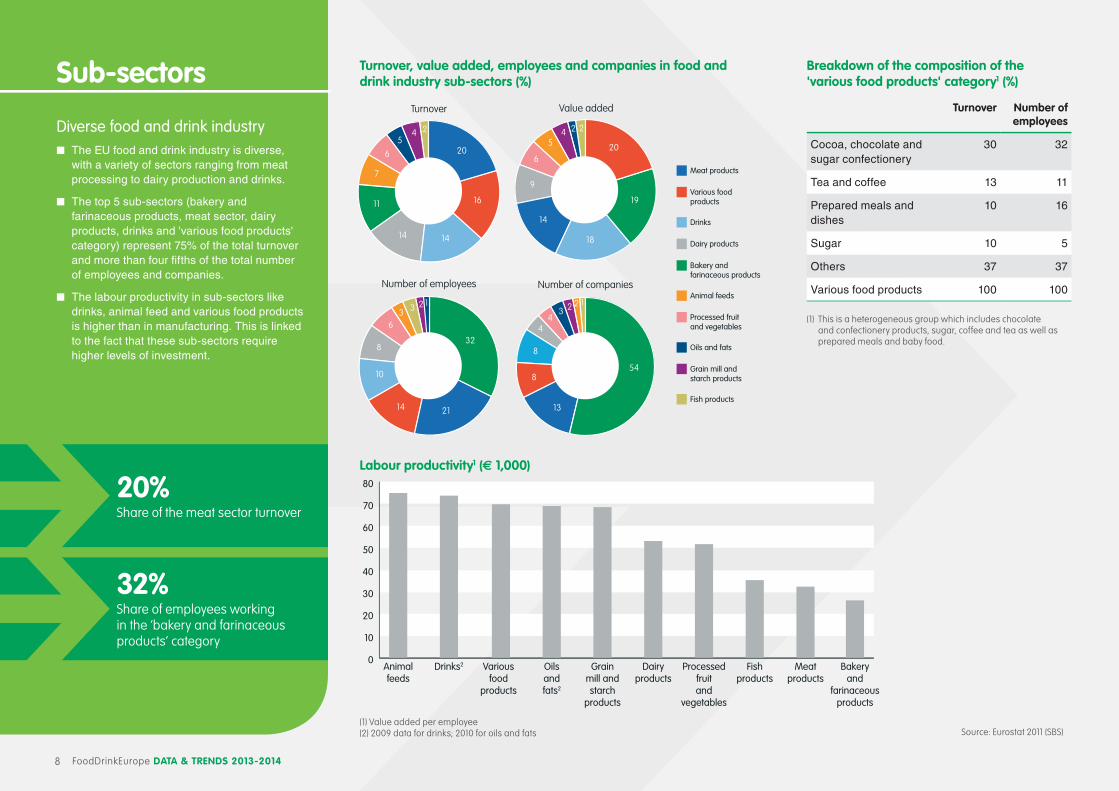
Breakdown of the composition of the 'various food products' category1 (%)
Turnover Number of employees
Cocoa, chocolate and sugar confectionery
30 32
Tea and coffee 13 11
Prepared meals and dishes
10 16
Sugar 10 5
Others 37 37
Various food products 100 100
(1) This is a heterogeneous group which includes chocolate and confectionery products, sugar, coffee and tea as well as prepared meals and baby food.
Labour productivity1 (€ 1,000)
0
10
20
30
40
50
60
70
80
Bakeryand
farinaceousproducts
Meatproducts
Fishproducts
Processedfruitand
vegetables
Dairyproducts
Variousfood
products
Grainmill andstarch
products
Oilsandfats2
Animalfeeds
Drinks2
(1) Value added per employee(2) 2009 data for drinks; 2010 for oils and fats
Value added
20
19
18
14
9
6
54 2 2
Fish products
Grain mill and starch products
Oils and fats
Processed fruit and vegetables
Animal feeds
Bakery and farinaceous products
Dairy products
Drinks
Various food products
Meat products
Turnover
20
16
1414
11
7
6
54 2
Number of employees
32
2114
10
8
63 3 2 1
Number of companies
54
13
8
8
44
3 2 2 1
Turnover, value added, employees and companies in food and drink industry sub-sectors (%)
Source: Eurostat 2011 (SBS)
sub-sectors
Diverse food and drink industry n The EU food and drink industry is diverse,
with a variety of sectors ranging from meat processing to dairy production and drinks.
n The top 5 sub-sectors (bakery and farinaceous products, meat sector, dairy products, drinks and 'various food products' category) represent 75% of the total turnover and more than four fi fths of the total number of employees and companies.
n The labour productivity in sub-sectors like drinks, animal feed and various food products is higher than in manufacturing. This is linked to the fact that these sub-sectors require higher levels of investment.
20%Share of the meat sector turnover
32%Share of employees working in the ‘bakery and farinaceous products’ category
9FoodDrinkEurope DaTa & TrENDs 2013-2014
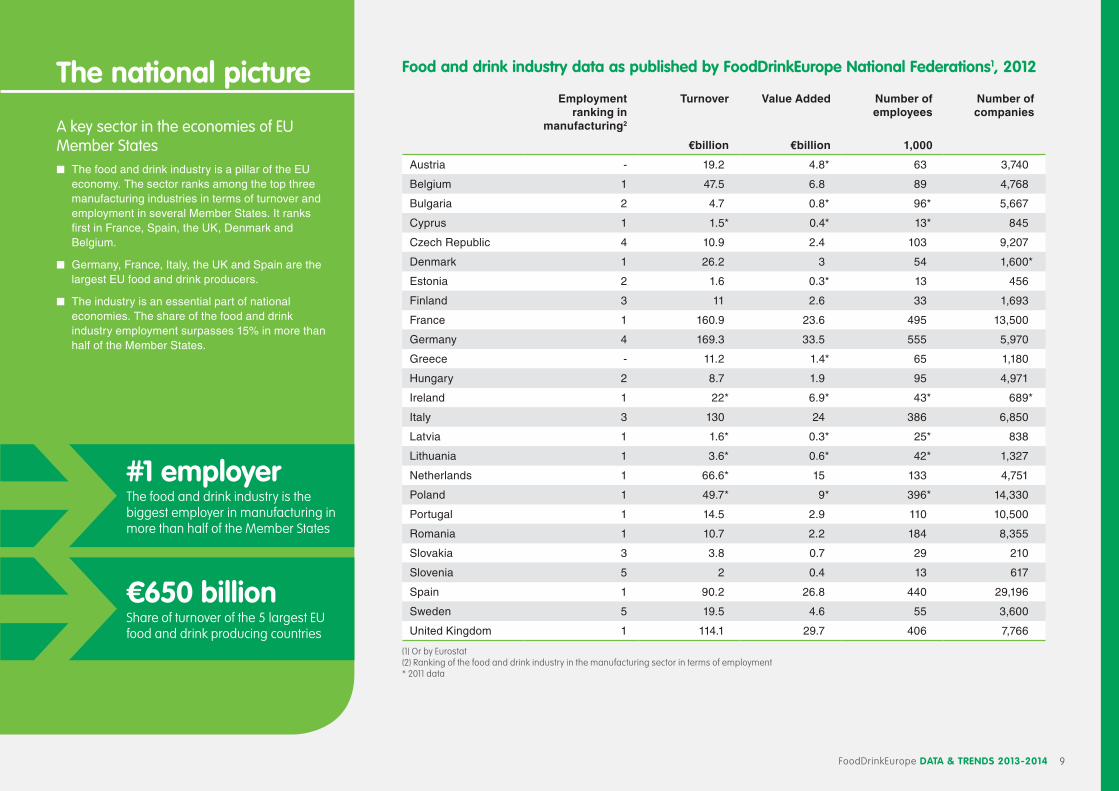
Food and drink industry data as published by FoodDrinkEurope National Federations1, 2012
Employment ranking in
manufacturing2
Turnover Value Added Number of employees
Number of companies
€billion €billion 1,000
Austria - 19.2 4.8* 63 3,740
Belgium 1 47.5 6.8 89 4,768
Bulgaria 2 4.7 0.8* 96* 5,667
Cyprus 1 1.5* 0.4* 13* 845
Czech Republic 4 10.9 2.4 103 9,207
Denmark 1 26.2 3 54 1,600*
Estonia 2 1.6 0.3* 13 456
Finland 3 11 2.6 33 1,693
France 1 160.9 23.6 495 13,500
Germany 4 169.3 33.5 555 5,970
Greece - 11.2 1.4* 65 1,180
Hungary 2 8.7 1.9 95 4,971
Ireland 1 22* 6.9* 43* 689*
Italy 3 130 24 386 6,850
Latvia 1 1.6* 0.3* 25* 838
Lithuania 1 3.6* 0.6* 42* 1,327
Netherlands 1 66.6* 15 133 4,751
Poland 1 49.7* 9* 396* 14,330
Portugal 1 14.5 2.9 110 10,500
Romania 1 10.7 2.2 184 8,355
Slovakia 3 3.8 0.7 29 210
Slovenia 5 2 0.4 13 617
Spain 1 90.2 26.8 440 29,196
Sweden 5 19.5 4.6 55 3,600
United Kingdom 1 114.1 29.7 406 7,766
(1) Or by Eurostat (2) Ranking of the food and drink industry in the manufacturing sector in terms of employment * 2011 data
The national picture
A key sector in the economies of EU Member Statesn The food and drink industry is a pillar of the EU
economy. The sector ranks among the top three manufacturing industries in terms of turnover and employment in several Member States. It ranks first in France, Spain, the UK, Denmark and Belgium.
n Germany, France, Italy, the UK and Spain are the largest EU food and drink producers.
n The industry is an essential part of national economies. The share of the food and drink industry employment surpasses 15% in more than half of the Member States.
#1 employerThe food and drink industry is the biggest employer in manufacturing in more than half of the Member States
€650 billionShare of turnover of the 5 largest EU food and drink producing countries
10 FoodDrinkEurope Data & trenDs 2013-2014
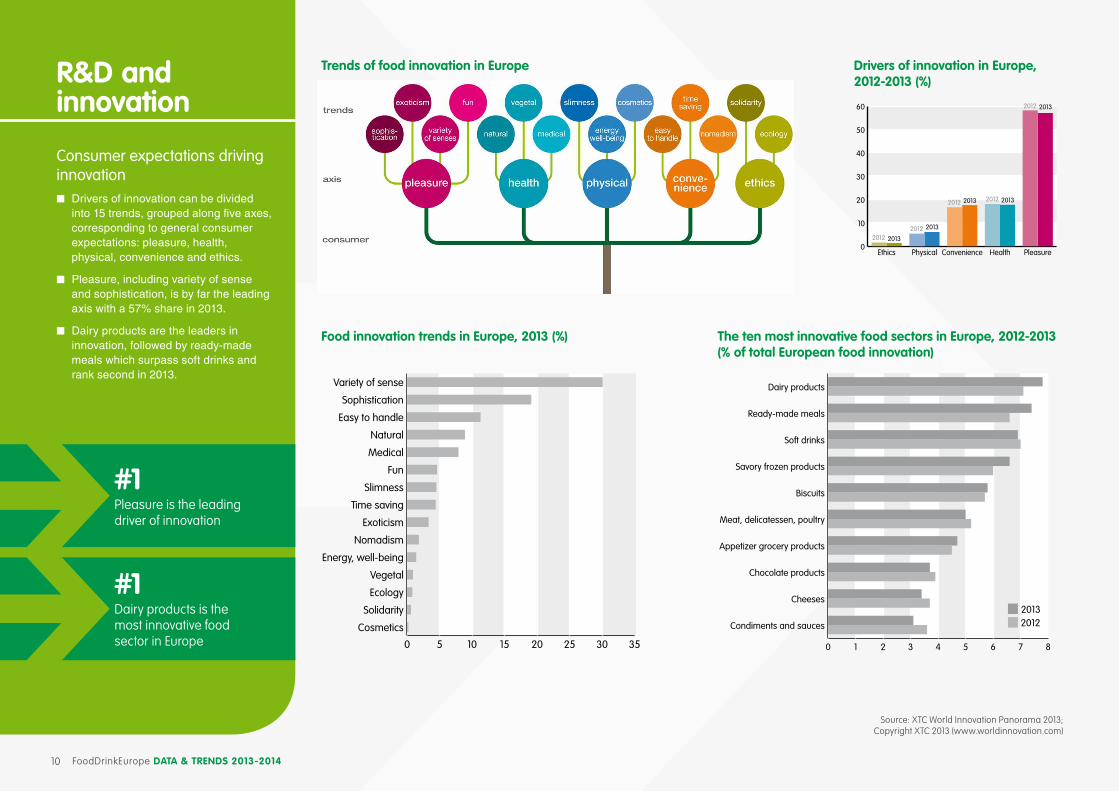
Food innovation trends in europe, 2013 (%)
0 5 10 15 20 25 30 35
Cosmetics
Solidarity
Ecology
Vegetal
Energy, well-being
Nomadism
Exoticism
Time saving
Slimness
Fun
Medical
Natural
Easy to handle
Sophistication
Variety of sense
the ten most innovative food sectors in europe, 2012-2013 (% of total european food innovation)
20122013
0 1 2 3 4 5 6 7 8
Condiments and sauces
Cheeses
Chocolate products
Appetizer grocery products
Meat, delicatessen, poultry
Biscuits
Savory frozen products
Soft drinks
Ready-made meals
Dairy products
Source: XTC World Innovation Panorama 2013; Copyright XTC 2013 (www.worldinnovation.com)
trends of food innovation in europer&D and innovation
Consumer expectations driving innovation n Drivers of innovation can be divided
into 15 trends, grouped along five axes, corresponding to general consumer expectations: pleasure, health, physical, convenience and ethics.
n Pleasure, including variety of sense and sophistication, is by far the leading axis with a 57% share in 2013.
n Dairy products are the leaders in innovation, followed by ready-made meals which surpass soft drinks and rank second in 2013.
#1Pleasure is the leading driver of innovation
#1 Dairy products is the most innovative food sector in Europe
Drivers of innovation in europe, 2012-2013 (%)
0
10
20
30
40
50
60
PleasureHealthConveniencePhysicalEthics
20132012
20132012
20132012 20132012
20132012
11FoodDrinkEurope DaTa & TrENDs 2013-2014
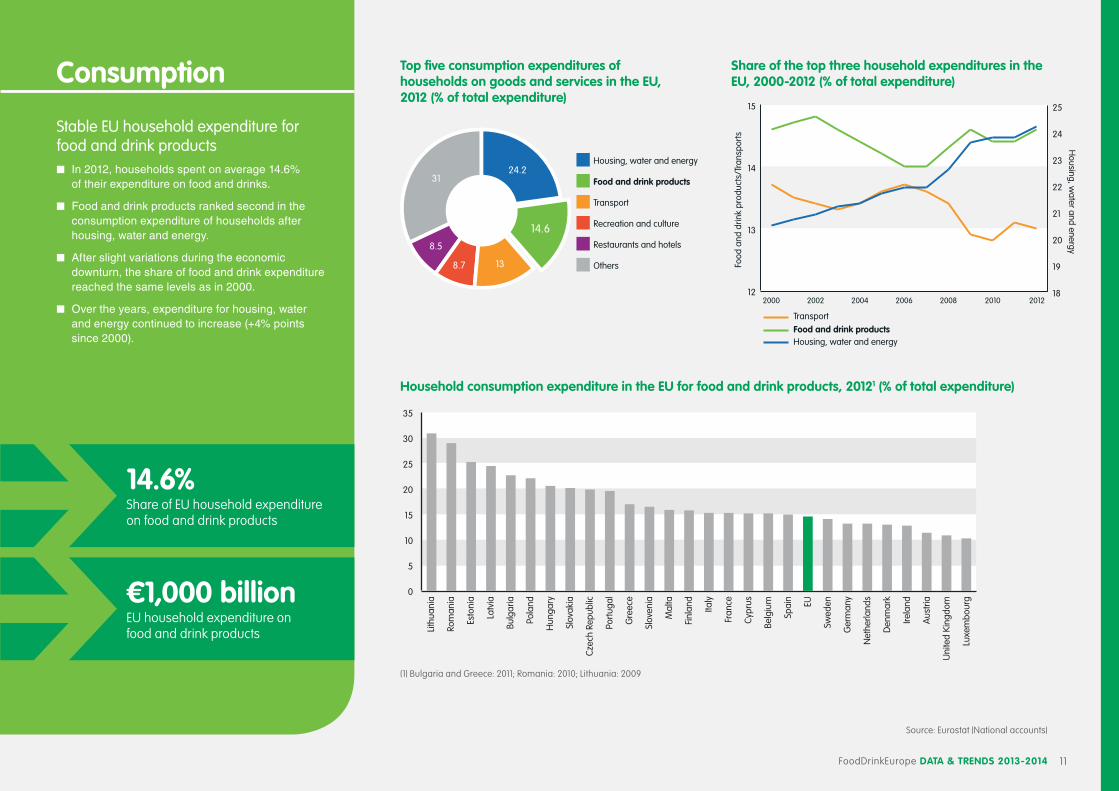
Consumption
Stable EU household expenditure for food and drink productsn In 2012, households spent on average 14.6%
of their expenditure on food and drinks.
n Food and drink products ranked second in the consumption expenditure of households after housing, water and energy.
n After slight variations during the economic downturn, the share of food and drink expenditure reached the same levels as in 2000.
n Over the years, expenditure for housing, water and energy continued to increase (+4% points since 2000).
Top five consumption expenditures of households on goods and services in the EU, 2012 (% of total expenditure)
Others
Restaurants and hotels
Recreation and culture
Transport
Food and drink products
Housing, water and energy24.2
14.6
138.7
8.5
31
share of the top three household expenditures in the EU, 2000-2012 (% of total expenditure)
12
13
14
15
Transport
Food and drink products
201220102008200620042002200018
19
20
21
22
23
24
25
Housing, water and energy
Housing, w
ater and energy
Foo
d an
d dr
ink
prod
ucts
/Tra
nspo
rts
14.6%Share of EU household expenditure on food and drink products
€1,000 billionEU household expenditure on food and drink products
Household consumption expenditure in the EU for food and drink products, 20121 (% of total expenditure)
Luxe
mbo
urg
Uni
ted
Kin
gdom
Aus
tria
Net
herla
nds
Ger
man
y
Den
mar
k
Irela
nd
Swed
en
Cyp
rus
EU
Spai
n
Italy
Fran
ce
Belg
ium
Finl
and
Mal
ta
Slov
enia
Gre
ece
Port
ugal
Cze
ch R
epub
lic
Slov
akia
Hun
gary
Bulg
aria
Pola
nd
Latv
ia
Esto
nia
Lith
uani
a
Rom
ania
0
5
10
15
20
25
30
35
(1) Bulgaria and Greece: 2011; Romania: 2010; Lithuania: 2009
Source: Eurostat (National accounts)
12 FoodDrinkEurope DaTa & TrENDs 2013-2014
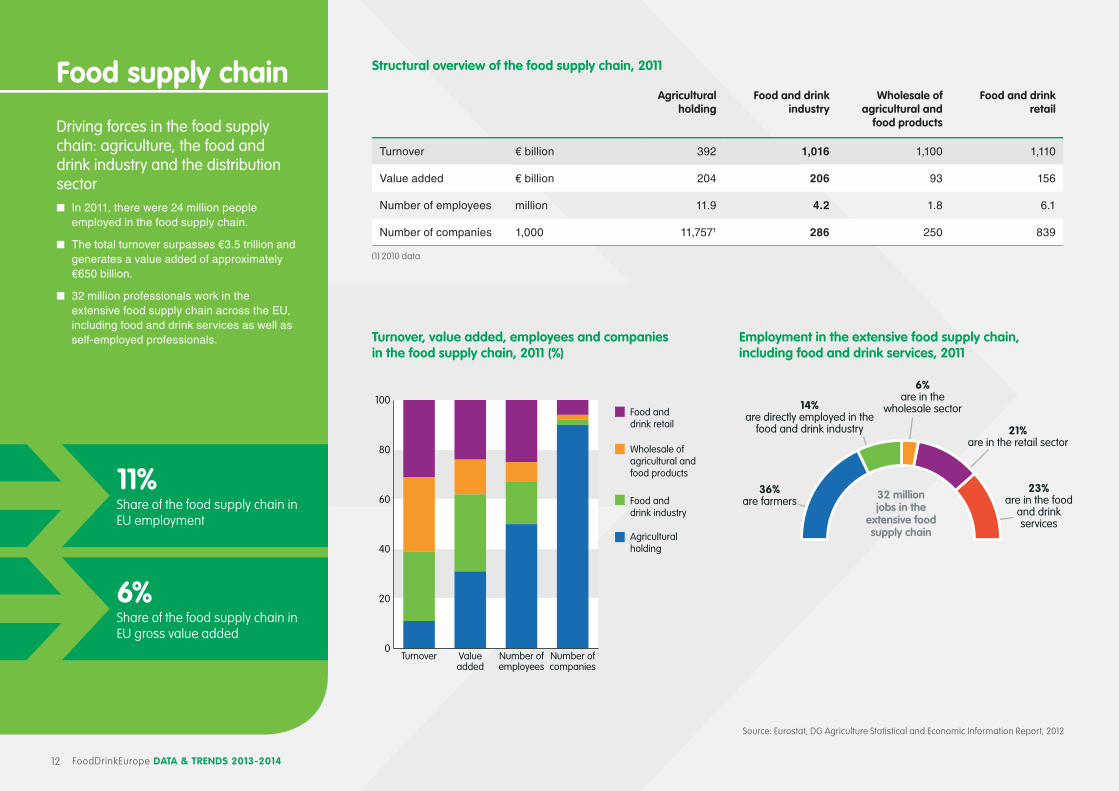
structural overview of the food supply chain, 2011
agricultural holding
Food and drink industry
Wholesale of agricultural and
food products
Food and drink retail
Turnover € billion 392 1,016 1,100 1,110
Value added € billion 204 206 93 156
Number of employees million 11.9 4.2 1.8 6.1
Number of companies 1,000 11,7571 286 250 839
(1) 2010 data
Food supply chain
Driving forces in the food supply chain: agriculture, the food and drink industry and the distribution sector n In 2011, there were 24 million people
employed in the food supply chain.
n The total turnover surpasses €3.5 trillion and generates a value added of approximately €650 billion.
n 32 million professionals work in the extensive food supply chain across the EU, including food and drink services as well as self-employed professionals.
11%Share of the food supply chain in EU employment
6%Share of the food supply chain in EU gross value added
Turnover, value added, employees and companies in the food supply chain, 2011 (%)
Source: Eurostat, DG Agriculture Statistical and Economic Information Report, 2012
Employment in the extensive food supply chain, including food and drink services, 2011
36%are farmers
14%are directly employed in the
food and drink industry
6%are in the
wholesale sector
21%are in the retail sector
23%are in the food
and drink services
32 millionjobs in the
extensive food supply chain
0
20
40
60
80
100
Number ofcompanies
Number ofemployees
Valueadded
Turnover
Agricultural holding
Food and drink industry
Wholesale of agricultural and food products
Food and drink retail
13FoodDrinkEurope DaTa & TrENDs 2013-2014
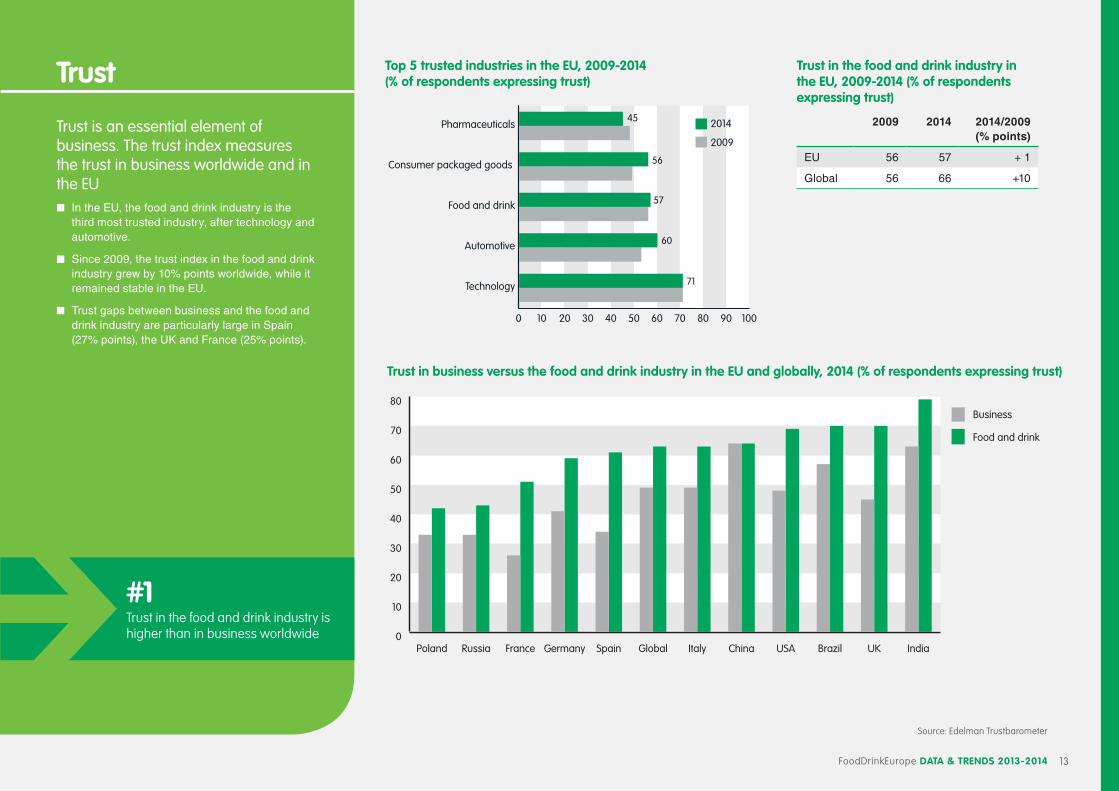
Trust
Trust is an essential element of business. The trust index measures the trust in business worldwide and in the EUn In the EU, the food and drink industry is the
third most trusted industry, after technology and automotive.
n Since 2009, the trust index in the food and drink industry grew by 10% points worldwide, while it remained stable in the EU.
n Trust gaps between business and the food and drink industry are particularly large in Spain (27% points), the UK and France (25% points).
#1Trust in the food and drink industry is higher than in business worldwide
Top 5 trusted industries in the EU, 2009-2014 (% of respondents expressing trust)
0 10 20 30 40 50 60 70 80 90 100
2009
2014
Technology
Automotive
Food and drink
Consumer packaged goods
Pharmaceuticals45
56
57
60
71
Trust in the food and drink industry in the EU, 2009-2014 (% of respondents expressing trust)
2009 2014 2014/2009 (% points)
EU 56 57 + 1
Global 56 66 +10
Trust in business versus the food and drink industry in the EU and globally, 2014 (% of respondents expressing trust)
0
10
20
30
40
50
60
70
80
Food and drink
Business
IndiaUKBrazilUSAChinaItalyGlobalSpainGermanyFranceRussiaPoland
Source: Edelman Trustbarometer
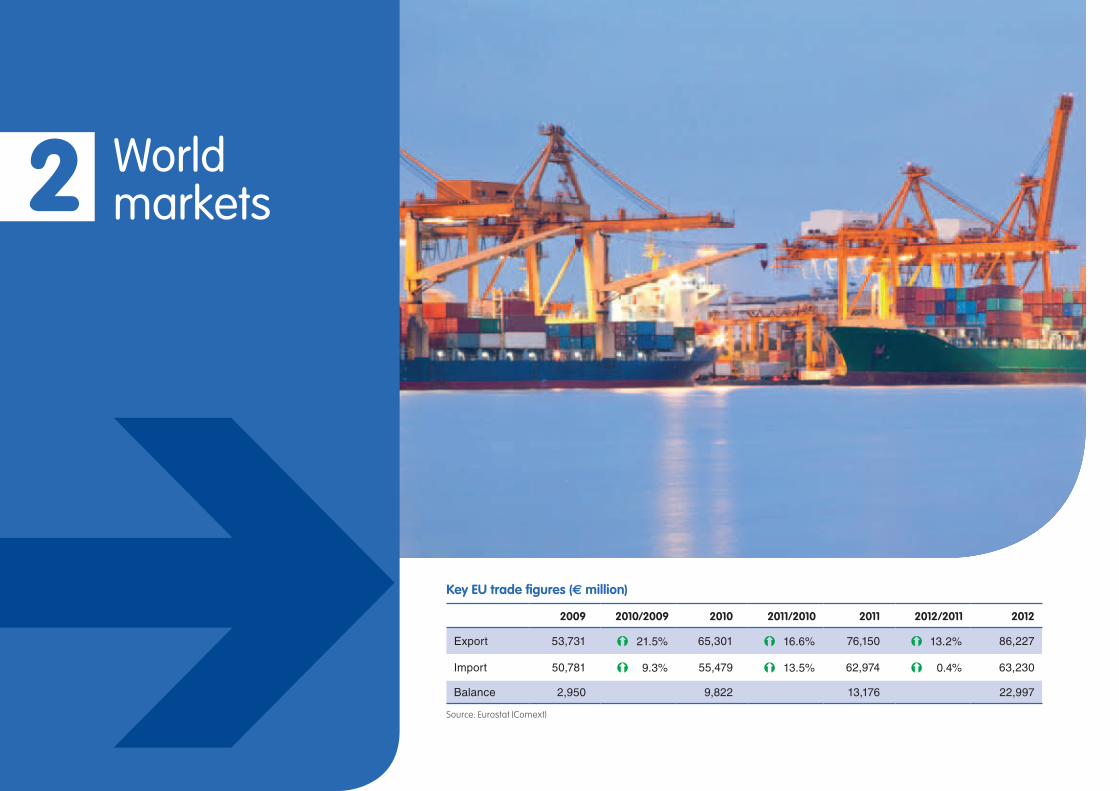
2 World markets
Key EU trade figures (€ million)
2009 2010/2009 2010 2011/2010 2011 2012/2011 2012
Export 53,731 Ý21.5% 65,301 Ý16.6% 76,150 Ý13.2% 86,227
Import 50,781 Ý9.3% 55,479 Ý13.5% 62,974 Ý0.4% 63,230
Balance 2,950 9,822 13,176 22,997
Source: Eurostat (Comext)
FoodDrinkEurope DaTa & TrENDs 2013-2014 15
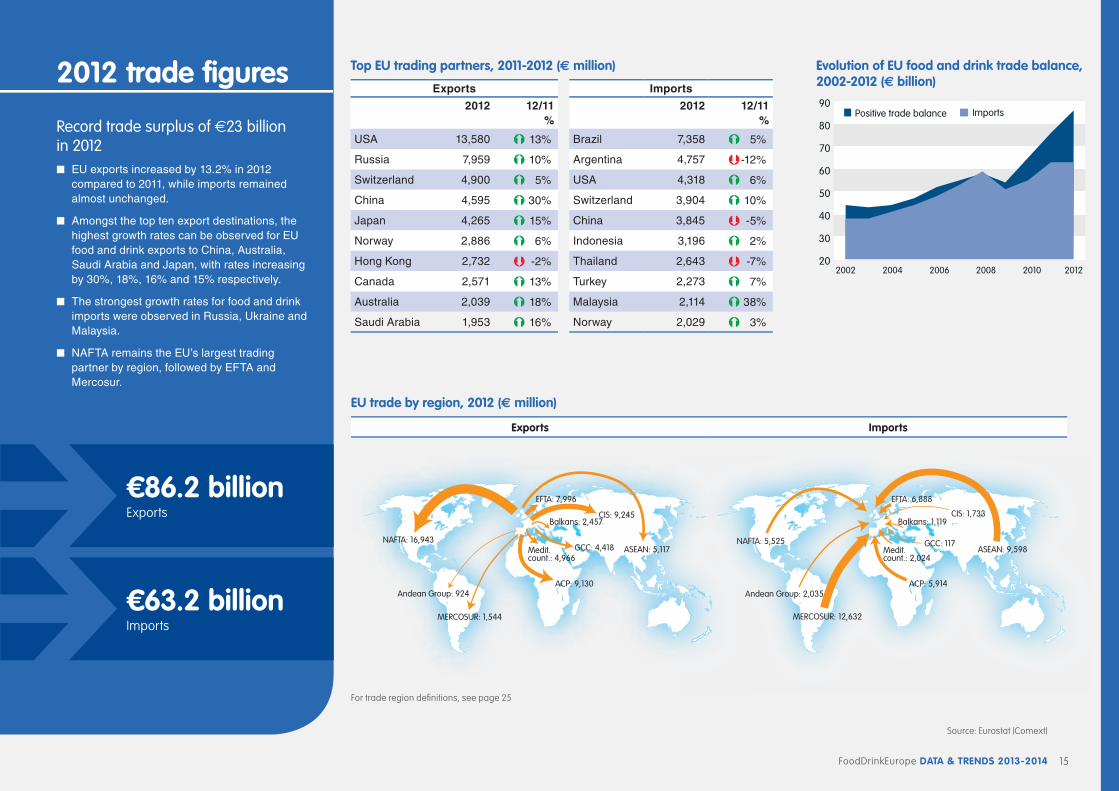
Evolution of EU food and drink trade balance, 2002-2012 (€ billion)
ImportsPositive trade balance
20
30
40
50
60
70
80
90
201220102008200620042002
Top EU trading partners, 2011-2012 (€ million)
Exports Imports
2012 12/11 %
2012 12/11 %
USA 13,580 Ý 13% Brazil 7,358 Ý 5%
Russia 7,959 Ý 10% Argentina 4,757 Þ-12%
Switzerland 4,900 Ý 5% USA 4,318 Ý 6%
China 4,595 Ý 30% Switzerland 3,904 Ý 10%
Japan 4,265 Ý 15% China 3,845 Þ-5%
Norway 2,886 Ý 6% Indonesia 3,196 Ý 2%
Hong Kong 2,732 Þ-2% Thailand 2,643 Þ-7%
Canada 2,571 Ý 13% Turkey 2,273 Ý 7%
Australia 2,039 Ý 18% Malaysia 2,114 Ý 38%
Saudi Arabia 1,953 Ý 16% Norway 2,029 Ý 3%
NAFTA: 16,943
ACP: 9,130
GCC: 4,418Medit.count.: 4,966
CIS: 9,245Balkans: 2,457
EFTA: 7,996
ASEAN: 5,117
MERCOSUR: 1,544
Andean Group: 924
NAFTA: 5,525
ACP: 5,914
GCC: 117Medit.count.: 2,024
CIS: 1,733Balkans: 1,119
EFTA: 6,888
ASEAN: 9,598
MERCOSUR: 12,632
Andean Group: 2,035
EU trade by region, 2012 (€ million)
Exports Imports
For trade region defi nitions, see page 25
2012 trade fi gures
Record trade surplus of €23 billion in 2012 n EU exports increased by 13.2% in 2012
compared to 2011, while imports remained almost unchanged.
n Amongst the top ten export destinations, the highest growth rates can be observed for EU food and drink exports to China, Australia, Saudi Arabia and Japan, with rates increasing by 30%, 18%, 16% and 15% respectively.
n The strongest growth rates for food and drink imports were observed in Russia, Ukraine and Malaysia.
n NAFTA remains the EU’s largest trading partner by region, followed by EFTA and Mercosur.
€86.2 billionExports
€63.2 billionImports
Source: Eurostat (Comext)
FoodDrinkEurope DaTa & TrENDs 2013-201416
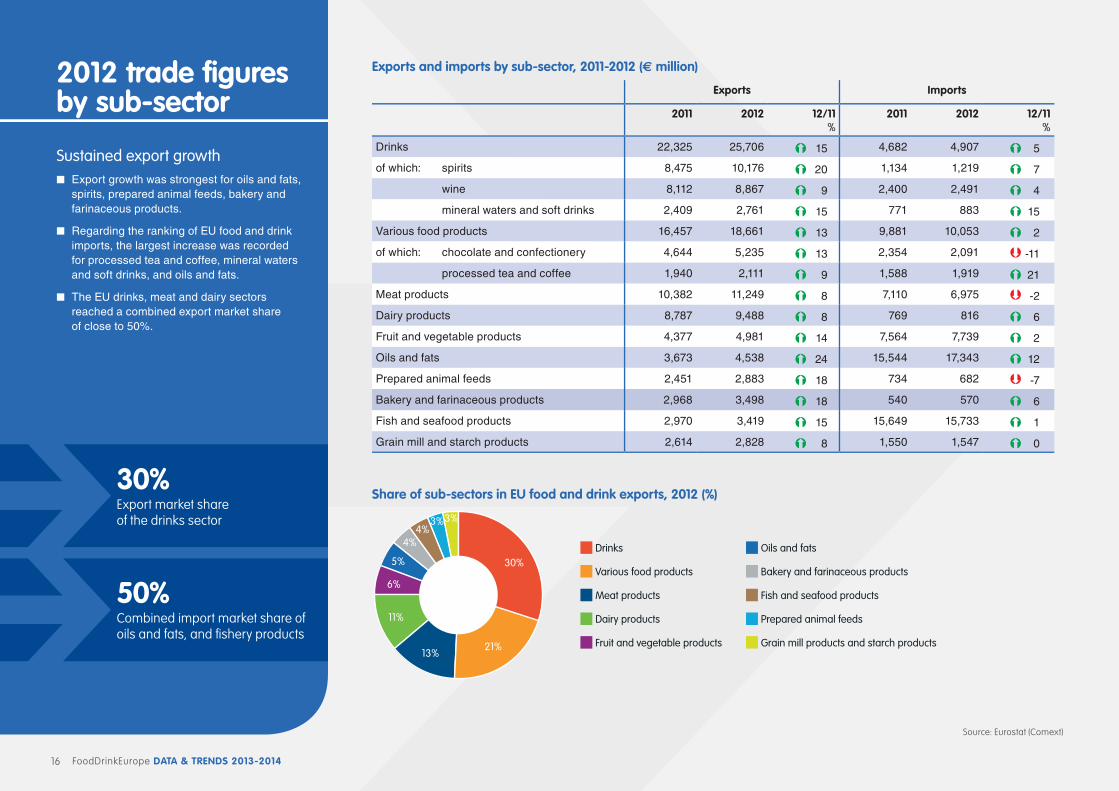
share of sub-sectors in EU food and drink exports, 2012 (%)
30%
21%13%
11%
6%
Grain mill products and starch products
Prepared animal feeds
Fish and seafood products
Bakery and farinaceous products
Oils and fats
Fruit and vegetable products
Dairy products
Meat products
Various food products
Drinks5%
4%4%
3%3%
Exports and imports by sub-sector, 2011-2012 (€ million)
Exports Imports
2011 2012 12/11%
2011 2012 12/11%
Drinks 22,325 25,706 Ý15 4,682 4,907 Ý5
of which: spirits 8,475 10,176 Ý20 1,134 1,219 Ý7
wine 8,112 8,867 Ý9 2,400 2,491 Ý4
mineral waters and soft drinks 2,409 2,761 Ý15 771 883 Ý15
Various food products 16,457 18,661 Ý13 9,881 10,053 Ý2
of which: chocolate and confectionery 4,644 5,235 Ý13 2,354 2,091 Þ-11
processed tea and coffee 1,940 2,111 Ý9 1,588 1,919 Ý21
Meat products 10,382 11,249 Ý8 7,110 6,975 Þ-2
Dairy products 8,787 9,488 Ý8 769 816 Ý6
Fruit and vegetable products 4,377 4,981 Ý14 7,564 7,739 Ý2
Oils and fats 3,673 4,538 Ý24 15,544 17,343 Ý12
Prepared animal feeds 2,451 2,883 Ý18 734 682 Þ-7
Bakery and farinaceous products 2,968 3,498 Ý18 540 570 Ý6
Fish and seafood products 2,970 3,419 Ý15 15,649 15,733 Ý1
Grain mill and starch products 2,614 2,828 Ý8 1,550 1,547 Ý0
2012 trade fi gures by sub-sector
Sustained export growth n Export growth was strongest for oils and fats,
spirits, prepared animal feeds, bakery and farinaceous products.
n Regarding the ranking of EU food and drink imports, the largest increase was recorded for processed tea and coffee, mineral waters and soft drinks, and oils and fats.
n The EU drinks, meat and dairy sectors reached a combined export market share of close to 50%.
30%Export market share of the drinks sector
Source: Eurostat (Comext)
50%Combined import market share of oils and fats, and fi shery products
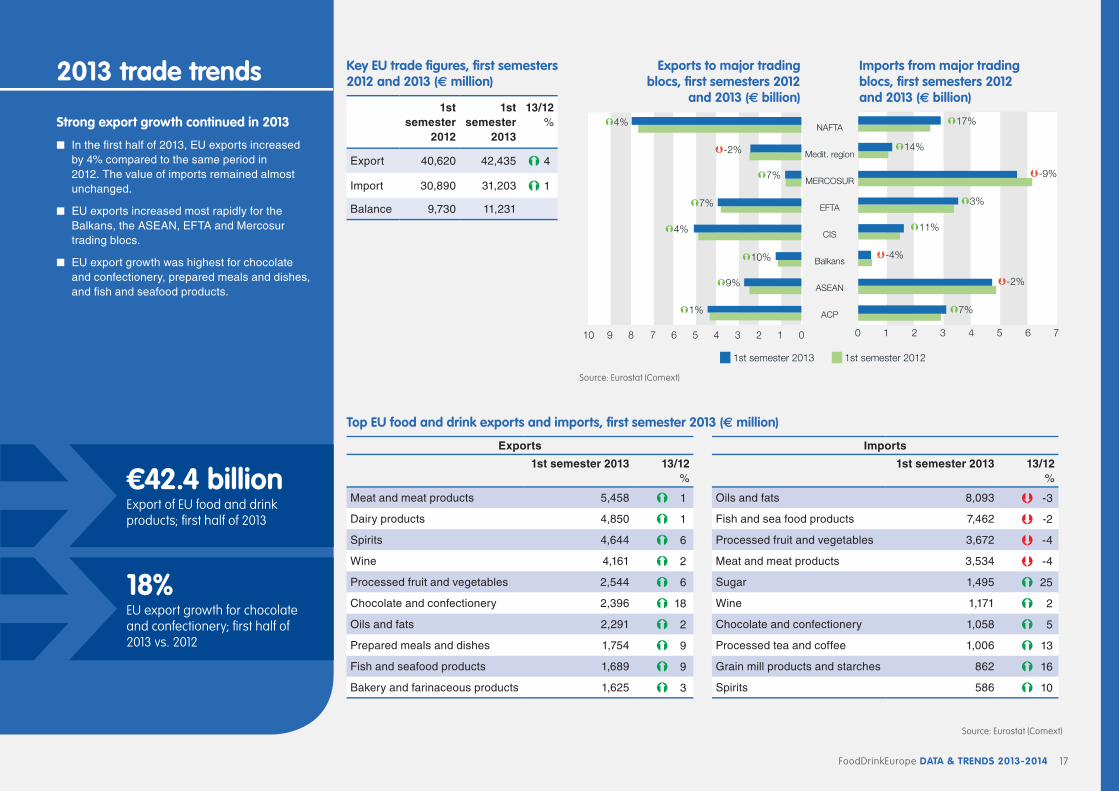
FoodDrinkEurope DaTa & TrENDs 2013-2014 17
Exports to major trading blocs, fi rst semesters 2012
and 2013 (€ billion)
Imports from major trading blocs, fi rst semesters 2012 and 2013 (€ billion)
Top EU food and drink exports and imports, fi rst semester 2013 (€ million)
Exports
1st semester 2013 13/12%
Meat and meat products 5,458 Ý1
Dairy products 4,850 Ý1
Spirits 4,644 Ý6
Wine 4,161 Ý2
Processed fruit and vegetables 2,544 Ý6
Chocolate and confectionery 2,396 Ý18
Oils and fats 2,291 Ý2
Prepared meals and dishes 1,754 Ý9
Fish and seafood products 1,689 Ý9
Bakery and farinaceous products 1,625 Ý3
Imports
1st semester 2013 13/12%
Oils and fats 8,093 Þ-3
Fish and sea food products 7,462 Þ-2
Processed fruit and vegetables 3,672 Þ-4
Meat and meat products 3,534 Þ-4
Sugar 1,495 Ý25
Wine 1,171 Ý2
Chocolate and confectionery 1,058 Ý5
Processed tea and coffee 1,006 Ý13
Grain mill products and starches 862 Ý16
Spirits 586 Ý10
012345689 710
Þ-2%
Ý7%
Ý7%
Ý4%
Ý10%
Ý9%
Ý1%
Ý4%
0 1 2 3 4 5 6 7
1st semester 2013 1st semester 2012
ACP
ASEAN
Balkans
CIS
EFTA
MERCOSUR
Medit. region
NAFTAÝ17%
Ý14%
Þ-9%
Ý3%
Ý11%
Þ-4%
Þ-2%
Ý7%
Source: Eurostat (Comext)
2013 trade trends
strong export growth continued in 2013
n In the fi rst half of 2013, EU exports increased by 4% compared to the same period in 2012. The value of imports remained almost unchanged.
n EU exports increased most rapidly for the Balkans, the ASEAN, EFTA and Mercosur trading blocs.
n EU export growth was highest for chocolate and confectionery, prepared meals and dishes, and fi sh and seafood products.
€42.4 billion Export of EU food and drink products; fi rst half of 2013
Source: Eurostat (Comext)
18% EU export growth for chocolate and confectionery; fi rst half of 2013 vs. 2012
Key EU trade fi gures, fi rst semesters 2012 and 2013 (€ million)
1st semester
2012
1st semester
2013
13/12%
Export 40,620 42,435 Ý4
Import 30,890 31,203 Ý1
Balance 9,730 11,231
FoodDrinkEurope DaTa & TrENDs 2013-201418
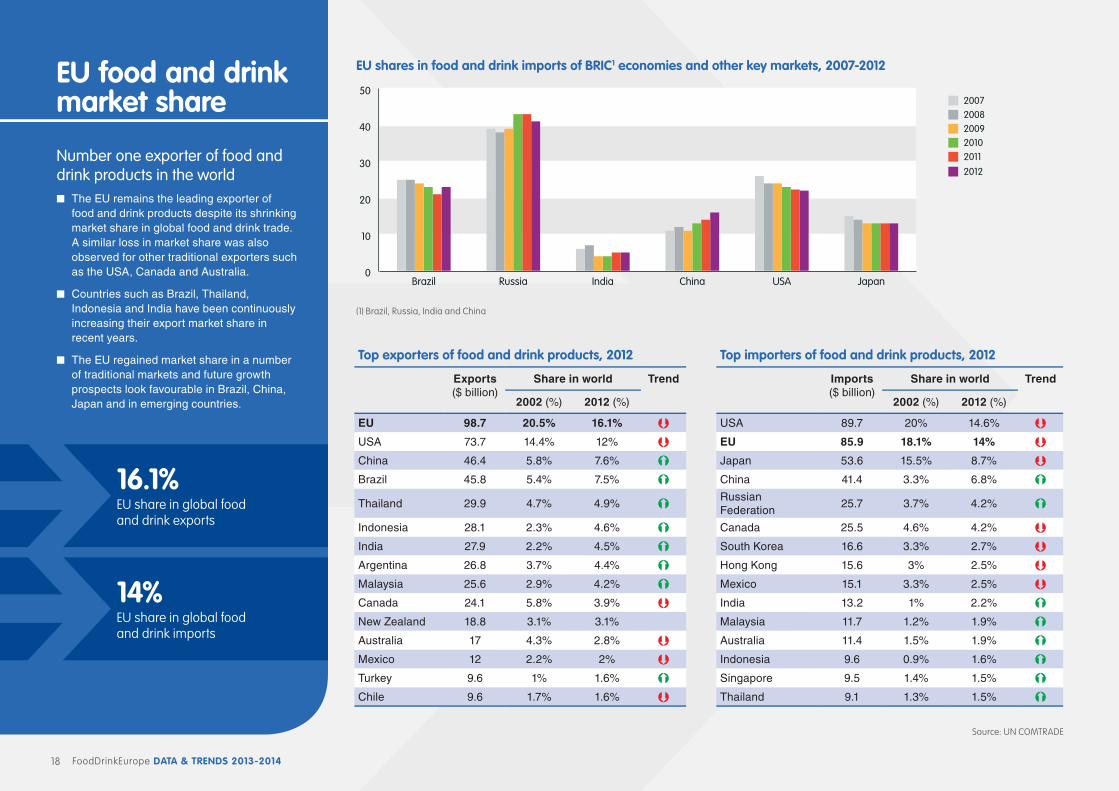
EU shares in food and drink imports of BrIC1 economies and other key markets, 2007-2012
2011
2012
2010200920082007
0
10
20
30
40
50
JapanUSARussia India ChinaBrazil
(1) Brazil, Russia, India and China
Top exporters of food and drink products, 2012 Top importers of food and drink products, 2012
Exports ($ billion)
Share in world Trend Imports ($ billion)
Share in world Trend
2002 (%) 2012 (%) 2002 (%) 2012 (%)
EU 98.7 20.5% 16.1% Þ USA 89.7 20% 14.6% ÞUSA 73.7 14.4% 12% Þ EU 85.9 18.1% 14% ÞChina 46.4 5.8% 7.6% Ý Japan 53.6 15.5% 8.7% ÞBrazil 45.8 5.4% 7.5% Ý China 41.4 3.3% 6.8% Ý
Thailand 29.9 4.7% 4.9% ÝRussian Federation
25.7 3.7% 4.2% Ý
Indonesia 28.1 2.3% 4.6% Ý Canada 25.5 4.6% 4.2% ÞIndia 27.9 2.2% 4.5% Ý South Korea 16.6 3.3% 2.7% ÞArgentina 26.8 3.7% 4.4% Ý Hong Kong 15.6 3% 2.5% ÞMalaysia 25.6 2.9% 4.2% Ý Mexico 15.1 3.3% 2.5% ÞCanada 24.1 5.8% 3.9% Þ India 13.2 1% 2.2% ÝNew Zealand 18.8 3.1% 3.1% Malaysia 11.7 1.2% 1.9% ÝAustralia 17 4.3% 2.8% Þ Australia 11.4 1.5% 1.9% ÝMexico 12 2.2% 2% Þ Indonesia 9.6 0.9% 1.6% ÝTurkey 9.6 1% 1.6% Ý Singapore 9.5 1.4% 1.5% ÝChile 9.6 1.7% 1.6% Þ Thailand 9.1 1.3% 1.5% Ý
EU food and drink market share
Number one exporter of food and drink products in the worldn The EU remains the leading exporter of
food and drink products despite its shrinking market share in global food and drink trade. A similar loss in market share was also observed for other traditional exporters such as the USA, Canada and Australia.
n Countries such as Brazil, Thailand, Indonesia and India have been continuously increasing their export market share in recent years.
n The EU regained market share in a number of traditional markets and future growth prospects look favourable in Brazil, China, Japan and in emerging countries.
16.1%EU share in global food and drink exports
14%EU share in global food and drink imports
Source: UN COMTRADE
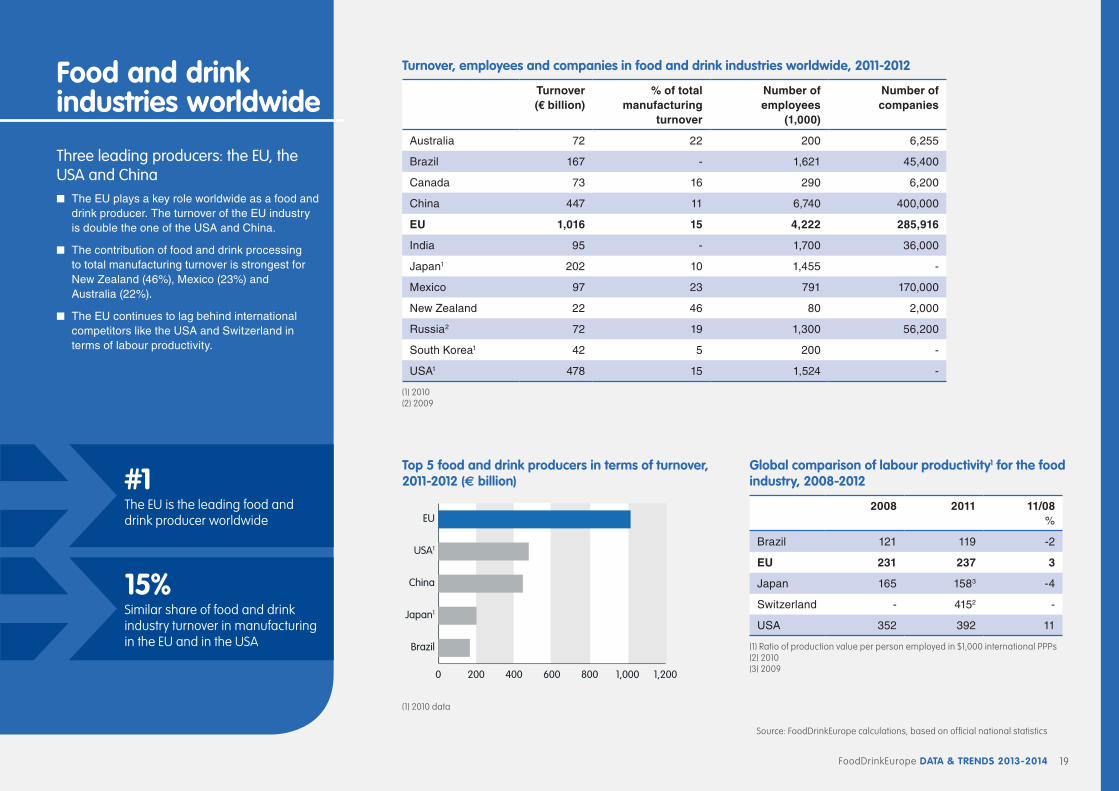
FoodDrinkEurope DaTa & TrENDs 2013-2014 19
Top 5 food and drink producers in terms of turnover, 2011-2012 (€ billion)
0 200 400 600 800 1,000 1,200
Brazil
Japan1
China
USA1
EU
(1) 2010 data
Turnover, employees and companies in food and drink industries worldwide, 2011-2012
Turnover (€ billion)
% of total manufacturing
turnover
Number of employees
(1,000)
Number of companies
Australia 72 22 200 6,255
Brazil 167 - 1,621 45,400
Canada 73 16 290 6,200
China 447 11 6,740 400,000
EU 1,016 15 4,222 285,916
India 95 - 1,700 36,000
Japan1 202 10 1,455 -
Mexico 97 23 791 170,000
New Zealand 22 46 80 2,000
Russia2 72 19 1,300 56,200
South Korea1 42 5 200 -
USA1 478 15 1,524 -
(1) 2010(2) 2009
Global comparison of labour productivity1 for the food industry, 2008-2012
2008 2011 11/08 %
Brazil 121 119 -2
EU 231 237 3
Japan 165 1583 -4
Switzerland - 4152 -
USA 352 392 11
(1) Ratio of production value per person employed in $1,000 international PPPs(2) 2010(3) 2009
Food and drink industries worldwide
Three leading producers: the EU, the USA and China n The EU plays a key role worldwide as a food and
drink producer. The turnover of the EU industry is double the one of the USA and China.
n The contribution of food and drink processing to total manufacturing turnover is strongest for New Zealand (46%), Mexico (23%) and Australia (22%).
n The EU continues to lag behind international competitors like the USA and Switzerland in terms of labour productivity.
#1 The EU is the leading food and drink producer worldwide
15% Similar share of food and drink industry turnover in manufacturing in the EU and in the USA
Source: FoodDrinkEurope calculations, based on official national statistics
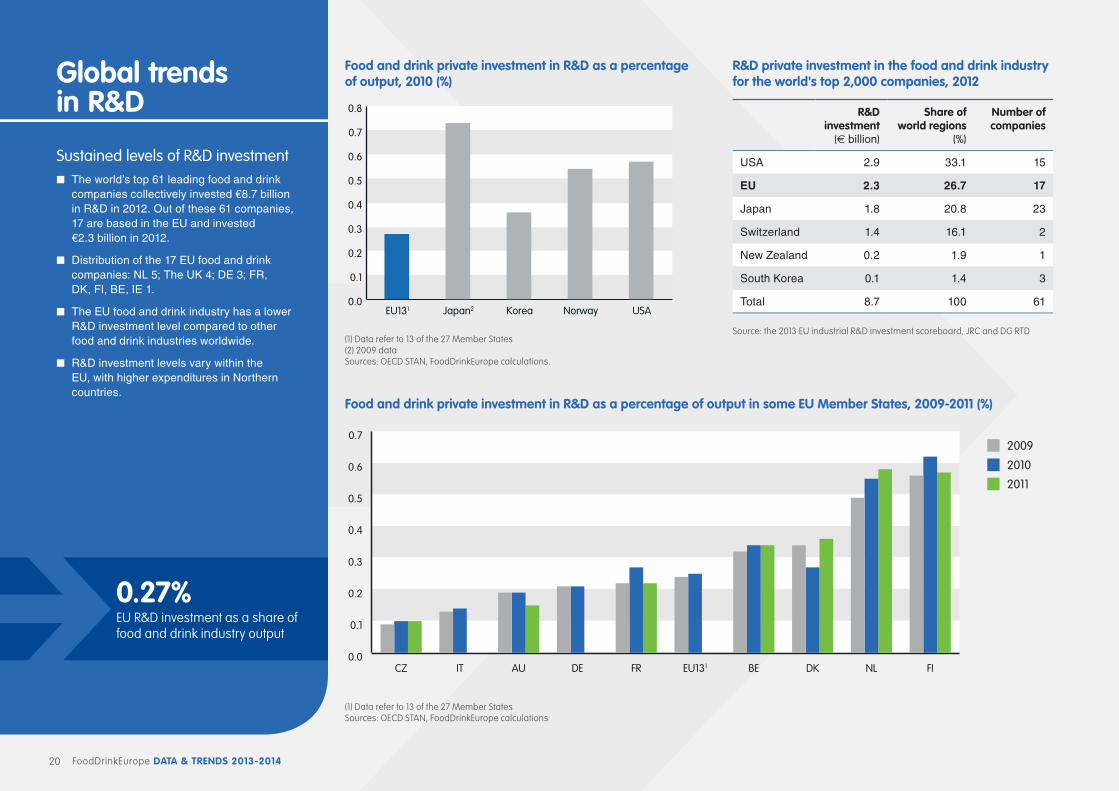
FoodDrinkEurope DaTa & TrENDs 2013-201420
Food and drink private investment in r&D as a percentage of output, 2010 (%)
0.0
0.1
0.2
0.3
0.4
0.5
0.6
0.7
0.8
USANorwayKoreaJapan2EU131
(1) Data refer to 13 of the 27 Member States(2) 2009 data Sources: OECD STAN, FoodDrinkEurope calculations.
Food and drink private investment in r&D as a percentage of output in some EU Member states, 2009-2011 (%)
0.0
0.1
0.2
0.3
0.4
0.5
0.6
0.7
2011
2010
2009
FINLDKBEEU131FRDEAUITCZ
(1) Data refer to 13 of the 27 Member States Sources: OECD STAN, FoodDrinkEurope calculations
r&D private investment in the food and drink industry for the world's top 2,000 companies, 2012
r&D investment � (€ billion)
share of world regions
(%)
Number of companies
USA 2.9 33.1 15
EU 2.3 26.7 17
Japan 1.8 20.8 23
Switzerland 1.4 16.1 2
New Zealand 0.2 1.9 1
South Korea 0.1 1.4 3
Total 8.7 100 61
Source: the 2013 EU industrial R&D investment scoreboard, JRC and DG RTD
Global trends in r&D
Sustained levels of R&D investment n The world’s top 61 leading food and drink
companies collectively invested €8.7 billion in R&D in 2012. Out of these 61 companies, 17 are based in the EU and invested €2.3 billion in 2012.
n Distribution of the 17 EU food and drink companies: NL 5; The UK 4; DE 3; FR, DK, FI, BE, IE 1.
n The EU food and drink industry has a lower R&D investment level compared to other food and drink industries worldwide.
n R&D investment levels vary within the EU, with higher expenditures in Northern countries.
0.27%EU R&D investment as a share of food and drink industry output
FoodDrinkEurope DaTa & TrENDs 2013-2014 21
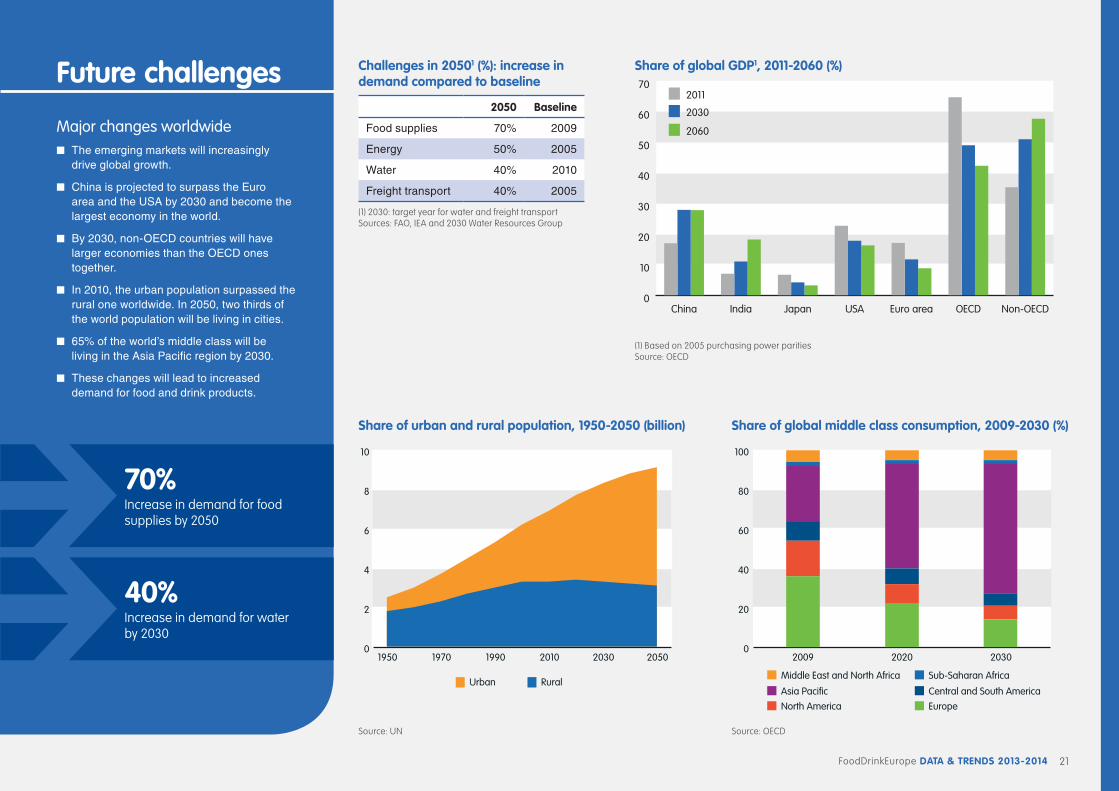
share of urban and rural population, 1950-2050 (billion)
0
2
4
6
8
10
Urban Rural
205020302010199019701950
Source: UN
share of global middle class consumption, 2009-2030 (%)
0
20
40
60
80
100
Middle East and North Africa Sub-Saharan Africa
Asia Pacific Central and South America
North America Europe
203020202009
Source: OECD
share of global GDP1, 2011-2060 (%)
0
10
20
30
40
50
60
70
2060
2030
2011
Non-OECDOECDEuro areaUSAJapanIndiaChina
(1) Based on 2005 purchasing power paritiesSource: OECD
Challenges in 20501 (%): increase in demand compared to baseline
2050 Baseline
Food supplies 70% 2009
Energy 50% 2005
Water 40% 2010
Freight transport 40% 2005
(1) 2030: target year for water and freight transportSources: FAO, IEA and 2030 Water Resources Group
Future challenges
Major changes worldwide n The emerging markets will increasingly
drive global growth.
n China is projected to surpass the Euro area and the USA by 2030 and become the largest economy in the world.
n By 2030, non-OECD countries will have larger economies than the OECD ones together.
n In 2010, the urban population surpassed the rural one worldwide. In 2050, two thirds of the world population will be living in cities.
n 65% of the world’s middle class will be living in the Asia Pacific region by 2030.
n These changes will lead to increased demand for food and drink products.
70% Increase in demand for food supplies by 2050
40% Increase in demand for water by 2030
3 Global and European ranking of food and drink companies
The EU food and drink industry is comprised of large companies and a high number of SMEs (the latter account for 99.1% of food and drink companies).
Large companies account for 48.4% of EU food and drink turnover, 51.2% of value added and 35.7% of employment in the sector.
23FoodDrinkEurope DaTa & TrENDs 2013-2014
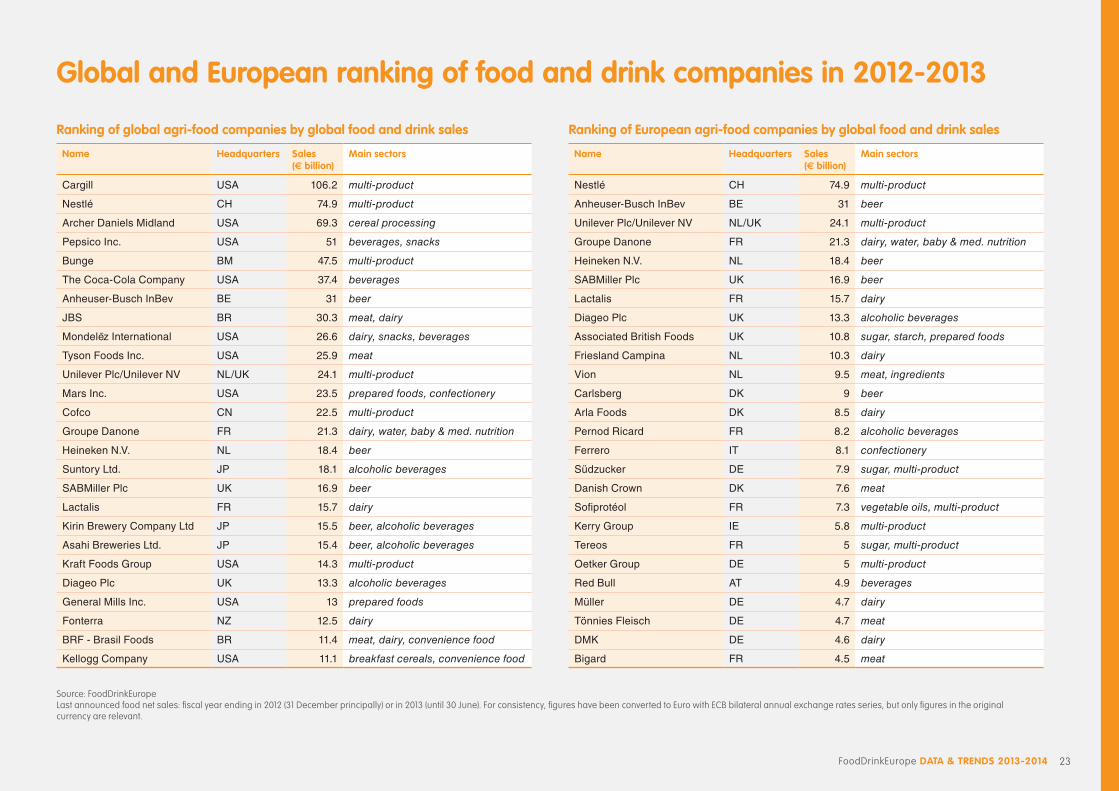
Global and European ranking of food and drink companies in 2012-2013
ranking of global agri-food companies by global food and drink sales
Name Headquarters sales (€ billion)
Main sectors
Cargill USA 106.2 multi-product
Nestlé CH 74.9 multi-product
Archer Daniels Midland USA 69.3 cereal processing
Pepsico Inc. USA 51 beverages, snacks
Bunge BM 47.5 multi-product
The Coca-Cola Company USA 37.4 beverages
Anheuser-Busch InBev BE 31 beer
JBS BR 30.3 meat, dairy
Mondelez International USA 26.6 dairy, snacks, beverages
Tyson Foods Inc. USA 25.9 meat
Unilever Plc/Unilever NV NL/UK 24.1 multi-product
Mars Inc. USA 23.5 prepared foods, confectionery
Cofco CN 22.5 multi-product
Groupe Danone FR 21.3 dairy, water, baby & med. nutrition
Heineken N.V. NL 18.4 beer
Suntory Ltd. JP 18.1 alcoholic beverages
SABMiller Plc UK 16.9 beer
Lactalis FR 15.7 dairy
Kirin Brewery Company Ltd JP 15.5 beer, alcoholic beverages
Asahi Breweries Ltd. JP 15.4 beer, alcoholic beverages
Kraft Foods Group USA 14.3 multi-product
Diageo Plc UK 13.3 alcoholic beverages
General Mills Inc. USA 13 prepared foods
Fonterra NZ 12.5 dairy
BRF - Brasil Foods BR 11.4 meat, dairy, convenience food
Kellogg Company USA 11.1 breakfast cereals, convenience food
ranking of European agri-food companies by global food and drink sales
Name Headquarters sales (€ billion)
Main sectors
Nestlé CH 74.9 multi-product
Anheuser-Busch InBev BE 31 beer
Unilever Plc/Unilever NV NL/UK 24.1 multi-product
Groupe Danone FR 21.3 dairy, water, baby & med. nutrition
Heineken N.V. NL 18.4 beer
SABMiller Plc UK 16.9 beer
Lactalis FR 15.7 dairy
Diageo Plc UK 13.3 alcoholic beverages
Associated British Foods UK 10.8 sugar, starch, prepared foods
Friesland Campina NL 10.3 dairy
Vion NL 9.5 meat, ingredients
Carlsberg DK 9 beer
Arla Foods DK 8.5 dairy
Pernod Ricard FR 8.2 alcoholic beverages
Ferrero IT 8.1 confectionery
Südzucker DE 7.9 sugar, multi-product
Danish Crown DK 7.6 meat
Sofiprotéol FR 7.3 vegetable oils, multi-product
Kerry Group IE 5.8 multi-product
Tereos FR 5 sugar, multi-product
Oetker Group DE 5 multi-product
Red Bull AT 4.9 beverages
Müller DE 4.7 dairy
Tönnies Fleisch DE 4.7 meat
DMK DE 4.6 dairy
Bigard FR 4.5 meat
Source: FoodDrinkEurope Last announced food net sales: fiscal year ending in 2012 (31 December principally) or in 2013 (until 30 June). For consistency, figures have been converted to Euro with ECB bilateral annual exchange rates series, but only figures in the original currency are relevant.
4 Glossary
25FoodDrinkEurope DaTa & TrENDs 2013-2014
Glossary
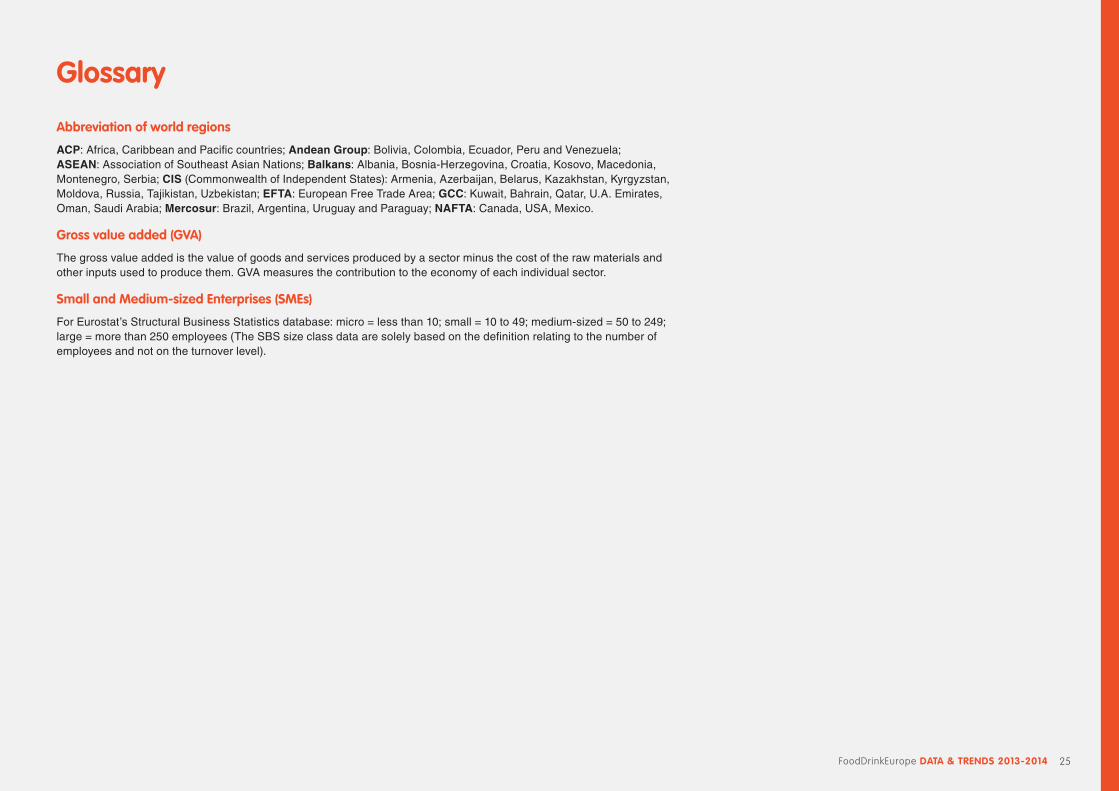
abbreviation of world regions
ACP: Africa, Caribbean and Pacific countries; Andean Group: Bolivia, Colombia, Ecuador, Peru and Venezuela; ASEAN: Association of Southeast Asian Nations; Balkans: Albania, Bosnia-Herzegovina, Croatia, Kosovo, Macedonia, Montenegro, Serbia; CIS (Commonwealth of Independent States): Armenia, Azerbaijan, Belarus, Kazakhstan, Kyrgyzstan, Moldova, Russia, Tajikistan, Uzbekistan; EFTA: European Free Trade Area; GCC: Kuwait, Bahrain, Qatar, U.A. Emirates, Oman, Saudi Arabia; Mercosur: Brazil, Argentina, Uruguay and Paraguay; NAFTA: Canada, USA, Mexico.
Gross value added (GVa)
The gross value added is the value of goods and services produced by a sector minus the cost of the raw materials and other inputs used to produce them. GVA measures the contribution to the economy of each individual sector.
small and Medium-sized Enterprises (sMEs)
For Eurostat’s Structural Business Statistics database: micro = less than 10; small = 10 to 49; medium-sized = 50 to 249; large = more than 250 employees (The SBS size class data are solely based on the definition relating to the number of employees and not on the turnover level).

26 FoodDrinkEurope DaTa & TrENDs 2013-2014

Avenue des Nerviens, 9-311040 BrusselsBelgiumTel.: +32 2 514 11 11Email: [email protected]
Published by FoodDrinkEurope, May 2014


