20
Data Update Health IT Standards Committee Meeting March 18, 2015
| Date post: | 19-Dec-2015 |
| Category: |
Documents |
| Upload: | elisabeth-turner |
| View: | 216 times |
| Download: | 2 times |

Data Update
Health IT Standards Committee Meeting
March 18, 2015
2
Agenda
• Examine characteristics associated with meaningful use performance among eligible hospitals– Care transitions– Patient engagement– Patient safety– Public health
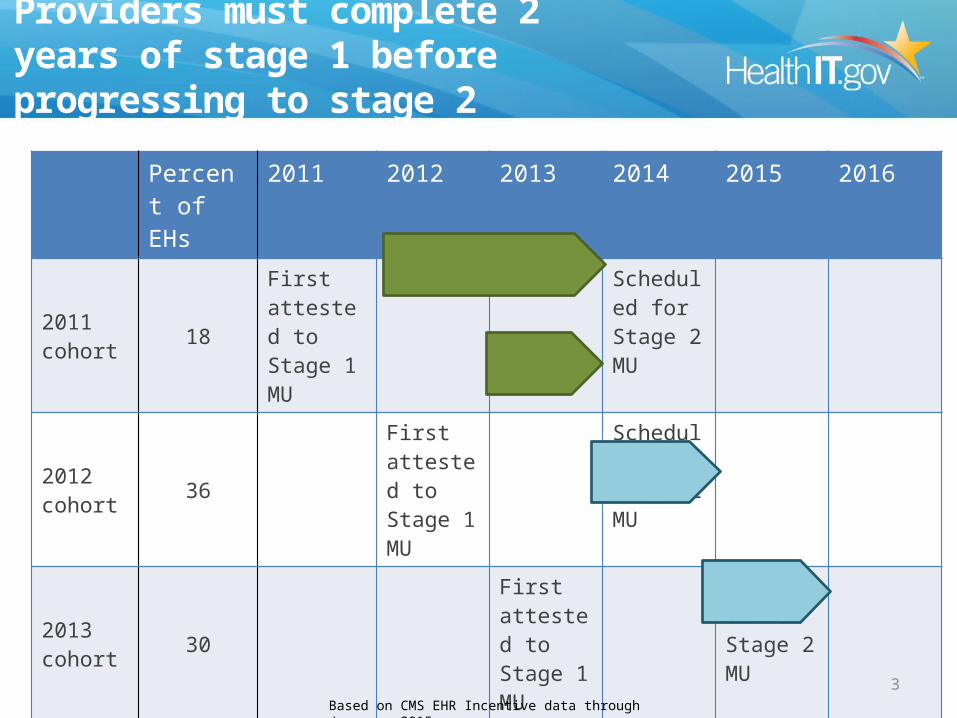
Providers must complete 2 years of stage 1 before progressing to stage 2
Percent of EHs
2011 2012 2013 2014 2015 2016
2011 cohort 18
First attested to Stage 1 MU
Scheduled for Stage 2 MU
2012 cohort 36
First attested to Stage 1 MU
Scheduled for Stage 2 MU
2013 cohort 30
First attested to Stage 1 MU
Scheduled for Stage 2 MU
2014 cohort 6
First attested to Stage 1 MU
Scheduled for Stage 2 MU
3Based on CMS EHR Incentive data through January, 2015.

4
Distribution of characteristics among stage 2-scheduled hospitals
Used flex rule to attest to Stage 1
(~590)
Attested to Stage 2(~1,800)
0% 10% 20% 30% 40% 50% 60% 70% 80% 90% 100%
22%
24%
16%
12%
12%
8%
40%
40%
10%
16%
Distribution of stage 2-scheduled hospitals by characteristics and stage of attestation
Critical Access Small Rural Small Urban Medium Large
Based on CMS EHR Incentive data through January, 2015.

Care Transitions
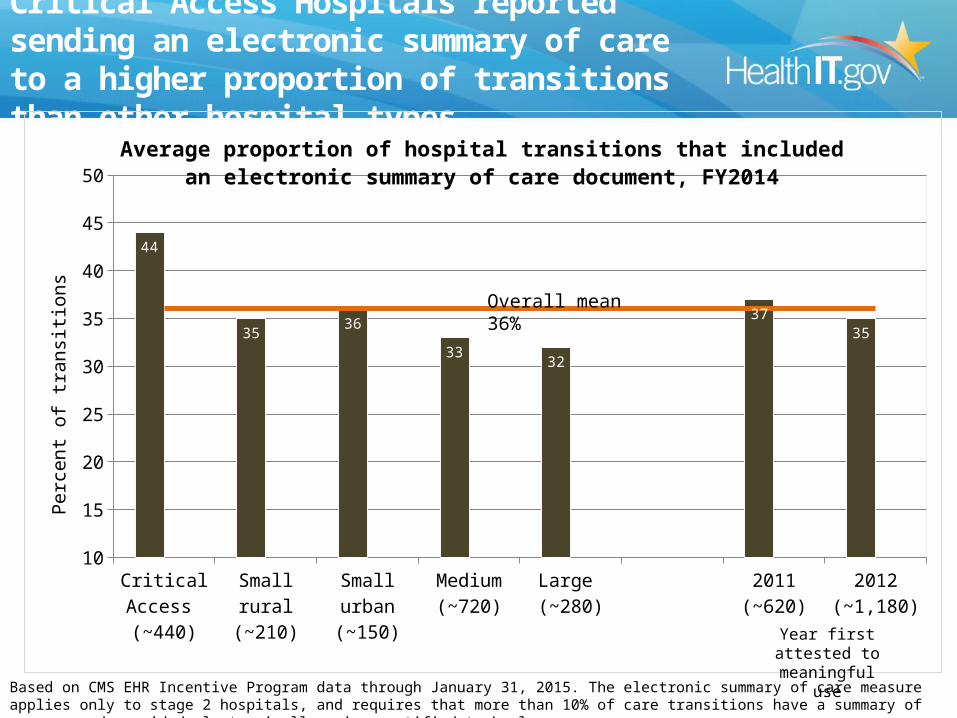
Critical Access Hospitals reported sending an electronic summary of care to a higher proportion of transitions than other hospital types
Critical Access (~440)
Small rural(~210)
Small urban(~150)
Medium(~720)
Large (~280)
2011(~620)
2012(~1,180)
10
15
20
25
30
35
40
45
50
44
3536
3332
3735
Average proportion of hospital transitions that included an electronic summary of care document, FY2014
Perc
ent o
f tra
nsiti
ons
Based on CMS EHR Incentive Program data through January 31, 2015. The electronic summary of care measure applies only to stage 2 hospitals, and requires that more than 10% of care transitions have a summary of care record provided electronically using certified technology.
Year first attested to meaningful use
Overall mean 36%

7
Summary
• On average, stage 2 hospitals are sending electronic summaries of care for 36% of all transitions
• Critical Access Hospitals reported the highest summary of care rates – On average, 44% of transitions from CAHs received an
electronic summary of care • Large hospitals (400+ beds) reported the lowest
provision rate of electronic summaries of care– On average, 32% of transitions from large hospitals
received an electronic summary of care

Patient Engagement

Hospitals that have been in the Incentive Program longer reported higher rates of patients who viewed, downloaded, or transmitted their electronic health information
Critical Access (~440)
Small rural(~210)
Small urban(~150)
Medium(~720)
Large(~280)
2011(~620)
2012(~1,180)
5
7
9
11
13
15
17
19
16
14
17
15
16
18
14
Average proportion of patients who have viewed, downloaded, or transmitted their electronic health information at least once, FY2014
Perc
ent o
f pati
ents
Overall mean 15%
Based on CMS EHR Incentive Program data through January 31, 2015. This measure applies only to stage 2 hospitals, and requires that more than 5% of patients view, download, or transmit their electronic health information at least once.
Year first attested to meaningful use
9

Hospitals that attested in November reported the highest rates of patients viewing, downloading, or transmitting their electronic health information at least once
April (<5)
May (<5)
June (<5)
July (~60)
August (~70)
September (~90)
October (~600)
November (~830)
December (~140)
5
8
11
14
17
20
7 7
11
15
12 12
15
17
12
Average reported score by eligible hospitals for VDT measure 2 by attestation month
Month that hospital attested (no. of hospitals)
Perc
ent o
f pati
ents
who
vie
wed
, dow
nloa
ded
or
tran
smitt
ed th
eir
elec
tron
ic h
ealth
info
rmati
on a
t lea
st o
nce
Overall mean 15%
Based on CMS EHR Incentive Program data through January 31, 2015. For VDT measure 2, hospitals must attest that more than 5% of all their patients viewed, downloaded, or transmitted their electronic health information at least once.
10
Summary
• On average, 15% of stage 2 hospitals’ patients viewed, downloaded, or transmitted their electronic health information at least once
• Hospitals that have been meaningful users since 2011 have the highest average rates (18%) of VDT
• With an average of 17%, hospitals that attested in November had the highest rates of patients viewing, downloading, or transmitting their electronic health information at least once
11

Patient Safety

Medium-sized hospitals reported higher electronic medication administration record (eMAR) tracking rates for their inpatient or ED medication orders
Critical Access(~350)
Small rural(~200)
Small urban(~140)
Medium(~720)
Large(~280)
2011(~590)
2012(~1,100)
10
20
30
40
50
60
70
80
90
100
64 64 65
7572
75
68
Average hospital rate of tracking all doses of medication orders through an electronic medication administration record (eMAR), FY2014
Perc
ent o
f med
icati
on o
rder
s
Based on CMS EHR Incentive Program data through January 31, 2015. The stage 2 eMAR measure requires that more than 10% of the hospitals’ inpatient or emergency department (ED) medication orders have all doses tracked through an electronic medication administration record (eMAR). 6% of hospitals took an exclusion on this measure.
Year first attested to meaningful use
Overall mean 70%

Among hospitals that selected the eRx menu measure, smaller hospitals reported thehighest e-prescribing rates
Critical Access (~100)
Small rural(~40)
Small urban(~40)
Medium (~120)
Large(~50)
2011(~130)
2012(~230)
10
20
30
40
50
60
70
80
90
100
64
57
64
4852
61
53
Average hospital performance on the e-prescribing menu measure, FY2014
Perc
ent o
f per
mis
sibl
e ho
spita
l di
scha
rge
med
icati
ons
Based on CMS EHR Incentive Program data through January 31, 2015. The stage 2 e-prescribing (eRx) measure is optional. For this measure, hospitals must query for a drug formulary and transmit electronically more than 10% of their permissible hospital discharge medications.
Year first attested to meaningful use
Overall mean 56%

15
Summary
• On average, 70% of medications administered in stage 2 hospitals had all doses tracked through an electronic medication administration record (eMAR) – Medium-size hospitals and hospitals that first attested to meaningful
use in 2011 reported the highest average eMAR tracking rates• The e-prescribing measure is an optional measure in stage 2. On
average, hospitals that selected this measure used e-prescribing for 56% of all permissible discharge medications– Of the hospitals that selected the measure, Critical Access Hospitals
and other small hospitals reported the highest average discharge eRX rates at 64%
– Of the hospitals that selected the measure, medium-size hospitals had the lowest average discharge eRx rates at 48%

Public Health Reporting
17
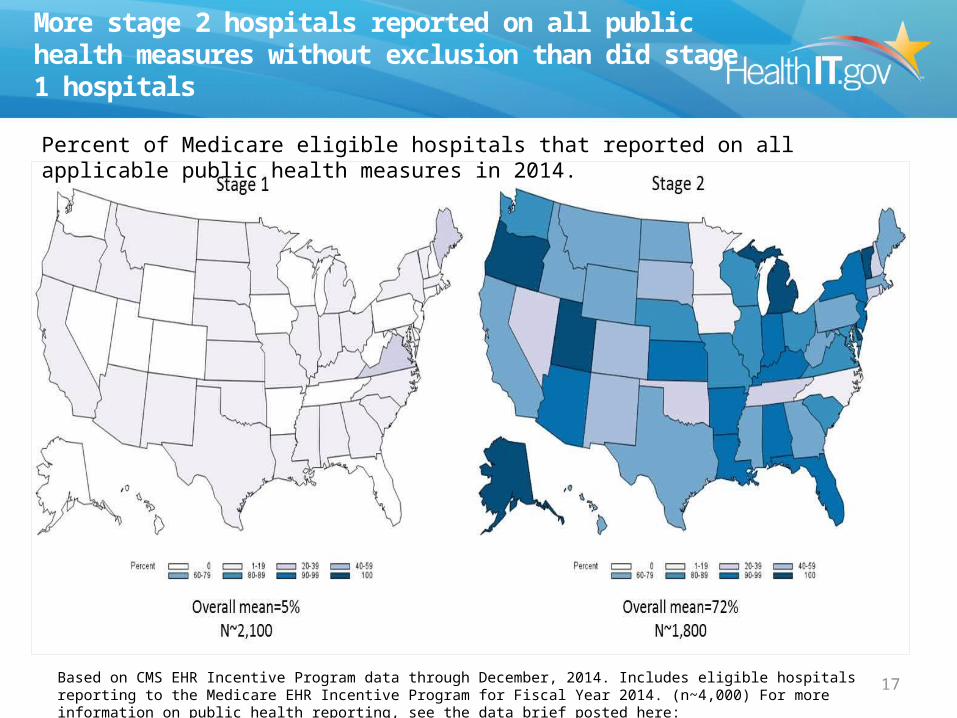
More stage 2 hospitals reported on all public health measures without exclusion than did stage 1 hospitals
Percent of Medicare eligible hospitals that reported on all applicable public health measures in 2014.
Based on CMS EHR Incentive Program data through December, 2014. Includes eligible hospitals reporting to the Medicare EHR Incentive Program for Fiscal Year 2014. (n~4,000) For more information on public health reporting, see the data brief posted here: http://dashboard.healthit.gov

18
Summary
• Three public health measures are required reporting for stage 2; these were optional for stage 1.
• Seven in 10 stage 2 hospitals reported, without exclusion, on all three public health measures.
• 5% of stage 1 hospitals reported, without exclusion, on all three public health measures.

Questions?

20
Methodology
• Denominator data for hospitals was obtained based on the CMS list of certified hospitals through September, 2014 and CMS EHR Incentive Program participants through January, 2014.
• Hospital size was based on the number of certified beds as reported in the CMS Provider of Service files through September, 2014 (http://www.cms.gov/Research-Statistics-Data-and-Systems/Downloadable-Public-Use-Files/Provider-of-Services/index.html). CAHs were separated prior to classification by size and geography. Bed size was unavailable for less than 1% of hospitals . Size categories were: – Large: 400 or more beds– Medium: 100-399 beds – Small: 1-99 beds
• Geographic location was based on the county in which the hospital was located based on the zip code provided through the CMS EHR Incentive Program data file. Hospitals in metropolitan counties were classified as urban. Hospitals in micropolitan and areas that were not in a combined statistical area were classified as rural. Combined Statistical Area designations were based on HRSA’s 2012/2013 Area Resources File.
• Hospitals were assigned to an attestation cohort based on the first year they attested to, or were paid for, meaningful use with either the Medicare or Medicaid EHR Incentive Program.


