50
| ©2012, Cognizant 1 Data Visualization (DV) tools
| Date post: | 04-Jun-2018 |
| Category: |
Documents |
| Upload: | anandh-kumar |
| View: | 225 times |
| Download: | 0 times |

8/13/2019 Data Visualization - KPN - Tools v1.3
http://slidepdf.com/reader/full/data-visualization-kpn-tools-v13 1/50
| ©2012, Cognizant1
Data Visualization (DV) tools

8/13/2019 Data Visualization - KPN - Tools v1.3
http://slidepdf.com/reader/full/data-visualization-kpn-tools-v13 2/50
| ©2012, Cognizant
Facts on Data Visulaistaion
2
The Data Visualization Market recently reached 1 billion dollars in size
Growing faster than any other software market, including traditionalBusiness Intelligence (BI) tools.
Among Data Visualization Leaders we mention three importantplayers:
• Tableau Software
• Spotfire
•
Qliktech

8/13/2019 Data Visualization - KPN - Tools v1.3
http://slidepdf.com/reader/full/data-visualization-kpn-tools-v13 3/50

8/13/2019 Data Visualization - KPN - Tools v1.3
http://slidepdf.com/reader/full/data-visualization-kpn-tools-v13 4/50
| ©2012, Cognizant
Tableau - Features
4
• The fastest growing Data Visualization Vendor (113.5% Year-over-Year
growth in 2010)
• Tableau is an excellent Q&A tool which is very well designed and suited fornon-technical users. It is powerful, easy to use, highly visual
and aesthetically pleasant
• Has best access to OLAP cubes and best Pivot Control among DV vendors
• Recent Tableau release has a capable and fast in-memory (64-bit) data
engine and ability to perform incremental data updates• Ability to distribute Data Visualizations and Interactive Visual Reports
without Server involved with the help of free Desktop Tableau Reader
• State-of-art data visualization makes Tableau outstanding in the crowd of
BI suites
•
Ability to connect to SQL Server Analysis Services (SSAS) Cubes and to localPowerPivot multidimensional Cubes

8/13/2019 Data Visualization - KPN - Tools v1.3
http://slidepdf.com/reader/full/data-visualization-kpn-tools-v13 5/50
| ©2012, Cognizant
Tableau - Advantages
5
• Provision for Geo maps: Maps is one of the strongest features of Tableau. It offers excellent mapping functionality
which includes regularly updated maps and complimentary information (e.g. population or income) licensed from 3rd
parties (with no additional costs for customers)
• Statistics: Tableau 7.0 provides enhanced statistical capabilities to enrich user analytics and make visualizations
dynamic and powerful.• Connectivity to multiple data sources: It has richest set of data connectors and adaptors among DV leaders. It offers
the user the ability to connect simultaneously to multiple data sources. The idea is that the user knows the data (and
how it relates) well enough to perform these kinds of tasks – but the user can act quickly to select the data sources
they want and combine them as he or she sees fit. The Data connection menu is intuitive in the sense that it has
three options for connecting to a table: One, Multi, or Custom SQL. In practice, Custom SQL seems to be the
preferred method, as Multi doesn’t function as expected
• Mobility: Tableau introduced new, touch-optimized capabilities for users consuming visualizations on their iPad.
Tableau builds on those capabilities with enhanced performance for loading your visualizations, deeper interactionthrough selections and pan/zoom, and improved quick filter performance and interactivity.
• Dashboarding flexibility: Tableau allows for individual grids/graphs to be placed in a single dashboard, and global
controls (i.e. selectors) are immediately applied to all relevant targets
• Distribution mechanism: Tableau Reader enables excellent server-less distribution of all Data Visualizations, Users
can immediately publish to the Tableau server without requiring a hand-off to admin/ops staff
• Prototyping & What-if-Analysis: Simplifies a quick way for novice users to prototype relatively polished reports or
what-if types of analyses
•
Time and Location Dimensions: These dimensions can be treated differently for efficient analysis. For instancelocation dimensions can easily be used for maps and spatial analysis. Time dimensions should be treated differently
as well because almost in all cases information is relevant only in specific time context.
• Customizable metrics: Can create highly customizable user-defined metrics using the in-tool library of functions
• Ordering: Column/Row headers can be re-ordered on the fly
• Portability: Users can immediately publish to the Tableau server without requiring a hand-off to admin/ops staff
• Strong capability to use SASAS Multidimensional as Source and built Data Visualization with it

8/13/2019 Data Visualization - KPN - Tools v1.3
http://slidepdf.com/reader/full/data-visualization-kpn-tools-v13 6/50
| ©2012, Cognizant
Tableau - Disadvantages
6
• Performance: Performance is not something that Tableau is ready to boast
about. Calculation in-memory engine is much weaker and far not so
sophisticated.
• Advanced authoring: Tableau makes bet not on syntax and scripting but on
various settings and actions performed via user interface. For instance making
objects (charts, tables, text labels) appear or disappear depending on some
parameter (variable) is actually a hack in Tableau. In case of Tableau you will
need to learn these hacks and tricks from someone else. Because sometimesit's near to impossible to understand logic behind them without help of more
experienced developer.
• Use of screen estate: Tableau does not offer easy management of object
visibility which allows making dashboards very information rich. Having 10
quick filters on Tableau dashboard will most probably make it completelycluttered and barely usable. Also such thing as in-line mini charts simply
doesn't exist in Tableau.

8/13/2019 Data Visualization - KPN - Tools v1.3
http://slidepdf.com/reader/full/data-visualization-kpn-tools-v13 7/50
| ©2012, Cognizant
Tableau Experience @ Large Online Market Place
7
About Client
Diversified technology company that provides a global trading platform Buyers have the option to purchase items in an auction-style format or items can be purchased at a fixed price Offers a wide variety of educational tools, features, and services that enable members to trade buy and sell on the site quickly,
safely, and conveniently
Key Business Strategy Themes: Create Customer Trust, Improve Customer Experience, Increase Customer Loyalty
Client Situation
The client being an online marketplace
wanted to analyze the users behavior to
the changes made to the pages to the
site. This required generation of reports.
The client was looking for a full- fledged
Business Intelligence Layer that met the
following requirements:-
A solution that comes with Lesser time
to Market (TTM)
Lower Total Cost of Ownership
Individual grids/graphs to be placed in a
single dashboard, and global controls
(i.e. selectors)
Easy to create and deliver dashboards.
Best in class visualization.
Easy to learn/Adopt for business users.
Cognizant Solution
Engagement Highlights
Cognizant performed Tool evaluationto find the best-fit for clientsrequirements. Tableau was evaluated
as the best fit in clients context Extracted the raw data from the
experimental platform and providingbusiness reports using Tableauplatform to the users via Visualizationtool hence reducing time to marketcomponent.
Ability to quickly define &develop the requiredmetrics/reporting on top ofavailable data. (Able to developreports in less than a week’s
time with prod deployment)
This aided client’s research anddevelopment for the quickchanges & Innovativevisualization keeping the costfactor under control.
Client Benefits

8/13/2019 Data Visualization - KPN - Tools v1.3
http://slidepdf.com/reader/full/data-visualization-kpn-tools-v13 8/50
| ©2012, Cognizant
Sample Dashboard View
8

8/13/2019 Data Visualization - KPN - Tools v1.3
http://slidepdf.com/reader/full/data-visualization-kpn-tools-v13 9/50
| ©2012, Cognizant
Tool Competency | Tableau
9
Competency
Profile
Representative Experiences
Helped the client observe user’s behaviour to
changes on the site pages and test the
performance of various marketing decisions and
experiments
Reports were generated directly from TeradataDatasets to Tableau Reports. The reports were
exposed via portal to the user base.
Once the experiment proved positive, site changes
were done to handle 100% traffic and metrics for
monitoring the system were provided from BI
reporting tools.
Case 01 – leading e-commerce firm
• Minimize the manual effort spent on data pull
from Teradata database by automatic report
generation using Tableau
•
Tableau generates dashboards with the power ofvisualizing complex analysis on millions of records
at once
• Tableau helped in making key business decisions
by performing on-the-fly calculations with
comparative visual analysis
Case 02 – a leading technology firm
• Currently working on a POC to analyze the usage
pattern across different segments
• Travel pattern, car rental pattern and dining
pattern analysis across different geographies arelinked to create a merchant cluster
• Create Decision Tree using Tableau Visualization
and analyze the campaign responses across
different segments to perform targeted marketing
Case 03 – a leading credit card company
•POC development
• Dashboard Configuration and
Customization
40* People; 3* Projects
* As of Aug, 2012• BI environment Assessment / Tool
Evaluation
• Tableau Implementation
• Report migration to Tableau Platform
• Performance Investigation and Tuning
• User Enablement Services

8/13/2019 Data Visualization - KPN - Tools v1.3
http://slidepdf.com/reader/full/data-visualization-kpn-tools-v13 10/50
| ©2012, Cognizant
Case 03 - Visualization Tool | Tableau
10
Tableau Data Visualization Experience @ Leading Online Retailer
Cognizant aided client’s experiment by using raw data from experimental platform and providing businessreports to user via Visualization tool hence reducing time to market component
Reports were generated directly from Teradata Datasets to Tableau Reports. The reports were exposed via
portal to the user base
Once the experiments proved positive results, the site changes are done to 100% traffic and long run
metrics for monitoring the system are provided from BI reporting tools.
This aided client’s research and development for the Innovations keeping the cost factor under control
Cognizant Solution
Client being an online market
system, abundance of data is
available to make proper business
decisions.
One of the case involved launch of
page on site and observe user’s
behavior to its changes. Most of
these experiments are short lived.
While reports need to be
generated to understand the user
behavior to test the performance
of experiments, building a fully
fledged Business intelligence layer
to meet the short lived experiment
can prove to be expensive
Client Situation
Key Highlights:
Database: Teradata
Projects Execution: Fixed Bid
Resources: 2 onsite
Duration: 3 Months

8/13/2019 Data Visualization - KPN - Tools v1.3
http://slidepdf.com/reader/full/data-visualization-kpn-tools-v13 11/50
| ©2012, Cognizant
Tableau | Sample Visualizations
11
Will have to update with some geo heat map
reports

8/13/2019 Data Visualization - KPN - Tools v1.3
http://slidepdf.com/reader/full/data-visualization-kpn-tools-v13 12/50 | ©2012, Cognizant12
QlickView

8/13/2019 Data Visualization - KPN - Tools v1.3
http://slidepdf.com/reader/full/data-visualization-kpn-tools-v13 13/50
| ©2012, Cognizant
QlikView - Features
13
• Fast growing, with good Data Visualization functionality, especially visualdrilldown but has
• QlikView creates endless possibilities of making ad hoc queries in a non-hierarchical data structure.
• Has a good in-memory columnar database and so called AQL (“Associative QueryLanguage”)
• allows instant, in memory, manipulation of massive datasets• does not require high cost hardware• automated data integration and a graphical analytical environment attractive for
customers• fast and powerful visualization capabilities• ease of use - end users require almost no training• highly scalable - near instant response time on very huge data volumes• fast implementation - customers are live in less than one month, and most in a
week• flexible - allows unlimited dimensions and measures and can be modified in
seconds• integrated - all in one solution : dashboards, power analysis and simply reporting
on a single architecture• low cost - shorter implementations result in cost saving and fast return on
investment

8/13/2019 Data Visualization - KPN - Tools v1.3
http://slidepdf.com/reader/full/data-visualization-kpn-tools-v13 14/50
| ©2012, Cognizant
QlikView - Advantages
14
• Comparative analysis: Perform comparative analysis for deeper insight. Users can now
easily compare and interact with multiple different views or selection states of the data• Mobility: Qlikview provides support for multiple tablet platforms which improves usability
and time to value. QlikView 11 delivers full mobile functionality for tablets on Apple iOS,Android, and BlackBerry platforms.
• Rapid Analytic App Platform: QlikView 11 includes new and improved capabilities thatmeet the needs of IT professionals and third-party software developers — as well as theneeds of business users who want to create their own analytic apps.
• Use of Screen estate: QlikView offers various gadgets, in-line minicharts, easy
management of object visibility which allows making dashboards very information rich.• Performance: QlikView 11 provides several new and improved capabilities to improve
system performance. For instance, Publisher Performance Improvements Mean FresherData, Load Balancing Improvements Reduce Complexity and Cost , More GranularClustering Optimizes Available Computing Resources.
• Need for an ETL: In general this also is true for QlikView. However since loading script inQlikView is capable to perform light ETL and data cleansing therefore in many cases this
is sufficient enough.• Session Activity Heat Map: The Statistics Sheet has a new Session Overview tab that
presents a heat chart of QlikView session activity over the preceding 14 days. It will help inusage tracking based on active sessions.

8/13/2019 Data Visualization - KPN - Tools v1.3
http://slidepdf.com/reader/full/data-visualization-kpn-tools-v13 15/50
| ©2012, Cognizant
QlikView - Disadvantages
15
• Higher Total cost of ownership than SaaS BI: Compared to SaaS BI solutions, thecost of QlikView is higher because of the procurement and maintenance of the hardware
needed for development, QA and production environments, and costs associated withdowntimes.
• No OLAP-style analysis: QlikView does not offer the richness of MDX and other logicalquery languages provided by traditional on premise BI products. These languagesenable end users to create far more powerful calculations (e.g. via addressing cellspositionally in either a materialized or logical cube) than are possible in QlikView.
• Drag-n-drop authoring : QlikView has almost nothing to offer here -- fields still have
to be picked from a cluttered properties dialogs and dashboards have rather staticlayout. • QlikView is less flexible than the other products and the company is more rigid• Qlikview portfolio(Client Tool, Server, Publisher, Information Access and Extranet
Servers) is more complicated, data connectivity is less sophisticated, multi-tenancy isnot supported, and access to different Data Visualizations (Documents in Qlikview’s speak) is limited
|

8/13/2019 Data Visualization - KPN - Tools v1.3
http://slidepdf.com/reader/full/data-visualization-kpn-tools-v13 16/50
| ©2012, Cognizant
Tool Competency | QlikView
16
Competency
Profile
Representative Experiences
Implemented a Supply chain scorecard with detailed
KPI analysis
Analyzed and integrated 25+ KPIs
Detailed analysis on KPIs by Month, Quarter,
year, Area, Region, Country, Business, Divisionand Commodity
The Actual and operating plan on the key
performance indicator helps the user to measure
the success factors and goals of their organization
BI users from over 13 countries were provided
with these reports
Case 01 – Diversified Technology
Company
Implemented Clinical Trial and Planning
Management Repository with detailed dimensions
and facts
Implemented a set of flexible dashboards with
filters, prompts, graphs, drill up/down, & column
selector capabilities to analyze 65 KPIs Provided Key metrics to leadership in the area of
trial management
Created 7 UI screens using Qlikview to display
160 objects
Increased the usability among the users by better
filters
Case 02 – Leading Pharmaceutical firm
Global information delivery and analytics solution to
address its enterprise wide sales reporting needs
Provides information on Sales-In (Daily Sales),
Trade Management, Point Of Sales, Goals data(forecasting information)
Developed individual data stores in the data
warehouse to capture different measures of data
Implemented data dependency on LDW jobs in
the QlikView reporting layer
Case 03 – Leading Network Solutions
Company
152* People; 31* Projects
* As of Aug, 2012
Customer Speak
“I want to thank you and your
team your hard work developingin a very tight schedule as well
as their interest to gather all our
suggestions .”
Sr Manager, Diversified
Technology Company
Global SI Partner
• BI environment Assessment / Tool
Evaluation
• Qlikview Implementation
• Report migration to Qlikview
Platform
• Performance Investigation and
Tuning
• User Enablement Services
i li i l | lik i

8/13/2019 Data Visualization - KPN - Tools v1.3
http://slidepdf.com/reader/full/data-visualization-kpn-tools-v13 17/50
| ©2012, Cognizant
Case 01 - Visualization Tool | QlikView
17
Cognizant’s Qlikview Experience @ A Diversified Technology Company
• Data from the Teradata (GEDW) was
transformed and loaded to Qlikview application
and several analysis charts and pivot tables
were created that enabled the user to validate
the data being analysed .
• EMMA Qlikview application includes screens
for rates,Source of Supply, Supply Costs, PriceCorridors, Rebates & Sales Departments,
Exchange Rates, Invoicing Exchange Rates,
Product Opportunity, EU Area Sales, Pricing
View, Opportunity Views, Price Corridors,
Customer by Product Sheet,Customer Price
Detail, Actions Sheets, Invoices, Benefit vs Loss,
Defects in Progress and Price Analysis
Cognizant Solution
An application for analysing the opportunity
and European Prices by checking the
Enterprise Lowest Net Selling Price (ELNSP) fora Product has to be developed and maintained
Client Situation
• General productivity gains as significantly
lesser time is spent in reviewing and
building reports and it also provides instant
access to information
• Strategic benefits from being able to
identify opportunity for Products, building
greater accountability through
transparency and speeding the strategic
decision making process
• Sales and service benefits from better
understanding of new market
opportunities, from seeing trends and from
improved chances to convert prospects to
customers
Client Benefits
Technology Landscape |
Database : Teradata
OS : WINNT
Tools : QlikView, BO
Effort : 12 Person Months
QlikVi | S l Vi li i

8/13/2019 Data Visualization - KPN - Tools v1.3
http://slidepdf.com/reader/full/data-visualization-kpn-tools-v13 18/50
| ©2012, Cognizant
QlikView| Sample Visualizations
18

8/13/2019 Data Visualization - KPN - Tools v1.3
http://slidepdf.com/reader/full/data-visualization-kpn-tools-v13 19/50

8/13/2019 Data Visualization - KPN - Tools v1.3
http://slidepdf.com/reader/full/data-visualization-kpn-tools-v13 20/50
| ©2012, Cognizant
Spotfire - Features
20
• It is a cloud-based BI tool for creating and publishing dashboards and
reports.• includes functionality for analysis, reporting, dashboards, and
advanced data visualization while Spotfire Silver (provides the bestZero-Footprint (web-based) Client in DV market).
• Has an excellent in-memory (64-bit) data engine and unlimitedability to scale-up to disk
•
Meets the needs of all users from ad-hoc analysis, to interactivereporting and dashboards, to domain-specific applications. Itintegrates with existing enterprise data sources and security models,and provides IT with a centralized means to administer and deployanalytics across the enterprise.
• Spotfire 3.3 also includes collaborative bookmarking, which enables
all Spotfire users to capture a dashboard - its completeconfiguration, including markings, drop down selections, and filtersettings and share that visualization immediately with other users ofthat same dashboard, regardless of client in use

8/13/2019 Data Visualization - KPN - Tools v1.3
http://slidepdf.com/reader/full/data-visualization-kpn-tools-v13 21/50
| ©2012, Cognizant
Spotfire - Advantages
21
• User Driven Analysis: A self-configuring, in-memory data engine creates filters,hierarchies and aggregations right from the data- without cubes or programming.Dynamic, linked visualizations immediately reveal hidden trends and outliers acrossmultiple data Sources. A highly responsive, drag-and-drop user interface gets users upand running in minutes.
• Simplified Data Access, Distributed Processing: end users can access both localand enterprise data sources in the same analysis. And, a flexible, in-memoryarchitecture allows the option of processing data on either desktop client CPUs or centralservers.
•Centralized Administration and Deployment: Spotfire Analytics Server providescentralized administration of end user access rights and client configurations, making ita breeze to deploy analytics across the enterprise.

8/13/2019 Data Visualization - KPN - Tools v1.3
http://slidepdf.com/reader/full/data-visualization-kpn-tools-v13 22/50
| ©2012, Cognizant
Spotfire - Disadvantages
22
• Analytical views are simply not supported which can even be verified by running a selectstatement on the views.
• In-memory associative index: Limited by physical memory. Some scripting/modellingstill required to load the data.
T l C t | S tfi

8/13/2019 Data Visualization - KPN - Tools v1.3
http://slidepdf.com/reader/full/data-visualization-kpn-tools-v13 23/50
| ©2012, Cognizant
Tool Competency | Spotfire
23
Competency
Profile
Representative Experiences
Implemented an in-Memory BI solution that
involved a virtualized semantic layer to enable faster
data discovery and advanced visualization
Used Spotfire visualization, analytics and
dashboarding capabilities to display Sales, Product,
Customer and Call Activity metrics and details (20+
views)
Visuals published and shared using zero foot print
Spotfire Web player accessible via web browser
enabled faster data analysis capability reducing
turn around time by 70%
Implemented Linked (Live connection) and
Embedded (Data in DXP) Spotfire Analyses
Case 01 – US Biotech Company
Developed End-to-End solution to standardize and
centralize Clinical Pharmacology data and enabled
effective Trial safety monitoring
Enabled the business to review monitoring data in
an integrated manner leveraging the In-MemoryAnalytics and Visualization features of Spotfire
Reduced the man hours and elapsed time in
preparation of data for safety review and
increased individual subject safety
Performance analysis and improvement when
connecting to diversified sources for improved
user experience
Case 02 – Global Integrated BioPharma
Client
Designed and Implemented a complete Interactive
dashboard with filtering mechanisms using Spotfire
Deliver technical solutions for implementation of
highly interactive and intuitive visuals that uses
in-memory filters, controls and on-demand dataretrieval.
Designed a functional testing approach to test
entire functionality of Product Dashboard
containing 12 tabs and 45+ visualizations across
Post marketing and Clinical Trial Safety reporting
Implemented Web player Caching and
Automation
Case 03 –Global Healthcare Leader
Global Consulting Partner 65* People; 4* Projects
* As of Aug, 2012
•
Content and Environment Support• Customization of Spotfire
Environment and Functionalities
• Integration with Enterprise portals
• Automation
•BI environment Assessment / ToolEvaluation
• Spotfire Dashboard Implementation
• Adoption
• Advisory
• Administration
Case 02 Visualization Tool | Spotfire
8/13/2019 Data Visualization - KPN - Tools v1.3
http://slidepdf.com/reader/full/data-visualization-kpn-tools-v13 24/50
| ©2012, Cognizant
Case 02 - Visualization Tool | Spotfire
24
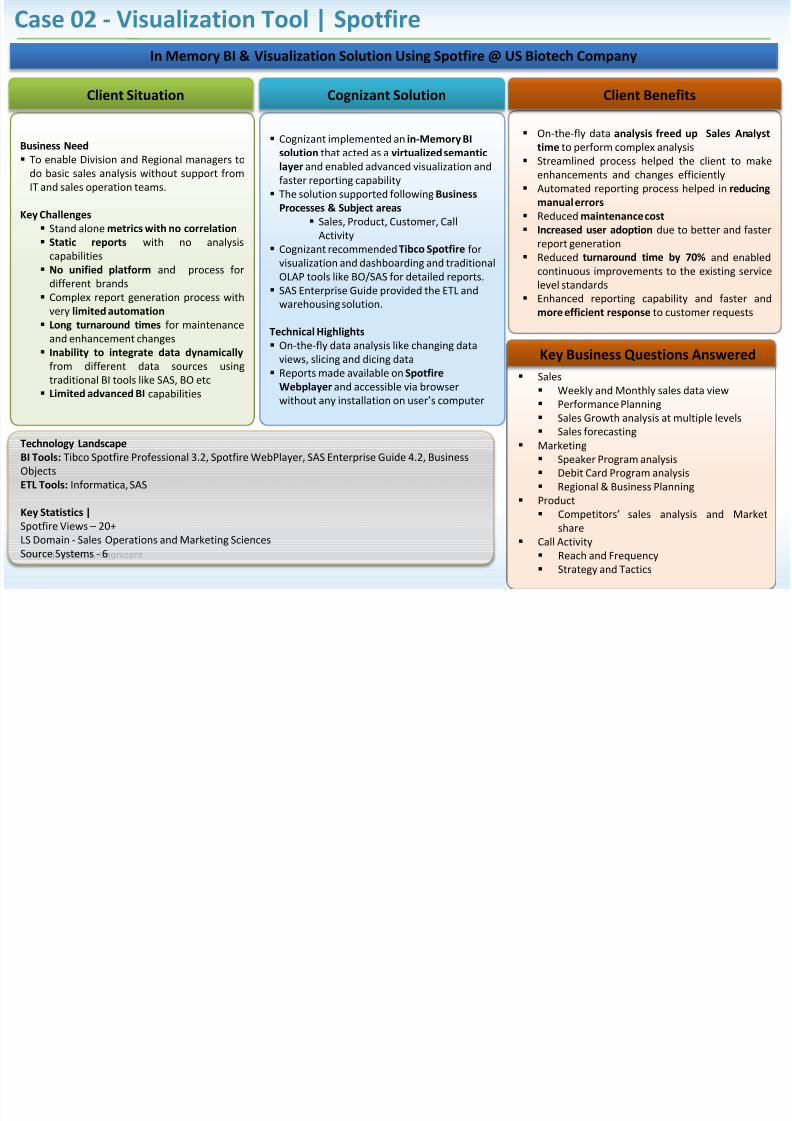
In Memory BI & Visualization Solution Using Spotfire @ US Biotech Company
Cognizant implemented an in-Memory BIsolution that acted as a virtualized semantic
layer and enabled advanced visualization and
faster reporting capability
The solution supported following Business
Processes & Subject areas
Sales, Product, Customer, Call
Activity
Cognizant recommended Tibco Spotfire for
visualization and dashboarding and traditional
OLAP tools like BO/SAS for detailed reports. SAS Enterprise Guide provided the ETL and
warehousing solution.
Technical Highlights
On-the-fly data analysis like changing data
views, slicing and dicing data
Reports made available on Spotfire
Webplayer and accessible via browser
without any installation on user’s computer
Cognizant Solution
Business Need
To enable Division and Regional managers to
do basic sales analysis without support from
IT and sales operation teams.
Key Challenges
Stand alone metrics with no correlation
Static reports with no analysis
capabilities
No unified platform and process for
different brands Complex report generation process with
very limited automation
Long turnaround times for maintenance
and enhancement changes
Inability to integrate data dynamically
from different data sources using
traditional BI tools like SAS, BO etc
Limited advanced BI capabilities
Client Situation
On-the-fly data analysis freed up Sales Analyst
time to perform complex analysis
Streamlined process helped the client to make
enhancements and changes efficiently
Automated reporting process helped in reducing
manual errors
Reduced maintenance cost
Increased user adoption due to better and faster
report generation
Reduced turnaround time by 70% and enabled
continuous improvements to the existing service
level standards
Enhanced reporting capability and faster and
more efficient response to customer requests
Client Benefits
Technology Landscape
BI Tools: Tibco Spotfire Professional 3.2, Spotfire WebPlayer, SAS Enterprise Guide 4.2, Business
Objects
ETL Tools: Informatica, SAS
Key Statistics |
Spotfire Views – 20+
LS Domain - Sales Operations and Marketing Sciences
Source Systems - 6
Sales
Weekly and Monthly sales data view
Performance Planning
Sales Growth analysis at multiple levels Sales forecasting
Marketing
Speaker Program analysis
Debit Card Program analysis
Regional & Business Planning
Product
Competitors’ sales analysis and Market
share
Call Activity
Reach and Frequency Strategy and Tactics
Key Business Questions Answered
Spotfire | Sample Visualizations

8/13/2019 Data Visualization - KPN - Tools v1.3
http://slidepdf.com/reader/full/data-visualization-kpn-tools-v13 25/50
| ©2012, Cognizant
Spotfire | Sample Visualizations
25

8/13/2019 Data Visualization - KPN - Tools v1.3
http://slidepdf.com/reader/full/data-visualization-kpn-tools-v13 26/50
©2012, Cognizant
Thank You

8/13/2019 Data Visualization - KPN - Tools v1.3
http://slidepdf.com/reader/full/data-visualization-kpn-tools-v13 27/50
©2012, Cognizant
Thank You
What is Data Visualization all about

8/13/2019 Data Visualization - KPN - Tools v1.3
http://slidepdf.com/reader/full/data-visualization-kpn-tools-v13 28/50
| ©2012, Cognizant
What is Data Visualization all about…
28
Represent important messages in data as patterns andpattern violations by using trends, gaps, and outliers
Exploration and provisioning useful information in anefficient way
Rapid processing of data for edge detection, shaperecognition, and pattern matching
Access to challenging data sets and making it available foranalysis
Making it interactive and using layers of data
Visual representation of quantitative data in schematic form (either
with or without axes)
Traditional BI vs Advanced Data Visualization

8/13/2019 Data Visualization - KPN - Tools v1.3
http://slidepdf.com/reader/full/data-visualization-kpn-tools-v13 29/50
| ©2012, Cognizant
Traditional BI vs Advanced Data Visualization
29
Advanced Data Visualization – Sample Screenshots
Conventional BI Advanced Data Visualization
Seeing numbers on the grid Seeing data as patterns when represented by graphs
Cannot fit lot of data into a screen Techniques can fit tens of thousands of data points in a single screen
Fitting in and analyzing hundreds or thousands
of attributes is a challengeShow deep and broad data sets in single screen
A typical single chart or graph cannot display
more than a few dimensions at a time.
Visualize and analyze data by multiple dimensions or attributes.
Navigating through a dimension in one panel automatically updates
all visualizations on all other panels.
Manual clicking and scrolling Animated Visualization
Ad-hoc queries on pre-modeled data setsCan perform True ad-hoc business analytics as no pre-definedmodels are required
Primarily focused on disk-resident and pre-
computed data
“in-memory” solutions make computation much faster
Components & features of Data Visualization

8/13/2019 Data Visualization - KPN - Tools v1.3
http://slidepdf.com/reader/full/data-visualization-kpn-tools-v13 30/50
| ©2012, Cognizant
Components & features of Data Visualization
30
Visual
Analytics
Visual
Exploration
Augmentation
of Human
Perception
Visual
Expressiveness
Automatic
Visualization
Visual
Perspective
Shifting
Visual
Perspective
Linking
Collaborative
Visualization
Visual analytics is becoming the fastest way for people to explore and understand data of any size
Unifying the steps of querying,
exploring and visualization data into
a single process
Data and visualization work in
tandem
Usability of data based on user
requirement
Accommodation of multiple
dimensions to create visual
representation for easy
interpretation
Uniform multidimensional
representation across geographies
and time
Encouraging the utility of human
perception
Graphical representation of data
for visual appreciation
Application driven automatic
analysis process
Shortening the analysis time
Automatic suggesting and effective
visualization
Series of alternative
visualization for effective
information communication
Helps generate right
questions in analysts mind to
move to next appropriate
visual instrument
Intimately linked information
representation for better data
relevance
Intuitive linking to enhanceuser experience of data
interpretation
Iterative creation of useful
information for better usage by
teams
Enables quick access to data toensure team collaboration
S it bilit f DVNeed to add Real time examples from KPN

8/13/2019 Data Visualization - KPN - Tools v1.3
http://slidepdf.com/reader/full/data-visualization-kpn-tools-v13 31/50
| ©2012, Cognizant
Suitability for DV
31
p
B fit f DV

8/13/2019 Data Visualization - KPN - Tools v1.3
http://slidepdf.com/reader/full/data-visualization-kpn-tools-v13 32/50
| ©2012, Cognizant32
Benefits of DV
• Real-life business analytics for real-life business data100 times Faster
• Intuitive, drag-and-drop tool that lets you see every change as youmake it
Ease of use
• Combine multiple views into a dashboard. Insert web pages anddocuments for greater explanation and insight. Highlight and filterrelated data
Smart, fit andbeautiful
dashboards
• Connect directly to databases, cubes, data warehouses, files andspreadsheets with only a few clicks, no programming required
• Manage data connection and metadata
Direct connect &go
• Combining data sources in the same view is so easy, can even filter
from one data source to another and highlight across data sourcesPerfect mashups
• no changes for your dashboards to show up on web browsers,mobile Safari, or the Tableau Mobile app
Analytics onSharePoint, iPad,
Tablets…
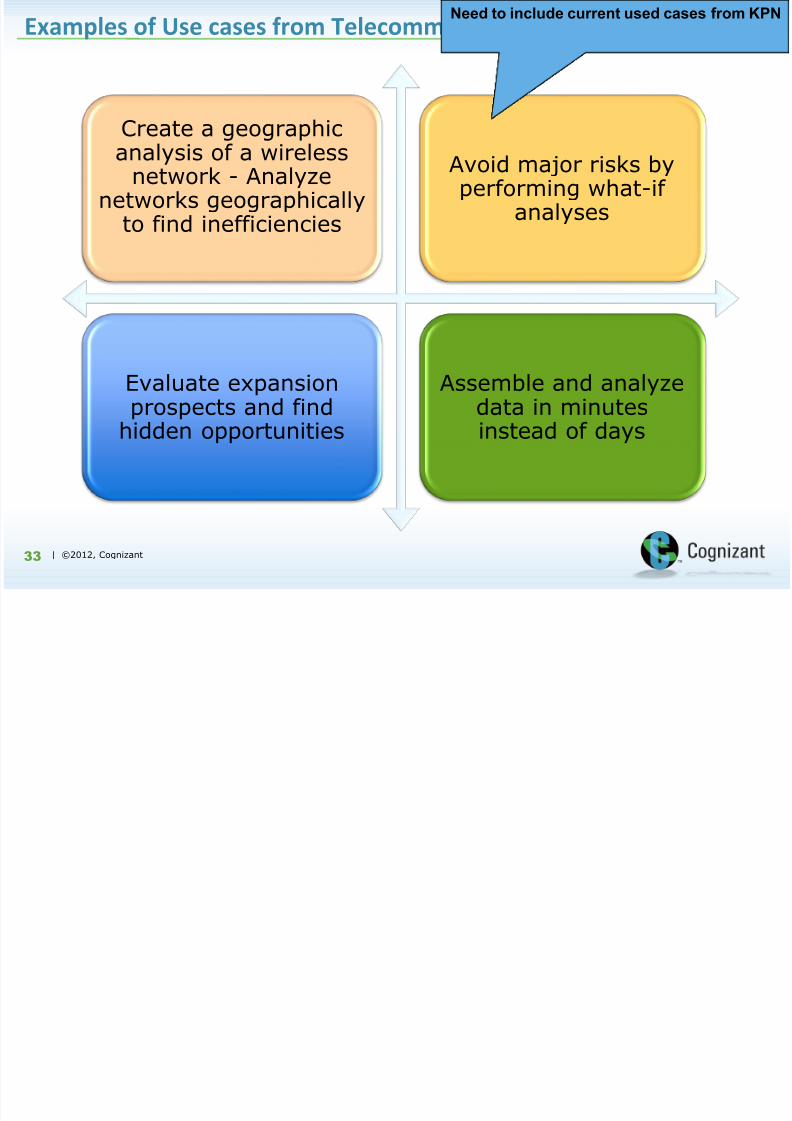
E amples of Use cases from Telecomm nications
Need to include current used cases from KPN
8/13/2019 Data Visualization - KPN - Tools v1.3
http://slidepdf.com/reader/full/data-visualization-kpn-tools-v13 33/50
| ©2012, Cognizant33
Create a geographicanalysis of a wireless
network - Analyzenetworks geographically
to find inefficiencies
Avoid major risks byperforming what-if
analyses
Evaluate expansionprospects and find
hidden opportunities
Assemble and analyzedata in minutesinstead of days
Examples of Use cases from Telecommunications
Cognizant’s Dashboarding Capabilities

8/13/2019 Data Visualization - KPN - Tools v1.3
http://slidepdf.com/reader/full/data-visualization-kpn-tools-v13 34/50
| ©2012, Cognizant
Cognizant s Dashboarding Capabilities
34
Competency
Profile
Representative Experiences
Implemented MicroStrategy dashboards in iPhone and
iPad
iPhone Focus – Personnel in market - Pre-defined
Metrics, Canned Analytics
iPad Focus – Leadership Access - Executive Cockpit,Selectable Measures, Drill down core Metrics
Corporate view of sales across Divisions
User selected sales view across Customer/Geo/Brand
Top 5/Bottom 5 view of sales across
Customers/Geo/Brand
Total of 5 dashboards , 30 reports were developed with
a refresh time of under 30 Seconds
Mobile dashboard implementation @ a
leading food products company
Delivery of interactive dashboards using MicroStrategy
Mobile BI
Corporate Revenue dashboards by Channels/
Brand/Region, Franchise Performance, FlightOperations, Social media summary
Delivery -Smartphone, iPad and iPhone
Refresh time < 1 min on a wifi connection
BI Mobile server integrated with Mobile I-Server
OLAP cubes for faster performance
MicroStrategy caching strategy applied so the
dashboards access the ‘cached’ datasets
Interactive dashboard design @ a leading
chain of Hotels and Resorts
Designed & implemented global Xcelsius architecture on
SAP BI platform and increased the functionality and user
friendliness to cover wide user base for dashboards
Phase 1- Offline dashboards with data extracts from
SAP Bex and Phase 2 – Direct integration to SAP Bex
Queries.
Proof of Concept for existing Bex dashboards
converted to Xcelsius 2008
Included 60 components with enhanced performance
and interactivity
User interactivity resulting in 3 dimensional entry to
the dashboards
Hyperlink dashboards - Executive summary to detail
dashboards
Dashboard design @ a leading Global
Pharmaceutical Company
780* People; 85* Projects
* As of Aug, 2012
•
Four Aces Framework
• C-Smart
• Early Warning System
• Logitics
DM Review Innovative Solution Award
2008 for performance management
dashboard solution
Microstrategy World 2010 Award
under the best dashboard design
category
Solution AcceleratorsAwards and Recognition

8/13/2019 Data Visualization - KPN - Tools v1.3
http://slidepdf.com/reader/full/data-visualization-kpn-tools-v13 35/50
| ©2012, Cognizant35
Tableau Capabilities

8/13/2019 Data Visualization - KPN - Tools v1.3
http://slidepdf.com/reader/full/data-visualization-kpn-tools-v13 36/50
| ©2012, Cognizant
Tableau Experience @ Large Online Market Place
36
About Client
Diversified technology company that provides a global trading platform Buyers have the option to purchase items in an auction-style format or items can be purchased at a fixed price Offers a wide variety of educational tools, features, and services that enable members to trade buy and sell on the site quickly,
safely, and conveniently
Key Business Strategy Themes: Create Customer Trust, Improve Customer Experience, Increase Customer Loyalty
Client Situation
The client being an online marketplace
wanted to analyze the users behavior to
the changes made to the pages to the
site. This required generation of reports.
The client was looking for a full- fledged
Business Intelligence Layer that met the
following requirements:-
A solution that comes with Lesser time
to Market (TTM)
Lower Total Cost of Ownership
Individual grids/graphs to be placed in a
single dashboard, and global controls
(i.e. selectors)
Easy to create and deliver dashboards.
Best in class visualization.
Easy to learn/Adopt for business users.
Cognizant Solution
Engagement Highlights
Cognizant performed Tool evaluationto find the best-fit for clientsrequirements. Tableau was evaluatedas the best fit in clients context
Extracted the raw data from theexperimental platform and providingbusiness reports using Tableauplatform to the users via Visualizationtool hence reducing time to marketcomponent.
Ability to quickly define &develop the requiredmetrics/reporting on top ofavailable data. (Able to developreports in less than a week’s
time with prod deployment)
This aided client’s research anddevelopment for the quickchanges & Innovativevisualization keeping the costfactor under control.
Client Benefits
Sample Dashboard View

8/13/2019 Data Visualization - KPN - Tools v1.3
http://slidepdf.com/reader/full/data-visualization-kpn-tools-v13 37/50
| ©2012, Cognizant
Sample Dashboard View
37
Tool Competency | Tableau

8/13/2019 Data Visualization - KPN - Tools v1.3
http://slidepdf.com/reader/full/data-visualization-kpn-tools-v13 38/50
| ©2012, Cognizant
Tool Competency | Tableau
38
Competency
Profile
Representative Experiences
Helped the client observe user’s behaviour to
changes on the site pages and test the
performance of various marketing decisions and
experiments
Reports were generated directly from Teradata
Datasets to Tableau Reports. The reports were
exposed via portal to the user base.
Once the experiment proved positive, site changes
were done to handle 100% traffic and metrics for
monitoring the system were provided from BI
reporting tools.
Case 01 – leading e-commerce firm
• Minimize the manual effort spent on data pull
from Teradata database by automatic report
generation using Tableau
• Tableau generates dashboards with the power of
visualizing complex analysis on millions of records
at once
• Tableau helped in making key business decisions
by performing on-the-fly calculations with
comparative visual analysis
Case 02 – a leading technology firm
• Currently working on a POC to analyze the usage
pattern across different segments
• Travel pattern, car rental pattern and dining
pattern analysis across different geographies are
linked to create a merchant cluster
• Create Decision Tree using Tableau Visualization
and analyze the campaign responses across
different segments to perform targeted marketing
Case 03 – a leading credit card company
• POC development
• Dashboard Configuration and
Customization
40* People; 3* Projects
* As of Aug, 2012• BI environment Assessment / Tool
Evaluation
• Tableau Implementation
• Report migration to Tableau Platform
• Performance Investigation and Tuning
• User Enablement Services
Case 03 - Visualization Tool | Tableau

8/13/2019 Data Visualization - KPN - Tools v1.3
http://slidepdf.com/reader/full/data-visualization-kpn-tools-v13 39/50
| ©2012, Cognizant
Case 03 Visualization Tool | Tableau
39
Tableau Data Visualization Experience @ Leading Online Retailer
Cognizant aided client’s experiment by using raw data from experimental platform and providing business
reports to user via Visualization tool hence reducing time to market component
Reports were generated directly from Teradata Datasets to Tableau Reports. The reports were exposed via
portal to the user base
Once the experiments proved positive results, the site changes are done to 100% traffic and long run
metrics for monitoring the system are provided from BI reporting tools.
This aided client’s research and development for the Innovations keeping the cost factor under control
Cognizant Solution
Client being an online market
system, abundance of data is
available to make proper business
decisions.
One of the case involved launch of
page on site and observe user’s
behavior to its changes. Most of
these experiments are short lived.
While reports need to begenerated to understand the user
behavior to test the performance
of experiments, building a fully
fledged Business intelligence layer
to meet the short lived experiment
can prove to be expensive
Client Situation
Key Highlights:
Database: Teradata
Projects Execution: Fixed Bid
Resources: 2 onsite
Duration: 3 Months
Tableau | Sample Visualizations Will have to update with some geo heat map
t

8/13/2019 Data Visualization - KPN - Tools v1.3
http://slidepdf.com/reader/full/data-visualization-kpn-tools-v13 40/50
| ©2012, Cognizant
ab eau | Sa p e sua at o s
40
reports

8/13/2019 Data Visualization - KPN - Tools v1.3
http://slidepdf.com/reader/full/data-visualization-kpn-tools-v13 41/50
©2012, Cognizant
Thank You

8/13/2019 Data Visualization - KPN - Tools v1.3
http://slidepdf.com/reader/full/data-visualization-kpn-tools-v13 42/50
| ©2012, Cognizant42
QlikView Capabilities

8/13/2019 Data Visualization - KPN - Tools v1.3
http://slidepdf.com/reader/full/data-visualization-kpn-tools-v13 43/50
Case 01 - Visualization Tool | QlikView

8/13/2019 Data Visualization - KPN - Tools v1.3
http://slidepdf.com/reader/full/data-visualization-kpn-tools-v13 44/50
| ©2012, Cognizant
|
44
Cognizant’s Qlikview Experience @ A Diversified Technology Company
• Data from the Teradata (GEDW) was
transformed and loaded to Qlikview application
and several analysis charts and pivot tables
were created that enabled the user to validate
the data being analysed .
• EMMA Qlikview application includes screens
for rates,Source of Supply, Supply Costs, Price
Corridors, Rebates & Sales Departments,
Exchange Rates, Invoicing Exchange Rates,
Product Opportunity, EU Area Sales, Pricing
View, Opportunity Views, Price Corridors,
Customer by Product Sheet,Customer Price
Detail, Actions Sheets, Invoices, Benefit vs Loss,
Defects in Progress and Price Analysis
Cognizant Solution
An application for analysing the opportunity
and European Prices by checking the
Enterprise Lowest Net Selling Price (ELNSP) for
a Product has to be developed and maintained
Client Situation
• General productivity gains as significantly
lesser time is spent in reviewing and
building reports and it also provides instant
access to information
• Strategic benefits from being able to
identify opportunity for Products, building
greater accountability through
transparency and speeding the strategic
decision making process
• Sales and service benefits from better
understanding of new market
opportunities, from seeing trends and from
improved chances to convert prospects to
customers
Client Benefits
Technology Landscape |
Database : Teradata
OS : WINNT
Tools : QlikView, BO
Effort : 12 Person Months
QlikView| Sample Visualizations

8/13/2019 Data Visualization - KPN - Tools v1.3
http://slidepdf.com/reader/full/data-visualization-kpn-tools-v13 45/50
| ©2012, Cognizant
| p
45

8/13/2019 Data Visualization - KPN - Tools v1.3
http://slidepdf.com/reader/full/data-visualization-kpn-tools-v13 46/50
| ©2012, Cognizant46
Spotfire Capabilities
Tool Competency | Spotfire
8/13/2019 Data Visualization - KPN - Tools v1.3
http://slidepdf.com/reader/full/data-visualization-kpn-tools-v13 47/50
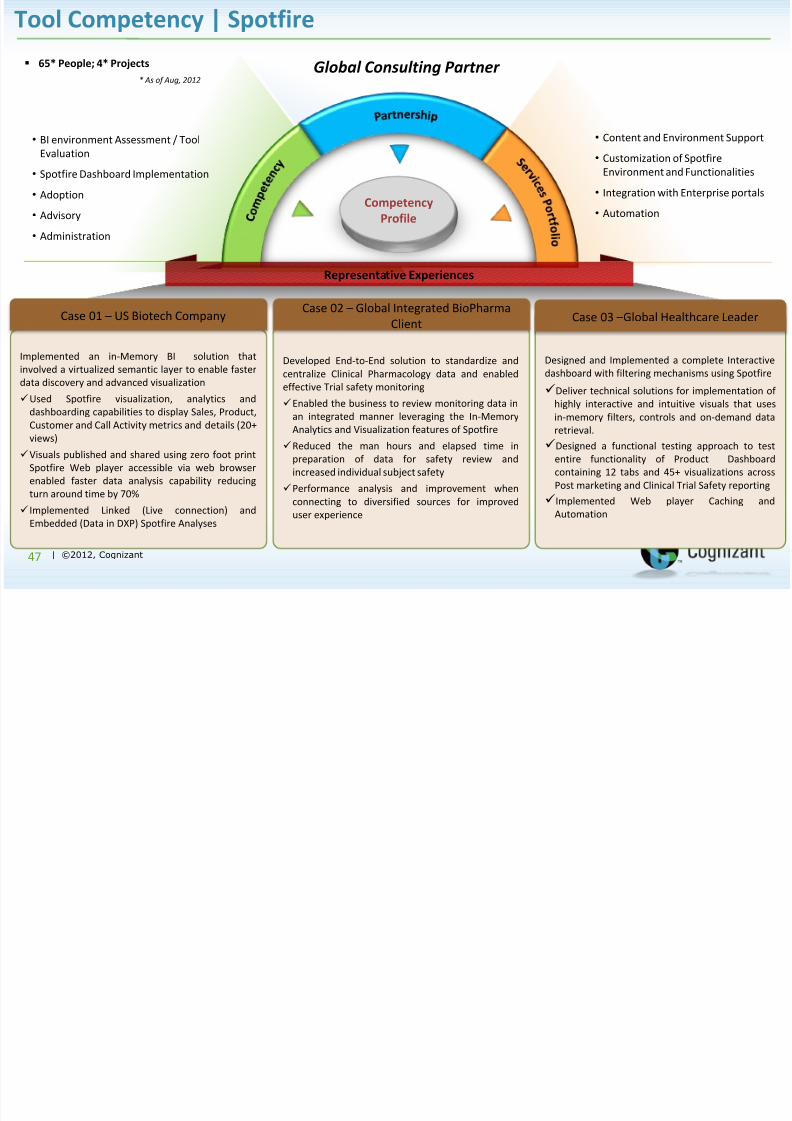
| ©2012, Cognizant
47
Competency
Profile
Representative Experiences
Implemented an in-Memory BI solution that
involved a virtualized semantic layer to enable faster
data discovery and advanced visualization
Used Spotfire visualization, analytics and
dashboarding capabilities to display Sales, Product,
Customer and Call Activity metrics and details (20+views)
Visuals published and shared using zero foot print
Spotfire Web player accessible via web browser
enabled faster data analysis capability reducing
turn around time by 70%
Implemented Linked (Live connection) and
Embedded (Data in DXP) Spotfire Analyses
Case 01 – US Biotech Company
Developed End-to-End solution to standardize and
centralize Clinical Pharmacology data and enabled
effective Trial safety monitoring
Enabled the business to review monitoring data in
an integrated manner leveraging the In-Memory
Analytics and Visualization features of Spotfire
Reduced the man hours and elapsed time in
preparation of data for safety review and
increased individual subject safety
Performance analysis and improvement when
connecting to diversified sources for improved
user experience
Case 02 – Global Integrated BioPharma
Client
Designed and Implemented a complete Interactive
dashboard with filtering mechanisms using Spotfire
Deliver technical solutions for implementation of
highly interactive and intuitive visuals that uses
in-memory filters, controls and on-demand dataretrieval.
Designed a functional testing approach to test
entire functionality of Product Dashboard
containing 12 tabs and 45+ visualizations across
Post marketing and Clinical Trial Safety reporting
Implemented Web player Caching and
Automation
Case 03 –Global Healthcare Leader
Global Consulting Partner 65* People; 4* Projects
* As of Aug, 2012
• Content and Environment Support
• Customization of Spotfire
Environment and Functionalities
• Integration with Enterprise portals
• Automation
• BI environment Assessment / Tool
Evaluation
• Spotfire Dashboard Implementation
• Adoption
• Advisory
• Administration
Case 02 - Visualization Tool | Spotfire

8/13/2019 Data Visualization - KPN - Tools v1.3
http://slidepdf.com/reader/full/data-visualization-kpn-tools-v13 48/50
| ©2012, Cognizant
48
In Memory BI & Visualization Solution Using Spotfire @ US Biotech Company
Cognizant implemented an in-Memory BI
solution that acted as a virtualized semantic
layer and enabled advanced visualization and
faster reporting capability
The solution supported following Business
Processes & Subject areas
Sales, Product, Customer, Call
Activity
Cognizant recommended Tibco Spotfire for
visualization and dashboarding and traditional
OLAP tools like BO/SAS for detailed reports.
SAS Enterprise Guide provided the ETL and
warehousing solution.
Technical Highlights
On-the-fly data analysis like changing data
views, slicing and dicing data
Reports made available on Spotfire
Webplayer and accessible via browser
without any installation on user’s computer
Cognizant Solution
Business Need To enable Division and Regional managers to
do basic sales analysis without support from
IT and sales operation teams.
Key Challenges
Stand alone metrics with no correlation
Static reports with no analysis
capabilities
No unified platform and process for
different brands Complex report generation process with
very limited automation
Long turnaround times for maintenance
and enhancement changes
Inability to integrate data dynamically
from different data sources using
traditional BI tools like SAS, BO etc
Limited advanced BI capabilities
Client Situation
On-the-fly data analysis freed up Sales Analyst
time to perform complex analysis Streamlined process helped the client to make
enhancements and changes efficiently
Automated reporting process helped in reducing
manual errors
Reduced maintenance cost
Increased user adoption due to better and faster
report generation
Reduced turnaround time by 70% and enabled
continuous improvements to the existing service
level standards Enhanced reporting capability and faster and
more efficient response to customer requests
Client Benefits
Technology Landscape
BI Tools: Tibco Spotfire Professional 3.2, Spotfire WebPlayer, SAS Enterprise Guide 4.2, Business
Objects
ETL Tools: Informatica, SAS
Key Statistics |
Spotfire Views – 20+
LS Domain - Sales Operations and Marketing Sciences
Source Systems - 6
Sales
Weekly and Monthly sales data view
Performance Planning
Sales Growth analysis at multiple levels
Sales forecasting
Marketing
Speaker Program analysis
Debit Card Program analysis
Regional & Business Planning
Product
Competitors’ sales analysis and Market
share
Call Activity
Reach and Frequency
Strategy and Tactics
Key Business Questions Answered
Spotfire | Sample Visualizations

8/13/2019 Data Visualization - KPN - Tools v1.3
http://slidepdf.com/reader/full/data-visualization-kpn-tools-v13 49/50
| ©2012, Cognizant
49

8/13/2019 Data Visualization - KPN - Tools v1.3
http://slidepdf.com/reader/full/data-visualization-kpn-tools-v13 50/50
©2012, Cognizant
Thank You


