26
Contact: Corporate Communication Group Tel: 06-6321-7007 Fax: 06-6321-8400 E-mail: [email protected].jp Stock Code: 4536 2008 Year Ended March 31, 2008

Contact:Corporate Communication Group Tel: 06-6321-7007 Fax: 06-6321-8400 E-mail: [email protected] Code: 4536
2008Year Ended March 31, 2008

Forecasts in this report are based on the currently available information.Actual results may differ materially depending on a number of factors including adverse economic conditions, delays in newproducts launch, currency exchange rate, legislative and regulatory developments.
Financial highlights 2■Consolidated financial summary 2■Consolidated balance sheets summary 2■Consolidated financial indexes 2■Consolidated other figures 2
Consolidated information 4Consolidated income statements 4Income statements details 5
■Major change in net sales 5■Major Selling, general and administrative expenses 5■Major Non-operating income and expenses 5■Major Extraordinary gain and loss 5
Sales details 6■Sales of major prescription pharmaceuticals 6■Sales by division 8
Breakdown by geographic segment 9■Breakdown by geographic segment 9■Overseas sales 9
Consolidated balance sheets 10■Assets 10■Liabilities and net assets 11
Consolidated statements of cash flows 12Capital expenditures and number of employees 13
■Capital expenditures 13■Depreciation and amortization 13■Lease expenses 13■Number of employees 13
Affiliated companies 14■Santen group 14■Consolidated subsidiaries 14
Reference information 16Research & development 16
■Pipeline of prescription pharmaceuticals (Clinical studies) 16■Pipeline of prescription pharmaceuticals (In preparation for clinical trials)
17
■License out 17■Changes from November 2, 2007 17
Pharmaceutical market in Japan 18■Revision of National Health Insurance (NHI) drug prices 18■Major healthcare reforms 18■Market shares 19■Market shares by therapeutic area - prescription ophthalmics 19
Stock information 20■Stock price 20■Major shareholders 20■Stock option 20■Extinguishment of Treasury stock 20■Breakdown of shareholding by number of shares 21■Breakdown of shareholding by number of shareholders 21
News releases 22
1 May 9, 2008

■Consolidated financial summary (Millions of yen)
Year ended March 31 2004 2005 2006 2007 2008 % Change2008/2007
2009Forecast
% Change2009/2008
Net sales 89,857 92,696 98,397 100,485 103,394 2.9 104,000 0.6Operating income 14,525 18,982 20,995 20,412 20,370 -0.2 20,500 0.6Ordinary income 15,790 18,837 21,507 20,843 20,702 -0.7 21,000 1.4Net income 6,321 11,022 13,022 13,147 12,650 -3.8 13,000 2.8Dividends per share (yen) 40 50 60 65 80 - 80 -
DOE (%) 3.4 4.0 4.4 4.4 5.4 - - -
■Consolidated balance sheets summary (Millions of yen)
Year ended March 31 2004 2005 2006 2007 2008 % Change2008/2007
Total assets 150,237 139,979 150,458 159,098 156,547 -1.6Net assets 103,499 108,239 118,637 128,645 127,118 -1.2Interest-bearing debts 12,686 6,882 5,614 5,446 5,278 -3.1
■Consolidated financial indexes
Year ended March 31 2004 2005 2006 2007 2008 % Change2008/2007
2009Forecast
% Change2009/2008
EPS (yen) 71.65 125.85 150.26 151.58 146.15 -3.6 152.98 4.7BPS (yen) 1,176.83 1,249.32 1,368.27 1,481.83 1,494.48 0.9 - -
Debt equity ratio (times) 0.12 0.06 0.05 0.04 0.04 - - -
PER (times) 24.3 18.3 18.8 20.0 15.9 - - -
PBR (times) 1.50 1.84 2.07 2.04 1.56 - - -
ROE (%) 6.3 10.4 11.5 10.6 9.9 - - -
ROA (%) 4.3 7.6 9.0 8.5 8.0 - - -
* Free cash flows (millions of yen) 19,971 1,713 18,772 11,404 12,316 8.0 - -
* EBITDA (millions of yen) 18,660 23,367 25,258 25,890 25,172 -2.8 - -
*Free cash flows = (Cash flows from operating activities) - (Capital expenditures)
Not adjusting increase/decrease in trade receivables for fiscal years ending on holidays.
*EBITDA = (Income before income taxes) + (Interest expense) + (Depreciation and amortization)
■Consolidated other figures
Year ended March 31 2004 2005 2006 2007 2008 % Change2008/2007
2009Forecast
% Change2009/2008
R&D expenses (millions of yen) 11,853 12,619 13,971 13,663 12,941 -5.3 14,000 8.2Capital expenditures (millions of yen) 2,871 1,674 1,420 2,716 2,758 1.5 2,380 -13.7Depreciation and amortization(millions of yen) 3,914 3,696 3,343 3,295 3,353 1.8 3,700 10.3
Number of employees 2,335 2,308 2,312 2,409 2,483 - - -
*Forecasts in this report are based on the currently available information. Actual results may differ materially depending on a number offactors including adverse economic conditions etc.
2 May 9, 2008

■Consolidated Financial summary (Graph)
Ordinary income
【Non-consolidated】
Recurring income (millions of yen)
Net sales (Millions of yen)
80,000
85,000
90,000
95,000
100,000
105,000
2004 2005 2006 2007 2008
EPS (yen)
0.00
20.00
40.00
60.00
80.00
100.00
120.00
140.00
160.00
2004 2005 2006 2007 2008
Net assets (Millions of yen)
90,000
95,000
100,000
105,000
110,000
115,000
120,000
125,000
130,000
2004 2005 2006 2007 2008
Total assets (Millions of yen)
130,000
135,000
140,000
145,000
150,000
155,000
160,000
2004 2005 2006 2007 2008
ROE (%)
0.0
2.0
4.0
6.0
8.0
10.0
12.0
14.0
2004 2005 2006 2007 2008
Net income (Millions of yen)
0
2,000
4,000
6,000
8,000
10,000
12,000
14,000
2004 2005 2006 2007 2008
PER (times)
0.0
5.0
10.0
15.0
20.0
25.0
30.0
2004 2005 2006 2007 2008
DOE (%)
0.0
1.0
2.0
3.0
4.0
5.0
6.0
2004 2005 2006 2007 2008
3 May 9, 2008

(Millions of yen)
Year ended March 31 2004 2005 2006 2007 2008 % Change2008/2007
Net sales 89,857 92,696 98,397 100,485 103,394 2.9Cost of sales 31,857 33,709 34,534 35,483 36,513 2.9(Percentage of net sales) 35.4% 36.4% 35.1% 35.3% 35.3%Gross profit 58,000 58,986 63,863 65,001 66,880 2.9(Percentage of net sales) 64.6% 63.6% 64.9% 64.7% 64.7%Selling, general and administrative expenses 43,474 40,003 42,868 44,589 46,510 4.3(Percentage of net sales) 48.4% 43.1% 43.6% 44.4% 45.0% R&D expenses 11,853 12,619 13,971 13,663 12,941 -5.3 (Percentage of net sales) 13.2% 13.6% 14.2% 13.6% 12.5%Operating income 14,525 18,982 20,995 20,412 20,370 -0.2(Percentage of net sales) 16.2% 20.5% 21.3% 20.3% 19.7%Non-operating income 2,908 803 1,024 1,138 1,356 19.1Non-operating expenses 1,643 948 511 707 1,024 44.8Ordinary income 15,790 18,837 21,507 20,843 20,702 -0.7(Percentage of net sales) 17.6% 20.3% 21.9% 20.7% 20.0%Extraordinary gain 682 1,137 53 250 237 -5.4Extraordinary loss 2,698 1,538 1,219 55 457 729.5Income before income taxes 13,774 18,436 20,341 21,039 20,482 -2.6(Percentage of net sales) 15.3% 19.9% 20.7% 20.9% 19.8%Income taxes - current 8,750 6,446 7,999 7,902 8,145 3.1Income taxes - deferred -1,297 966 -679 -10 -313 2,877.6Net income 6,321 11,022 13,022 13,147 12,650 -3.8(Percentage of net sales) 7.0% 11.9% 13.2% 13.1% 12.2%
【Exchange rates】(Yen)
Year ended March 31 2004 2005 2006 2007 2008 2009Forecast
Exchange rate: US dollar 113.29 107.19 113.42 116.86 114.29 108.00 Euro 132.40 134.64 137.77 148.99 161.98 155.00
*Forecasts in this report are based on the currently available information. Actual results may differ materially depending on a numberof factors including adverse economic conditions etc.
Consolidated information
4 May 9, 2008
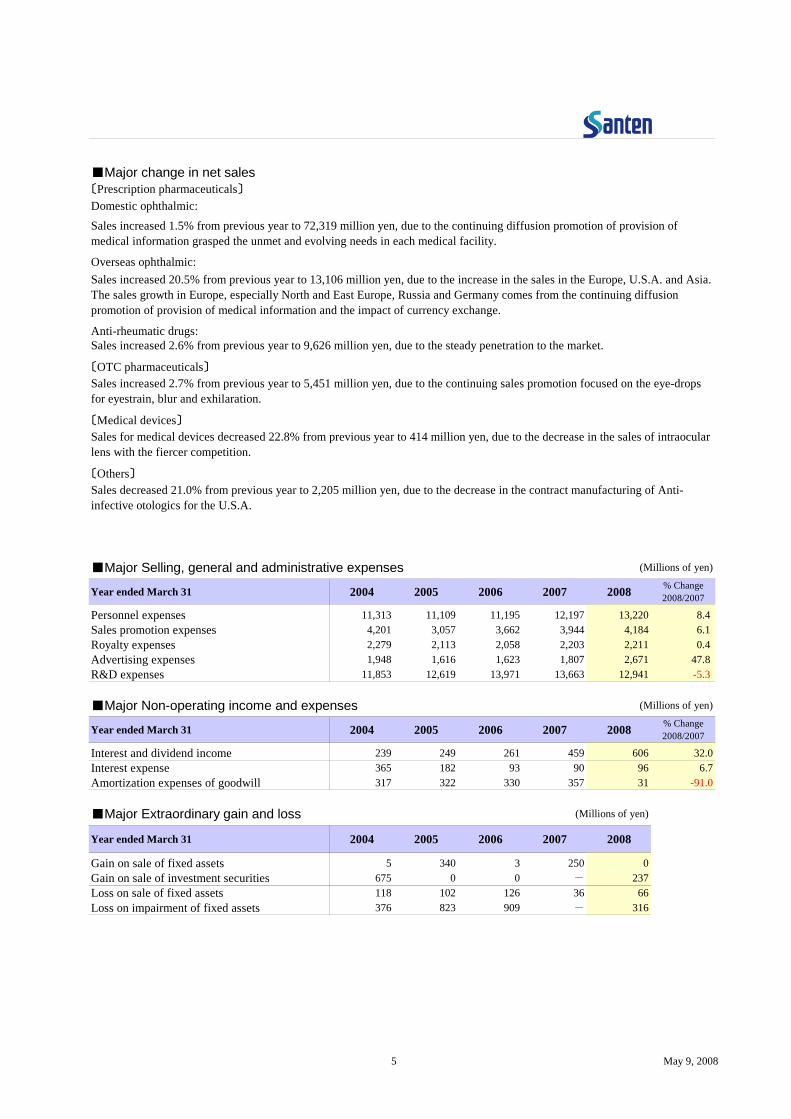
■Major change in net sales〔Prescription pharmaceuticals〕Domestic ophthalmic:
Overseas ophthalmic:
Anti-rheumatic drugs:
〔OTC pharmaceuticals〕
〔Medical devices〕
〔Others〕
■Major Selling, general and administrative expenses (Millions of yen)
Year ended March 31 2004 2005 2006 2007 2008 % Change2008/2007
Personnel expenses 11,313 11,109 11,195 12,197 13,220 8.4Sales promotion expenses 4,201 3,057 3,662 3,944 4,184 6.1Royalty expenses 2,279 2,113 2,058 2,203 2,211 0.4Advertising expenses 1,948 1,616 1,623 1,807 2,671 47.8R&D expenses 11,853 12,619 13,971 13,663 12,941 -5.3
■Major Non-operating income and expenses (Millions of yen)
Year ended March 31 2004 2005 2006 2007 2008 % Change2008/2007
Interest and dividend income 239 249 261 459 606 32.0Interest expense 365 182 93 90 96 6.7Amortization expenses of goodwill 317 322 330 357 31 -91.0
■Major Extraordinary gain and loss (Millions of yen)
Year ended March 31 2004 2005 2006 2007 2008
Gain on sale of fixed assets 5 340 3 250 0Gain on sale of investment securities 675 0 0 - 237Loss on sale of fixed assets 118 102 126 36 66Loss on impairment of fixed assets 376 823 909 - 316
Sales increased 1.5% from previous year to 72,319 million yen, due to the continuing diffusion promotion of provision ofmedical information grasped the unmet and evolving needs in each medical facility.
Sales increased 20.5% from previous year to 13,106 million yen, due to the increase in the sales in the Europe, U.S.A. and Asia.The sales growth in Europe, especially North and East Europe, Russia and Germany comes from the continuing diffusionpromotion of provision of medical information and the impact of currency exchange.
Sales increased 2.7% from previous year to 5,451 million yen, due to the continuing sales promotion focused on the eye-dropsfor eyestrain, blur and exhilaration.
Sales decreased 21.0% from previous year to 2,205 million yen, due to the decrease in the contract manufacturing of Anti-infective otologics for the U.S.A.
Sales increased 2.6% from previous year to 9,626 million yen, due to the steady penetration to the market.
Sales for medical devices decreased 22.8% from previous year to 414 million yen, due to the decrease in the sales of intraocularlens with the fiercer competition.
5 May 9, 2008

■Sales of major prescription pharmaceuticalsTherapeutic category Generic name/formulation Brand name Region Launched
Cravit Japan Apr-00ofloxacin/ophthalmic solution Tarivid Japan Sep-87timolol maleate/ophthalmic solution Timoptol Japan Sep-81timotol maleate/ long-acting ophthalmic solution Timoptol XE Japan Nov-99
bunazosin hydrochloride Detantol Japan Sep-01isopropyl unoprostone Rescula ※ Japan Oct-94levocabastine hydrochloride/ ophthalmic solution Livostin Japan Jan-01
Corneal disease sodium hyaluronate/ophthalmic solution Hyalein Japan Jun-95Inflammation fluorometholone/ophthalmic solution Flumetholon Japan Oct-75Early-stage senile cataract pirenoxine/ophthalmic solution Kary Uni Japan Jul-92Adjuvant for ophthalmicoperations
sodium hyaluronate/ adjuvant for ophthalmic operations Opegan Hi Japan Jan-95
Perfusate/lotion oxiglutatione/ophthalmic perfusate and lotion BSS PLUS Japan Jan-92bucillamine/tablet Rimatil Japan Sep-87salazosulfapyridine/enteric coated tablet Azulfidine EN Japan Dec-95
※Rescula: This product, which was launched in October 1994, has been sold by Santen Pharmaceutical Co., Ltd. since October2004.
Rheumatoid arthritis
Glaucoma
Allergy
levofloxacin/ophthalmic solutionBacterial conjunctivitis
Sales of major products: Proportion of total prescription pharmaceutical sales
(Year ended March 31, 2008)
Timoptol &Timoptol XE
9%
Tarivid4%
Cravit17%
Rimatil6%
Others25%
Rescula7%
Hyalein26%
Flumetholon6%
6 May 9, 2008
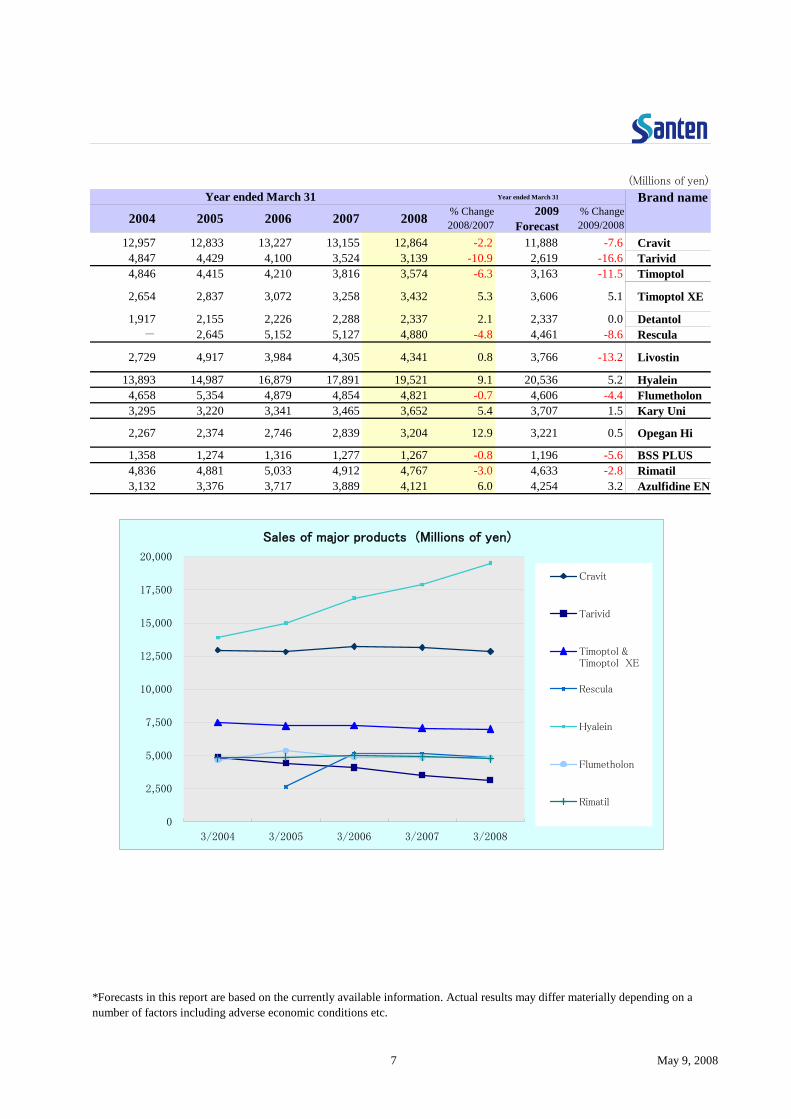
(Millions of yen)Year ended March 31 Brand name
2004 2005 2006 2007 2008 % Change2008/2007
2009Forecast
% Change2009/2008
12,957 12,833 13,227 13,155 12,864 -2.2 11,888 -7.6 Cravit4,847 4,429 4,100 3,524 3,139 -10.9 2,619 -16.6 Tarivid4,846 4,415 4,210 3,816 3,574 -6.3 3,163 -11.5 Timoptol
2,654 2,837 3,072 3,258 3,432 5.3 3,606 5.1 Timoptol XE
1,917 2,155 2,226 2,288 2,337 2.1 2,337 0.0 Detantol- 2,645 5,152 5,127 4,880 -4.8 4,461 -8.6 Rescula
2,729 4,917 3,984 4,305 4,341 0.8 3,766 -13.2 Livostin
13,893 14,987 16,879 17,891 19,521 9.1 20,536 5.2 Hyalein4,658 5,354 4,879 4,854 4,821 -0.7 4,606 -4.4 Flumetholon3,295 3,220 3,341 3,465 3,652 5.4 3,707 1.5 Kary Uni
2,267 2,374 2,746 2,839 3,204 12.9 3,221 0.5 Opegan Hi
1,358 1,274 1,316 1,277 1,267 -0.8 1,196 -5.6 BSS PLUS4,836 4,881 5,033 4,912 4,767 -3.0 4,633 -2.8 Rimatil3,132 3,376 3,717 3,889 4,121 6.0 4,254 3.2 Azulfidine EN
Year ended March 31
*Forecasts in this report are based on the currently available information. Actual results may differ materially depending on anumber of factors including adverse economic conditions etc.
Sales of major products (Millions of yen)
0
2,500
5,000
7,500
10,000
12,500
15,000
17,500
20,000
3/2004 3/2005 3/2006 3/2007 3/2008
Cravit
Tarivid
Timoptol &Timoptol XE
Rescula
Hyalein
Flumetholon
Rimatil
7 May 9, 2008

■Sales by division (Millions of yen)
Year ended March 31 2004 2005 2006 2007 2008 % Change2008/2007
Prescription pharmaceuticals 80,061 84,298 90,251 91,849 95,322 3.8 Ophthalmic 71,744 75,624 80,922 82,152 85,426 4.0 Anti-rheumatic drugs 7,969 8,353 9,041 9,379 9,626 2.6 Other prescription pharmaceuticals 347 319 287 317 269 -15.3
OTC pharmaceuticals 4,672 5,277 5,247 5,307 5,451 2.7Medical devices 914 754 638 537 414 -22.8Others 4,209 2,366 2,260 2,791 2,205 -21.0Total net sales 89,857 92,696 98,397 100,485 103,394 2.9
[Domestic] (Millions of yen)
Year ended March 31 2004 2005 2006 2007 2008 % Change2008/2007
Prescription pharmaceuticals 70,868 76,895 80,308 80,743 82,088 1.7 Ophthalmic 62,717 68,383 71,215 71,272 72,319 1.5 Anti-rheumatic drugs 7,862 8,244 8,869 9,208 9,519 3.4 Other prescription pharmaceuticals 288 267 223 263 248 -5.4
OTC pharmaceuticals 4,657 5,260 5,227 5,286 5,430 2.7Medical devices 877 726 618 515 401 -22.2Others 1,073 562 629 605 646 6.7Total domestic sales 77,477 83,446 86,784 87,152 88,566 1.6(Percentage of total net sales) 86.2% 90.0% 88.2% 86.7% 85.7% -
[Overseas] (Millions of yen)
Year ended March 31 2004 2005 2006 2007 2008 % Change2008/2007
Prescription pharmaceuticals 9,193 7,402 9,942 11,105 13,234 19.2 Ophthalmic 9,027 7,241 9,706 10,880 13,106 20.5 Anti-rheumatic drugs 106 108 172 170 107 -37.1 Other prescription pharmaceuticals 58 52 64 54 20 -63.1
OTC pharmaceuticals 14 16 20 20 20 -0.8Medical devices 37 27 19 21 13 -37.1Others 3,135 1,803 1,631 2,185 1,559 -28.7Total overseas sales 12,380 9,250 11,613 13,333 14,827 11.2(Percentage of total net sales) 13.8% 10.0% 11.8% 13.3% 14.3% -
8 May 9, 2008

■Breakdown by geographic segmentYear ended March 31
Million yen % Million yen % Million yen % Million yen % Million yen %
Japan 79,338 88.3 85,837 92.6 89,881 91.3 90,695 90.3 92,098 89.1Europe 8,848 9.8 6,374 6.9 8,155 8.3 9,186 9.1 10,617 10.3Others 1,671 1.9 484 0.5 360 0.4 604 0.6 678 0.6Total 89,857 100.0 92,696 100.0 98,397 100.0 100,485 100.0 103,394 100.0Japan 60,004 64,216 68,244 70,093 71,442Europe 12,603 8,148 9,192 10,234 12,103Others 8,255 3,798 3,927 3,970 4,259Total 80,863 76,162 81,364 84,298 87,805Corporate andeliminations -5,531 -2,448 -3,961 -4,225 -4,781
Consolidated total 75,332 73,713 77,402 80,073 83,023Japan 20,351 22,169 22,623 21,768 22,633Europe -2,599 -149 951 979 554Others -548 -743 -708 -754 -819Total 17,204 21,276 22,866 21,993 22,368Corporate andeliminations -2,678 -2,294 -1,871 -1,580 -1,997
Consolidated total 14,525 18,982 20,995 20,412 20,370
Europe: Finland, Germany and SwedenOthers: U.S.A., China, Korea and TaiwanNote: Sales of prescription ophthalmics in the U.S.A. are included in sales in Europe.
■Overseas salesYear ended March 31
Million yen % Million yen % Million yen % Million yen % Million yen %
Europe 4,370 35.3 4,794 51.8 6,089 52.4 6,916 51.9 8,532 57.5North America 5,813 47.0 1,703 18.4 1,915 16.5 2,128 16.0 1,951 13.2Asia - - - - - - - - 4,326 29.2Others * 2,196 17.7 2,752 29.8 3,608 31.1 4,287 32.1 16 0.1Total 12,380 100.0 9,250 100.0 11,613 100.0 13,333 100.0 14,827 100.0
Europe: Finland, Russia, Sweden, Germany and NorwayNorth America: U.S.A.Asia: Korea, China, Vietnam and TaiwanOthers: Australia etc. * Others in the past fiscal year include the sales amount to the Asian region.
2008
Note: Overseas sales represent sales generated in countries or regions other than Japan by Santen Pharmaceutical Co., Ltd. and its subsidiaries.
2005 2006 20072004
2008
Net
sale
s by
geog
raph
ic se
gmen
tO
pera
ting
expe
nses
by
geog
raph
ic se
gmen
tO
pera
ting
inco
me
byge
ogra
phic
segm
ent
2004 2005 2006 2007
9 May 9, 2008

■Assets (Millions of yen)
March 31% % % % %
Current assets 91,230 60.7 82,735 59.1 93,892 62.4 100,820 63.4 102,754 65.6 Cash and deposits 33,629 23,948 34,583 34,295 35,483 Notes and accounts receivable-trade 32,456 35,625 34,423 35,034 35,614
Marketable securities 9,303 9,046 11,201 16,914 15,868 Inventories 10,393 9,826 9,837 10,357 11,332 Deferred tax assets 2,255 1,625 1,651 1,625 1,699 Other current assets 3,448 2,681 2,196 2,593 2,757 Allowance for doubtful receivables -256 -18 -1 -0 -1
Fixed assets 59,006 39.3 57,244 40.9 56,552 37.6 58,228 36.6 53,548 34.2 Tangible assets 37,237 24.8 32,676 23.3 30,395 20.2 30,485 19.2 29,848 19.1 Buildings and structures 20,577 18,826 17,119 16,063 15,160 Machinery, equipment and vehicles 1,882 2,114 2,021 1,817 2,656
Land 10,645 9,486 9,063 8,842 8,558 Construction in progress 1,750 181 274 1,806 1,879 Other tangibles 2,382 2,067 1,916 1,955 1,594
Intangible assets 4,000 2.7 3,318 2.4 2,951 2.0 2,771 1.7 2,233 1.4 Goodwill 1,333 1,021 711 385 300 Software 1,207 1,182 1,035 1,660 1,602 Other intangibles 1,458 1,113 1,204 726 330
Investments and other assets 17,769 11.8 21,250 15.2 23,205 15.4 24,971 15.7 21,466 13.7 Investment securities 11,482 14,313 17,715 21,019 16,949 Deferred tax assets 1,814 1,051 379 - 1,822 Other assets 4,476 5,885 5,109 3,951 2,694 Allowance for doubtful receivables -3 - - - -
Deferred assets - - - - 13 0.0 50 0.0 244 0.2
Total assets 150,237 100.0 139,979 100.0 150,458 100.0 159,098 100.0 156,547 100.0
【Major variances between March 31, 2007 and March 31, 2008】Cash and deposits:
Marketable securities:
Investment securities:
Deferred tax assets:
Due to income before income taxes and the proceeds from the redemption at maturity of short-term financial products.
Due to the redemption at maturity of short-term financial products.
Due to the decrease in Deferred tax liabilities because of the decrease in fair value of investmentsecurities.
20082004 2005 2006 2007
Due to the decrease in fair value of investment securities mainly.
10 May 9, 2008
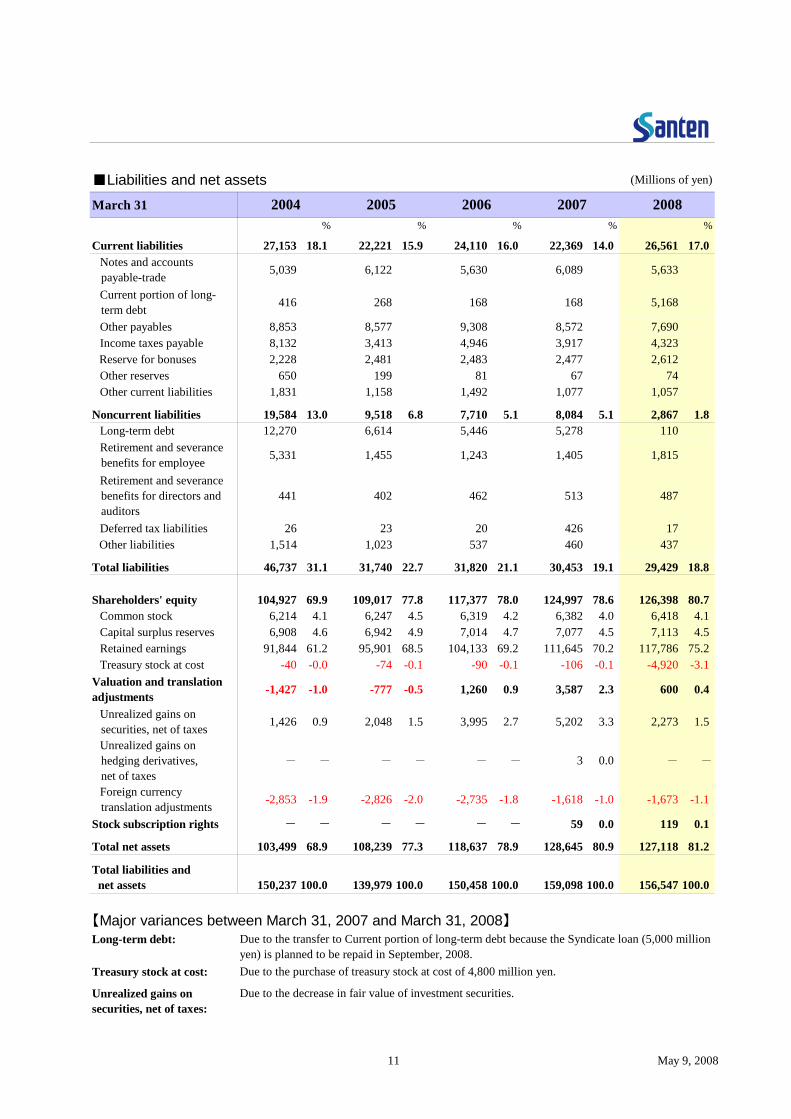
■Liabilities and net assets (Millions of yen)
March 31% % % % %
Current liabilities 27,153 18.1 22,221 15.9 24,110 16.0 22,369 14.0 26,561 17.0 Notes and accounts payable-trade 5,039 6,122 5,630 6,089 5,633
Current portion of long- term debt 416 268 168 168 5,168
Other payables 8,853 8,577 9,308 8,572 7,690 Income taxes payable 8,132 3,413 4,946 3,917 4,323 Reserve for bonuses 2,228 2,481 2,483 2,477 2,612 Other reserves 650 199 81 67 74 Other current liabilities 1,831 1,158 1,492 1,077 1,057
Noncurrent liabilities 19,584 13.0 9,518 6.8 7,710 5.1 8,084 5.1 2,867 1.8 Long-term debt 12,270 6,614 5,446 5,278 110 Retirement and severance benefits for employee 5,331 1,455 1,243 1,405 1,815
Retirement and severance benefits for directors and auditors
441 402 462 513 487
Deferred tax liabilities 26 23 20 426 17 Other liabilities 1,514 1,023 537 460 437
Total liabilities 46,737 31.1 31,740 22.7 31,820 21.1 30,453 19.1 29,429 18.8
Shareholders' equity 104,927 69.9 109,017 77.8 117,377 78.0 124,997 78.6 126,398 80.7 Common stock 6,214 4.1 6,247 4.5 6,319 4.2 6,382 4.0 6,418 4.1 Capital surplus reserves 6,908 4.6 6,942 4.9 7,014 4.7 7,077 4.5 7,113 4.5 Retained earnings 91,844 61.2 95,901 68.5 104,133 69.2 111,645 70.2 117,786 75.2 Treasury stock at cost -40 -0.0 -74 -0.1 -90 -0.1 -106 -0.1 -4,920 -3.1 Valuation and translationadjustments -1,427 -1.0 -777 -0.5 1,260 0.9 3,587 2.3 600 0.4
Unrealized gains on securities, net of taxes 1,426 0.9 2,048 1.5 3,995 2.7 5,202 3.3 2,273 1.5
Unrealized gains on hedging derivatives, net of taxes
- - - - - - 3 0.0 - -
Foreign currency translation adjustments -2,853 -1.9 -2,826 -2.0 -2,735 -1.8 -1,618 -1.0 -1,673 -1.1
Stock subscription rights - - - - - - 59 0.0 119 0.1
Total net assets 103,499 68.9 108,239 77.3 118,637 78.9 128,645 80.9 127,118 81.2
Total liabilities and net assets 150,237 100.0 139,979 100.0 150,458 100.0 159,098 100.0 156,547 100.0
【Major variances between March 31, 2007 and March 31, 2008】Long-term debt:
Treasury stock at cost:
Unrealized gains onsecurities, net of taxes:
Due to the transfer to Current portion of long-term debt because the Syndicate loan (5,000 millionyen) is planned to be repaid in September, 2008.Due to the purchase of treasury stock at cost of 4,800 million yen.
Due to the decrease in fair value of investment securities.
20082004 2005 2006 2007
11 May 9, 2008

(Millions of yen)
Year ended March 31 2004 2005 2006 2007 2008Ⅰ. Cash flows from operating activities:
Income before income taxes 13,774 18,436 20,341 21,039 20,482Depreciation and amortization 4,521 4,749 4,824 4,761 4,593Loss on impairment of fixed assets 376 823 909 - 316Increase/decrease in retirement and severance benefits 43 -2,550 -212 160 411Interest and dividend income -239 -249 -261 -459 -606Interest expense 365 182 93 90 96Increase/decrease in trade receivables -315 -3,082 1,407 -414 -586Increase/decrease in inventories 1,342 594 -18 -356 -1,005Increase/decrease in trade accounts payable -440 1,065 -495 400 -430Other, net 2,336 -2,178 625 -1,717 -561 Subtotal 21,764 17,791 27,215 23,504 22,710Interest and dividend income received 232 246 265 460 610Interest expense paid -328 -183 -95 -91 -94Income taxes paid -453 -11,235 -6,507 -8,914 -7,758Income taxes refunded 1,980 - - - -
Net cash provided by operating activities 23,196 6,619 20,878 14,959 15,468
Ⅱ. Cash flows from investing activities:
Increase in fixed deposits -622 -1,548 -803 -1,223 -1,518Decrease in fixed deposits 915 2,904 1,041 553 2,160Payments for acquisition of marketable securities -6,399 -4,499 - - -
Proceeds from sale of marketable securities 10,604 4,817 504 - 1,000Payments for acquisition of fixed assets -3,225 -4,906 -2,106 -3,555 -3,151Proceeds from sale of fixed assets 3,770 2,488 29 600 5Purchase of investment securities -510 -3,229 -57 -2,208 -3,266Proceeds from sale of investment securities 1,073 1,059 20 - 2,660Other, net -359 7 41 -13 27 Net cash provided by investing activities 5,246 -2,907 -1,330 -5,845 -2,083
Ⅲ. Cash flows from financing activities:
Proceeds from long-term debt 10,000 - - - -
Repayment of long-term debt -416 -5,804 -1,268 -168 -168Redemption of convertible bonds -19,945 - - - -
Purchase of treasury stock -3 -2,582 -15 -16 -4,815Dividends paid -1,758 -4,393 -4,759 -5,632 -6,505Other, net - 68 143 126 73 Net cash provided by financing activities -12,122 -12,711 -5,900 -5,691 -11,415
49 -42 75 313 -140
16,369 -9,042 13,723 3,736 1,82825,053 41,422 32,380 46,104 49,84141,422 32,380 46,104 49,841 51,669Ⅶ. Cash and cash equivalents at end of year
Ⅳ. Effect of exchange rate changes on cash and cash equivalentsⅤ. Net increase/decrease in cash and cash equivalentsⅥ. Cash and cash equivalents at beginning of year
12 May 9, 2008
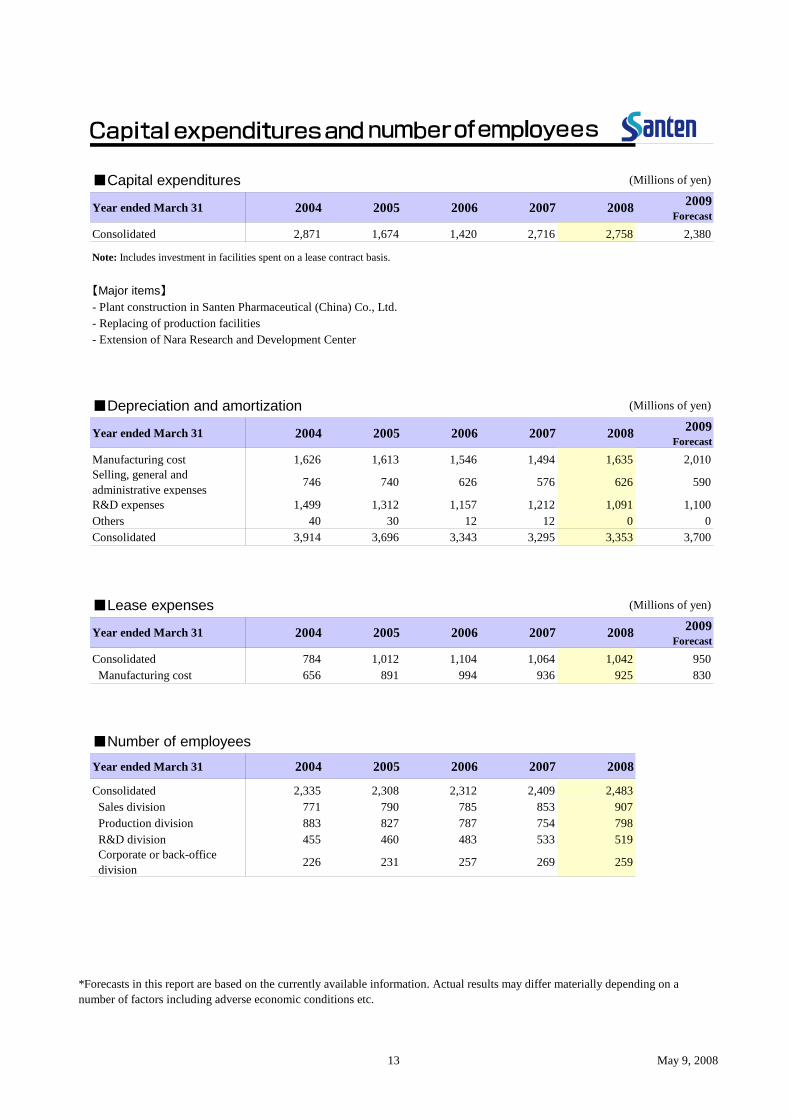
■Capital expenditures (Millions of yen)
Year ended March 31 2004 2005 2006 2007 2008 2009Forecast
Consolidated 2,871 1,674 1,420 2,716 2,758 2,380
Note: Includes investment in facilities spent on a lease contract basis.
【Major items】
- Plant construction in Santen Pharmaceutical (China) Co., Ltd.- Replacing of production facilities- Extension of Nara Research and Development Center
■Depreciation and amortization (Millions of yen)
Year ended March 31 2004 2005 2006 2007 2008 2009Forecast
Manufacturing cost 1,626 1,613 1,546 1,494 1,635 2,010Selling, general andadministrative expenses 746 740 626 576 626 590
R&D expenses 1,499 1,312 1,157 1,212 1,091 1,100Others 40 30 12 12 0 0Consolidated 3,914 3,696 3,343 3,295 3,353 3,700
■Lease expenses (Millions of yen)
Year ended March 31 2004 2005 2006 2007 2008 2009Forecast
Consolidated 784 1,012 1,104 1,064 1,042 950 Manufacturing cost 656 891 994 936 925 830
■Number of employeesYear ended March 31 2004 2005 2006 2007 2008
Consolidated 2,335 2,308 2,312 2,409 2,483 Sales division 771 790 785 853 907 Production division 883 827 787 754 798 R&D division 455 460 483 533 519 Corporate or back-office division 226 231 257 269 259
*Forecasts in this report are based on the currently available information. Actual results may differ materially depending on anumber of factors including adverse economic conditions etc.
13 May 9, 2008
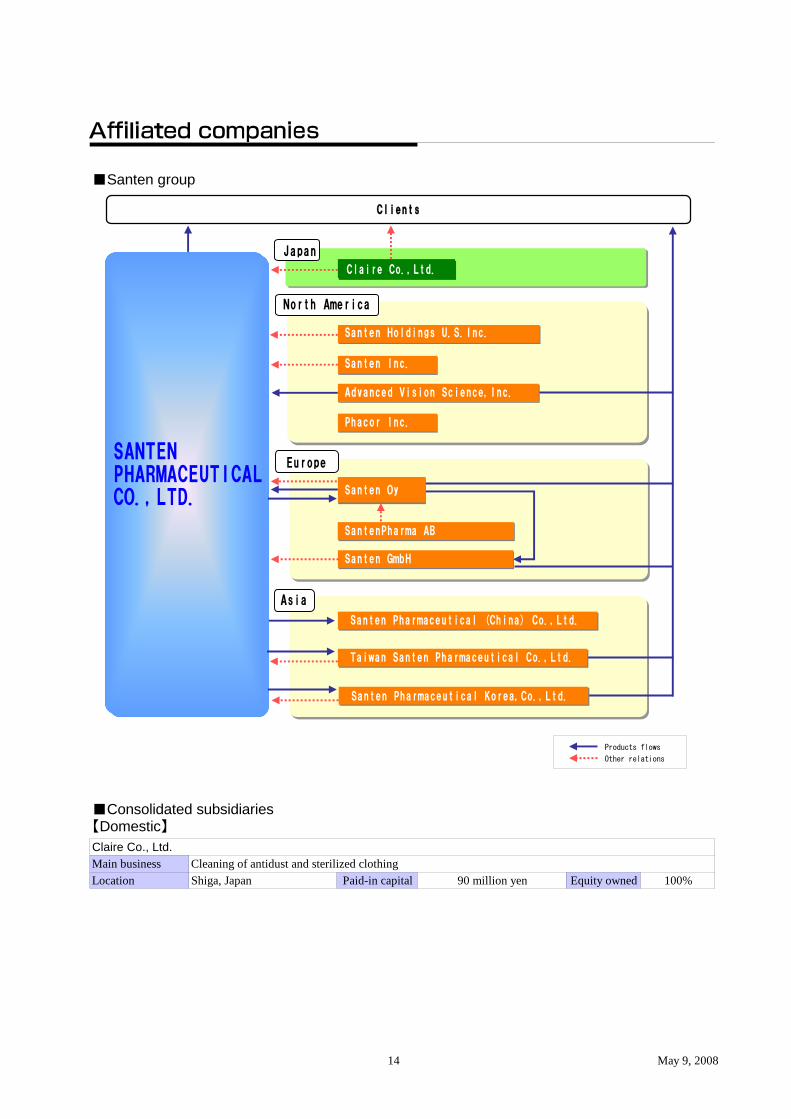
■Santen group
■Consolidated subsidiaries【Domestic】
Claire Co., Ltd.Main business Cleaning of antidust and sterilized clothingLocation Shiga, Japan Paid-in capital 90 million yen Equity owned 100%
Clients
SANTENPHARMACEUTICALCO.,LTD.
Santen Holdings U.S.Inc.
Santen Inc.
Advanced Vision Science,Inc.
Phacor Inc.
SantenPharma AB
Claire Co.,Ltd.
Santen Pharmaceutical (China) Co.,Ltd.
Taiwan Santen Pharmaceutical Co.,Ltd.
Santen Pharmaceutical Korea,Co.,Ltd.
Santen GmbH
Santen Oy
Products flows
Other relations
Japan
North America
Europe
Asia
14 May 9, 2008

【Overseas】
Santen Holdings U.S. Inc.Main business Holding company for North American businesses and business developmentLocation California, U.S.A. Paid-in capital 24,784 thousand US$ Equity owned 100%
Santen Inc.Main business Clinical development of pharmaceuticalsLocation California, U.S.A. Paid-in capital 8,765 thousand US$ Equity owned 100%*
Advanced Vision Science, Inc.Main business Research and development, production and marketing of medical devicesLocation California, U.S.A. Paid-in capital 10 thousand US$ Equity owned 100%*
Phacor Inc.Main business -
Location California, U.S.A. Paid-in capital 10 thousand US$ Equity owned 100%*
Santen OyMain business Development, production and marketing of pharmaceuticalsLocation Tampere, Finland Paid-in capital 20,000 thousand euros Equity owned 100%
SantenPharma ABMain business Marketing support of pharmaceuticalsLocation Stockholm, Sweden Paid-in capital 500 thousand S.KR Equity owned 100%
Santen GmbHMain business Marketing of pharmaceuticals and business developmentLocation Germaring, Germany Paid-in capital 25 thousand euros Equity owned 100%
Santen Pharmaceutical (China) Co., Ltd.Main business -
Location Suzhou, China Paid-in capital 2,300 million yen Equity owned 100%
Taiwan Santen Pharmaceutical Co., Ltd.Main business Import and marketing of pharmaceuticalsLocation Taipei, Taiwan Paid-in capital 42,000 thousand Taiwan dollars Equity owned 100%
Santen Pharmaceutical Korea, Co., Ltd.Main business Import and marketing of pharmaceuticalsLocation Seoul, Korea Paid-in capital 1,500,000 thousand won Equity owned 100%
* Indirect investment through Santen Holdings U.S. Inc.
15 May 9, 2008
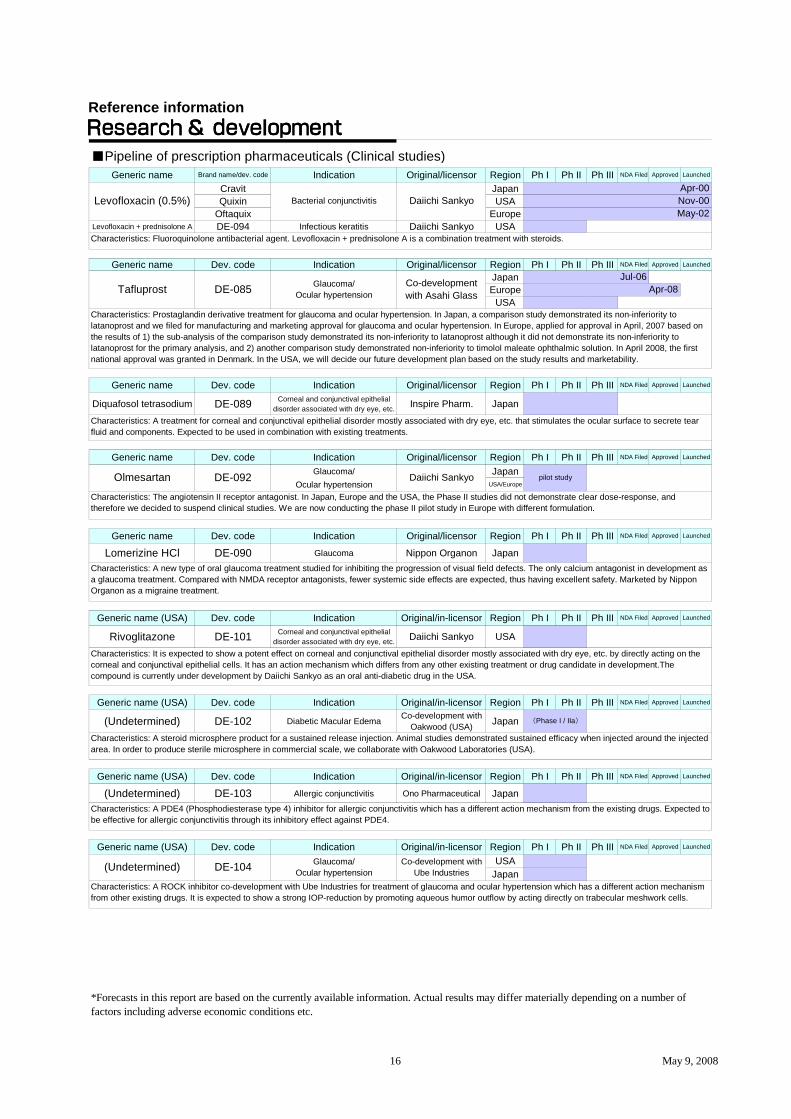
■Pipeline of prescription pharmaceuticals (Clinical studies)Generic name Brand name/dev. code Indication Original/licensor Region Ph I Ph II Ph III NDA Filed Approved Launched
Cravit JapanQuixin USA
Oftaquix EuropeLevofloxacin + prednisolone A DE-094 Infectious keratitis Daiichi Sankyo USA
Generic name Dev. code Indication Original/licensor Region Ph I Ph II Ph III NDA Filed Approved Launched
JapanEurope
USA
Generic name Dev. code Indication Original/licensor Region Ph I Ph II Ph III NDA Filed Approved Launched
Diquafosol tetrasodium DE-089 Corneal and conjunctival epithelialdisorder associated with dry eye, etc. Inspire Pharm. Japan
Generic name Dev. code Indication Original/licensor Region Ph I Ph II Ph III NDA Filed Approved Launched
Glaucoma/ JapanOcular hypertension USA/Europe
Generic name Dev. code Indication Original/licensor Region Ph I Ph II Ph III NDA Filed Approved Launched
Lomerizine HCl DE-090 Glaucoma Nippon Organon Japan
Generic name (USA) Dev. code Indication Original/in-licensor Region Ph I Ph II Ph III NDA Filed Approved Launched
Rivoglitazone DE-101 Corneal and conjunctival epithelialdisorder associated with dry eye, etc. Daiichi Sankyo USA
Generic name (USA) Dev. code Indication Original/in-licensor Region Ph I Ph II Ph III NDA Filed Approved Launched
(Undetermined) DE-102 Diabetic Macular Edema Co-development withOakwood (USA) Japan
Generic name (USA) Dev. code Indication Original/in-licensor Region Ph I Ph II Ph III NDA Filed Approved Launched
(Undetermined) DE-103 Allergic conjunctivitis Ono Pharmaceutical Japan
Generic name (USA) Dev. code Indication Original/in-licensor Region Ph I Ph II Ph III NDA Filed Approved Launched
USAJapan
*Forecasts in this report are based on the currently available information. Actual results may differ materially depending on a number offactors including adverse economic conditions etc.
(Undetermined) DE-104 Glaucoma/Ocular hypertension
Co-development withUbe Industries
Characteristics: A ROCK inhibitor co-development with Ube Industries for treatment of glaucoma and ocular hypertension which has a different action mechanismfrom other existing drugs. It is expected to show a strong IOP-reduction by promoting aqueous humor outflow by acting directly on trabecular meshwork cells.
Characteristics: It is expected to show a potent effect on corneal and conjunctival epithelial disorder mostly associated with dry eye, etc. by directly acting on thecorneal and conjunctival epithelial cells. It has an action mechanism which differs from any other existing treatment or drug candidate in development.Thecompound is currently under development by Daiichi Sankyo as an oral anti-diabetic drug in the USA.
Characteristics: A steroid microsphere product for a sustained release injection. Animal studies demonstrated sustained efficacy when injected around the injectedarea. In order to produce sterile microsphere in commercial scale, we collaborate with Oakwood Laboratories (USA).
(Phase I / IIa)
Characteristics: A PDE4 (Phosphodiesterase type 4) inhibitor for allergic conjunctivitis which has a different action mechanism from the existing drugs. Expected tobe effective for allergic conjunctivitis through its inhibitory effect against PDE4.
Characteristics: The angiotensin II receptor antagonist. In Japan, Europe and the USA, the Phase II studies did not demonstrate clear dose-response, andtherefore we decided to suspend clinical studies. We are now conducting the phase II pilot study in Europe with different formulation.
Characteristics: A treatment for corneal and conjunctival epithelial disorder mostly associated with dry eye, etc. that stimulates the ocular surface to secrete tearfluid and components. Expected to be used in combination with existing treatments.
Daiichi Sankyo pilot study
Characteristics: A new type of oral glaucoma treatment studied for inhibiting the progression of visual field defects. The only calcium antagonist in development asa glaucoma treatment. Compared with NMDA receptor antagonists, fewer systemic side effects are expected, thus having excellent safety. Marketed by NipponOrganon as a migraine treatment.
Tafluprost DE-085
Olmesartan DE-092
Characteristics: Prostaglandin derivative treatment for glaucoma and ocular hypertension. In Japan, a comparison study demonstrated its non-inferiority tolatanoprost and we filed for manufacturing and marketing approval for glaucoma and ocular hypertension. In Europe, applied for approval in April, 2007 based onthe results of 1) the sub-analysis of the comparison study demonstrated its non-inferiority to latanoprost although it did not demonstrate its non-inferiority tolatanoprost for the primary analysis, and 2) another comparison study demonstrated non-inferiority to timolol maleate ophthalmic solution. In April 2008, the firstnational approval was granted in Denmark. In the USA, we will decide our future development plan based on the study results and marketability.
Jul-06Glaucoma/
Ocular hypertensionCo-developmentwith Asahi Glass
Nov-00May-02
Characteristics: Fluoroquinolone antibacterial agent. Levofloxacin + prednisolone A is a combination treatment with steroids.
Daiichi SankyoBacterial conjunctivitisApr-00
Levofloxacin (0.5%)
Apr-08
Reference information
16 May 9, 2008

■Pipeline of prescription pharmaceuticals (In preparation for clinical trials)
Generic nameBucillamine
■License outDev. code Licensee Status
DE-098(Anti-APO-1 antibody) Argenes Phase I / IIa
■Changes from November 2, 2007[Progress]
Dev. code
DE-103
DE-104
[Discontinued study]Dev. code
DE-099
Glaucoma/Ocular hypertension Phase I to Phase II USA and Japan
Phase II
IndicationCorneal and conjunctival epithelial disorder
associated with dry eye, etc.
Clinical trial Region
Japan
Status before cancellation
Discontinued due to the unexpected need for large-scale clinical trials in the next phase, which would not be cost-effective.
Brand name Indication Original/in-licensor
Indication in-licensor
Rimatil Osteoarthritis (additional indication) Original
Rheumatoid arthritis
*Forecasts in this report are based on the currently available information. Actual results may differ materially depending on anumber of factors including adverse economic conditions etc.
Characteristics: Shown to be effective on joint inflammation caused by osteoarthritis.
Centocor
JapanPhase I to Phase II
Characteristics: Joint injection that induces apoptosis in diseased joints of rheumatoid arthritis patients. Bulk pharmaceuticalmanufacturing process for actual production scale has been established. Santen granted the domestic development rights toArgenes,Inc.The compound had been in-licensed from Centocor. In Japan and Europe, the clinical study has been started.Santen continues to hold the marketing rights in Japan and the overseas marketing and development rights.
Allergic conjunctivitis
Indication Status change Clinical trial, NDA filing, Launch Region
Reference information
17 May 9, 2008

■Revision of National Health Insurance (NHI) drug prices (%)
1996 1997 1998 1999 2000 2001 2002 2003 2004 2005 2006 2007 2008Industry average -6.8 -4.4 -9.7 - -7.0 - -6.3 - -4.2 - -6.7 - early -5%Ophthalmic drugs -3.5 -1.8 -7.5 - -6.2 - -6.0 - -2.7 - -5.5 - late -3%Santen -2.6 -1.3 -7.2 - -5.7 - -6.0 - -3.2 - -5.3 - mid -3%
(Compiled by Santen)Revision of NHI drug prices:
■Major healthcare reforms1997 Enforcement of the Revised Health Insurance System Law
Increased contribution for insured employees (10% to 20%)Revision of the Insurance Law for Seniors
2001 Revision of the Insurance Law for SeniorsContribution: fixed rate of 10% for out-patients and in-patients
April 2002 Reimbursed consulting fee for physicians were reduced by 2.7% on average
October 2002
April 2003 Increased contribution for insured employees (20% to 30%)
April 2006
October 2006
April 2008 Change in prescription format in order to promote usage of generic drugs (the prescribing doctor'ssignature and seal are required in case the use of a generic drug is not recommended).Revised dispensing fee (basic dispensing fee was decreased from 42 points to 40 points; however, 4points will be added in cases where 30% of total prescription drugs dispensed by a pharmacy aregeneric drugs.)Revised medical fee (ophthalmic drugs, eye wash, monoculus will be included in basic medicalfee).Unifying "medical insurance for patients over 75 years old" into "medical insurance system for latestage elderly population (long-life medical insurance system)."
Increased contribution for seniors (from the age of 70) who have a certain amount of income (20%to 30%)
Revision of the prescription form from the standpoint of attempting environmental considerations ofthe generic use promotion
In Japan, drug prices are generally revised every two years to reflect their market price. The drugsmarketed at lower market prices will bear larger reduction margins at the revision.
Contribution: 500 yen/day for out-patients (up to four times a month) and 1,000 yen/day for in-patients
Revision of prescription fee (two points are added for every prescription of generic drugs)
Increased contribution for seniors (fixed amount system was abolished for a uniform fixed ratesystem of 10% contribution)
18 May 9, 2008

■Market shares (Billions of yen)
Year ended March 31 2004 2005 2006 2007 2008Prescription ophthalmics 39.0% 39.6% 40.9% 39.7% 38.9%
194.7 207.7 213.1 214.4 221.0Anti-rheumatic drugs 42.5% 42.9% 45.2% 46.3% 46.1%
22.2 23.3 23.8 23.2 24.1
Notes: - On an NHI drug price basis. Copyright IMS Japan KK, 2008 - Lower figures indicate market size. Source: Santen analysis based on IMS data(JPM) - Anti-rheumatic drugs exclude immunosuppressants Period: 2003.4-2008.3; Unauthorized copy prohibited and biologic agents.
■Market shares by therapeutic area - prescription ophthalmics (Billions of yen)
Year ended March 31 2004 2005 2006 2007 2008Anti-glaucoma 16.7% 20.0% 23.2% 22.1% 20.8%
71.7 74.9 79.0 79.9 83.1Anti-infective 81.0% 80.3% 78.3% 76.1% 73.5%
26.9 26.5 26.7 25.9 25.6Anti-allergy 20.7% 22.4% 24.8% 24.3% 22.7%
20.8 28.4 24.6 24.7 25.4Agents for surgeries 39.1% 41.0% 42.6% 42.8% 43.0%
14.5 13.6 14.4 14.1 15.1Corneal disease treatments 82.4% 81.0% 80.7% 79.3% 78.7%
21.0 23.0 25.5 26.4 28.8Anti-cataract 55.4% 57.4% 60.3% 62.6% 66.2%
7.1 6.8 6.5 6.3 6.1Corticosteroids 51.6% 52.8% 52.6% 51.4% 51.3%
10.9 11.5 11.2 10.8 10.6Notes: - On an NHI drug price basis. Copyright IMS Japan KK, 2008 - Lower figures indicate market size. Source: Santen analysis based on IMS data(JPM)
Period: 2003.4-2008.3; Unauthorized copy prohibited
19 May 9, 2008

■Stock price (Osaka Securities Exchange 1st market) (Yen and thousand shares)
Apr-07 May-07 Jun-07 Jul-07 Aug-07 Sep-07 Oct-07 Nov-07 Dec-07 Jan-08 Feb-08 Mar-08Stock price: Open 3,070 3,300 3,070 3,010 2,740 2,890 2,880 2,700 2,680 2,705 2,800 2,590 High 3,390 3,300 3,140 3,050 2,930 2,950 2,980 2,880 2,860 2,945 2,860 2,615 Low 3,010 2,990 2,925 2,805 2,600 2,725 2,680 2,480 2,655 2,570 2,590 2,140 End of month 3,280 3,070 3,000 2,805 2,870 2,875 2,700 2,715 2,765 2,825 2,660 2,325Volume 4,855 4,081 4,567 3,135 5,161 3,621 4,339 5,471 3,827 6,859 6,027 5,805
■Major shareholders As of March 31, 2008
Name
■Stock option2004 2005 2006 2007 2008
Stock option balance (thousand shares) 472.6 504.3 541 569.6 627.562 35 27 24 2466 66 57.3 48 3760 60 58 48.2 46.255 55 42.6 38.6 38.692 72.5 53.7 32.1 30.9
137.6 137.6 95 72.9 55.2- 78.2 78.2 73.9 66.1- - 129.2 129.2 127.5- - - 102.7 102.7- - - - 99.3
■Purchase of Treasury stock2004 2005 2006 2007 2008
A purchased amount of money (millions of yen) - 2,569 - - 4,800The number of the purchased stocks (thousand shares) - 1,351 - - 1,833
Mitsubishi UFJ Trust and Banking Corporation
3.53.13.12.2
5.14.94.63.6
Percentage ofinvestment
%8.15.5
Year ended March 31
4,420
2,668
3,151Northern Trust CO. (AVFC) Sub-account American ClientsNippon Life Insurance CompanyTrust & Custody Services Bank, Ltd.The Silchester International Investors International Value Equity TrustTokio Marine & Nichido Fire Insurance Co., Ltd.
Mita Sangyo Co., Ltd.Japan Trustee Services Bank, Ltd.
The Master Trust Bank of Japan, Ltd.The Bank of Tokyo-Mitsubishi UFJ, Ltd.
Number ofshares heldThousand shares
7,0274,756
3,002
1,907
2,736
Granted in June 2006 - 102.7 thousand shares at 2,715 yen/share Granted in June 2007 - 99.3 thousand shares at 3,050 yen/share
4,2413,972
Granted in June 1998 - 106 thousand shares at 1,540 yen/share Granted in June 1999 - 66 thousand shares at 2,480 yen/share Granted in June 2000 - 60 thousand shares at 2,705 yen/share Granted in June 2001 - 55 thousand shares at 2,299 yen/share Granted in June 2002 - 92 thousand shares at 1,326 yen/share Granted in June 2003 - 137.6 thousand shares at 1,176 yen/share Granted in June 2004 - 78.2 thousand shares at 1,743 yen/share Granted in June 2005 - 129.2 thousand shares at 2,480 yen/share
Stock price and volume
2,100
2,300
2,500
2,700
2,900
3,100
3,300
3,500
0
5,000
10,000
Apr-07 May-07 Jun-07 Jul-07 Aug-07 Sep-07 Oct-07 Nov-07 Dec-07 Jan-08 Feb-08 Mar-08
20 May 9, 2008

■Breakdown of shareholding by number of sharesYear ended March 31
Thousand Propor- Thousand Propor- Thousand Propor- Thousand Propor- Thousand Propor-shares tion (%) shares tion (%) shares tion (%) shares tion (%) shares tion (%)
Financial institutions 30,740 34.9 28,423 32.8 29,514 34.0 30,366 35.0 33,186 38.2 City & regional banks 5,428 6.2 4,636 5.3 4,659 5.4 4,628 5.3 4,907 5.6 Trust banks 16,201 18.4 15,768 18.2 16,577 19.1 17,049 19.6 19,133 22.0 (concerned in trust works) 13,422 13,022 14,039 14,538 16,680 Life and non-life insurance 9,007 10.2 7,973 9.2 8,004 9.2 8,470 9.8 8,924 10.3 Other financial institutions 103 0.1 45 0.1 274 0.3 217 0.3 221 0.3
Securities firms 368 0.4 346 0.4 865 1.0 1,486 1.7 585 0.7Other institutions 10,512 12.0 11,788 13.6 11,823 13.6 12,375 14.2 13,014 15.0Foreign investors 31,306 35.6 32,874 38.0 31,519 36.3 31,024 35.7 25,227 29.0Individual investors 15,001 17.1 13,187 15.2 12,985 15.0 11,521 13.3 12,963 14.9Treasury stock 33 0.0 39 0.0 45 0.1 50 0.1 1,888 2.2Total 87,963 100.0 86,658 100.0 86,751 100.0 86,825 100.0 86,866 100.0
■Breakdown of shareholding by number of shareholders
Year ended March 31Number of Propor- Number of Propor- Number of Propor- Number of Propor- Number of Propor-
shareholders tion (%) shareholders tion (%) shareholders tion (%) shareholders tion (%) shareholders tion (%)
Financial institutions 83 1.0 91 1.1 107 0.8 88 0.9 88 0.6 City & regional banks 7 0.1 9 0.1 10 0.1 7 0.1 14 0.1 Trust banks 46 0.6 47 0.6 52 0.4 44 0.4 30 0.2 Life and non-life insurance 27 0.3 31 0.4 32 0.2 26 0.3 29 0.2 Other financial institutions 3 0.0 4 0.0 13 0.1 11 0.1 15 0.1
Securities firms 28 0.4 28 0.3 31 0.2 37 0.4 38 0.3Other institutions 130 1.7 128 1.5 236 1.7 133 1.3 150 1.2Foreign investors 122 1.5 172 2.0 255 1.9 306 3.0 268 2.1Individual investors 7,498 95.4 8,089 95.1 12,927 95.4 9,451 94.4 12,568 95.8Treasury stock 1 0.0 1 0.0 1 0.0 1 0.0 1 0.0Total 7,862 100.0 8,509 100.0 13,557 100.0 10,016 100.0 13,113 100.0
2004 2005 2006
2004 2005 2006
2007 2008
2007 2008
Breakdown of shareholding by number ofshares (as of March 2008)
Securitiesfirms 0.7%
Otherinstitutions
15.0%
Foreigninvestors
29.0%
Individualinvestors
14.9%
Treasurystock 2.2% Financial
institutions38.2%
Breakdown of shareholding by number ofshareholders (as of March 2008)
Otherinstitutions
1.2%
Foreigninvestors
2.1%
Individualinvestors
95.8%Treasury
stock 0.0%
Financialinstitutions
0.6%
Securitiesfirms 0.3%
21 May 9, 2008

News releases during April 2007-March 2008
(Date) (Summary)2007
2-Apr Santen to open its Shenyang Representative Office
3-Apr
9-Apr Santen to launch OTC Eye Drop Sante Uruoi Contact a
8-May Introduction of Countermeasures to Large-scale Purchases of the Corporation's Shares (Takeover Defense Measures)
10-May Santen to Issue Stock Acquisition Rights to the DirectorsSanten to Issue Stock Acquisition Rights to the Corporate Officers
22-May Extension of Nara Research and Development CenterSanten's Board of Directors on May 22, 2007 determined that Santen would invest more in itslaboratories at the Nara Research and Development Center (Ikoma City, Nara). Through theadditional investment in R&D center, a Pharmaceutical development building and an Ancillarybuilding will be constructed in order to integrate non-clinical functions and to secure space for R&Dstaff increase. This will enhance the changes to generate new drug candidates.
For details, please refer to our Web site (http://www.santen.co.jp/en/).
Santen opened its Shenyang Representative Office in China on April 1, 2007. The new Shenyangoffice will serve the Northeastern China centering on Shenyang, enabling Santen to distribute its druginformation and gather information on the medical needs accurately and timely in this region.
Santen Oy, a wholly owned subsidiary in Finland, Tampere, submitted the marketing authorizationapplication for glaucoma and ocular hypertension treatment DE-085 (INN: Tafluprost) to 13countries in Europe on April 2, 2007 (Europe time). DE-085 is a prostaglandin drug candidate beingstudied for the reduction of intraocular pressure in primary open angle glaucoma and ocularhypertension.
Santen launched an artificial teat type OTC eye drop Sante Uruoi Contact a on April 9, 2007. SanteUruoi Contact a moistens your contact lenses and relieves dryness and discomfort caused by contactlenses. Both increasing the moistness of the eyes, and being mild to the eyes are high needs amongusers.
Santen's Board of Directors on May 8, 2007 determined the specific content of the Countermeasuresto Large-scale Purchases of the Corporation's Shares (Takeover Defense Measures). The content wasapproved at the 95th Annual General Meeting of Shareholders held on June 26, 2007.
Santen's Board of Directors on May 8, 2007 adopted a resolution to issue rights to subscribe for newshares as stock options without consideration to Santen directors and corporate officers. Theresolution was approved at the 95th Annual General Meeting of Shareholders held on June 26, 2007.
Santen Oy submits Marketing Approval for Glaucoma and Ocular HypertensionDrug Candidate DE-085 (INN: Tafluprost)
22 May 9, 2008

(Date) (Summary)2007
2-Oct Santen to Redesign Sante de U Plus E Alfa Package
2-Nov
200811-Jan Santen to Launch Nutritional Supplement Sante Lutax
30-Jan Santen to Purchase Own Shares
25-Feb Santen to Lift Condition for Approval of PAPILOCK Mini Ophthalmic Solution 0.1%
26-Mar Notice Regarding the Completion of Purchase of the Company’s Own Shares in the Market
Santen launched an over-the-counter eye drop Sante de U plus E alfa with a new package design onOctober 10, 2007. Sante de U plus E alfa relieves eyestrain and improves blurred vision and focusadjustment by facilitating the flow of blood and supporting nutrition. Sante de U plus E alfa is also effectivein itchy eye and inflammation.
R-Tech Ueno, Ltd. (Chiyoda-ku, Tokyo, Japan) and Santen Pharmaceutical Co., Ltd. (Osaka, Japan) havereached a basic agreement to extend the exclusive marketing rights in Japan for RESCULA® Eye Drops(generic name: isopropyl unoprostone). Since the current contract is to expire in September, 2008, thecompanies were pursuing negotiations on the contract renewal and reached the basic agreement today.Accordingly, Santen continues to hold the exclusive marketing rights in Japan for RESCULA® beyondOctober 2008.
Santen Pharmaceutical Co., Ltd. launched nutritional supplement Sante Lutax 20 and Sante Lutax 15 plusvitamin & mineral for the Japanese market. Sante Lutax is developed based on the research of Japanesedietary life and it aims to support doctor’s dietary instruction to their patients.
Agreement Concerning Glaucoma and Ocular Hypertension Treatment RESCULA®Eye Drops
Santen's Board of Directors on January 30, 2008 adopted a resolution to purchase own shares up to1,850,000 shares and 5,000,000,000 yen.
Santen Pharmaceutical Co., Ltd. have announced that the conditions for the approval of vernalkeratoconjunctivitis treatment PAPILOCK Mini ophthalmic solution 0.1% (generic name: ciclosporin) hasbeen lifted. This was reported by the First Committee on New Drugs, the Pharmaceutical Affairs and FoodSanitation Council, the Ministry of Health, and Labor & Welfare on February 22, 2008.
The stock acquisition, decided at the Board of Directors meeting held on January 30, 2008, has beencompleted through the buy back of 1,833,800 shares and its cost of 4,800,509,500 yen.
23 May 9, 2008


