33
Full Stack Visibility with Kubernetes in 15 Minutes Mike Moore. Datadog Enterprise Solutions Engineer.
Full Stack Visibility with Kubernetes in 15 Minutes
Mike Moore. Datadog Enterprise Solutions Engineer.
Why do they call it K8s!?
Trivia

Kubernetes with DatadogA look from 50,000 feet
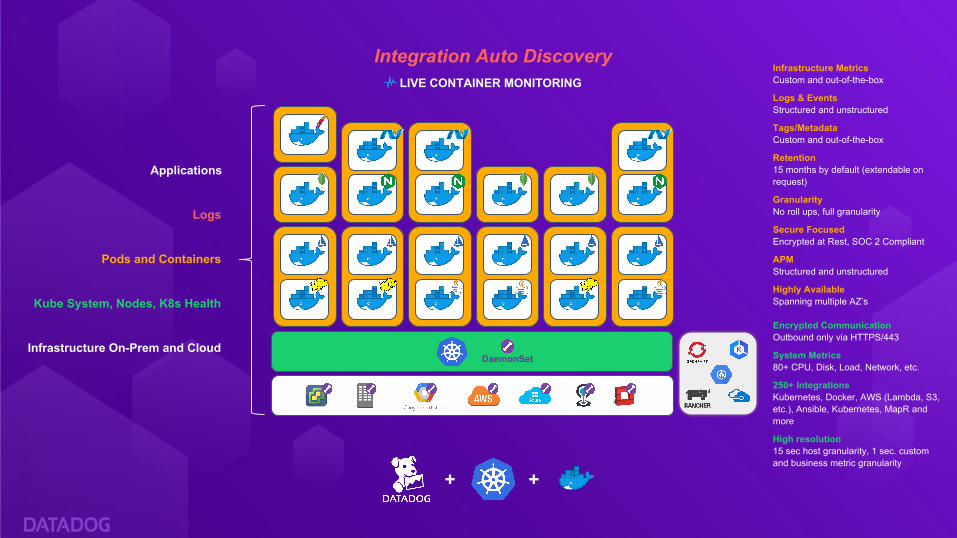
Infrastructure MetricsCustom and out-of-the-box
Logs & EventsStructured and unstructured
Tags/MetadataCustom and out-of-the-box
Retention15 months by default (extendable on request)
GranularityNo roll ups, full granularity
Secure FocusedEncrypted at Rest, SOC 2 Compliant
APMStructured and unstructured
Highly AvailableSpanning multiple AZ’s
Encrypted CommunicationOutbound only via HTTPS/443
System Metrics80+ CPU, Disk, Load, Network, etc.
250+ IntegrationsKubernetes, Docker, AWS (Lambda, S3, etc.), Ansible, Kubernetes, MapR and more
High resolution15 sec host granularity, 1 sec. custom and business metric granularity
Kube System, Nodes, K8s Health
Infrastructure On-Prem and Cloud
Pods and Containers
Logs
Applications
+ +
Integration Auto DiscoveryLIVE CONTAINER MONITORING
DaemonSet

Deploying Datadog in K8s Let’s start with the basics
+ +

Deployment Options
Host Based
• Additional Visibility
• Monitor Outside of K8s
• More Granular Configuration
• No Auto-Deployment without Config Management
Container Based
• Deploy as a DaemonSet
• Simplified Management
• Deploy Quickly Everywhere
• Easier to Deploy and Configure
https://docs.datadoghq.com/agent/kubernetes/host_setup/

Tagging and Other Best Practices Making sense out of all of this data

Good Tagging Practices
What Should You Tag?
Applications
Services
Components
Teams
Departments
Cost Centers
Why It Matters:
If we can’t see or alert on what we want when we need to then monitoring anything has little point!
Roles
Customers
Business Units
Stores
Regions
etc...

Where should we tag? And what tags do we already get?
DaemonSet
Infrastructure
Kube System, Nodes, K8s Health
Pods and Containers
Datadog Agent
Docker Labels
Pod Annotations
Consul
etcd

Kubernetes State Metrics
What are these?
kube-state-metrics is a simple service that listens to the Kubernetes API server and generates metrics about the state of the objects.
It is not focused on the health of the individual Kubernetes components, but rather on the health of the various objects inside, such as deployments, nodes and pods.
How do I get them?1. Download the Kube-State manifests folder
from GitHub:
https://github.com/kubernetes/kube-state-metri
cs/tree/master/kubernetes
2. Apply them to your Kubernetes cluster:
kubectl apply -f <KUBE_STATE_FOLDER>.
https://docs.datadoghq.com/agent/kubernetes/host_setup/
Building on the Basics Going further with Integrations, Logs, and APM

Integrations in K8s. Getting Into the Middleware.

Two Approaches to Integration
Mount a Local Directory
• Must deploy configuration to every node
• Have to manage configurations and track changes across nodes
• Config management can ease deployment.
Use Config Maps
• Manage configurations in Kubernetes configs
• Easy to track configurations
• Change configurations quickly and across-the cluster
https://docs.datadoghq.com/agent/kubernetes/integrations/
Live Container Monitoring. Monitoring Is All About Good Process.
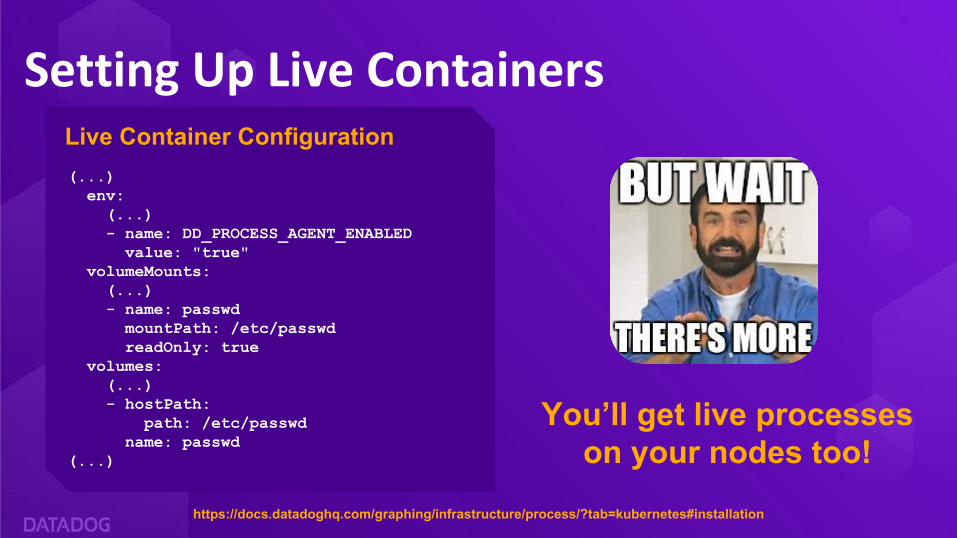
Setting Up Live Containers
(...) env: (...) - name: DD_PROCESS_AGENT_ENABLED value: "true" volumeMounts: (...) - name: passwd mountPath: /etc/passwd readOnly: true volumes: (...) - hostPath: path: /etc/passwd name: passwd (...)
Live Container Configuration
You’ll get live processes on your nodes too!
https://docs.datadoghq.com/graphing/infrastructure/process/?tab=kubernetes#installation

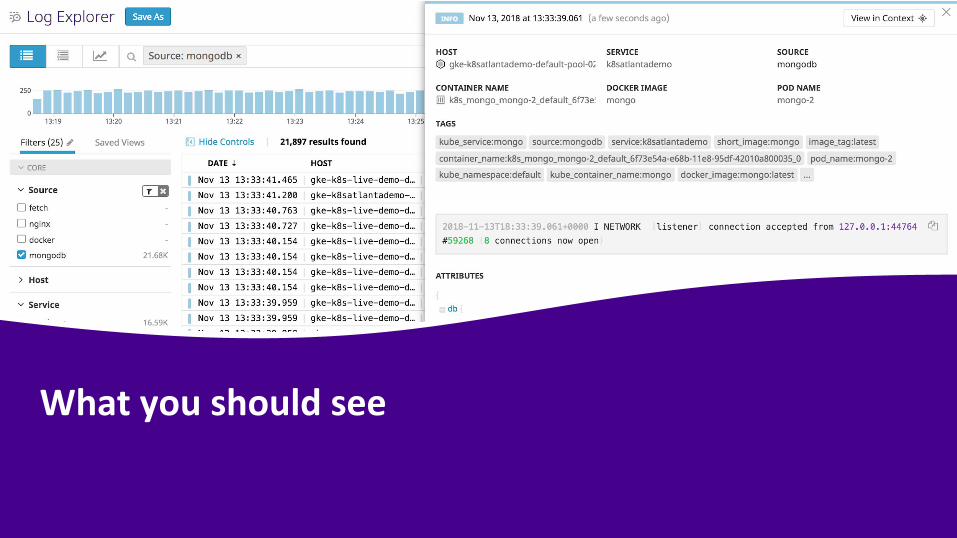
What you should see.

Logs in K8s. All Your Logs Are Belong To Us.

Setting Up Log Collection
(...) env: (...) - name: DD_LOGS_ENABLED value: "true" - name: DD_LOGS_CONFIG_CONTAINER_COLLECT_ALL value: "true"(...)
Basic Logs Configuration
(...) volumeMounts: (...) - name: pointerdir mountPath: /opt/datadog-agent/run (...) volumes: (...) - hostPath: path: /opt/datadog-agent/run name: pointerdir (...)
Tracking Our Read Location
https://docs.datadoghq.com/agent/kubernetes/daemonset_setup/#log-collection
What you should see

APM in K8s. Getting Down To The Code.
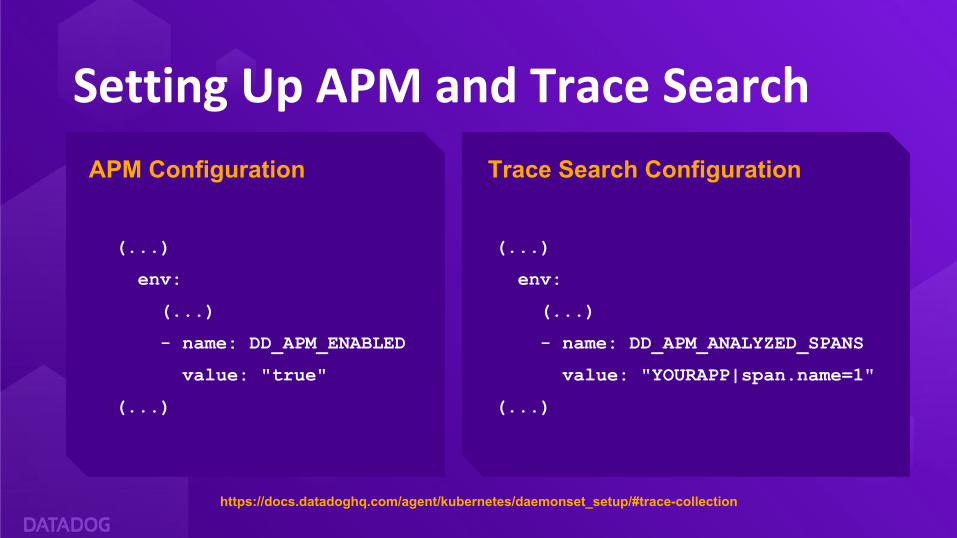
Setting Up APM and Trace Search
(...)
env:
(...)
- name: DD_APM_ENABLED
value: "true"
(...)
APM Configuration
(...)
env:
(...)
- name: DD_APM_ANALYZED_SPANS
value: "YOURAPP|span.name=1"
(...)
Trace Search Configuration
https://docs.datadoghq.com/agent/kubernetes/daemonset_setup/#trace-collection

What you should see.

Auto Discovery. Monitor Anything and Everything.
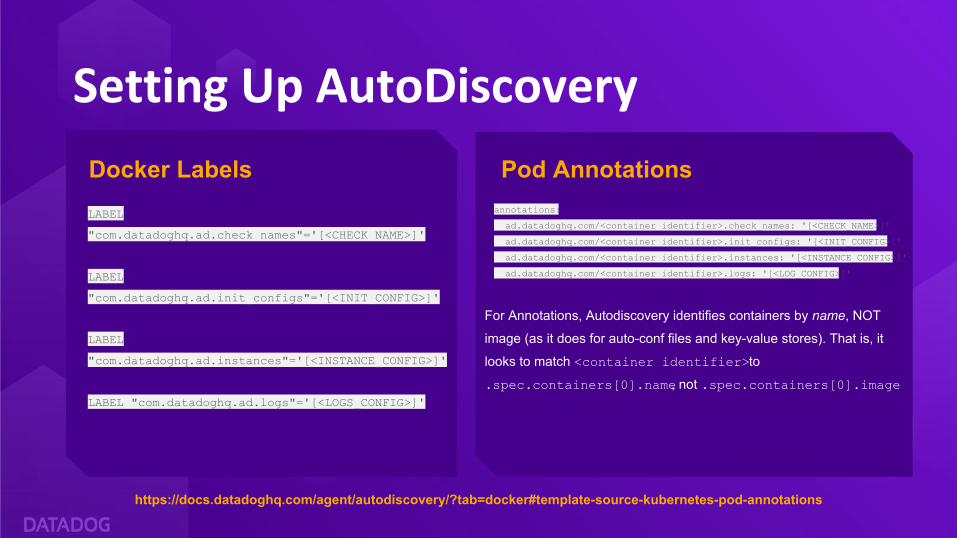
Setting Up AutoDiscovery
LABEL
"com.datadoghq.ad.check_names"='[<CHECK_NAME>]'
LABEL
"com.datadoghq.ad.init_configs"='[<INIT_CONFIG>]'
LABEL
"com.datadoghq.ad.instances"='[<INSTANCE_CONFIG>]'
LABEL "com.datadoghq.ad.logs"='[<LOGS_CONFIG>]'
Docker Labelsannotations:
ad.datadoghq.com/<container identifier>.check_names: '[<CHECK_NAME>]'
ad.datadoghq.com/<container identifier>.init_configs: '[<INIT_CONFIG>]'
ad.datadoghq.com/<container identifier>.instances: '[<INSTANCE_CONFIG>]'
ad.datadoghq.com/<container identifier>.logs: '[<LOG_CONFIG>]'
For Annotations, Autodiscovery identifies containers by name, NOT
image (as it does for auto-conf files and key-value stores). That is, it
looks to match <container identifier> to
.spec.containers[0].name, not .spec.containers[0].image
Pod Annotations
https://docs.datadoghq.com/agent/autodiscovery/?tab=docker#template-source-kubernetes-pod-annotations
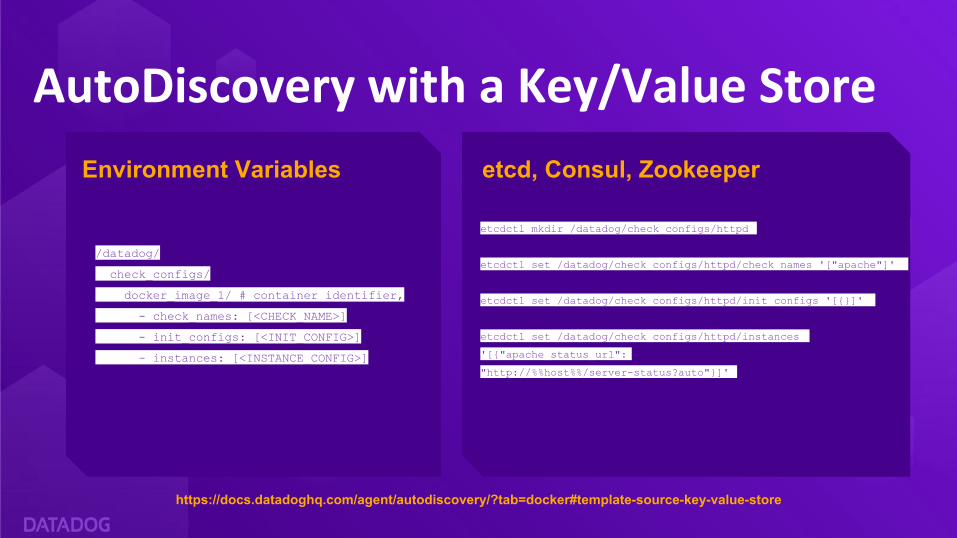
AutoDiscovery with a Key/Value Store
/datadog/
check_configs/
docker_image_1/ # container identifier,
- check_names: [<CHECK_NAME>]
- init_configs: [<INIT_CONFIG>]
- instances: [<INSTANCE_CONFIG>]
etcdctl mkdir /datadog/check_configs/httpd
etcdctl set /datadog/check_configs/httpd/check_names '["apache"]'
etcdctl set /datadog/check_configs/httpd/init_configs '[{}]'
etcdctl set /datadog/check_configs/httpd/instances
'[{"apache_status_url":
"http://%%host%%/server-status?auto"}]'
etcd, Consul, ZookeeperEnvironment Variables
https://docs.datadoghq.com/agent/autodiscovery/?tab=docker#template-source-key-value-store

Demo Time. Let’s see what this looks like in the wild....

Going further...Advanced scaling and K8s cluster monitoring with Datadog

Datadog Cluster Agent. Scaling up to thousands of nodes gracefully....
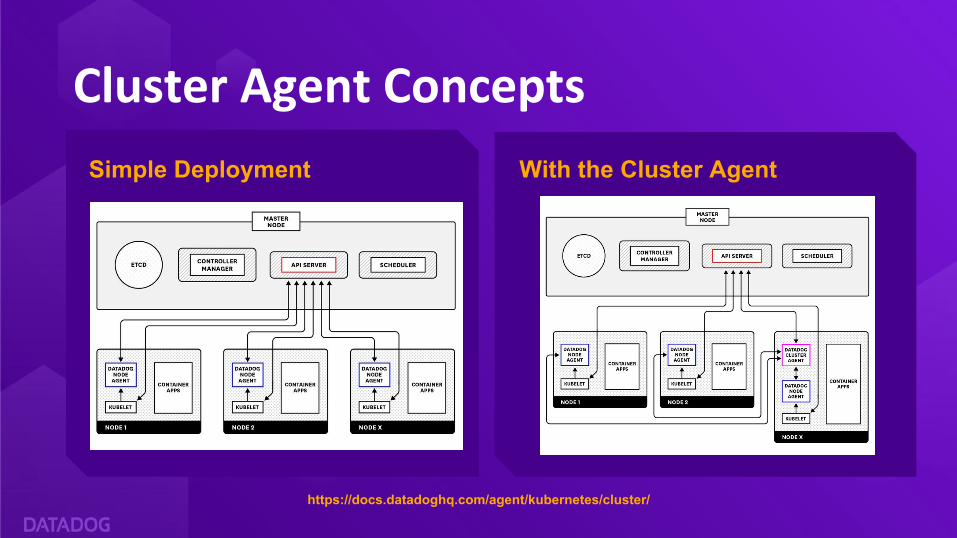
Cluster Agent Concepts
Simple Deployment With the Cluster Agent
https://docs.datadoghq.com/agent/kubernetes/cluster/
Autoscale With Any Metric. Whatever… I’ll scale how I want!.
Set Up Horizontal Pod Scaling
https://www.datadoghq.com/blog/autoscale-kubernetes-datadog/
Use the Datadog Cluster Agent as an External Metrics Provider!
Scale your services using any Datadog metric...

Questions?.
Thank you!Mike [email protected]
@themsquaredwebofmike.com themsquared
Find this presentation and related code at: https://dtdg.co/ddk8s


