110
ProgressBook DataMap User Guide
ProgressBook DataMap User Guide

© 2017 Software Answers, Inc. All Rights Reserved. All other company and product names included in this material may be Trademarks, Registered Trademarks or Service Marks of the companies with which they are associated. Software Answers, Inc. reserves the right at any time and without notice to change these materials or any of the functions, features or specifications of any of the software described herein.
ProgressBook DataMap User Guide(This document is current for v16.3.0 or later.)
Software Answers, Inc. www.progressbook.com6770 Snowville Rd., Suite 200 www.software-answers.comBrecksville, Ohio 44141

Change Log
The following Change Log explains by Product Version, Heading, Page, and Reason where changes in the ProgressBook DataMap User Guide have been made.
ProductVersion
Heading Page Reason
16.3.0 “Graduation Points” 97 Added section.
16.2.1 “Access Student Roadmap” 15 Updated screen shots to reflect addition of Guardians to the Demographics area.
16.1.3 “Edit an Intervention” 26 Updated text and screen shots to reflect addition of Print button and Print screen.
16.1.3 “Compare Assessment Scores” 55 Updated screen shots to reflect the updated user interface.
16.1.0 “Access DataMap” 2 Updated screen shot to reflect addition of INFOhio - PreK-12 Digital Library link to the Testing Resources area.
16.1.0 “Access Student Roadmap” 15 Updated screen shot to reflect addition of the student’s Building to the Student Roadmap.
16.1.0 “Review Data Points History” 21 Updated text and screen shots to show that you can select more than one subject in the Subject drop-down list.
16.1.0 “Add an Intervention” 28 Updated procedure to add student interventions, and updated screen shots to reflect the new user interface.
16.1.0 “Compare Assessment Scores” 55 Updated screen shots to show graph updates for teachers in multiple buildings, and to reflect the new user interface.
16.0.0 Entire Guide N/A Updated screen shots to reflect new user interface.
16.0.0 “View Student IEP” 17 Added section.
16.0.0 “Review State Assessment History”
20 Updated text and screen shot to indicate that when you review assessment scores, you can view scores for multiple subjects at the same time.
16.0.0 “Interventions” 23 Updated Intervention Form screen shots to show the new Attachments button and count, as well as the new rich text menu option that lets you insert a table into a text box.
16.0.0 “Add an Intervention” 28 Added notes to explain when the new Attachments button displays; each note includes a cross-reference to the new Add and Manage Intervention Attachments topic.
16.0.0 “Add and Manage Intervention Attachments”
34 Added section.
16.0.0 “Analyze Multiple Measures of Student Data”
59 Updated screen shot and text to include State Placement Levels, State Scaled Score, and Attendance as additional filter options. Added note about new English\Reading\Writing option in the Subject drop-down list.
ProgressBook DataMap User Guide i

Change Log
This page intentionally left blank.
ii ProgressBook DataMap User Guide
Table of Contents
Change Log i
Welcome to DataMap 1
Find the Information You Need.................................................................................... 1
Access DataMap......................................................................................................... 2
Sign In to DataMap ............................................................................................... 2
Sign Out of DataMap............................................................................................. 3
Navigate DataMap ...................................................................................................... 4
Understand the Banner ......................................................................................... 4
Navigate to Other Screens.................................................................................... 5
Follow Breadcrumbs ............................................................................................. 6
Change Districts.................................................................................................... 6
Change School Year ............................................................................................. 6
Use DataMap Help...................................................................................................... 7
Navigate ProgressBook .............................................................................................. 7
Search DataMap 9
Search by Student....................................................................................................... 9
Search by Intervention ...............................................................................................11
Search by Assessment.............................................................................................. 13
Student Roadmap 15
Access Student Roadmap......................................................................................... 15
Map Student Address................................................................................................ 16
View Student IEP ...................................................................................................... 17
Review Interventions for a Student ........................................................................... 17
Review Attendance for a Student.............................................................................. 18
Review School Year Summary.................................................................................. 18
Review State Assessment History ............................................................................ 20
Review Data Points History....................................................................................... 21
Interventions 23
View Students with Interventions .............................................................................. 23
View an Intervention.................................................................................................. 25
View an Intervention from the Interventions Screen............................................ 25
ProgressBook DataMap User Guide iii
View an Intervention from the Student Roadmap Screen....................................26
Edit an Intervention ....................................................................................................26
Edit an Intervention from the Interventions Screen..............................................27
Edit an Intervention from the Student Roadmap Screen .....................................28
Add an Intervention....................................................................................................28
Add an Intervention from the Interventions Screen..............................................29
Method 1 ........................................................................................................29
Method 2 ........................................................................................................30
Add an Intervention from the Student Roadmap Screen .....................................31
Add a Bulk Intervention........................................................................................32
Add and Manage Intervention Attachments ...............................................................34
Upload an Attachment to an Intervention.............................................................34
Download and View an Intervention Attachment..................................................35
Download a Single Intervention Attachment ..................................................35
Download all Intervention Attachments................................................................35
Delete an Intervention Attachment.......................................................................36
Delete an Intervention................................................................................................37
Delete an Intervention from the Interventions Screen..........................................37
Delete an Intervention from the Student Roadmap Screen .................................37
Print an Intervention...................................................................................................38
Print an Intervention from the Interventions Screen.............................................38
Print an Intervention from the Student Roadmap Screen ....................................39
State Assessments 41
Analyze State Assessment Summary ........................................................................41
Analyze State Assessment Standards .......................................................................46
Data Points 51
Analyze Data Points...................................................................................................51
Data Analysis 55
Compare Assessment Scores....................................................................................55
Analyze Multiple Measures of Student Data ..............................................................59
Student Learning Objectives 63
Understand the Objective Workflow...........................................................................63
Create Objectives ......................................................................................................64
Add Objective.......................................................................................................64
Add Data to Objective ..........................................................................................66
iv ProgressBook DataMap User Guide

Add Students to Objective ...................................................................................67
Remove Students from Objective ..................................................................70
Add Tiers..............................................................................................................71
Add Students to Tiers.....................................................................................73
Change Student's Tier....................................................................................74
Edit Tiers ........................................................................................................75
Delete Tiers ....................................................................................................76
Add Baseline Scores............................................................................................77
Enter Baseline Scores Manually ....................................................................77
Add Baseline Scores Using Data Points Assessment Scores .......................78
Add Growth Targets .............................................................................................81
Edit Objectives ...........................................................................................................82
Print Objectives..........................................................................................................82
Print Objective from Student Objectives Screen..................................................82
Print Objective from Edit Student Objective Screen ............................................83
Export Objectives.......................................................................................................85
Delete Objectives.......................................................................................................85
Delete Objective from Student Objectives Screen...............................................85
Delete Objective from Edit Student Objective Screen .........................................87
Submit Objectives for Review....................................................................................88
Make Requested Revisions to Objectives .................................................................89
Exclude Students from an Objective..........................................................................91
Score Objectives........................................................................................................92
Score Objectives Manually ..................................................................................92
Score Objectives Using Data Points Assessment Scores ...................................95
Graduation Points 97
Access Details View...................................................................................................97
Access Credit Requirements View.............................................................................99
Access Graduation Pathways View .........................................................................100
Export Files ..............................................................................................................101
ProgressBook DataMap User Guide v

This page intentionally left blank.
vi ProgressBook DataMap User Guide
Welcome to DataMap
DataMap is a student analytics tool that collects, aggregates, and displays trending and historical assessment result data for the following types of assessments:
• state standardized assessments – OAA and OGT
• other state assessments – OTELA, KRA, etc.
• district assessments – created by your school district for use within the district
• third-party assessments – created by outside assessment providers (DIBELS, ACT, SAT, etc.)
You can search for and display this data in various formats to help you analyze the information and identify trends and specific areas in which students may need additional instruction.
Note: DataMap is integrated with StudentInformation and shares the same database. You must use StudentInformation to manage demographic data, which is read-only in DataMap. Users with administrator privileges can import assessment data directly into DataMap and perform other administrative functions. For more information, see ProgressBook DataMap Administrator Guide.
Find the Information You Need
The following sources of information are available to help you use DataMap:
• DataMap Help – Click on any screen to get help for that screen. For more information, see “Use DataMap Help.”
• Knowledge Base – To access the ProgressBook Suite Knowledge Base, click http://www.software-answers.com/Support/Pages/KnowledgeBase.aspx. The Knowledge Base contains the following documentation:
• DataMap Release Notes
• DataMap Product Guides
• Knowledge Base Articles
ProgressBook DataMap User Guide 1
Welcome to DataMap
Access DataMap
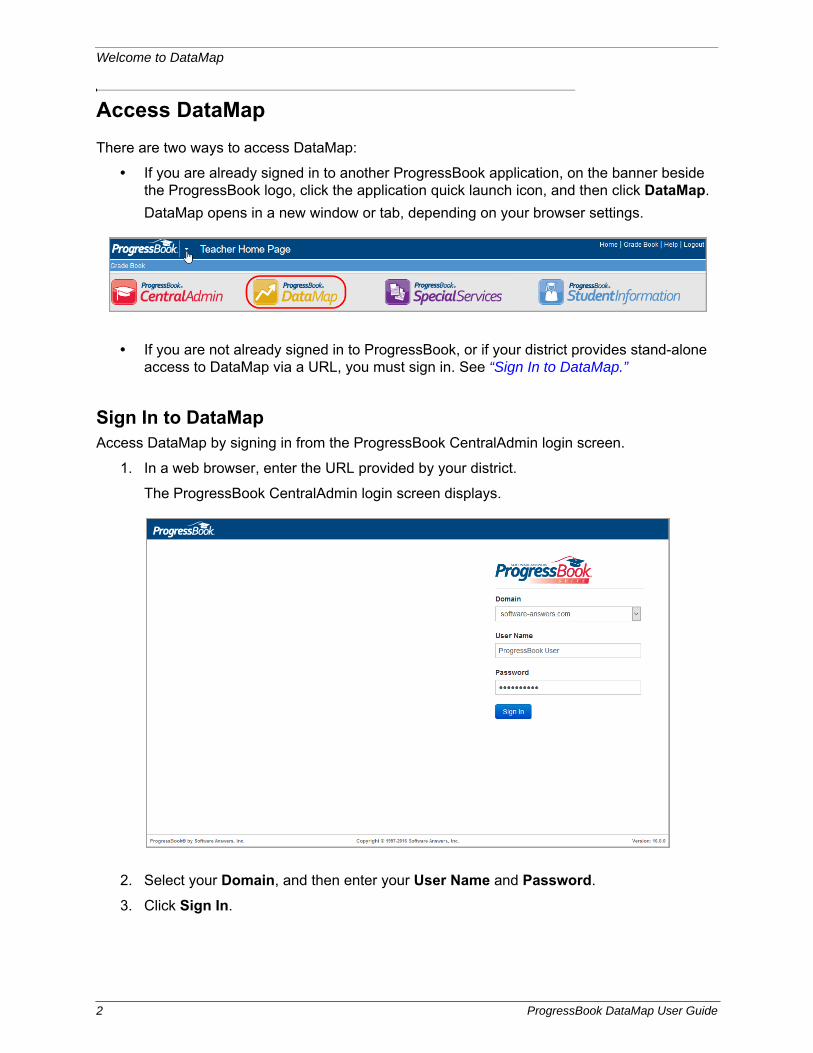
There are two ways to access DataMap:
• If you are already signed in to another ProgressBook application, on the banner beside the ProgressBook logo, click the application quick launch icon, and then click DataMap.
DataMap opens in a new window or tab, depending on your browser settings.
• If you are not already signed in to ProgressBook, or if your district provides stand-alone access to DataMap via a URL, you must sign in. See “Sign In to DataMap.”
Sign In to DataMapAccess DataMap by signing in from the ProgressBook CentralAdmin login screen.
1. In a web browser, enter the URL provided by your district.
The ProgressBook CentralAdmin login screen displays.
2. Select your Domain, and then enter your User Name and Password.
3. Click Sign In.
2 ProgressBook DataMap User Guide
Welcome to DataMap
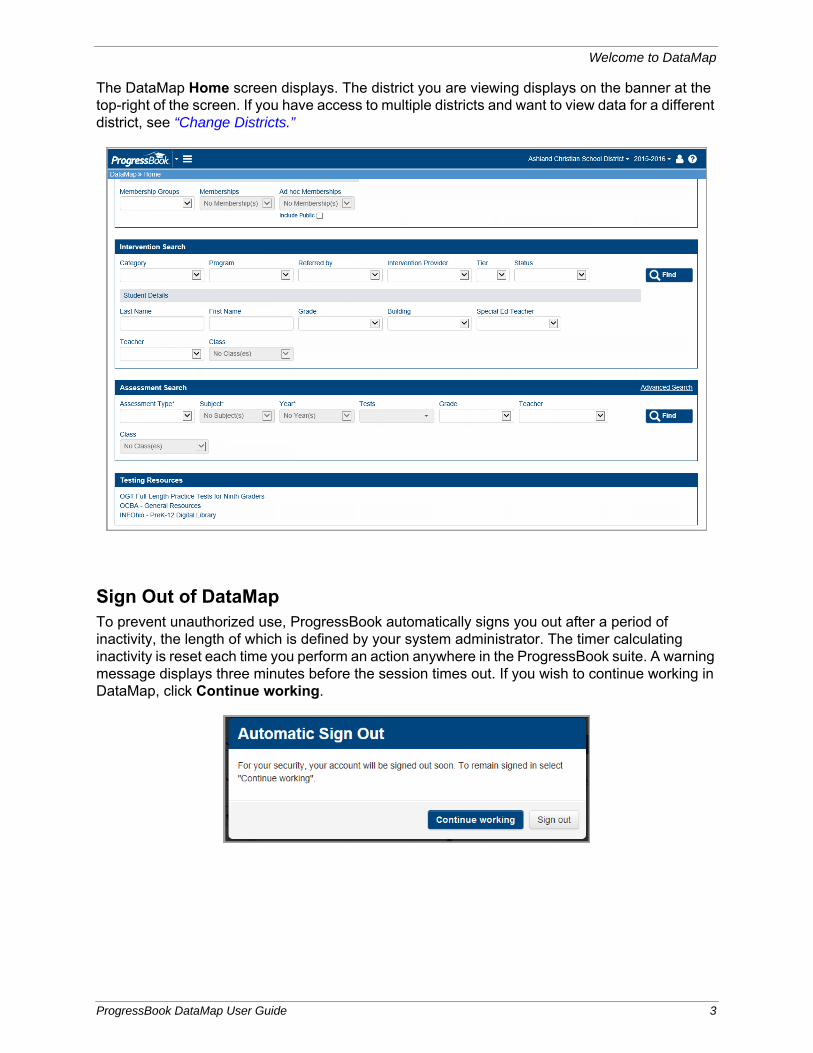
The DataMap Home screen displays. The district you are viewing displays on the banner at the top-right of the screen. If you have access to multiple districts and want to view data for a different district, see “Change Districts.”
Sign Out of DataMapTo prevent unauthorized use, ProgressBook automatically signs you out after a period of inactivity, the length of which is defined by your system administrator. The timer calculating inactivity is reset each time you perform an action anywhere in the ProgressBook suite. A warning message displays three minutes before the session times out. If you wish to continue working in DataMap, click Continue working.
ProgressBook DataMap User Guide 3
Welcome to DataMap
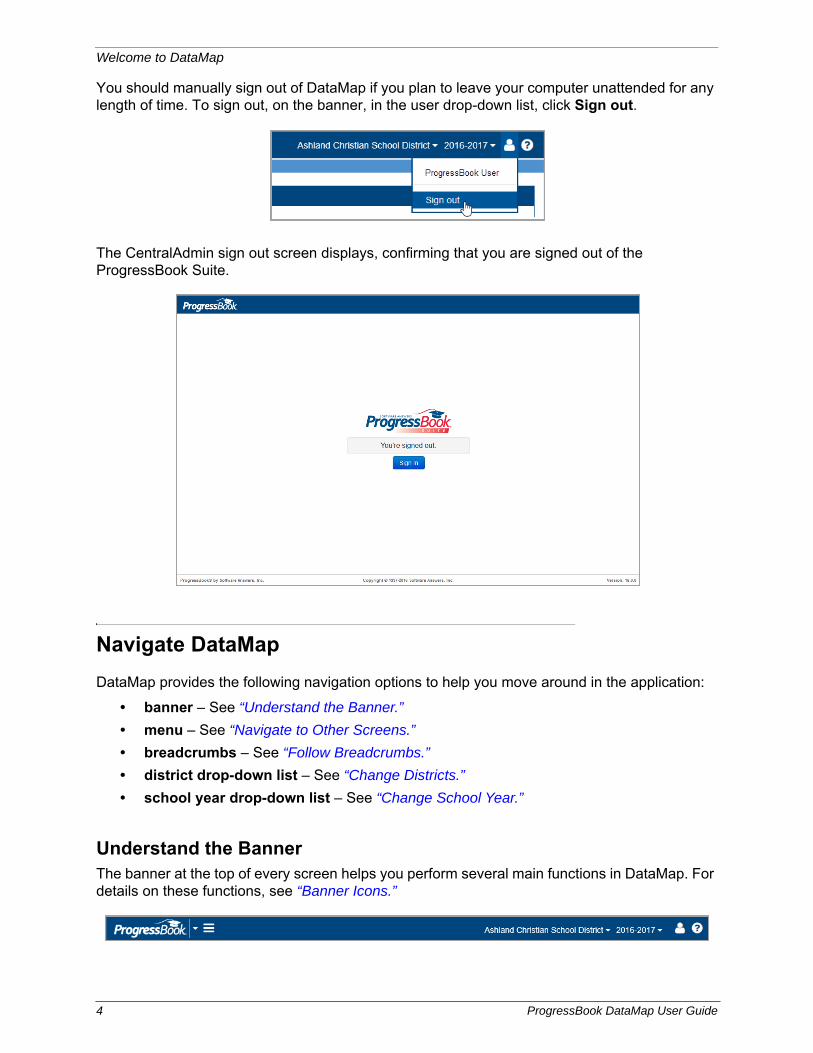
You should manually sign out of DataMap if you plan to leave your computer unattended for any length of time. To sign out, on the banner, in the user drop-down list, click Sign out.
The CentralAdmin sign out screen displays, confirming that you are signed out of the ProgressBook Suite.
Navigate DataMap
DataMap provides the following navigation options to help you move around in the application:
• banner – See “Understand the Banner.”
• menu – See “Navigate to Other Screens.”
• breadcrumbs – See “Follow Breadcrumbs.”
• district drop-down list – See “Change Districts.”
• school year drop-down list – See “Change School Year.”
Understand the BannerThe banner at the top of every screen helps you perform several main functions in DataMap. For details on these functions, see “Banner Icons.”
4 ProgressBook DataMap User Guide
Welcome to DataMap
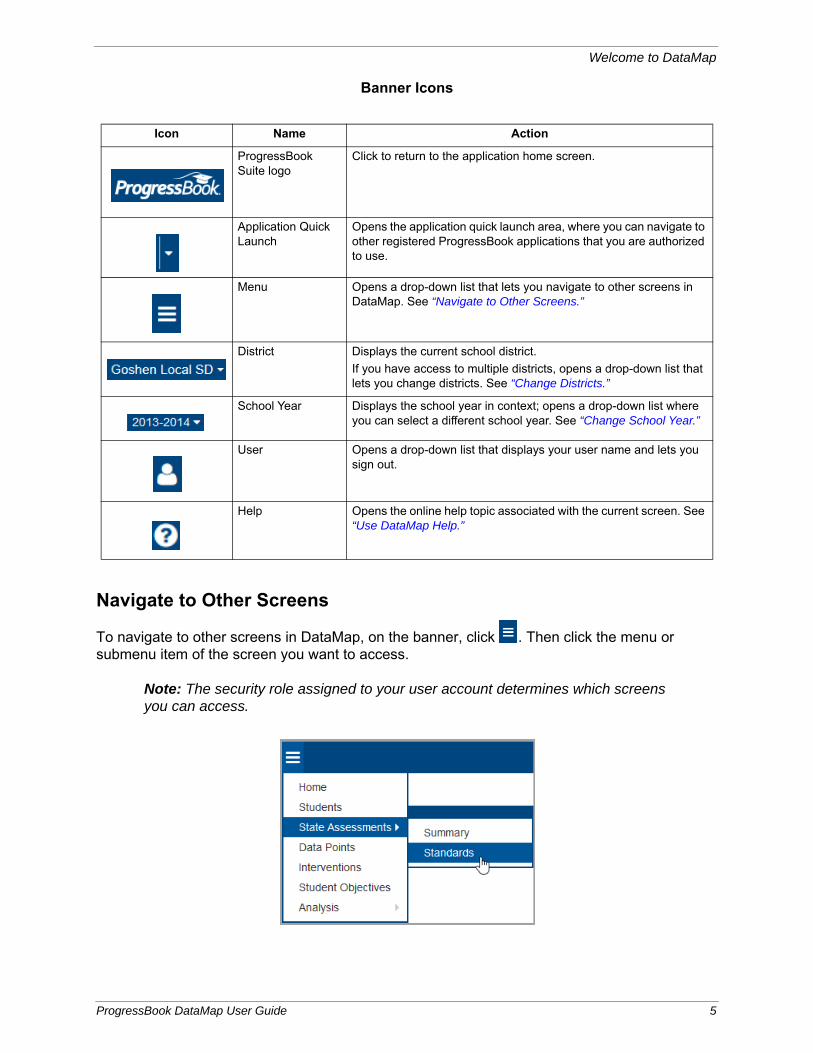
Banner Icons
Navigate to Other Screens
To navigate to other screens in DataMap, on the banner, click . Then click the menu or submenu item of the screen you want to access.
Note: The security role assigned to your user account determines which screens you can access.
Icon Name Action
ProgressBook Suite logo
Click to return to the application home screen.
Application Quick Launch
Opens the application quick launch area, where you can navigate to other registered ProgressBook applications that you are authorized to use.
Menu Opens a drop-down list that lets you navigate to other screens in DataMap. See “Navigate to Other Screens.”
District Displays the current school district.
If you have access to multiple districts, opens a drop-down list that lets you change districts. See “Change Districts.”
School Year Displays the school year in context; opens a drop-down list where you can select a different school year. See “Change School Year.”
User Opens a drop-down list that displays your user name and lets you sign out.
Help Opens the online help topic associated with the current screen. See “Use DataMap Help.”
ProgressBook DataMap User Guide 5
Welcome to DataMap
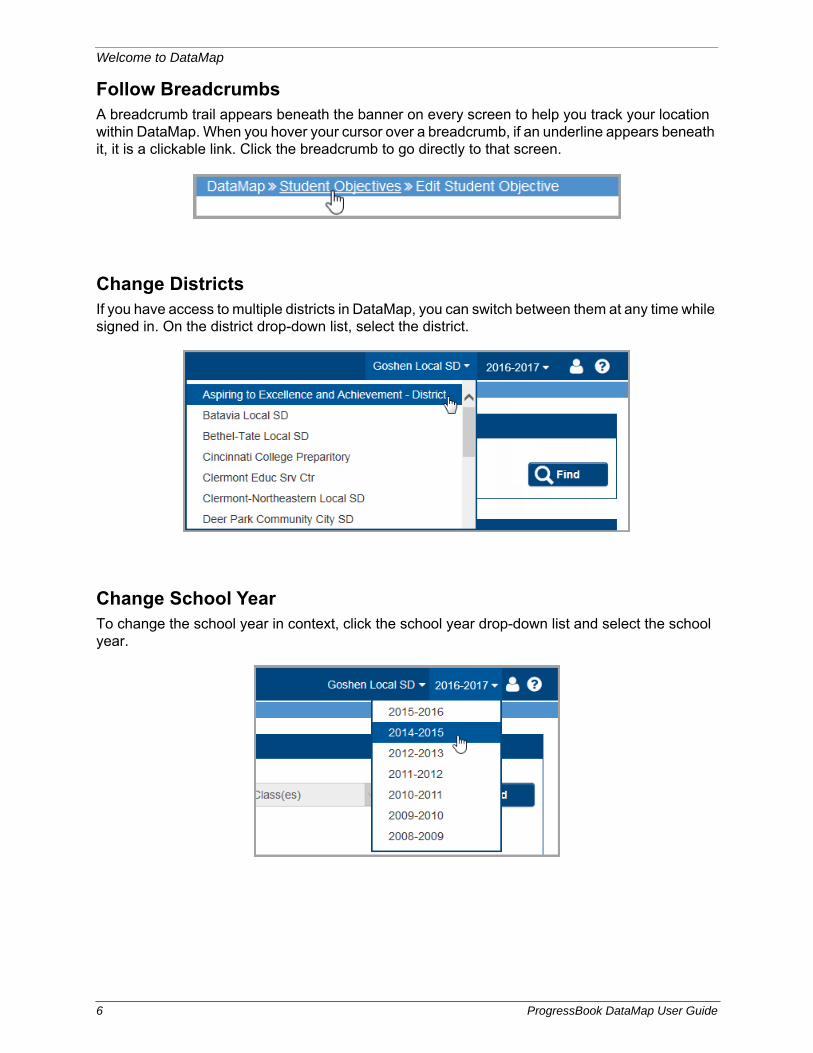
Follow BreadcrumbsA breadcrumb trail appears beneath the banner on every screen to help you track your location within DataMap. When you hover your cursor over a breadcrumb, if an underline appears beneath it, it is a clickable link. Click the breadcrumb to go directly to that screen.
Change DistrictsIf you have access to multiple districts in DataMap, you can switch between them at any time while signed in. On the district drop-down list, select the district.
Change School YearTo change the school year in context, click the school year drop-down list and select the school year.
6 ProgressBook DataMap User Guide
Welcome to DataMap
Use DataMap Help
To view an online help topic for the screen you are viewing, on the banner, click .
DataMap Help displays in a separate browser window. You can use online help in the following ways:
• Browse the Contents for specific topic titles.
• Enter keywords in the Index to search for information.
• Type a word or phrase in the Search field to return a list of possible help topics.
Navigate ProgressBook
Use the application quick launch to navigate between ProgressBook applications that you are authorized to use.
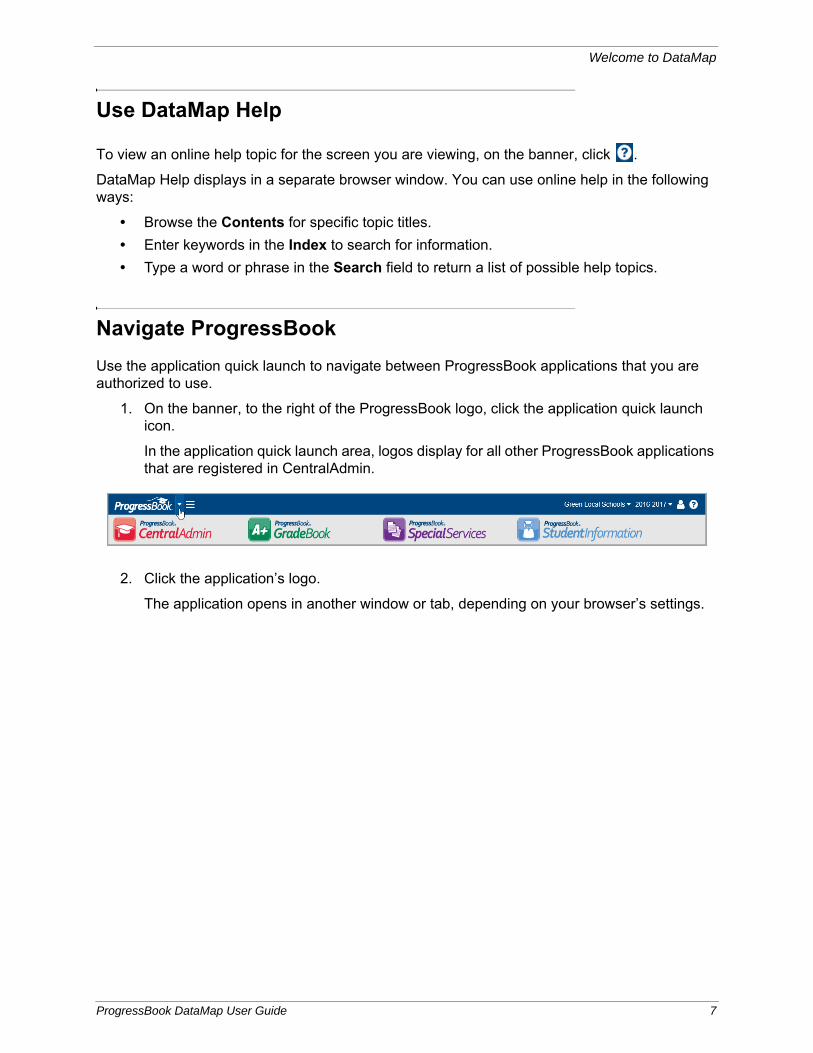
1. On the banner, to the right of the ProgressBook logo, click the application quick launch icon.
In the application quick launch area, logos display for all other ProgressBook applications that are registered in CentralAdmin.
2. Click the application’s logo.
The application opens in another window or tab, depending on your browser’s settings.
ProgressBook DataMap User Guide 7

Welcome to DataMap
This page intentionally left blank.
8 ProgressBook DataMap User Guide
Search DataMap
DataMap lets you enter different types of search criteria to retrieve specific information. The more search criteria you enter, the narrower the search results.
To find student data, you can search in the following ways:
• by Student – See “Search by Student.”
• by Intervention – See “Search by Intervention.”
• by Assessment – See “Search by Assessment.”
Search by Student
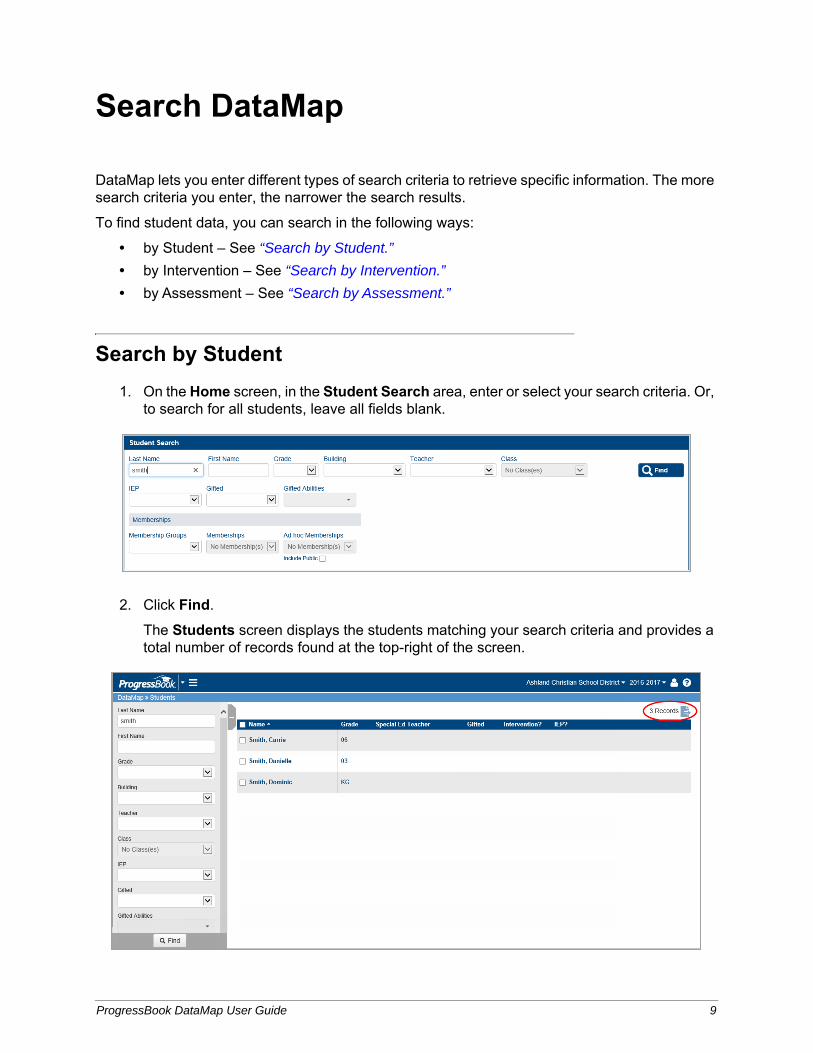
1. On the Home screen, in the Student Search area, enter or select your search criteria. Or, to search for all students, leave all fields blank.
2. Click Find.
The Students screen displays the students matching your search criteria and provides a total number of records found at the top-right of the screen.
ProgressBook DataMap User Guide 9
Search DataMap
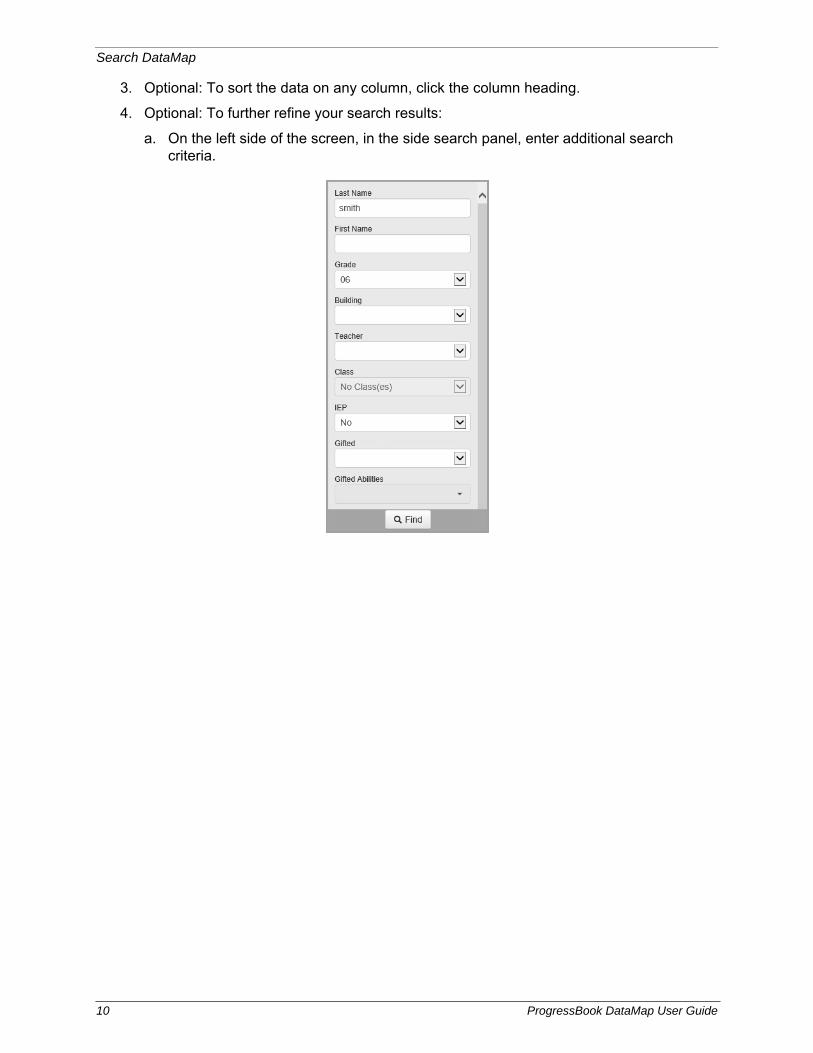
3. Optional: To sort the data on any column, click the column heading.
4. Optional: To further refine your search results:
a. On the left side of the screen, in the side search panel, enter additional search criteria.
10 ProgressBook DataMap User Guide
Search DataMap
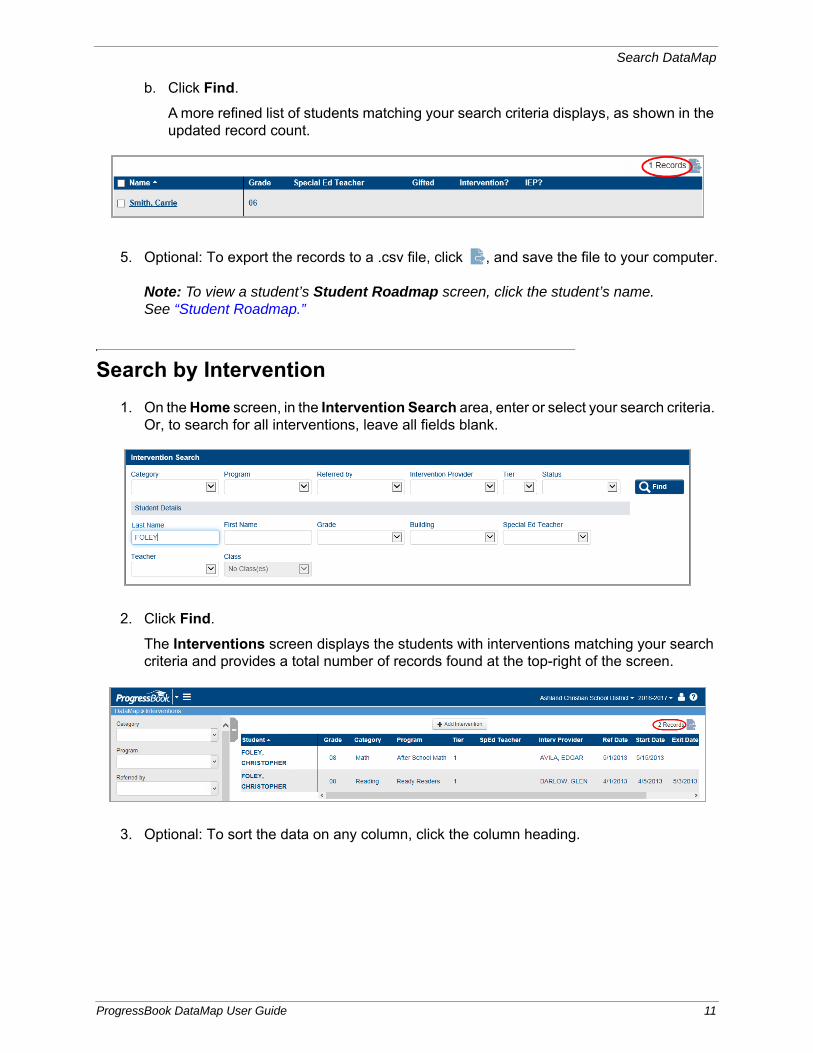
b. Click Find.
A more refined list of students matching your search criteria displays, as shown in the updated record count.
5. Optional: To export the records to a .csv file, click , and save the file to your computer.
Note: To view a student’s Student Roadmap screen, click the student’s name. See “Student Roadmap.”
Search by Intervention
1. On the Home screen, in the Intervention Search area, enter or select your search criteria. Or, to search for all interventions, leave all fields blank.
2. Click Find.
The Interventions screen displays the students with interventions matching your search criteria and provides a total number of records found at the top-right of the screen.
3. Optional: To sort the data on any column, click the column heading.
ProgressBook DataMap User Guide 11
Search DataMap
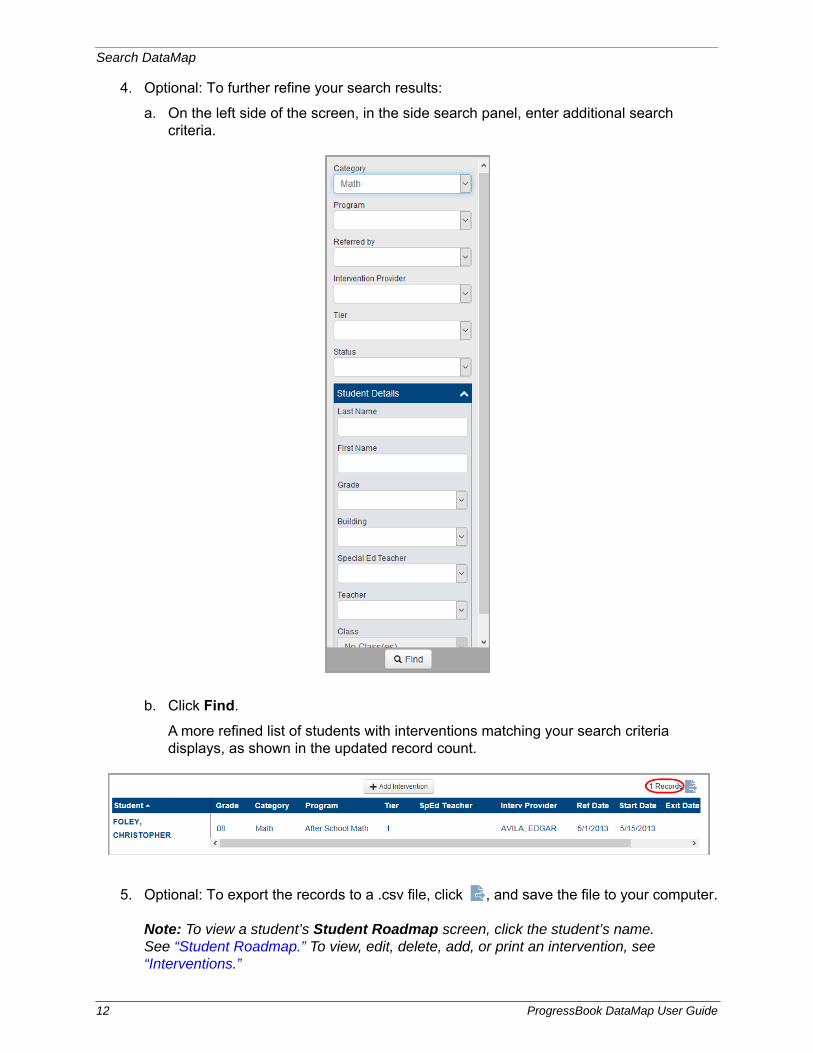
4. Optional: To further refine your search results:
a. On the left side of the screen, in the side search panel, enter additional search criteria.
b. Click Find.
A more refined list of students with interventions matching your search criteria displays, as shown in the updated record count.
5. Optional: To export the records to a .csv file, click , and save the file to your computer.
Note: To view a student’s Student Roadmap screen, click the student’s name. See “Student Roadmap.” To view, edit, delete, add, or print an intervention, see “Interventions.”
12 ProgressBook DataMap User Guide

Search DataMap
Search by Assessment
1. On the Home screen, in the Assessment Search area, select the Assessment Type for which you want to view scores:
• Summary - OAA – OAA summary totals and percentages by standards and placement level
• Standards - OAA – OAA scores and placement by student
• Summary - OCBA – OCBA summary totals and percentages by standards and placement level
• Standards - OCBA – OCBA scores and placement by student
• Summary - OGT – OGT summary totals and percentages by standards and placement level
• Standards - OGT – OGT scores and placement by student
• Summary - PARCC – PARCC summary totals and percentages by standards and placement level
• Standards - PARCC – PARCC scores and placement by student
• Data Points – third-party and district assessment scores
2. Select the Subject and Year of the assessment.
3. Optional: Enter or select any additional search criteria. To expand the available search criteria fields:
a. In the upper-right corner of the Assessment Search area, click Advanced Search.
ProgressBook DataMap User Guide 13

Search DataMap
b. Enter or select additional search criteria in the fields that display.
c. Click Find.
Based on the Assessment Type you selected, one of the following screens displays the students matching your search criteria and provides a total number of matching records:
• If you selected Summary - OAA, Summary - OCBA, Summary - OGT, or Summary - PARCC, the Summary screen displays. See “Analyze State Assessment Summary.”
• If you selected Standards - OAA, Standards - OCBA, Standards - OGT, or Standards - PARCC, the Standards screen displays. See “Analyze State Assessment Standards.”
• If you selected Data Points, the Data Points screen displays. See “Analyze Data Points.”
14 ProgressBook DataMap User Guide
Student Roadmap
DataMap’s Student Roadmap gives you an overview of a single student’s information and lets you drill down to view more details. On this screen, you can view a student’s demographic information, interventions, current school year summary, and historical test scores. For specific information on the task you want to perform, refer to the appropriate topic:
• To access the Student Roadmap, see “Access Student Roadmap.”
• To view a student’s home address on a map, see “Map Student Address.”
• To view a student’s IEP in SpecialServices, see “View Student IEP.”
• To view and manage a student’s interventions, see “Review Interventions for a Student.”
• To view a time line of a student’s progress for the current school year, see “Review School Year Summary.”
• To view a student’s historical scores on state standardized assessments, see “Review State Assessment History.”
• To view a student’s historical scores on third-party, district, and state assessments (other than OAA and OGT), see “Review Data Points History.”
Access Student Roadmap
1. Optional: To search for the student, on the Home screen, in the Student Search area, enter search criteria. See “Search by Student.”
2. On the Students, Standards, Data Points, Interventions, Graduation Points, or Multiple Measures screen, locate the student in the record list.
ProgressBook DataMap User Guide 15
Student Roadmap
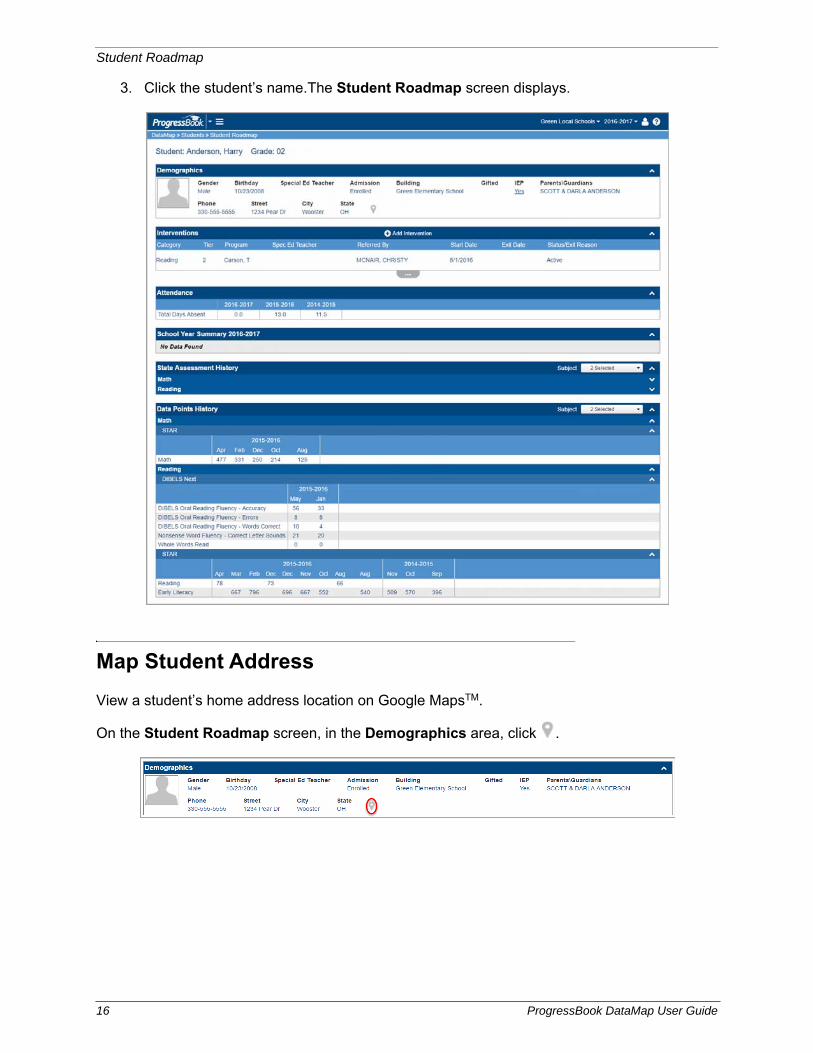
3. Click the student’s name.The Student Roadmap screen displays.
Map Student Address
View a student’s home address location on Google MapsTM.
On the Student Roadmap screen, in the Demographics area, click .
16 ProgressBook DataMap User Guide
Student Roadmap
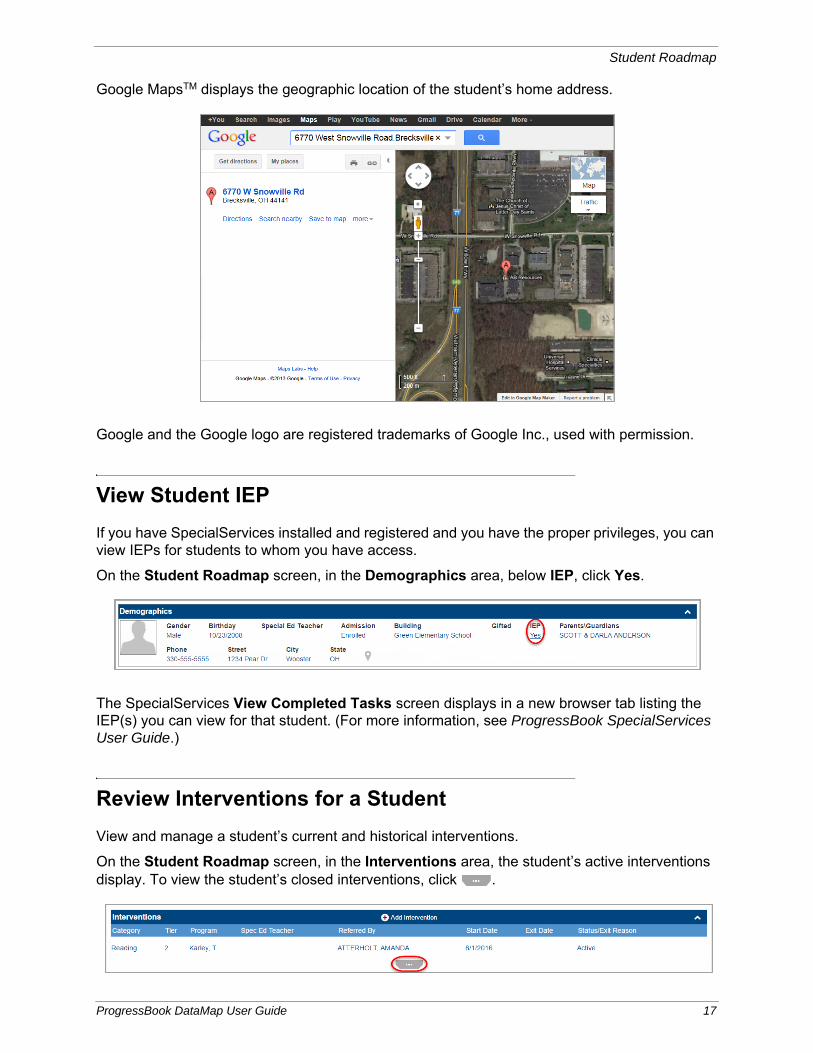
Google MapsTM displays the geographic location of the student’s home address.
Google and the Google logo are registered trademarks of Google Inc., used with permission.
View Student IEP
If you have SpecialServices installed and registered and you have the proper privileges, you can view IEPs for students to whom you have access.
On the Student Roadmap screen, in the Demographics area, below IEP, click Yes.
The SpecialServices View Completed Tasks screen displays in a new browser tab listing the IEP(s) you can view for that student. (For more information, see ProgressBook SpecialServices User Guide.)
Review Interventions for a Student
View and manage a student’s current and historical interventions.
On the Student Roadmap screen, in the Interventions area, the student’s active interventions display. To view the student’s closed interventions, click .
ProgressBook DataMap User Guide 17
Student Roadmap
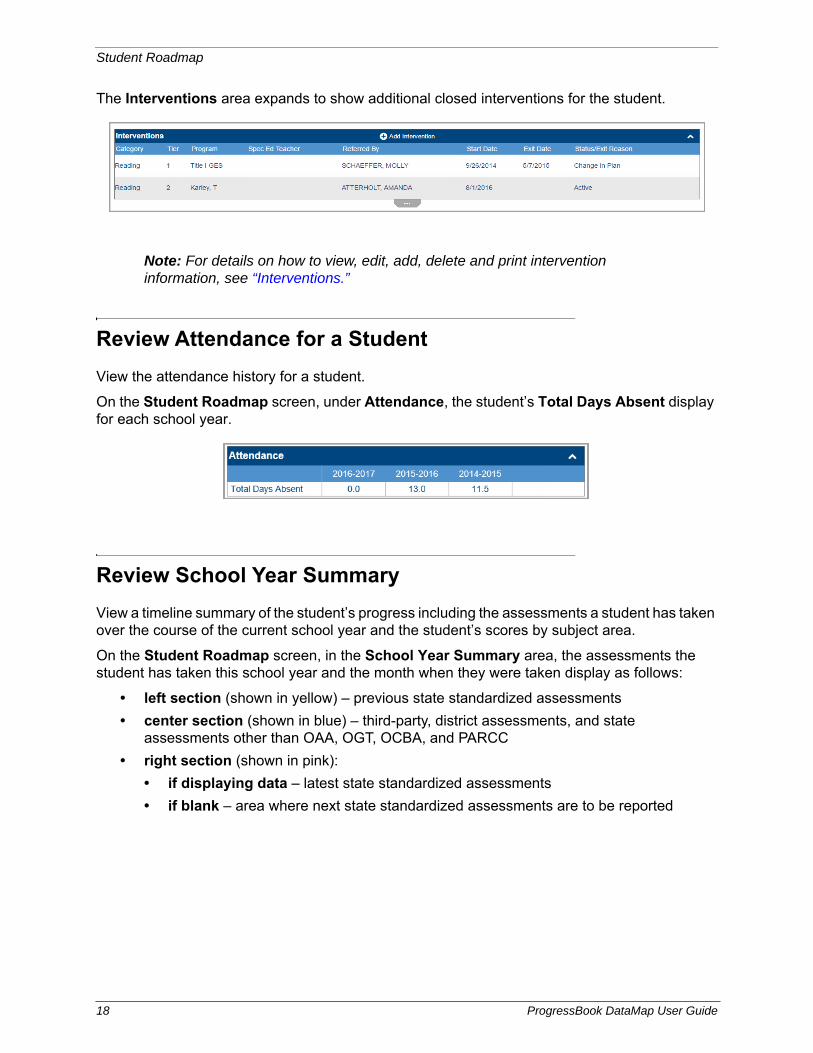
The Interventions area expands to show additional closed interventions for the student.
Note: For details on how to view, edit, add, delete and print intervention information, see “Interventions.”
Review Attendance for a Student
View the attendance history for a student.
On the Student Roadmap screen, under Attendance, the student’s Total Days Absent display for each school year.
Review School Year Summary
View a timeline summary of the student’s progress including the assessments a student has taken over the course of the current school year and the student’s scores by subject area.
On the Student Roadmap screen, in the School Year Summary area, the assessments the student has taken this school year and the month when they were taken display as follows:
• left section (shown in yellow) – previous state standardized assessments
• center section (shown in blue) – third-party, district assessments, and state assessments other than OAA, OGT, OCBA, and PARCC
• right section (shown in pink):
• if displaying data – latest state standardized assessments
• if blank – area where next state standardized assessments are to be reported
18 ProgressBook DataMap User Guide

Student Roadmap
Note: The sections are highlighted in this image for illustrative purposes. They do not appear highlighted in DataMap.
Scores for third-party and district assessments as well as state assessments (other than OAA, OGT, OCBA, and PARCC) display in blue text regardless of the score, while state standardized assessment scores vary in color based on the placement level in which the score falls. For OAA, OCBA, and OGT, the color codes are:
• Advanced (ADV) – green
• Accelerated (ACC) – dark green
• Proficient (PROF) – blue
• Basic (BASIC) – dark red
• Limited (LIM) – red
For PARCC, the color codes are:
• Exceeded Expectations (EXCEED) – green
• Met Expectations (MET) – dark green
• Approached Expectations (APPR) – blue
• Partially Met Expectations (PARTIAL) – dark red
• Did Not Yet Meet Expectations (NOT MET) – red
ProgressBook DataMap User Guide 19
Student Roadmap
Review State Assessment History
View a student’s historical scores on state standardized assessments.
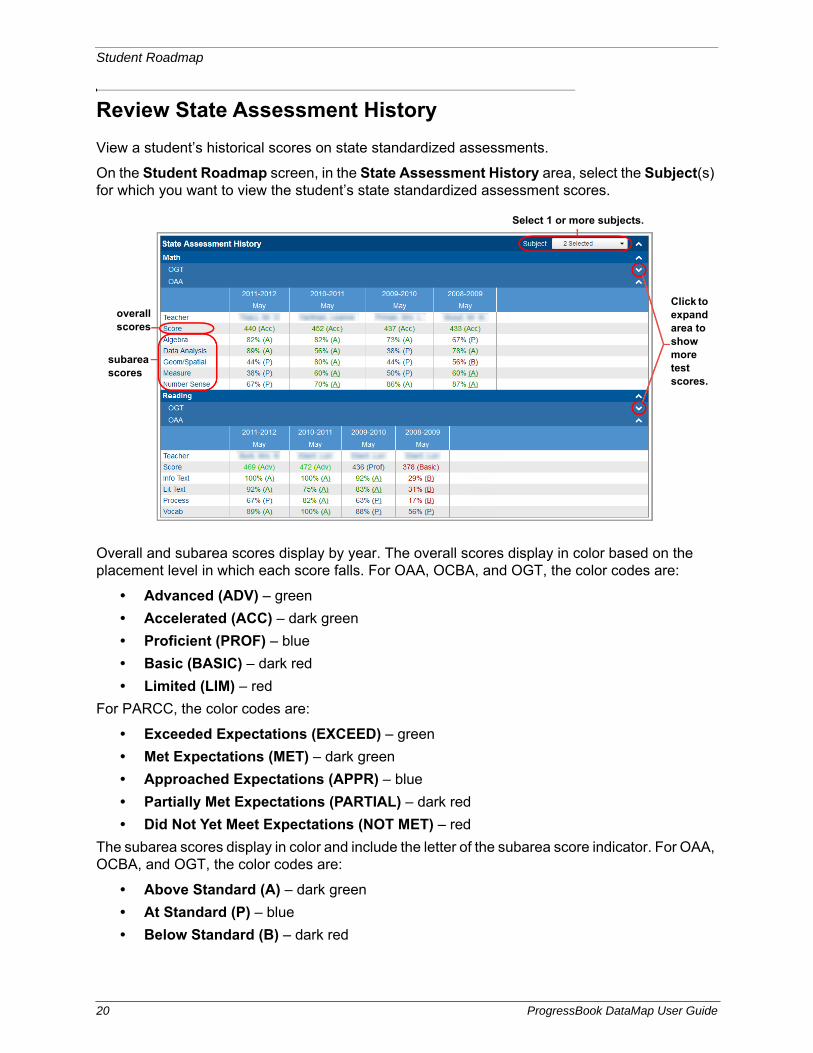
On the Student Roadmap screen, in the State Assessment History area, select the Subject(s) for which you want to view the student’s state standardized assessment scores.
Overall and subarea scores display by year. The overall scores display in color based on the placement level in which each score falls. For OAA, OCBA, and OGT, the color codes are:
• Advanced (ADV) – green
• Accelerated (ACC) – dark green
• Proficient (PROF) – blue
• Basic (BASIC) – dark red
• Limited (LIM) – red
For PARCC, the color codes are:
• Exceeded Expectations (EXCEED) – green
• Met Expectations (MET) – dark green
• Approached Expectations (APPR) – blue
• Partially Met Expectations (PARTIAL) – dark red
• Did Not Yet Meet Expectations (NOT MET) – red
The subarea scores display in color and include the letter of the subarea score indicator. For OAA, OCBA, and OGT, the color codes are:
• Above Standard (A) – dark green
• At Standard (P) – blue
• Below Standard (B) – dark red
Click to expand area to show more test scores.
overall scores
subarea scores
Select 1 or more subjects.
20 ProgressBook DataMap User Guide
Student Roadmap
For PARCC, the color codes are:
• At/Above Standard – dark green
• Near Standard – blue
• Below Standard – dark red
Note: If the icon displays after the month, this indicates that the student’s percentage score has been calculated using the max score for the most recent assessment (until the current assessment max score is available).
Note: The PBA (Performance Based Assessment) and EOY (End of Year) rows that display for OCBA and PARCC contain Yes if the student has taken each of these assessments.
Review Data Points History
View a student’s historical scores on third-party, district, and state assessments (other than OAA, OGT, OCBA, and PARCC).
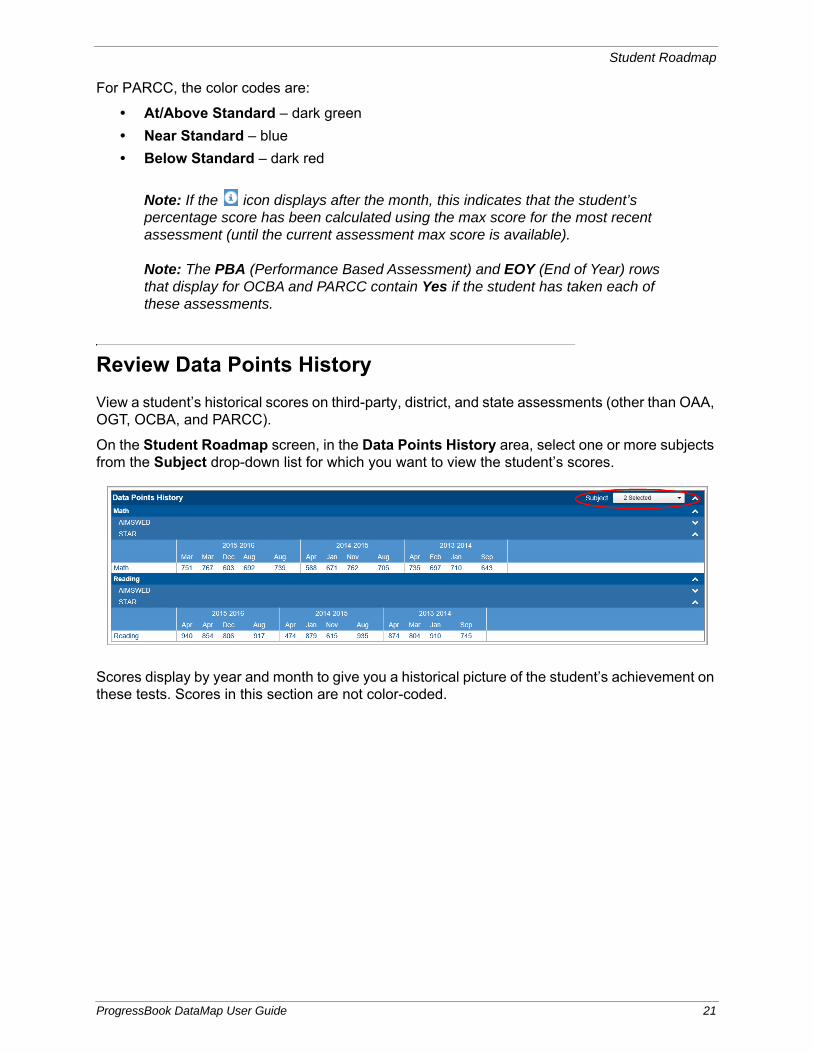
On the Student Roadmap screen, in the Data Points History area, select one or more subjects from the Subject drop-down list for which you want to view the student’s scores.
Scores display by year and month to give you a historical picture of the student’s achievement on these tests. Scores in this section are not color-coded.
ProgressBook DataMap User Guide 21

Student Roadmap
This page intentionally left blank.
22 ProgressBook DataMap User Guide
Interventions
DataMap offers many different ways of viewing and managing intervention information based on where you are in the application. For specific information on the intervention task you want to perform, refer to the appropriate topic:
• To search for groups of students receiving interventions, see “View Students with Interventions.”
• To search for intervention information for an individual student, see “View an Intervention.”
• To add an intervention, see “Add an Intervention.”
• To edit an intervention, see “Edit an Intervention.”
• To add supplemental information to an intervention, see “Add and Manage Intervention Attachments.”
• To delete an intervention, see “Delete an Intervention.”
• To print an intervention, see “Print an Intervention.”
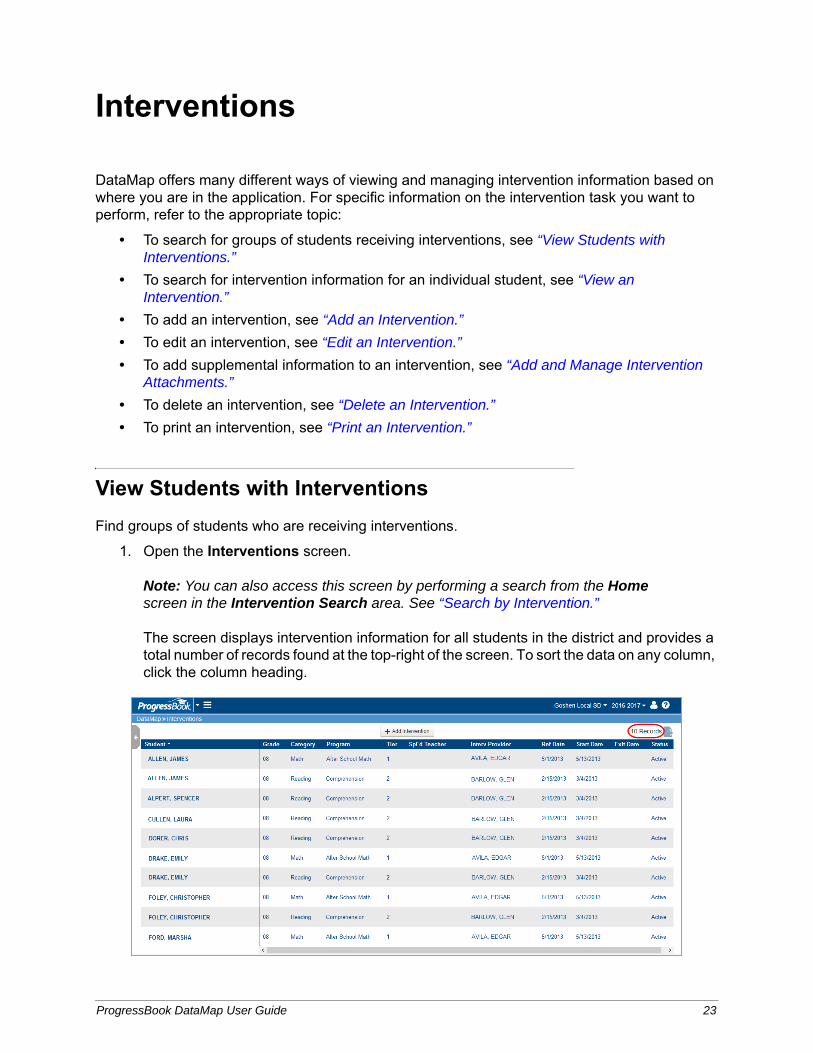
View Students with Interventions
Find groups of students who are receiving interventions.
1. Open the Interventions screen.
Note: You can also access this screen by performing a search from the Home screen in the Intervention Search area. See “Search by Intervention.”
The screen displays intervention information for all students in the district and provides a total number of records found at the top-right of the screen. To sort the data on any column, click the column heading.
ProgressBook DataMap User Guide 23
Interventions
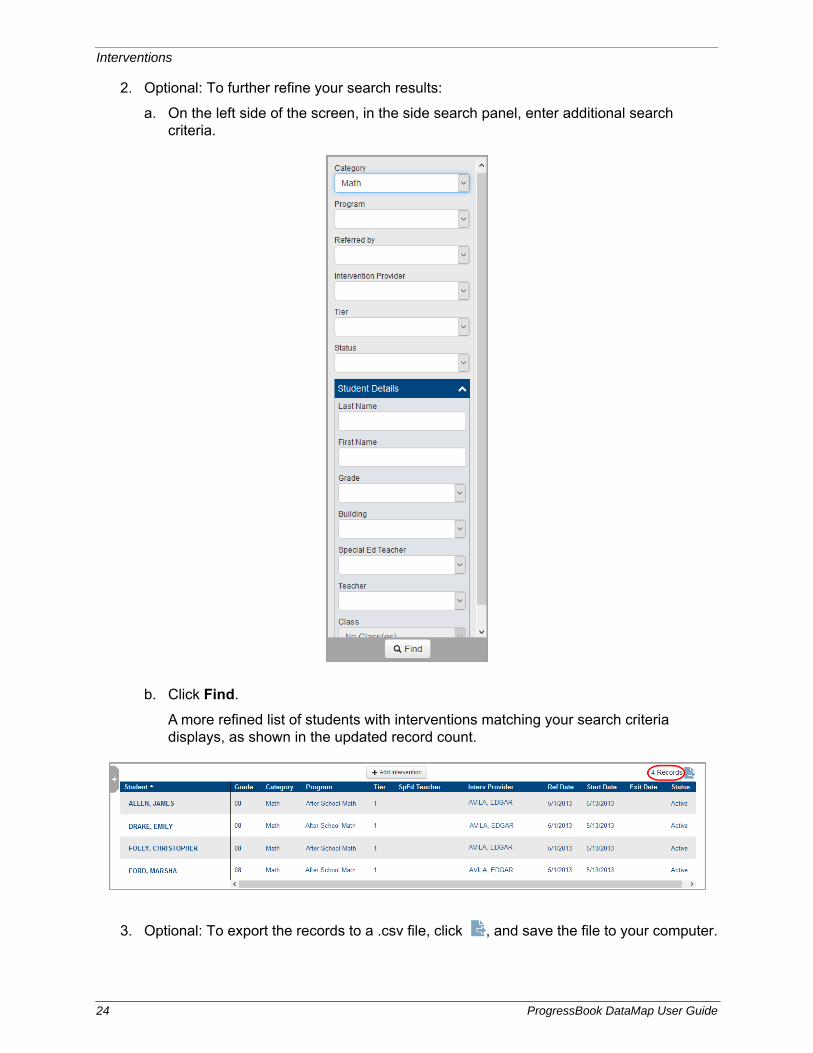
2. Optional: To further refine your search results:
a. On the left side of the screen, in the side search panel, enter additional search criteria.
b. Click Find.
A more refined list of students with interventions matching your search criteria displays, as shown in the updated record count.
3. Optional: To export the records to a .csv file, click , and save the file to your computer.
24 ProgressBook DataMap User Guide
Interventions
View an Intervention
You can view details of an existing intervention for a specific student in the following ways:
• From the Interventions screen – See “View an Intervention from the Interventions Screen.”
• From the Student Roadmap screen – See “View an Intervention from the Student Roadmap Screen.”
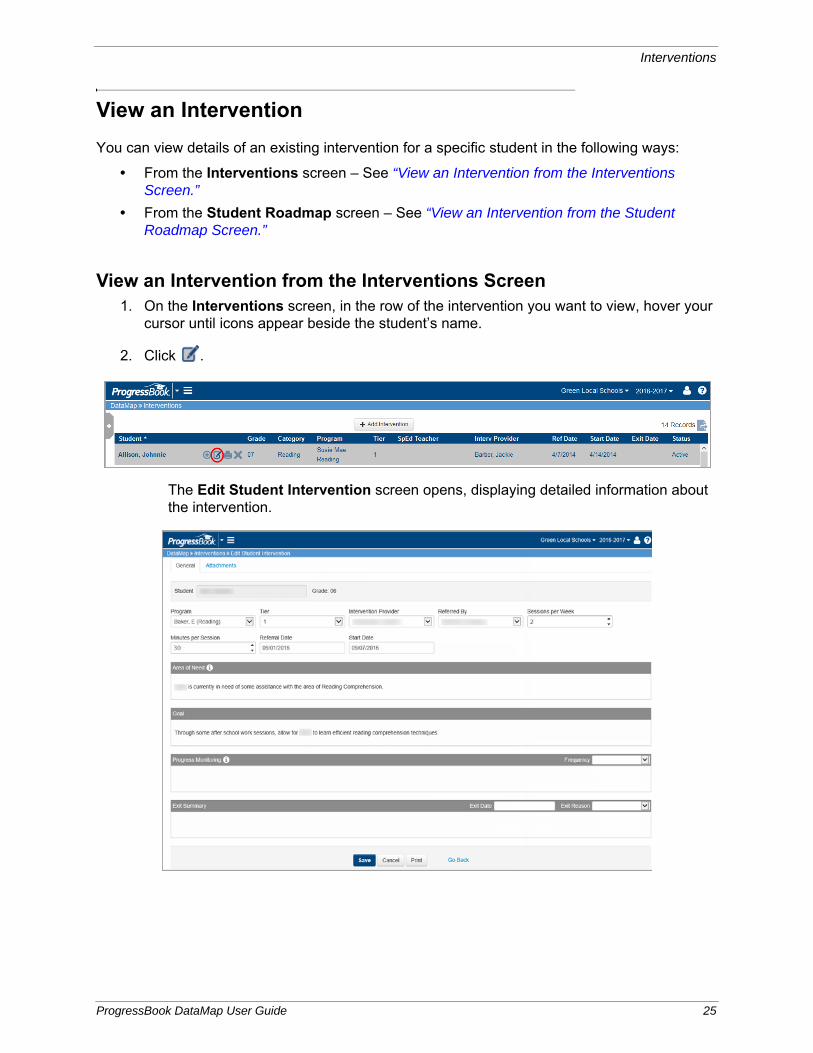
View an Intervention from the Interventions Screen1. On the Interventions screen, in the row of the intervention you want to view, hover your
cursor until icons appear beside the student’s name.
2. Click .
The Edit Student Intervention screen opens, displaying detailed information about the intervention.
ProgressBook DataMap User Guide 25
Interventions
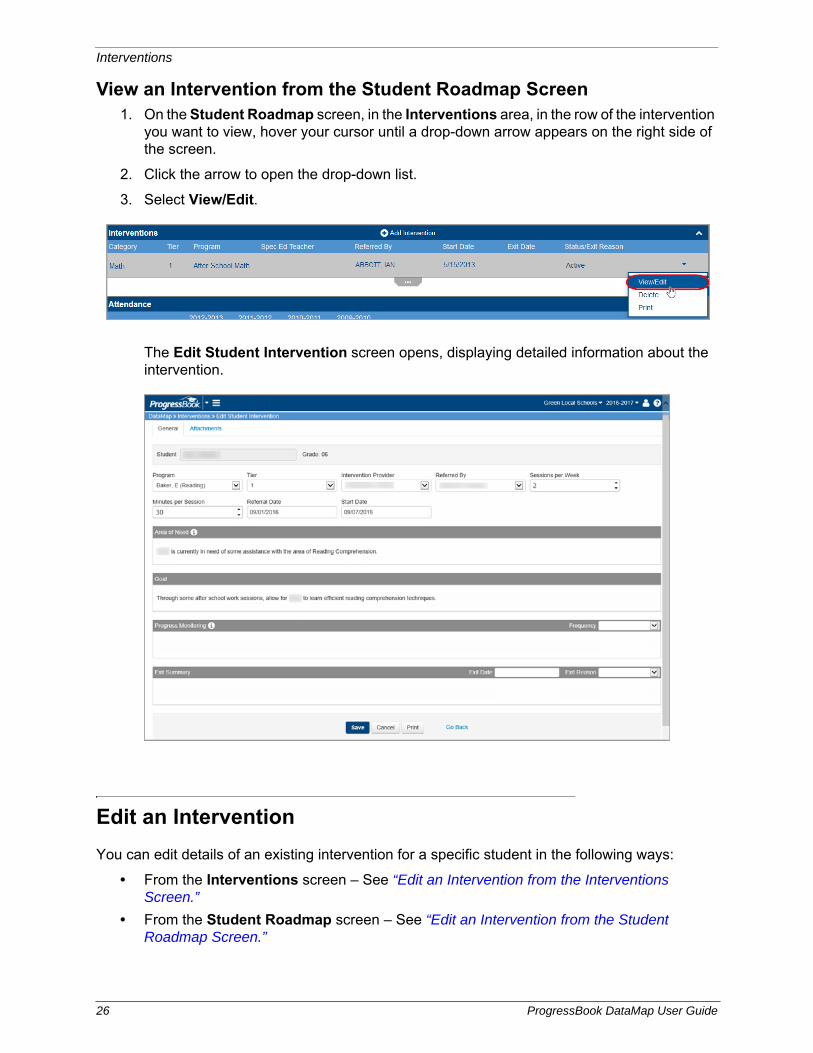
View an Intervention from the Student Roadmap Screen1. On the Student Roadmap screen, in the Interventions area, in the row of the intervention
you want to view, hover your cursor until a drop-down arrow appears on the right side of the screen.
2. Click the arrow to open the drop-down list.
3. Select View/Edit.
The Edit Student Intervention screen opens, displaying detailed information about the intervention.
Edit an Intervention
You can edit details of an existing intervention for a specific student in the following ways:
• From the Interventions screen – See “Edit an Intervention from the Interventions Screen.”
• From the Student Roadmap screen – See “Edit an Intervention from the Student Roadmap Screen.”
26 ProgressBook DataMap User Guide
Interventions
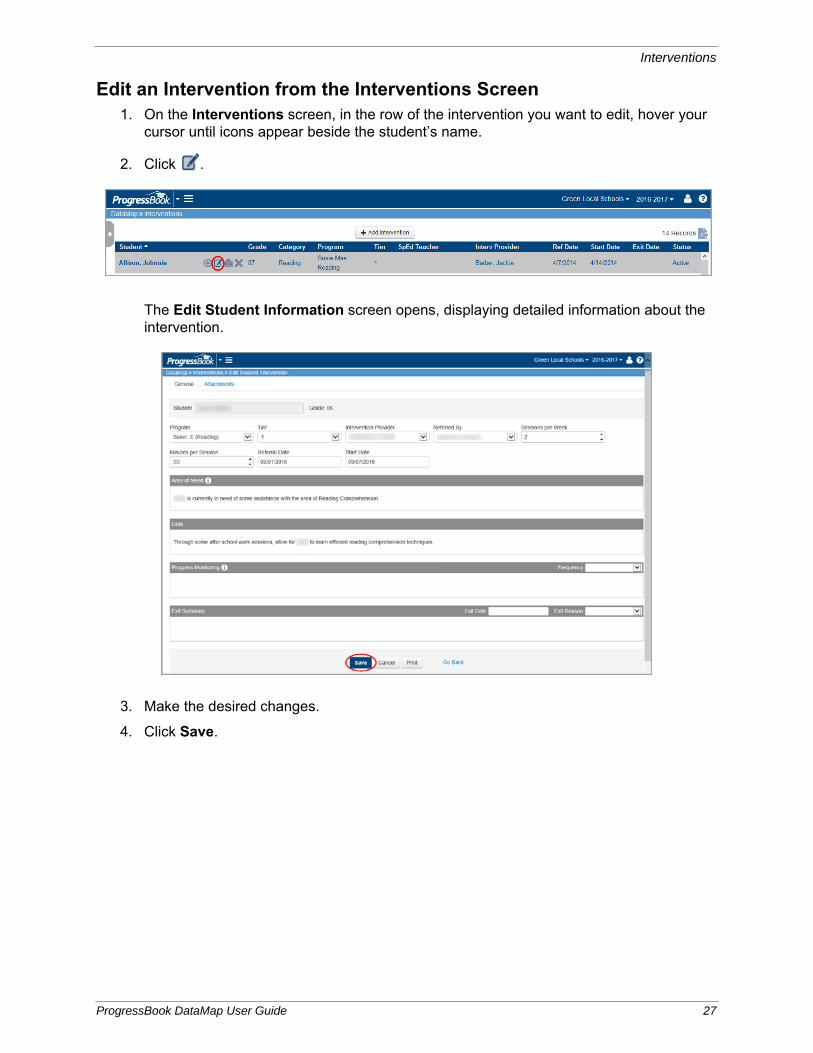
Edit an Intervention from the Interventions Screen1. On the Interventions screen, in the row of the intervention you want to edit, hover your
cursor until icons appear beside the student’s name.
2. Click .
The Edit Student Information screen opens, displaying detailed information about the intervention.
3. Make the desired changes.
4. Click Save.
ProgressBook DataMap User Guide 27
Interventions
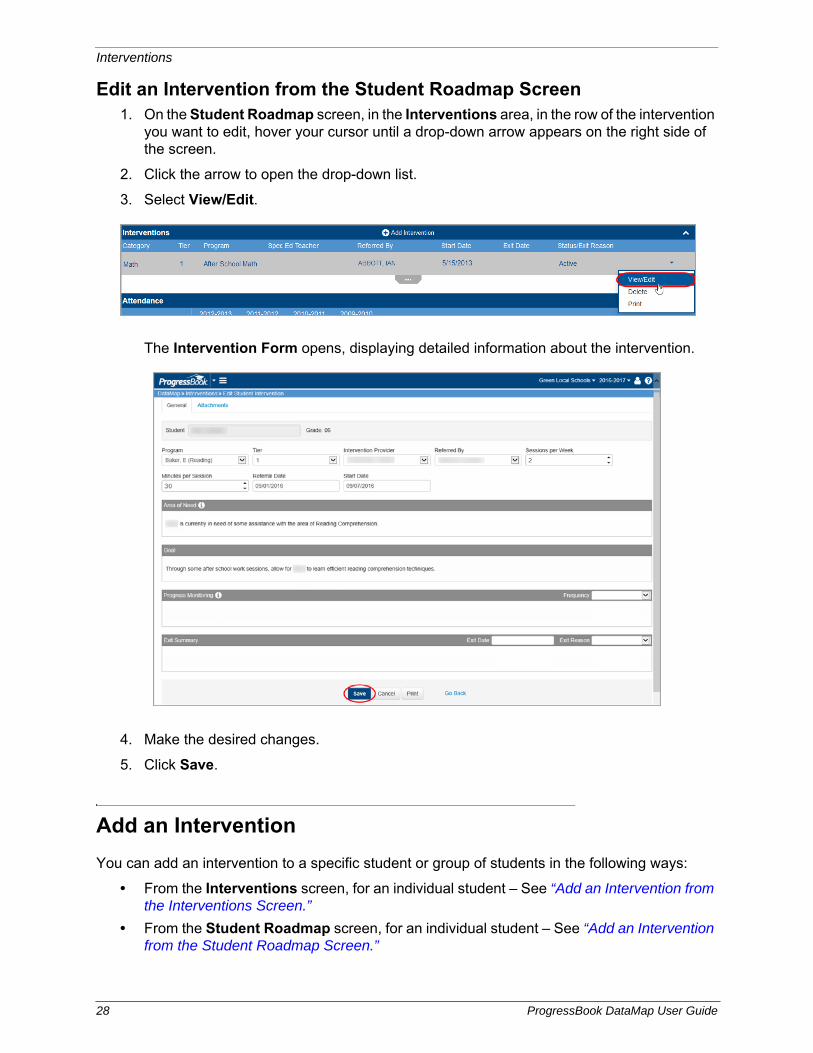
Edit an Intervention from the Student Roadmap Screen1. On the Student Roadmap screen, in the Interventions area, in the row of the intervention
you want to edit, hover your cursor until a drop-down arrow appears on the right side of the screen.
2. Click the arrow to open the drop-down list.
3. Select View/Edit.
The Intervention Form opens, displaying detailed information about the intervention.
4. Make the desired changes.
5. Click Save.
Add an Intervention
You can add an intervention to a specific student or group of students in the following ways:
• From the Interventions screen, for an individual student – See “Add an Intervention from the Interventions Screen.”
• From the Student Roadmap screen, for an individual student – See “Add an Intervention from the Student Roadmap Screen.”
28 ProgressBook DataMap User Guide
Interventions
• From the Standards, Students, or Data Points screen, for a group of students – See “Add a Bulk Intervention”
Add an Intervention from the Interventions ScreenIf the student to whom you want to add an intervention is listed on the Interventions screen, follow “Method 1.” If the student is not listed, follow “Method 2.”
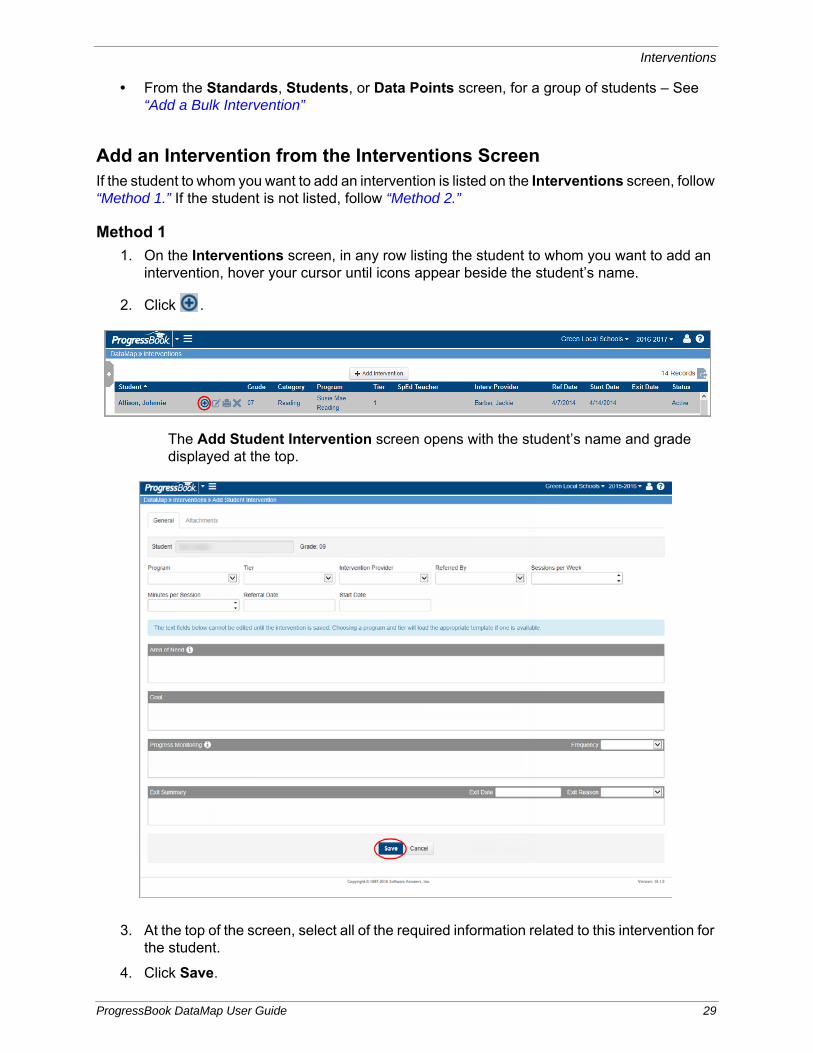
Method 1
1. On the Interventions screen, in any row listing the student to whom you want to add an intervention, hover your cursor until icons appear beside the student’s name.
2. Click .
The Add Student Intervention screen opens with the student’s name and grade displayed at the top.
3. At the top of the screen, select all of the required information related to this intervention for the student.
4. Click Save.
ProgressBook DataMap User Guide 29
Interventions
5. At the bottom of the screen, edit the fields with the information related to this intervention for the student.
6. Click Save.
Note: After you have saved the intervention, an Attachments tab at the top of the Add Student Intervention screen is activated. If you want to add an attachment to the intervention, see “Upload an Attachment to an Intervention.”
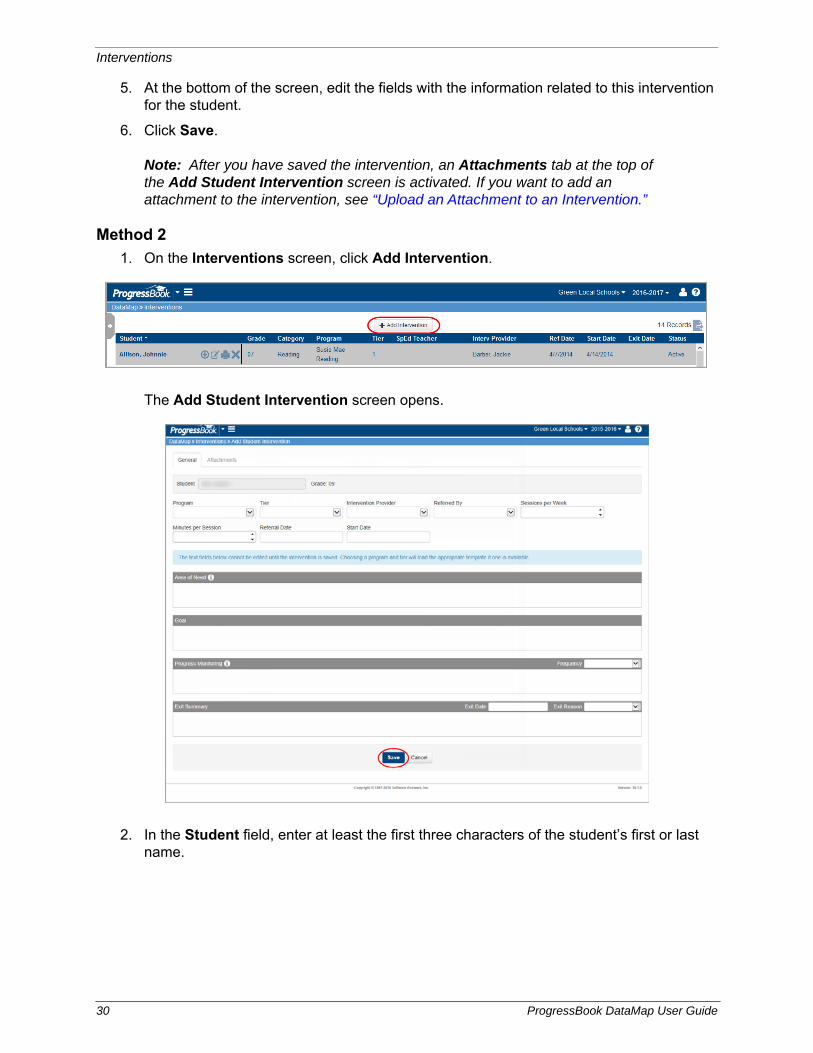
Method 2
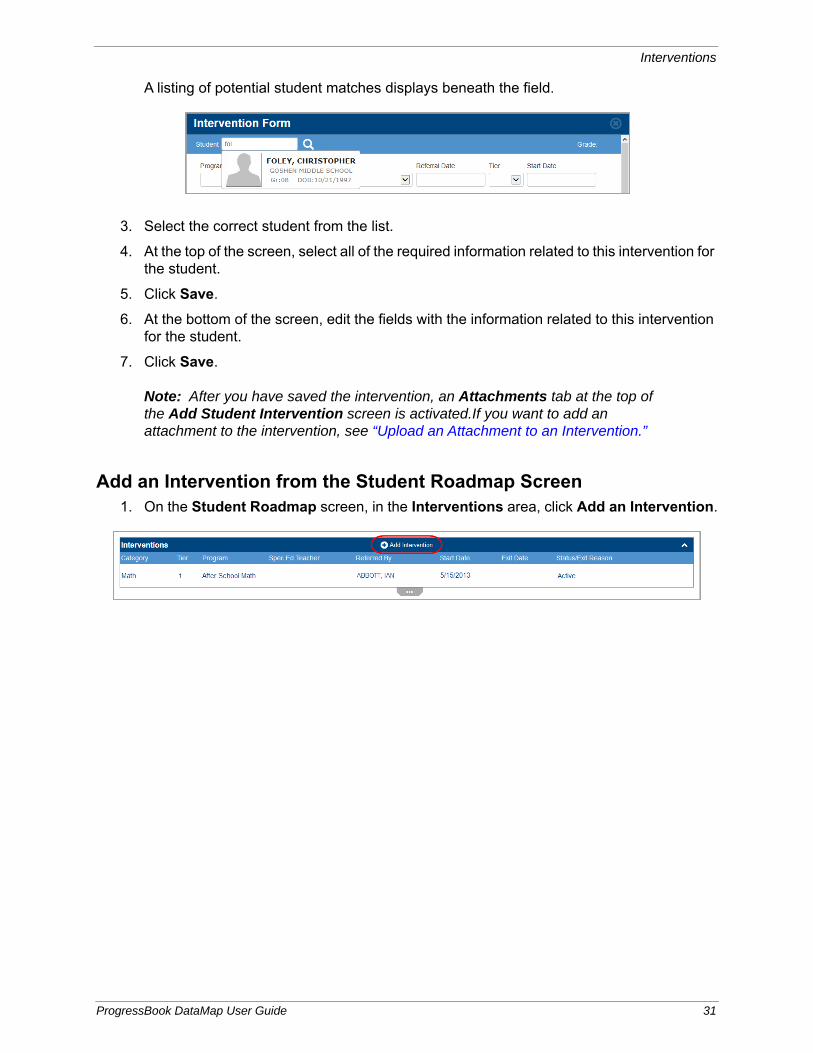
1. On the Interventions screen, click Add Intervention.
The Add Student Intervention screen opens.
2. In the Student field, enter at least the first three characters of the student’s first or last name.
30 ProgressBook DataMap User Guide
Interventions
A listing of potential student matches displays beneath the field.
3. Select the correct student from the list.
4. At the top of the screen, select all of the required information related to this intervention for the student.
5. Click Save.
6. At the bottom of the screen, edit the fields with the information related to this intervention for the student.
7. Click Save.
Note: After you have saved the intervention, an Attachments tab at the top of the Add Student Intervention screen is activated.If you want to add an attachment to the intervention, see “Upload an Attachment to an Intervention.”
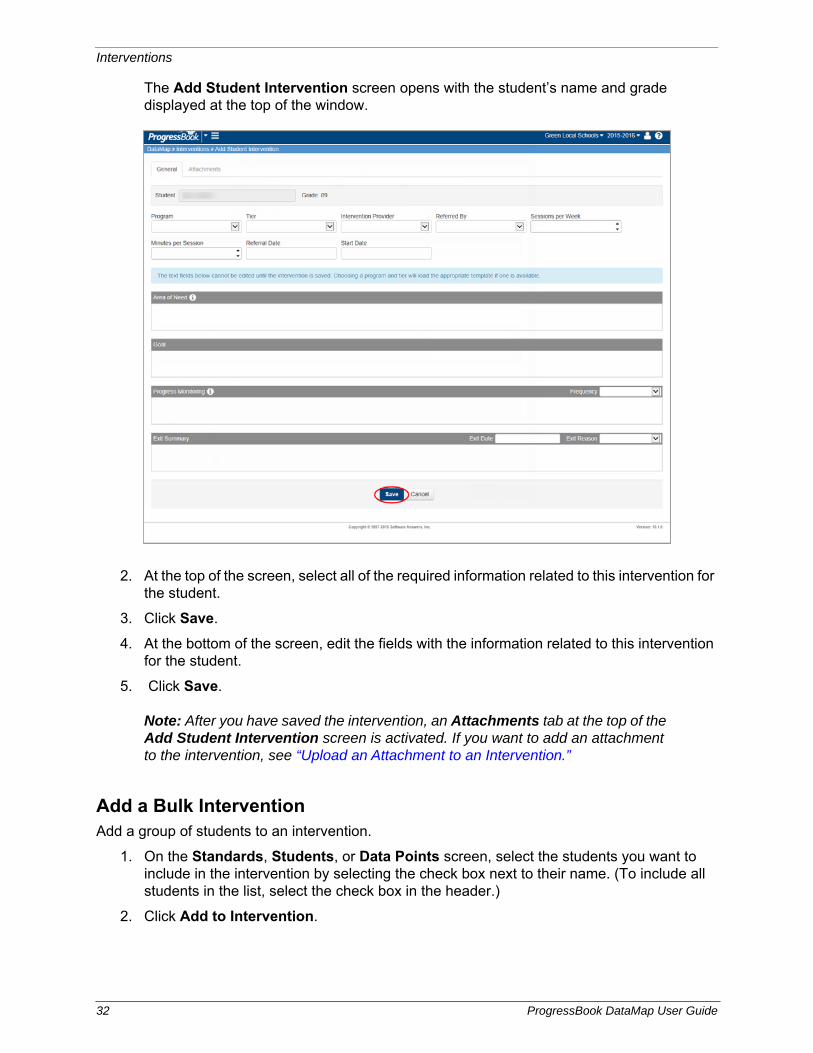
Add an Intervention from the Student Roadmap Screen1. On the Student Roadmap screen, in the Interventions area, click Add an Intervention.
ProgressBook DataMap User Guide 31
Interventions
The Add Student Intervention screen opens with the student’s name and grade displayed at the top of the window.
2. At the top of the screen, select all of the required information related to this intervention for the student.
3. Click Save.
4. At the bottom of the screen, edit the fields with the information related to this intervention for the student.
5. Click Save.
Note: After you have saved the intervention, an Attachments tab at the top of the Add Student Intervention screen is activated. If you want to add an attachment to the intervention, see “Upload an Attachment to an Intervention.”
Add a Bulk InterventionAdd a group of students to an intervention.
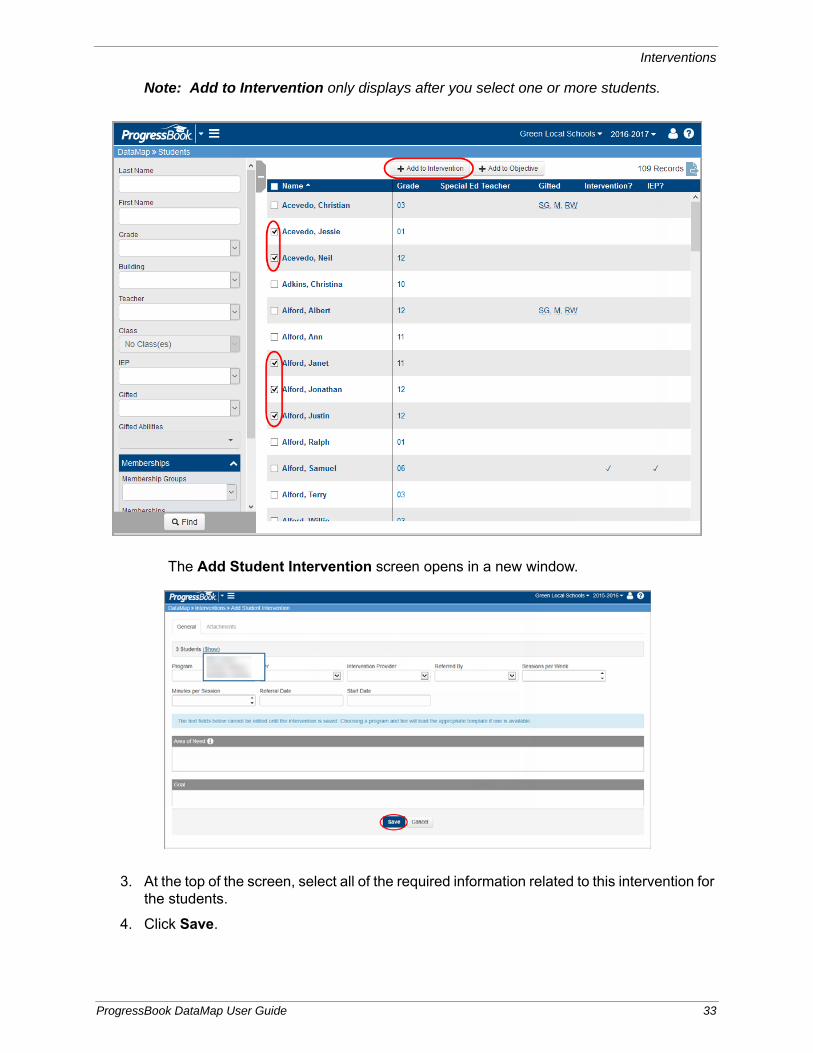
1. On the Standards, Students, or Data Points screen, select the students you want to include in the intervention by selecting the check box next to their name. (To include all students in the list, select the check box in the header.)
2. Click Add to Intervention.
32 ProgressBook DataMap User Guide
Interventions
Note: Add to Intervention only displays after you select one or more students.
The Add Student Intervention screen opens in a new window.
3. At the top of the screen, select all of the required information related to this intervention for the students.
4. Click Save.
ProgressBook DataMap User Guide 33
Interventions
5. At the bottom of the screen, edit the fields with the information related to this intervention for the students.
6. Click Save.
Add and Manage Intervention Attachments
If you want to add supplemental information to an intervention, you can upload attachments. After you have uploaded files, you can view or delete them as needed. Refer to the appropriate topic:
• “Upload an Attachment to an Intervention”
• “Download and View an Intervention Attachment”
• “Delete an Intervention Attachment”
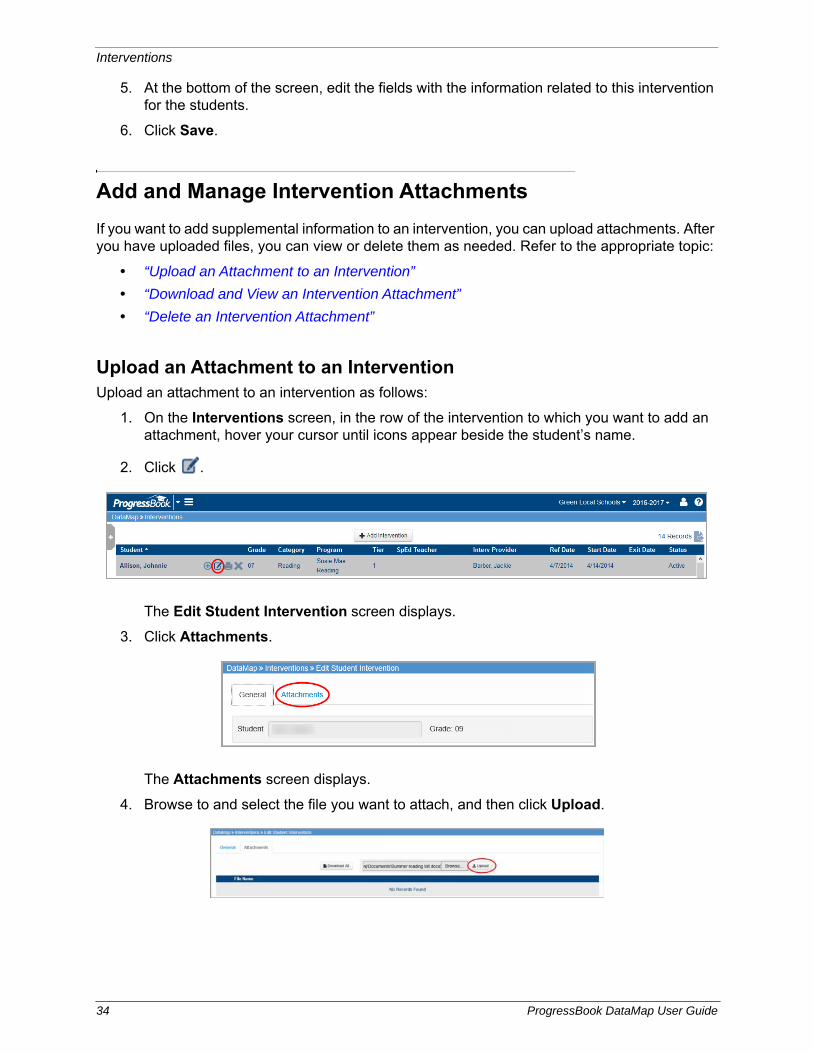
Upload an Attachment to an InterventionUpload an attachment to an intervention as follows:
1. On the Interventions screen, in the row of the intervention to which you want to add an attachment, hover your cursor until icons appear beside the student’s name.
2. Click .
The Edit Student Intervention screen displays.
3. Click Attachments.
The Attachments screen displays.
4. Browse to and select the file you want to attach, and then click Upload.
34 ProgressBook DataMap User Guide
Interventions
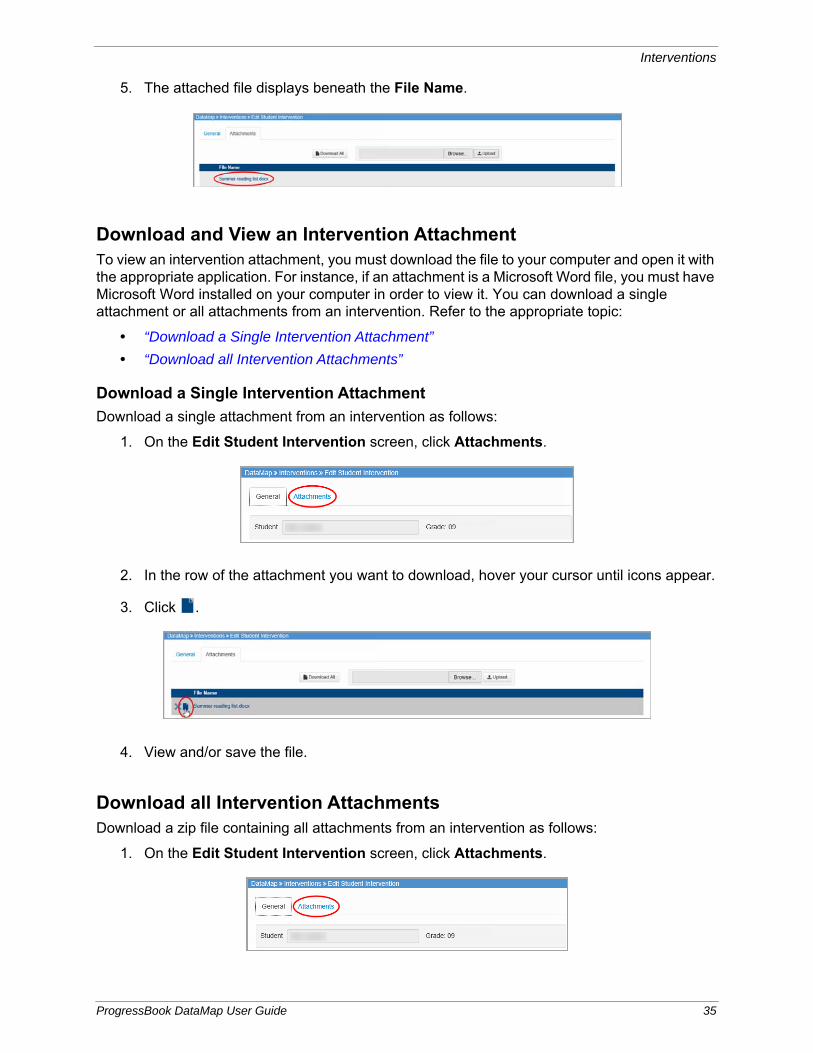
5. The attached file displays beneath the File Name.
Download and View an Intervention AttachmentTo view an intervention attachment, you must download the file to your computer and open it with the appropriate application. For instance, if an attachment is a Microsoft Word file, you must have Microsoft Word installed on your computer in order to view it. You can download a single attachment or all attachments from an intervention. Refer to the appropriate topic:
• “Download a Single Intervention Attachment”
• “Download all Intervention Attachments”
Download a Single Intervention Attachment
Download a single attachment from an intervention as follows:
1. On the Edit Student Intervention screen, click Attachments.
2. In the row of the attachment you want to download, hover your cursor until icons appear.
3. Click .
4. View and/or save the file.
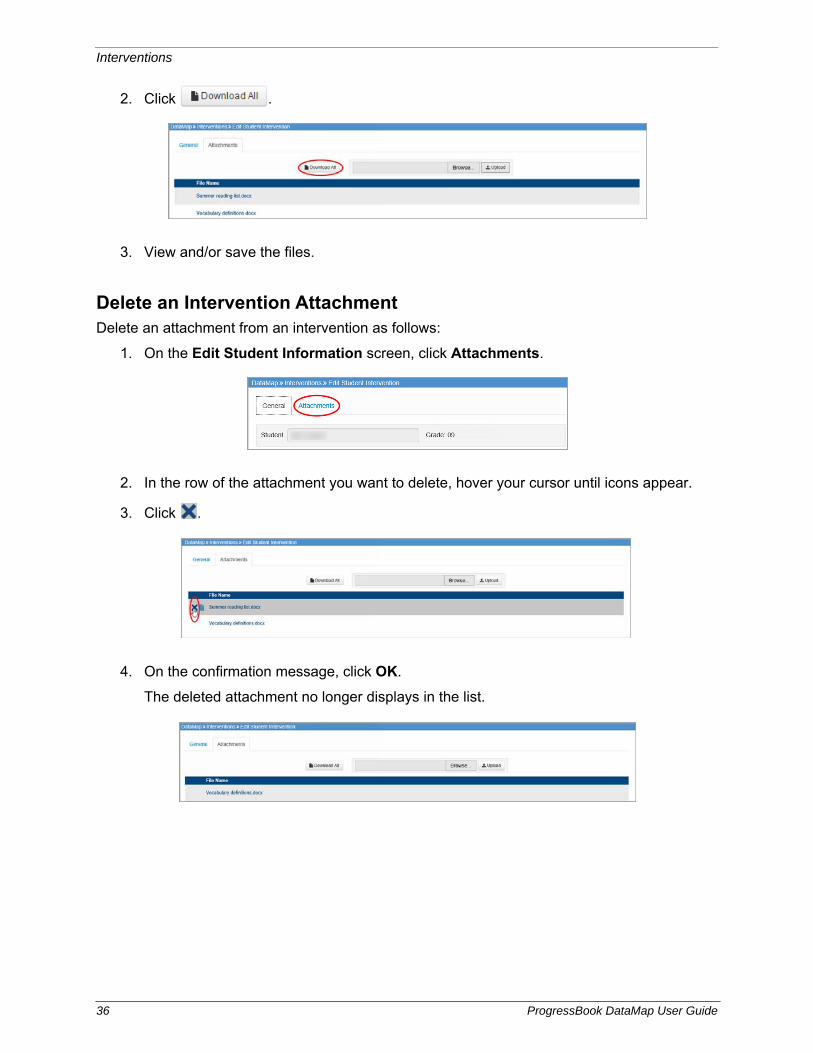
Download all Intervention AttachmentsDownload a zip file containing all attachments from an intervention as follows:
1. On the Edit Student Intervention screen, click Attachments.
ProgressBook DataMap User Guide 35
Interventions
2. Click .
3. View and/or save the files.
Delete an Intervention AttachmentDelete an attachment from an intervention as follows:
1. On the Edit Student Information screen, click Attachments.
2. In the row of the attachment you want to delete, hover your cursor until icons appear.
3. Click .
4. On the confirmation message, click OK.
The deleted attachment no longer displays in the list.
36 ProgressBook DataMap User Guide
Interventions
Delete an Intervention
You can permanently delete an intervention for a specific student in the following ways:
• From the Interventions screen – See “Delete an Intervention from the Interventions Screen.”
• From the Student Roadmap screen – See “Delete an Intervention from the Student Roadmap Screen.”
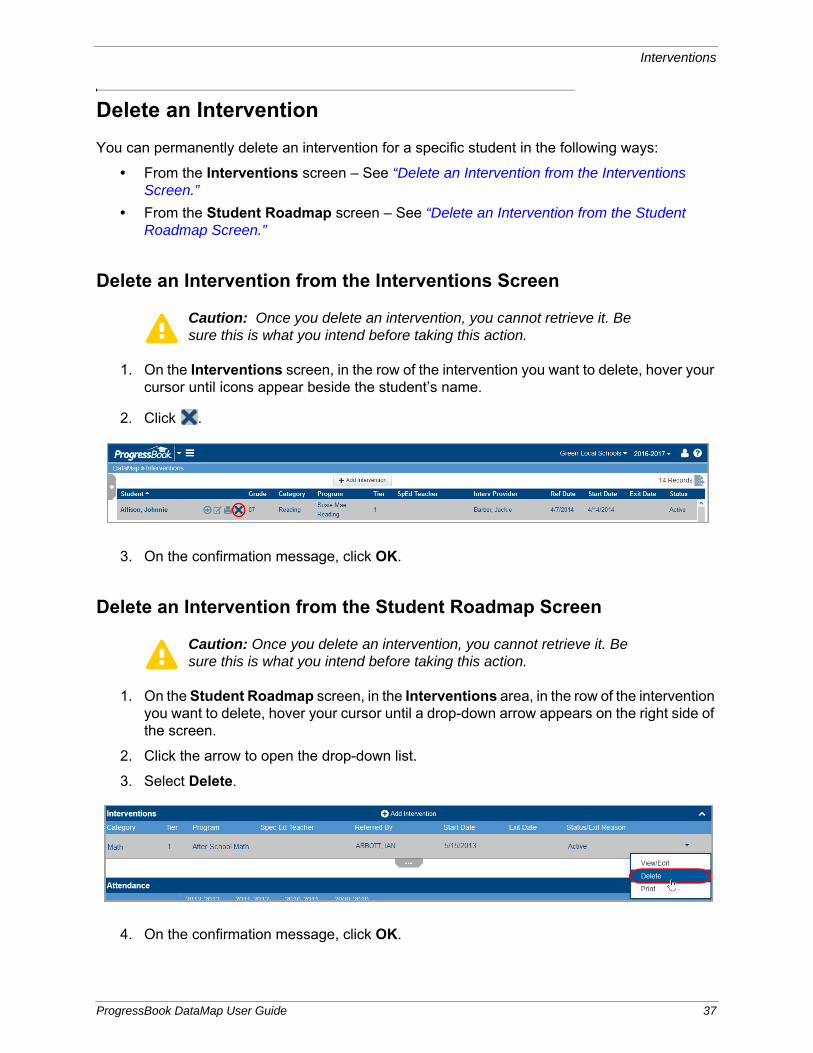
Delete an Intervention from the Interventions Screen
1. On the Interventions screen, in the row of the intervention you want to delete, hover your cursor until icons appear beside the student’s name.
2. Click .
3. On the confirmation message, click OK.
Delete an Intervention from the Student Roadmap Screen
1. On the Student Roadmap screen, in the Interventions area, in the row of the intervention you want to delete, hover your cursor until a drop-down arrow appears on the right side of the screen.
2. Click the arrow to open the drop-down list.
3. Select Delete.
4. On the confirmation message, click OK.
Caution: Once you delete an intervention, you cannot retrieve it. Be sure this is what you intend before taking this action.
Caution: Once you delete an intervention, you cannot retrieve it. Be sure this is what you intend before taking this action.
ProgressBook DataMap User Guide 37
Interventions
Print an Intervention
You can print details of an intervention in the following ways:
• From the Interventions screen – See “Print an Intervention from the Interventions Screen.”
• From the Student Roadmap screen – See “Print an Intervention from the Student Roadmap Screen.”
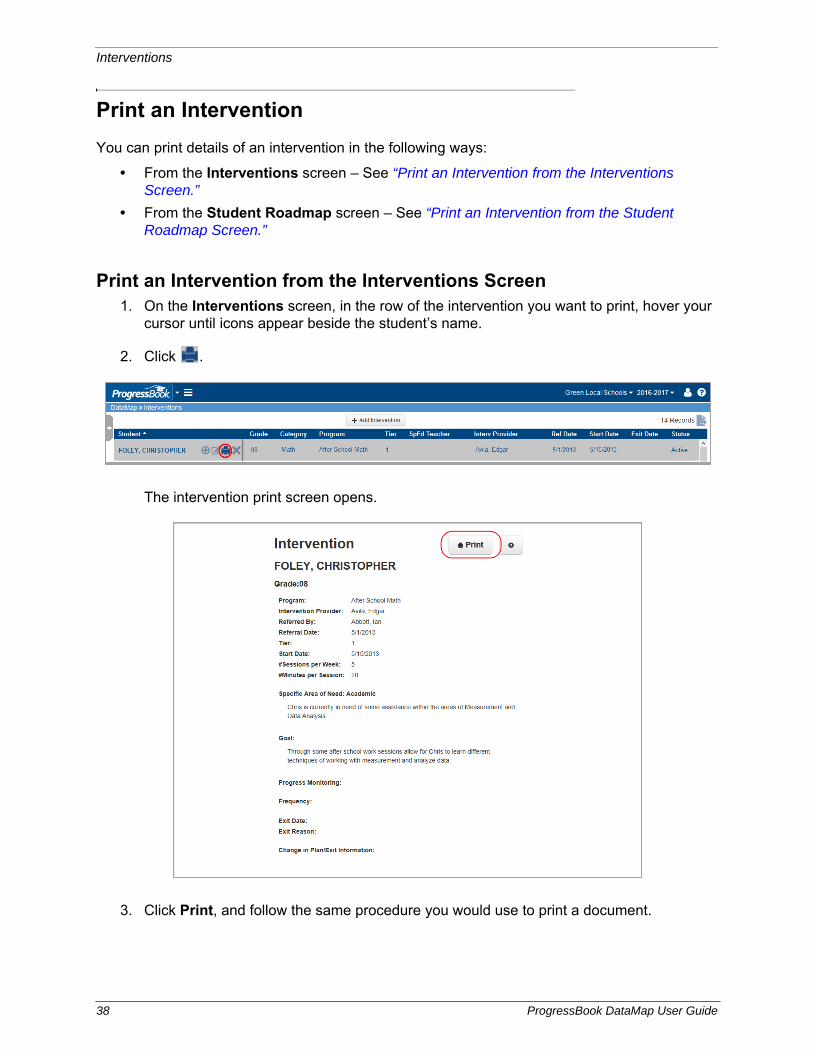
Print an Intervention from the Interventions Screen1. On the Interventions screen, in the row of the intervention you want to print, hover your
cursor until icons appear beside the student’s name.
2. Click .
The intervention print screen opens.
3. Click Print, and follow the same procedure you would use to print a document.
38 ProgressBook DataMap User Guide
Interventions
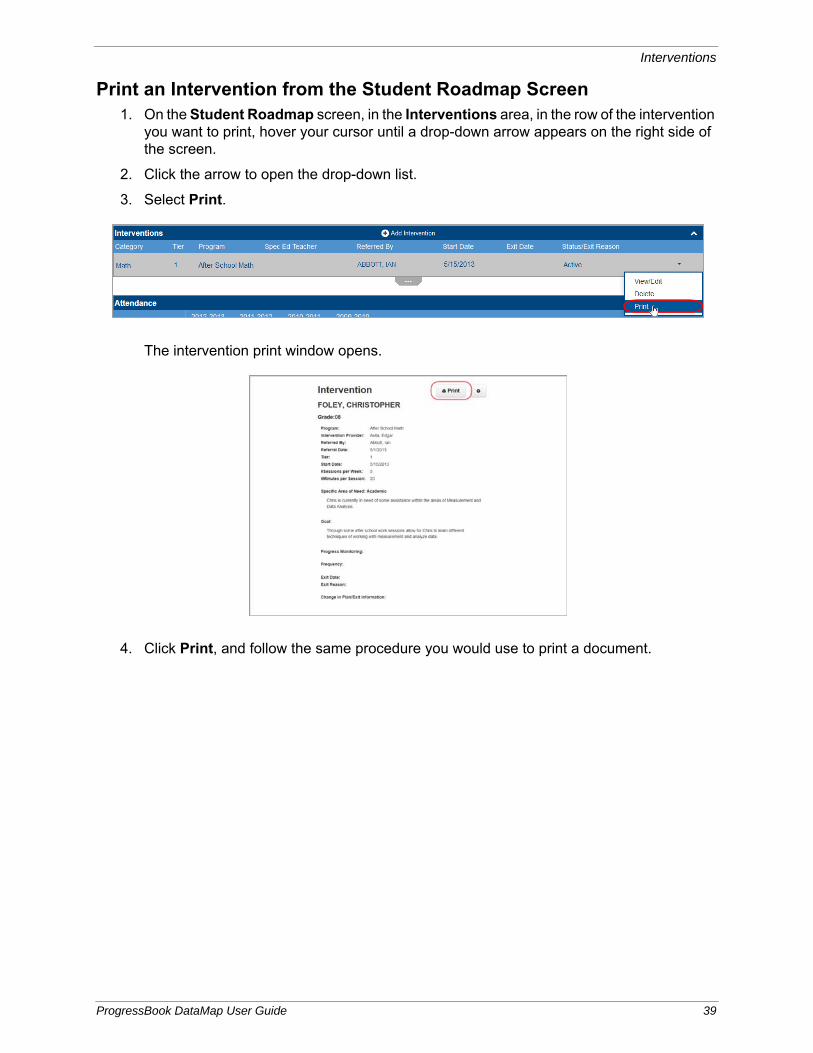
Print an Intervention from the Student Roadmap Screen1. On the Student Roadmap screen, in the Interventions area, in the row of the intervention
you want to print, hover your cursor until a drop-down arrow appears on the right side of the screen.
2. Click the arrow to open the drop-down list.
3. Select Print.
The intervention print window opens.
4. Click Print, and follow the same procedure you would use to print a document.
ProgressBook DataMap User Guide 39

Interventions
This page intentionally left blank.
40 ProgressBook DataMap User Guide
State Assessments
Using DataMap, you can analyze student scores on state standardized assessments (that is, OAA, OGT, OCBA, and PARCC scores). For specific information on analyzing these scores, refer to the appropriate topic:
• To analyze a group of students, see “Analyze State Assessment Summary.”
• To analyze individual scores and placement, see “Analyze State Assessment Standards.”
Analyze State Assessment Summary
See how a group of students performed on the OAA, OGT, OCBA, or PARCC assessment.
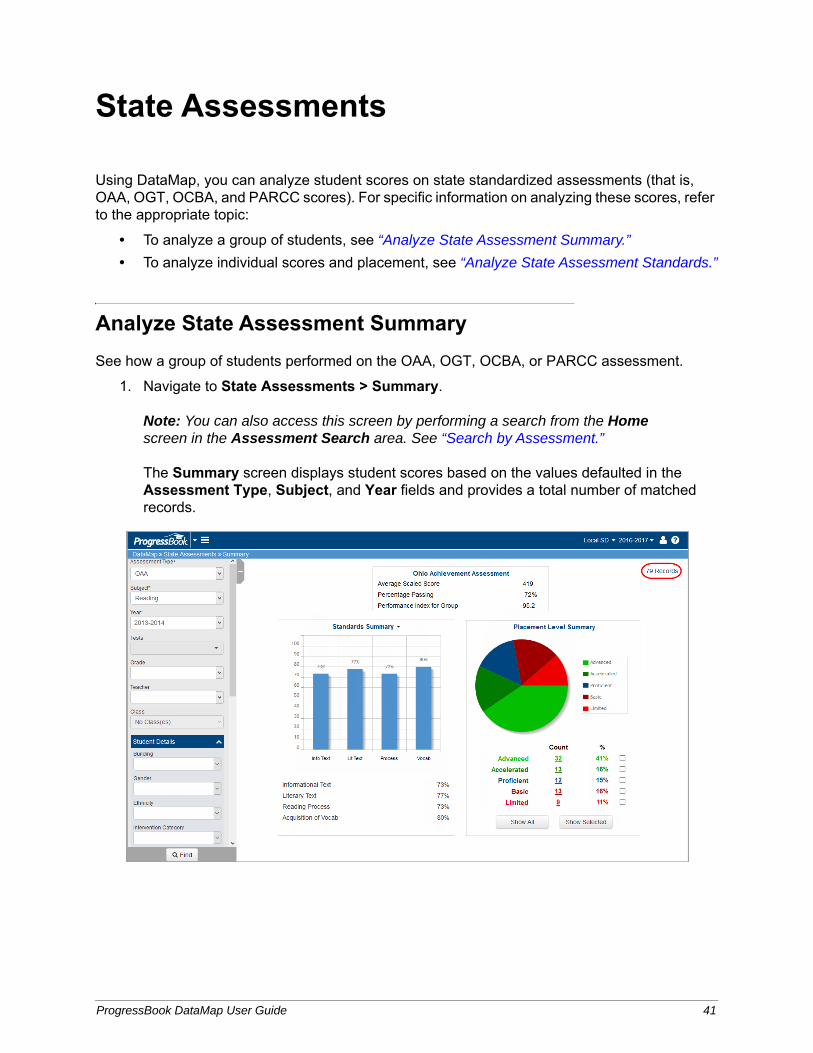
1. Navigate to State Assessments > Summary.
Note: You can also access this screen by performing a search from the Home screen in the Assessment Search area. See “Search by Assessment.”
The Summary screen displays student scores based on the values defaulted in the Assessment Type, Subject, and Year fields and provides a total number of matched records.
ProgressBook DataMap User Guide 41
State Assessments
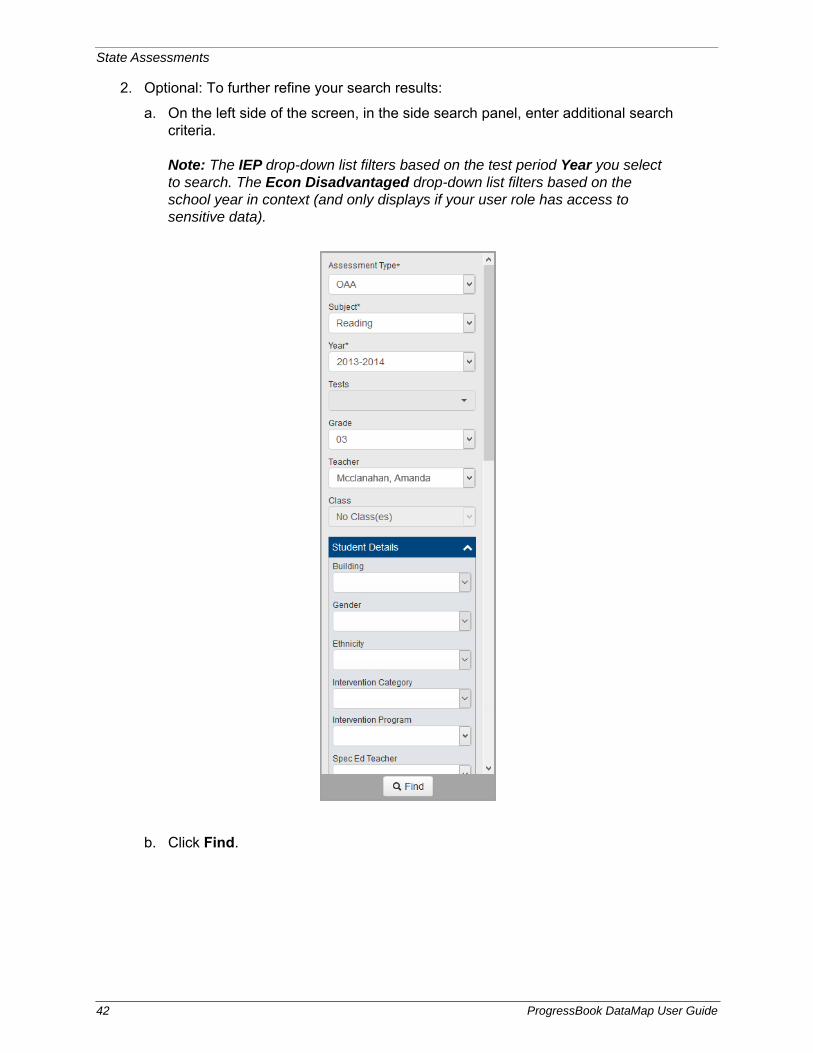
2. Optional: To further refine your search results:
a. On the left side of the screen, in the side search panel, enter additional search criteria.
Note: The IEP drop-down list filters based on the test period Year you select to search. The Econ Disadvantaged drop-down list filters based on the school year in context (and only displays if your user role has access to sensitive data).
b. Click Find.
42 ProgressBook DataMap User Guide
State Assessments
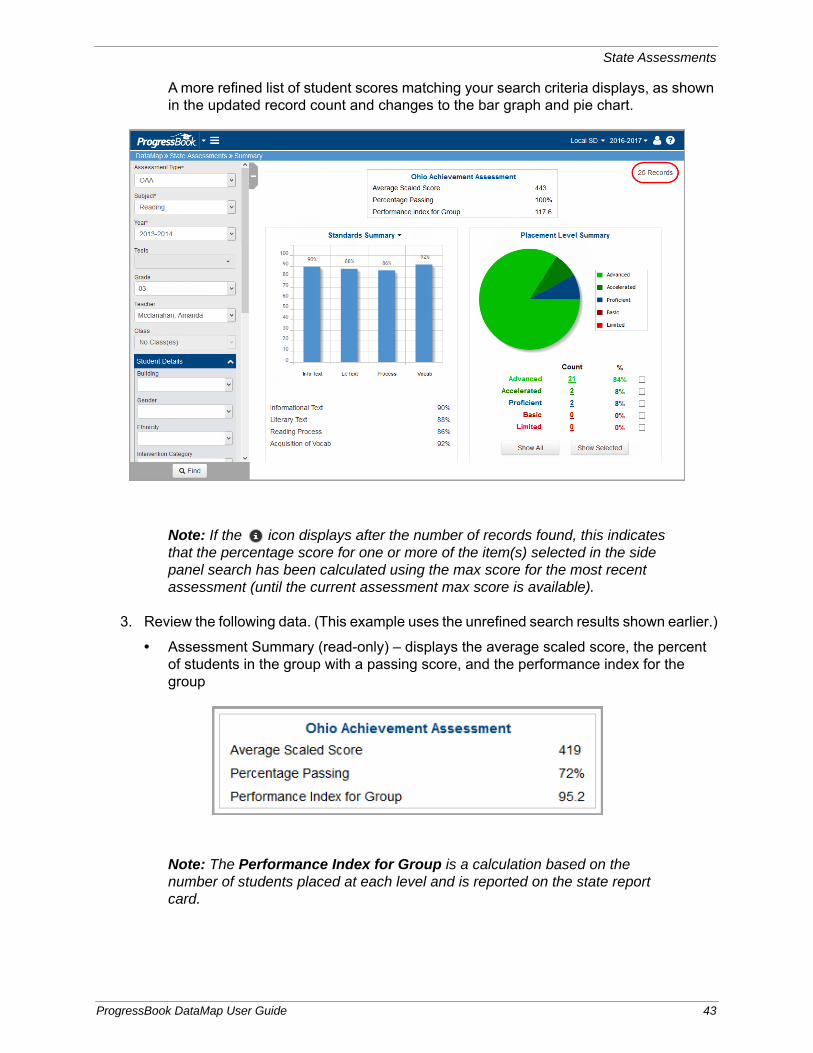
A more refined list of student scores matching your search criteria displays, as shown in the updated record count and changes to the bar graph and pie chart.
Note: If the icon displays after the number of records found, this indicates that the percentage score for one or more of the item(s) selected in the side panel search has been calculated using the max score for the most recent assessment (until the current assessment max score is available).
3. Review the following data. (This example uses the unrefined search results shown earlier.)
• Assessment Summary (read-only) – displays the average scaled score, the percent of students in the group with a passing score, and the performance index for the group
Note: The Performance Index for Group is a calculation based on the number of students placed at each level and is reported on the state report card.
ProgressBook DataMap User Guide 43

State Assessments
• Standards Summary (read-only; available for OAA and OGT) – displays the aggregated percentage score for the selected group in each of the content standard areas, a bar graph illustrating those scores, and the percent of students in the group with a passing score
Note: To view the Indicator Summary, click the arrow next to the Standards Summary title and select Indicator Summary from the drop-down list.
• Indicator Summary (read-only; available for all state tests) – displays the distribution of subarea indicator scores for a particular test
Note: To view the Standards Summary, click the arrow next to the Indicator Summary title and select Standards Summary from the drop-down list.
44 ProgressBook DataMap User Guide
State Assessments
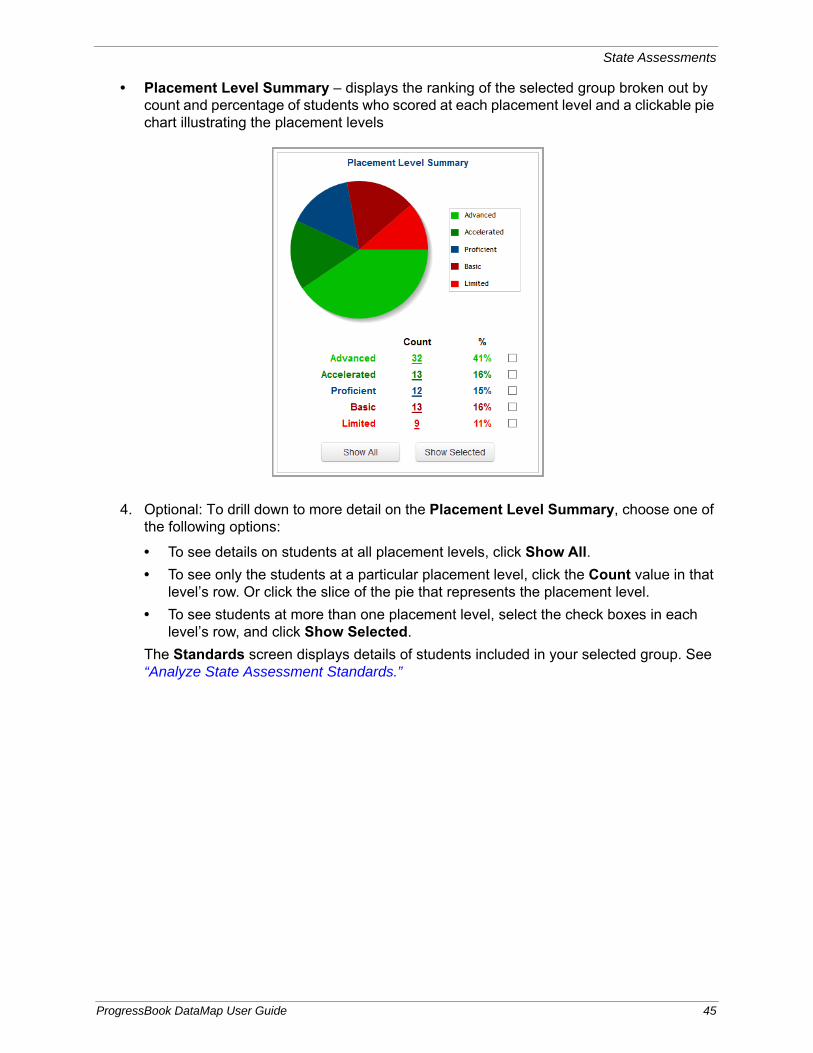
• Placement Level Summary – displays the ranking of the selected group broken out by count and percentage of students who scored at each placement level and a clickable pie chart illustrating the placement levels
4. Optional: To drill down to more detail on the Placement Level Summary, choose one of the following options:
• To see details on students at all placement levels, click Show All.
• To see only the students at a particular placement level, click the Count value in that level’s row. Or click the slice of the pie that represents the placement level.
• To see students at more than one placement level, select the check boxes in each level’s row, and click Show Selected.
The Standards screen displays details of students included in your selected group. See “Analyze State Assessment Standards.”
ProgressBook DataMap User Guide 45
State Assessments
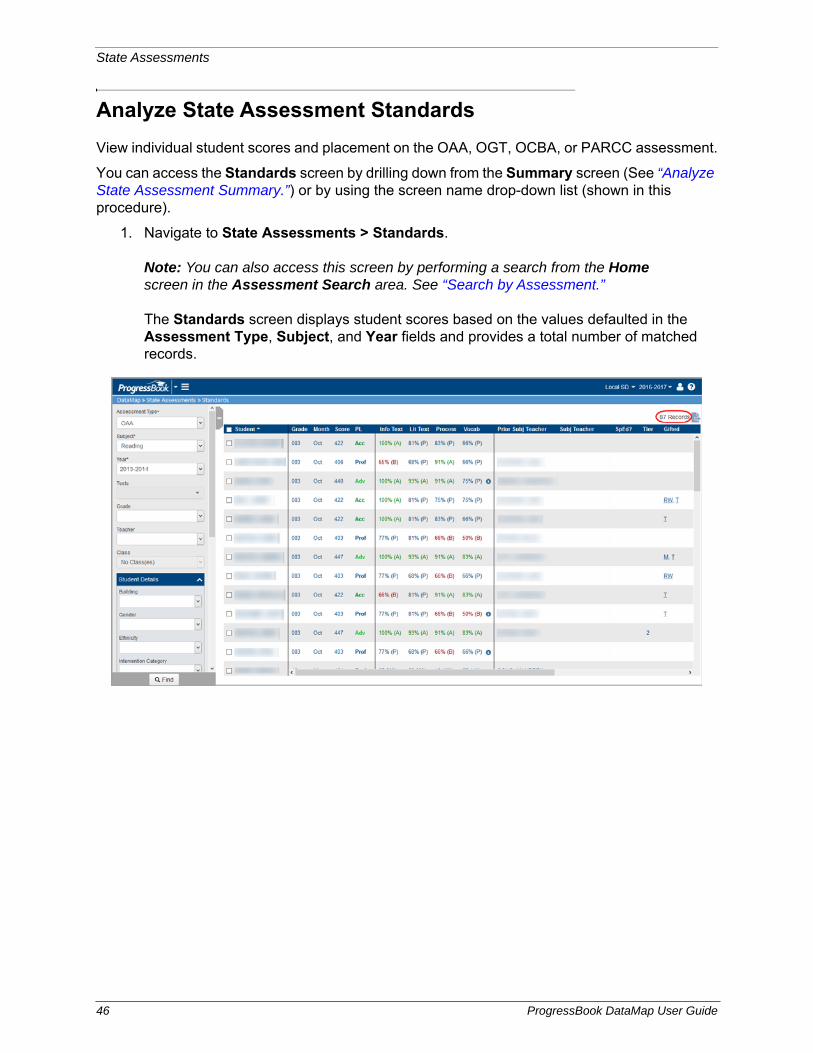
Analyze State Assessment Standards
View individual student scores and placement on the OAA, OGT, OCBA, or PARCC assessment.
You can access the Standards screen by drilling down from the Summary screen (See “Analyze State Assessment Summary.”) or by using the screen name drop-down list (shown in this procedure).
1. Navigate to State Assessments > Standards.
Note: You can also access this screen by performing a search from the Home screen in the Assessment Search area. See “Search by Assessment.”
The Standards screen displays student scores based on the values defaulted in the Assessment Type, Subject, and Year fields and provides a total number of matched records.
46 ProgressBook DataMap User Guide
State Assessments
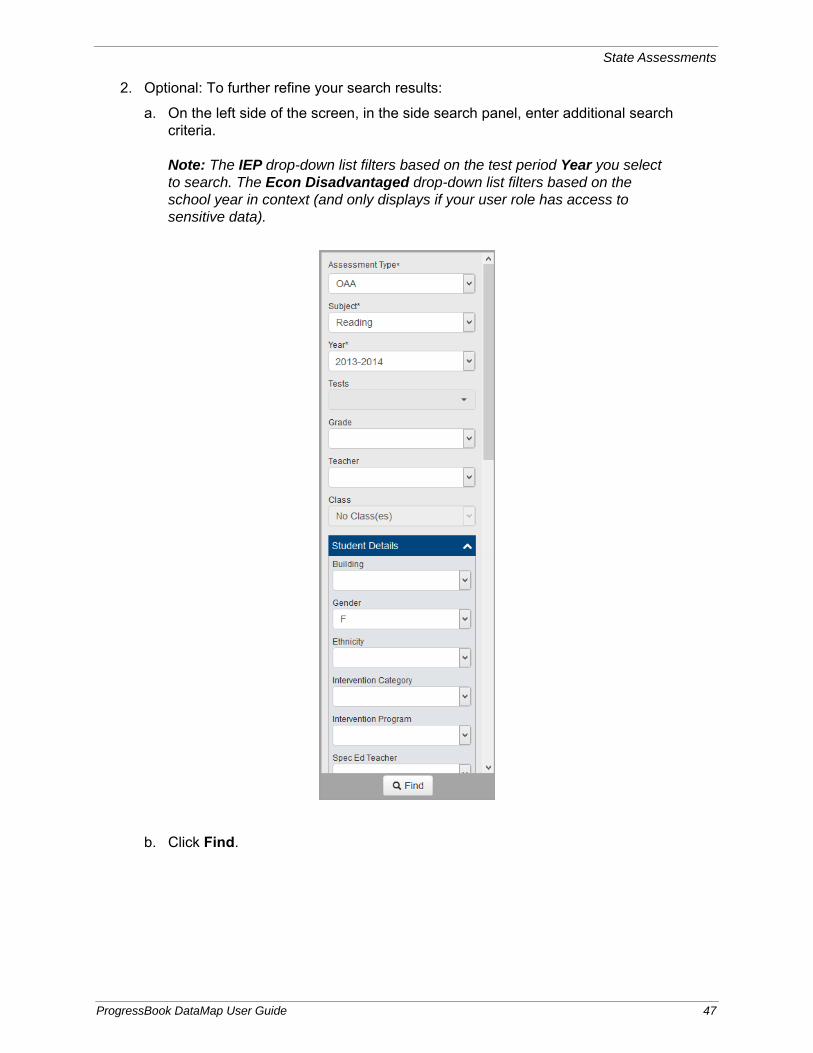
2. Optional: To further refine your search results:
a. On the left side of the screen, in the side search panel, enter additional search criteria.
Note: The IEP drop-down list filters based on the test period Year you select to search. The Econ Disadvantaged drop-down list filters based on the school year in context (and only displays if your user role has access to sensitive data).
b. Click Find.
ProgressBook DataMap User Guide 47
State Assessments
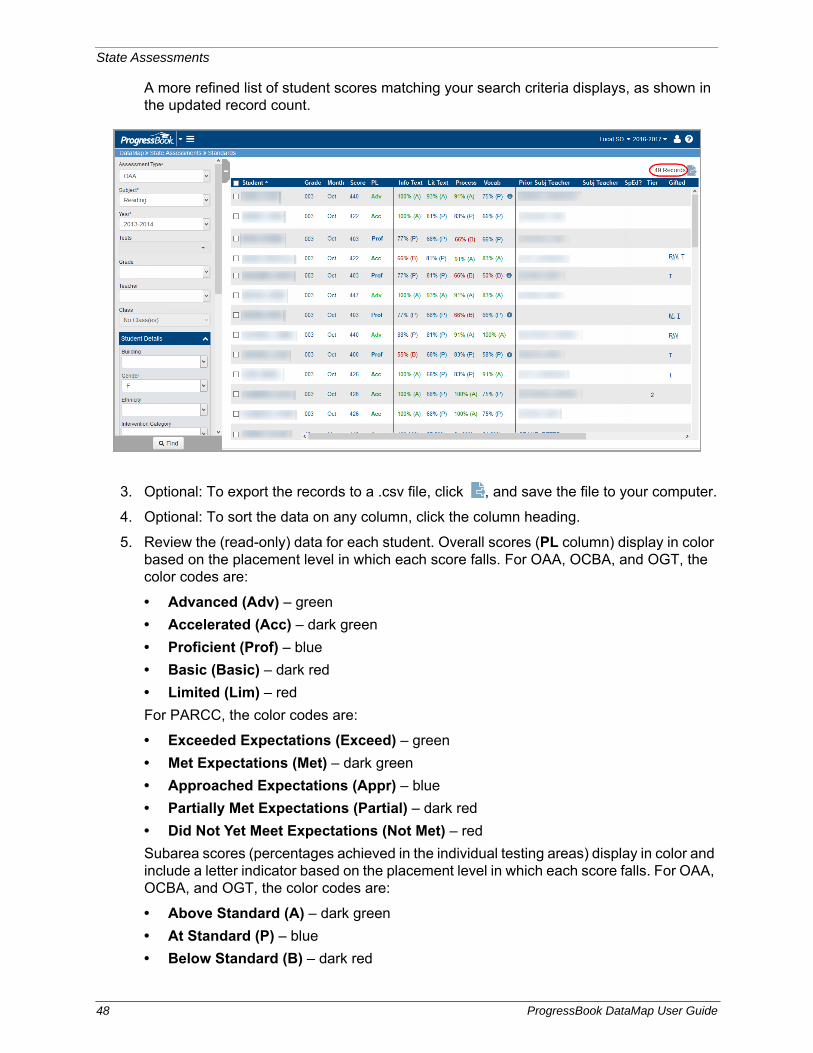
A more refined list of student scores matching your search criteria displays, as shown in the updated record count.
3. Optional: To export the records to a .csv file, click , and save the file to your computer.
4. Optional: To sort the data on any column, click the column heading.
5. Review the (read-only) data for each student. Overall scores (PL column) display in color based on the placement level in which each score falls. For OAA, OCBA, and OGT, the color codes are:
• Advanced (Adv) – green
• Accelerated (Acc) – dark green
• Proficient (Prof) – blue
• Basic (Basic) – dark red
• Limited (Lim) – red
For PARCC, the color codes are:
• Exceeded Expectations (Exceed) – green
• Met Expectations (Met) – dark green
• Approached Expectations (Appr) – blue
• Partially Met Expectations (Partial) – dark red
• Did Not Yet Meet Expectations (Not Met) – red
Subarea scores (percentages achieved in the individual testing areas) display in color and include a letter indicator based on the placement level in which each score falls. For OAA, OCBA, and OGT, the color codes are:
• Above Standard (A) – dark green
• At Standard (P) – blue
• Below Standard (B) – dark red
48 ProgressBook DataMap User Guide
State Assessments
For PARCC, the color codes are:
• At/Above Standard – dark green
• Near Standard – blue
• Below Standard – dark red
Note: If the icon displays after a student’s test scores, this indicates that the student’s percentage score has been calculated using the max score for the most recent assessment (until the current assessment max score is available).
Note: The PBA (Performance Based Assessment) and EOY (End of Year) columns that display for the OCBA contain a check mark if the student has taken each of these assessments.
ProgressBook DataMap User Guide 49

State Assessments
This page intentionally left blank.
50 ProgressBook DataMap User Guide
Data Points
Using DataMap, you can analyze how students performed on third-party, district, and state assessments (other than OAA and OGT). For information on analyzing these scores, see “Analyze Data Points.”
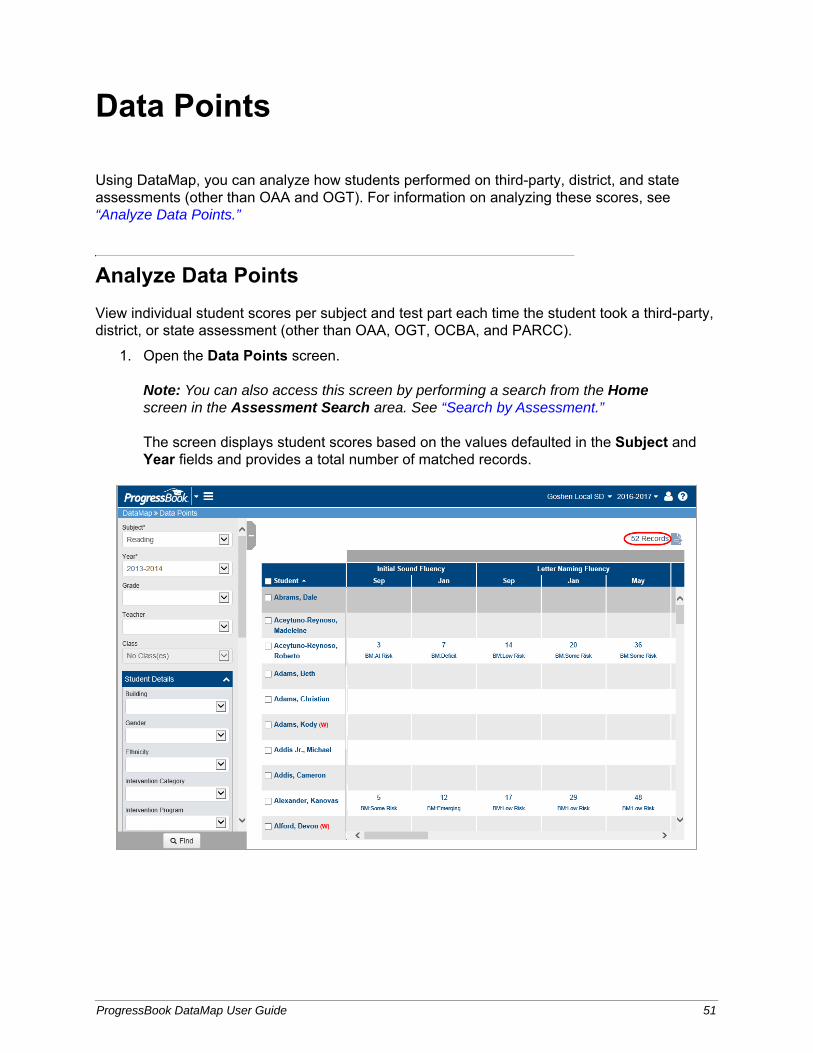
Analyze Data Points
View individual student scores per subject and test part each time the student took a third-party, district, or state assessment (other than OAA, OGT, OCBA, and PARCC).
1. Open the Data Points screen.
Note: You can also access this screen by performing a search from the Home screen in the Assessment Search area. See “Search by Assessment.”
The screen displays student scores based on the values defaulted in the Subject and Year fields and provides a total number of matched records.
ProgressBook DataMap User Guide 51
Data Points
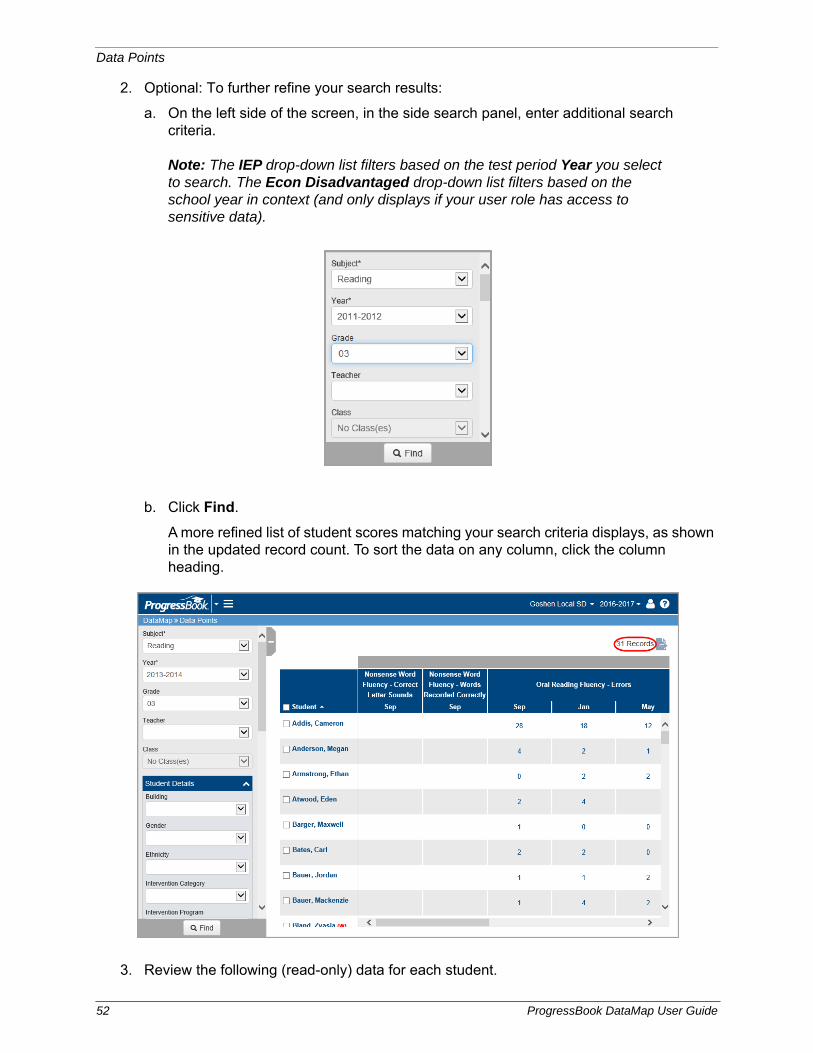
2. Optional: To further refine your search results:
a. On the left side of the screen, in the side search panel, enter additional search criteria.
Note: The IEP drop-down list filters based on the test period Year you select to search. The Econ Disadvantaged drop-down list filters based on the school year in context (and only displays if your user role has access to sensitive data).
b. Click Find.
A more refined list of student scores matching your search criteria displays, as shown in the updated record count. To sort the data on any column, click the column heading.
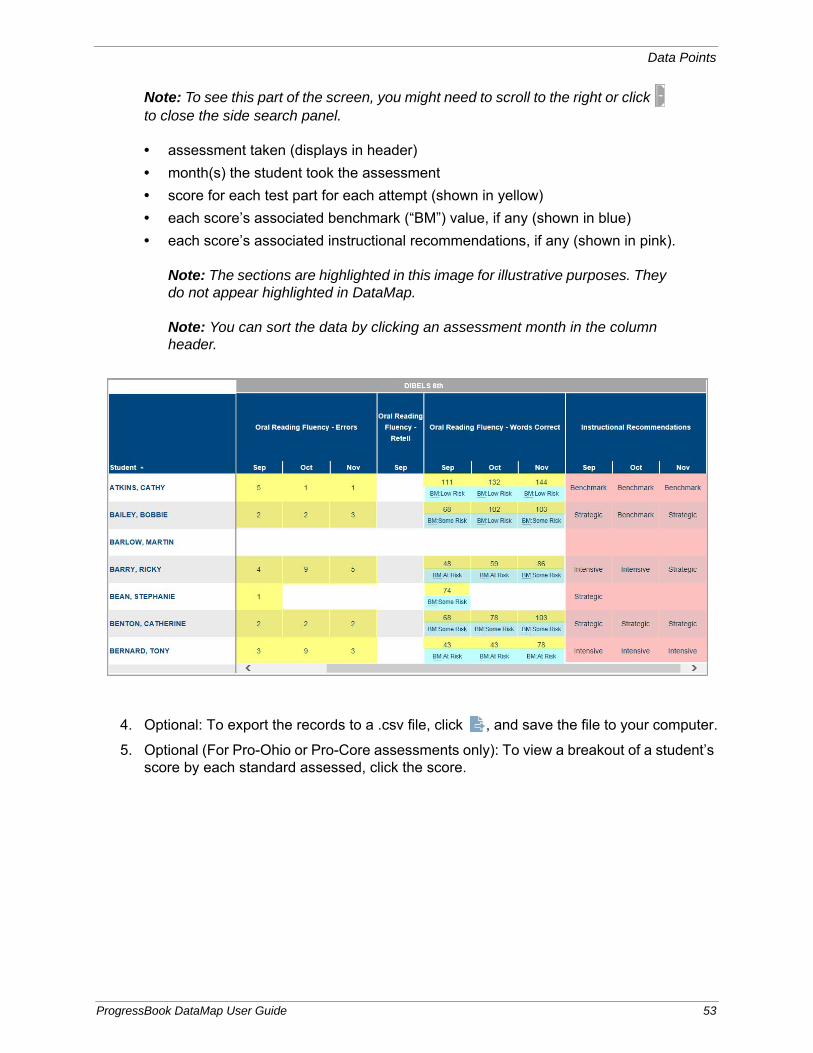
3. Review the following (read-only) data for each student.
52 ProgressBook DataMap User Guide
Data Points
Note: To see this part of the screen, you might need to scroll to the right or click to close the side search panel.
• assessment taken (displays in header)
• month(s) the student took the assessment
• score for each test part for each attempt (shown in yellow)
• each score’s associated benchmark (“BM”) value, if any (shown in blue)
• each score’s associated instructional recommendations, if any (shown in pink).
Note: The sections are highlighted in this image for illustrative purposes. They do not appear highlighted in DataMap.
Note: You can sort the data by clicking an assessment month in the column header.
4. Optional: To export the records to a .csv file, click , and save the file to your computer.
5. Optional (For Pro-Ohio or Pro-Core assessments only): To view a breakout of a student’s score by each standard assessed, click the score.
ProgressBook DataMap User Guide 53
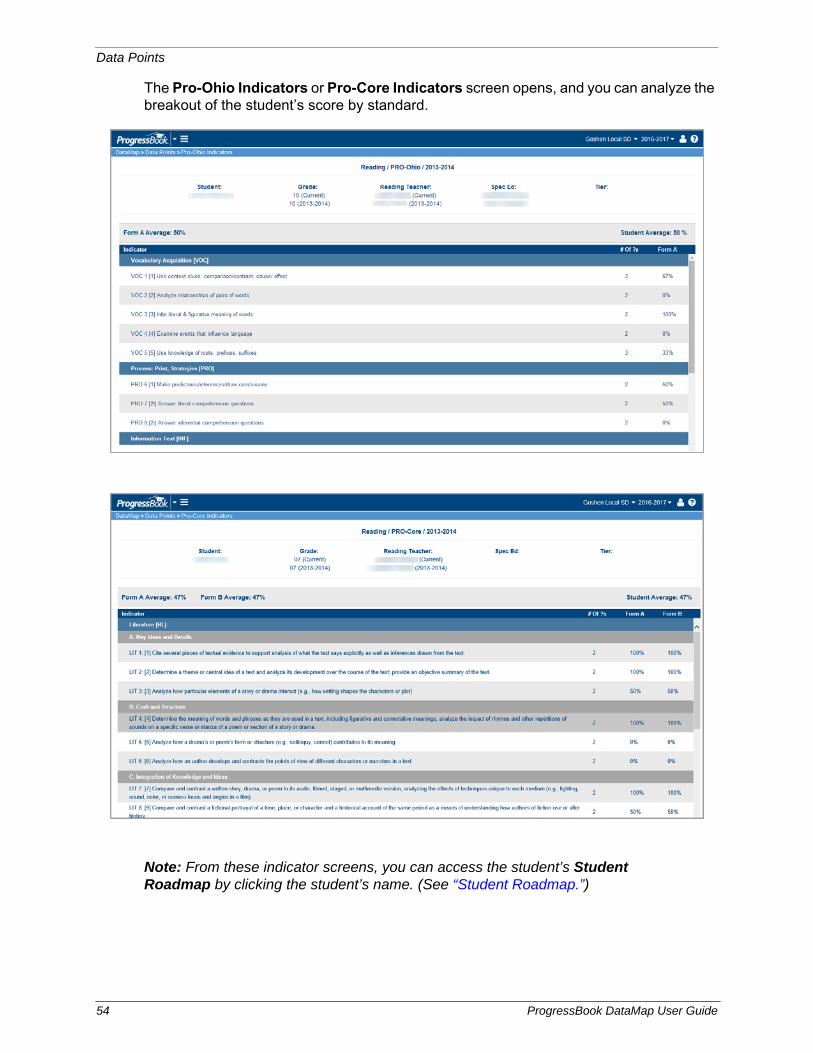
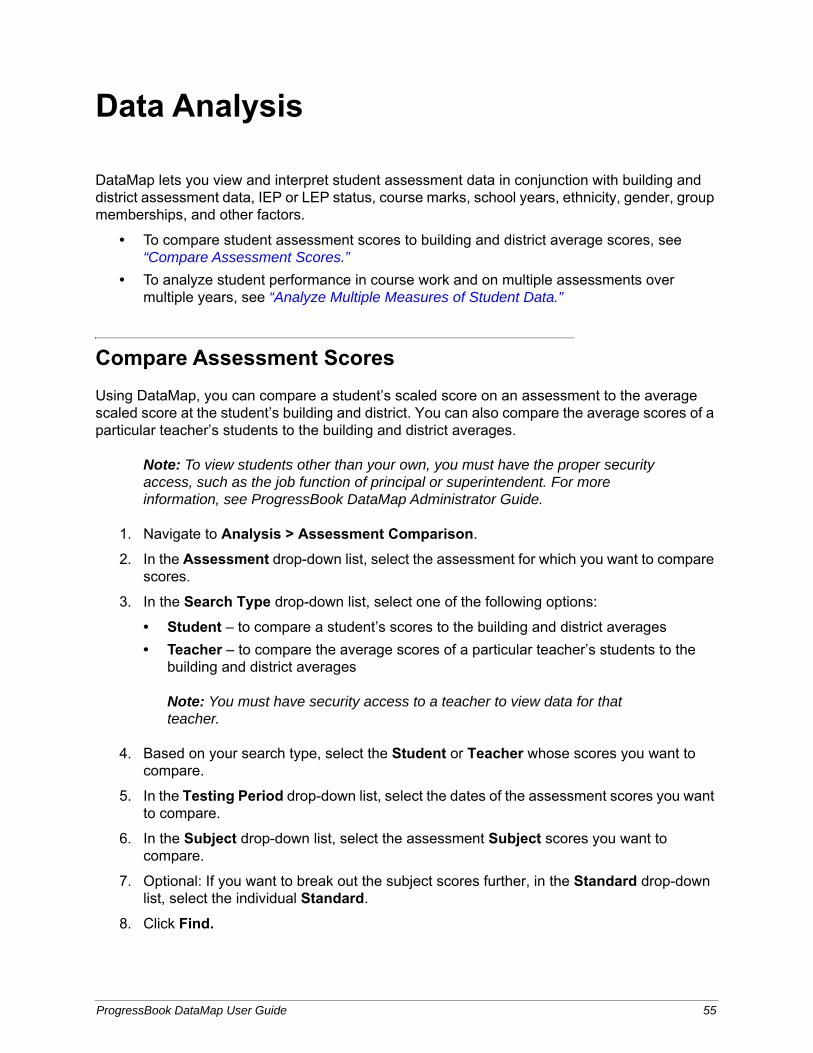
Data Points
The Pro-Ohio Indicators or Pro-Core Indicators screen opens, and you can analyze the breakout of the student’s score by standard.
Note: From these indicator screens, you can access the student’s Student Roadmap by clicking the student’s name. (See “Student Roadmap.”)
54 ProgressBook DataMap User Guide
Data Analysis
DataMap lets you view and interpret student assessment data in conjunction with building and district assessment data, IEP or LEP status, course marks, school years, ethnicity, gender, group memberships, and other factors.
• To compare student assessment scores to building and district average scores, see “Compare Assessment Scores.”
• To analyze student performance in course work and on multiple assessments over multiple years, see “Analyze Multiple Measures of Student Data.”
Compare Assessment Scores
Using DataMap, you can compare a student’s scaled score on an assessment to the average scaled score at the student’s building and district. You can also compare the average scores of a particular teacher’s students to the building and district averages.
Note: To view students other than your own, you must have the proper security access, such as the job function of principal or superintendent. For more information, see ProgressBook DataMap Administrator Guide.
1. Navigate to Analysis > Assessment Comparison.
2. In the Assessment drop-down list, select the assessment for which you want to compare scores.
3. In the Search Type drop-down list, select one of the following options:
• Student – to compare a student’s scores to the building and district averages
• Teacher – to compare the average scores of a particular teacher’s students to the building and district averages
Note: You must have security access to a teacher to view data for that teacher.
4. Based on your search type, select the Student or Teacher whose scores you want to compare.
5. In the Testing Period drop-down list, select the dates of the assessment scores you want to compare.
6. In the Subject drop-down list, select the assessment Subject scores you want to compare.
7. Optional: If you want to break out the subject scores further, in the Standard drop-down list, select the individual Standard.
8. Click Find.
ProgressBook DataMap User Guide 55
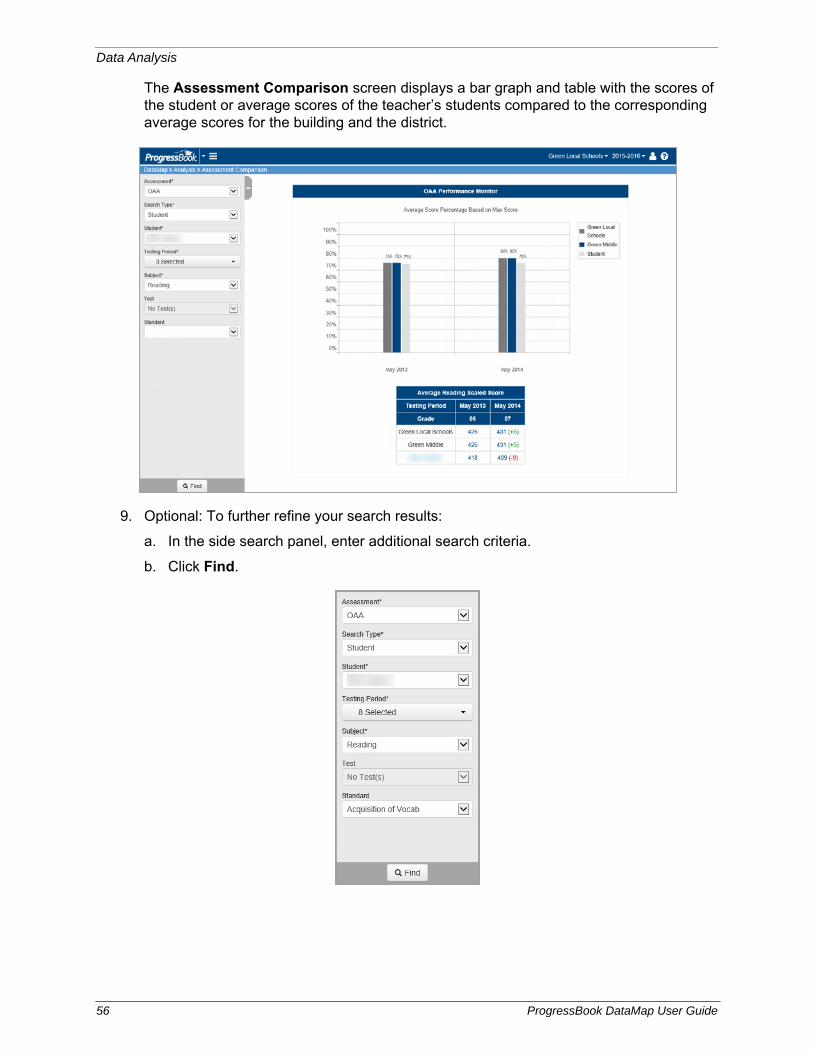
Data Analysis
The Assessment Comparison screen displays a bar graph and table with the scores of the student or average scores of the teacher’s students compared to the corresponding average scores for the building and the district.
9. Optional: To further refine your search results:
a. In the side search panel, enter additional search criteria.
b. Click Find.
56 ProgressBook DataMap User Guide

Data Analysis
A more refined list of assessment scores matching your search criteria displays, as shown in the changes to the bar graph and chart.
10. Review the following data that appears in the bar graph for the student or teacher, building, and district:
• The percentage based on maximum score for the District displays in dark gray. DataMap calculates the average scaled score of the students in the district and divides that score by the maximum possible score to determine a percentage.
ProgressBook DataMap User Guide 57
Data Analysis
• The percentage based on maximum score for the Building displays in shades of blue depending on how many buildings that student attends/has attended. DataMap calculates the average scaled score of the students in the building and divides that score by the maximum possible score to determine a percentage.
• The percentage based on maximum score for the chosen Student or Teacher displays in light gray. DataMap divides the scaled score of the student (or average of the teacher’s students) by the maximum score possible to determine a percentage.
Note: If the icon displays after a particular month and year, this indicates that the percentage score of the district, building, student, or teacher has been calculated using the max score for the most recent assessment (until the current assessment max score is available).
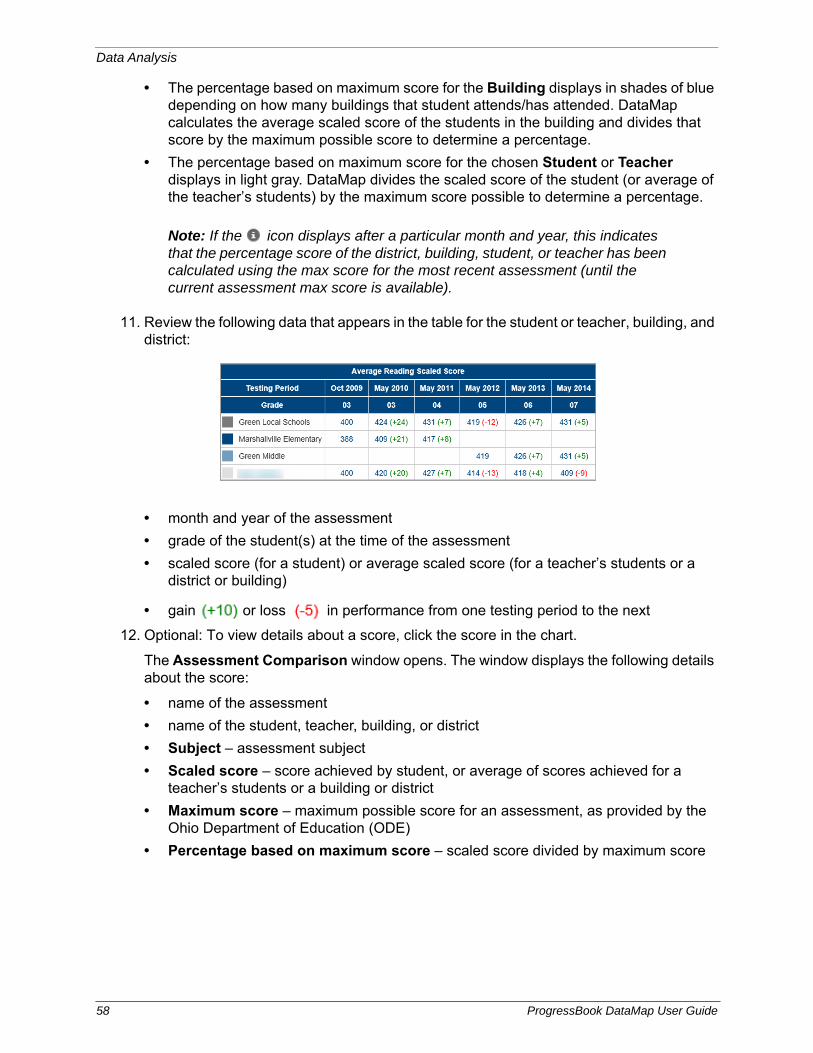
11. Review the following data that appears in the table for the student or teacher, building, and district:
• month and year of the assessment
• grade of the student(s) at the time of the assessment
• scaled score (for a student) or average scaled score (for a teacher’s students or a district or building)
• gain or loss in performance from one testing period to the next
12. Optional: To view details about a score, click the score in the chart.
The Assessment Comparison window opens. The window displays the following details about the score:
• name of the assessment
• name of the student, teacher, building, or district
• Subject – assessment subject
• Scaled score – score achieved by student, or average of scores achieved for a teacher’s students or a building or district
• Maximum score – maximum possible score for an assessment, as provided by the Ohio Department of Education (ODE)
• Percentage based on maximum score – scaled score divided by maximum score
58 ProgressBook DataMap User Guide
Data Analysis
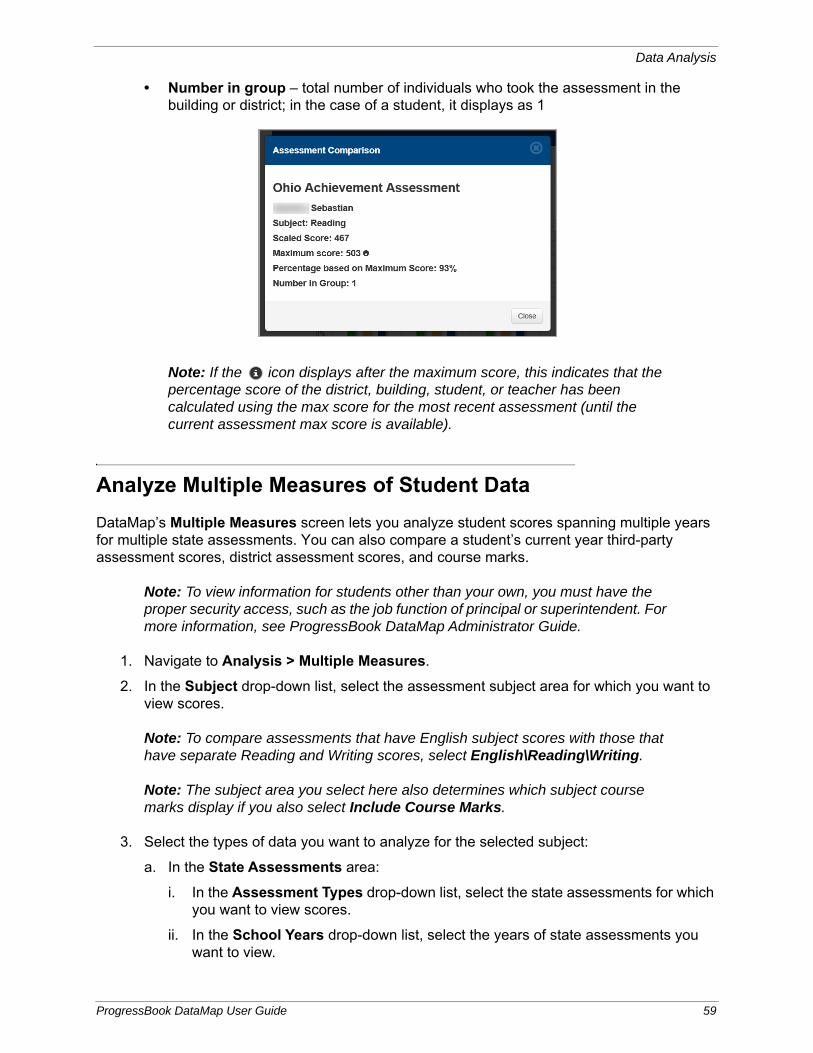
• Number in group – total number of individuals who took the assessment in the building or district; in the case of a student, it displays as 1
Note: If the icon displays after the maximum score, this indicates that the percentage score of the district, building, student, or teacher has been calculated using the max score for the most recent assessment (until the current assessment max score is available).
Analyze Multiple Measures of Student Data
DataMap’s Multiple Measures screen lets you analyze student scores spanning multiple years for multiple state assessments. You can also compare a student’s current year third-party assessment scores, district assessment scores, and course marks.
Note: To view information for students other than your own, you must have the proper security access, such as the job function of principal or superintendent. For more information, see ProgressBook DataMap Administrator Guide.
1. Navigate to Analysis > Multiple Measures.
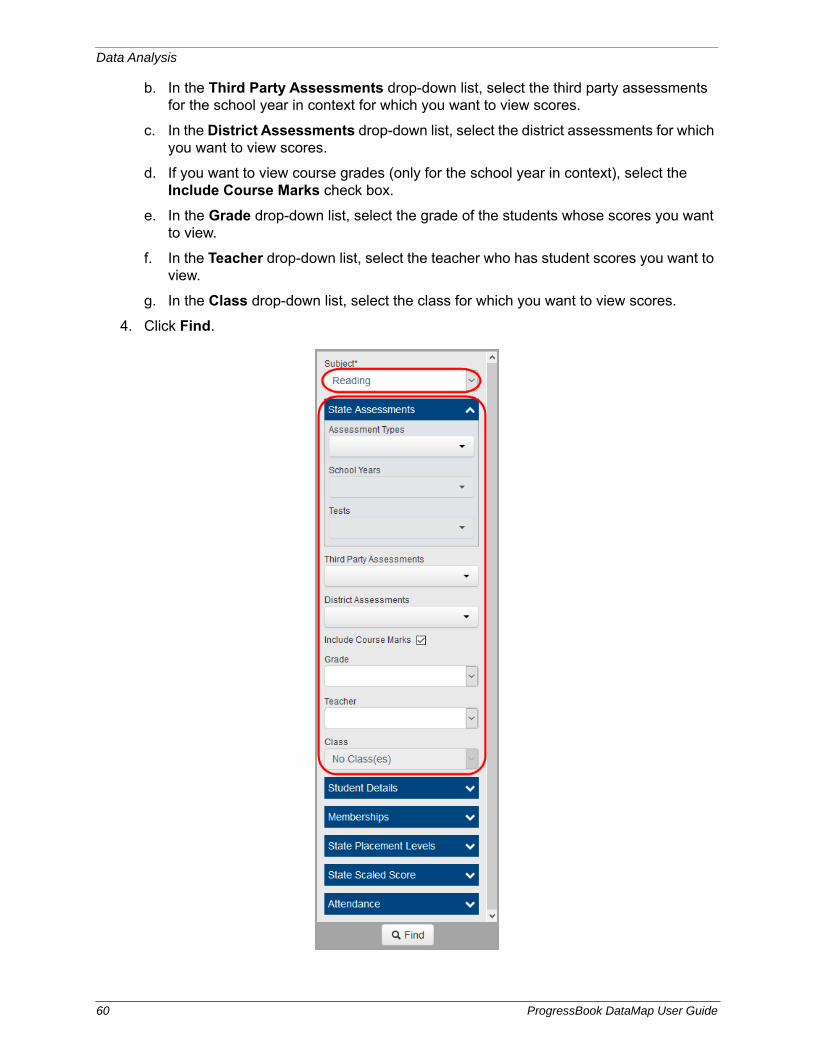
2. In the Subject drop-down list, select the assessment subject area for which you want to view scores.
Note: To compare assessments that have English subject scores with those that have separate Reading and Writing scores, select English\Reading\Writing.
Note: The subject area you select here also determines which subject course marks display if you also select Include Course Marks.
3. Select the types of data you want to analyze for the selected subject:
a. In the State Assessments area:
i. In the Assessment Types drop-down list, select the state assessments for which you want to view scores.
ii. In the School Years drop-down list, select the years of state assessments you want to view.
ProgressBook DataMap User Guide 59
Data Analysis
b. In the Third Party Assessments drop-down list, select the third party assessments for the school year in context for which you want to view scores.
c. In the District Assessments drop-down list, select the district assessments for which you want to view scores.
d. If you want to view course grades (only for the school year in context), select the Include Course Marks check box.
e. In the Grade drop-down list, select the grade of the students whose scores you want to view.
f. In the Teacher drop-down list, select the teacher who has student scores you want to view.
g. In the Class drop-down list, select the class for which you want to view scores.
4. Click Find.
60 ProgressBook DataMap User Guide
Data Analysis
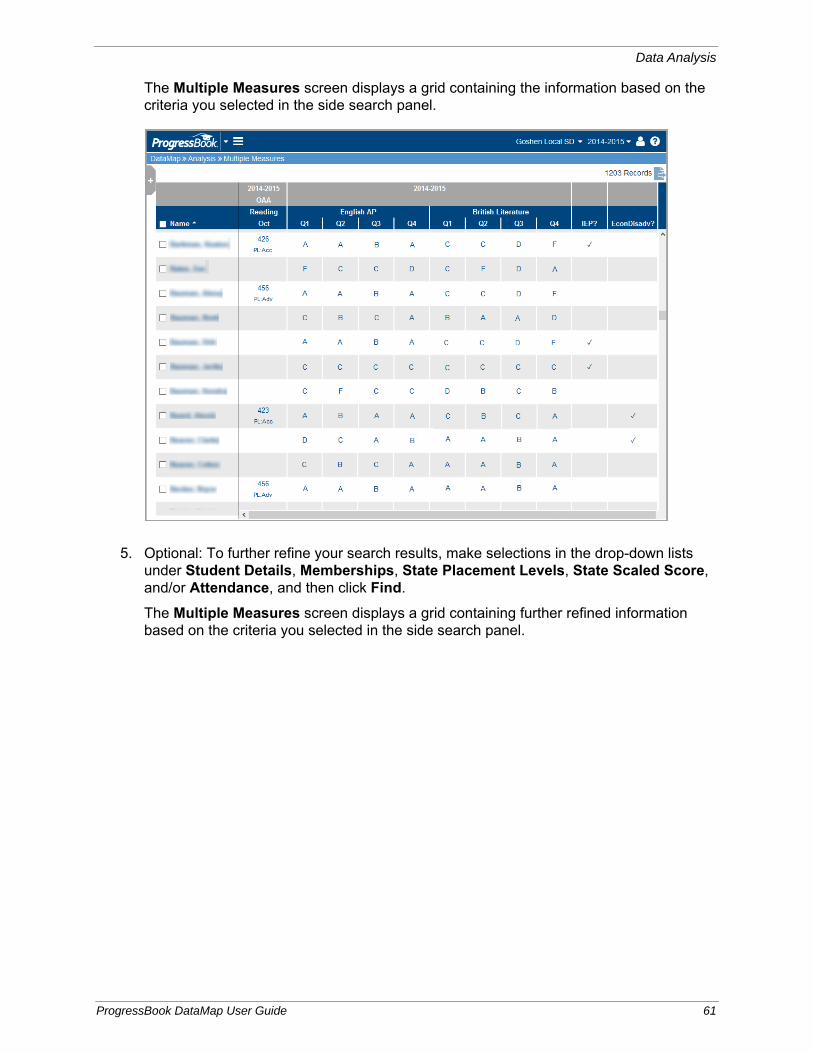
The Multiple Measures screen displays a grid containing the information based on the criteria you selected in the side search panel.
5. Optional: To further refine your search results, make selections in the drop-down lists under Student Details, Memberships, State Placement Levels, State Scaled Score, and/or Attendance, and then click Find.
The Multiple Measures screen displays a grid containing further refined information based on the criteria you selected in the side search panel.
ProgressBook DataMap User Guide 61
Data Analysis
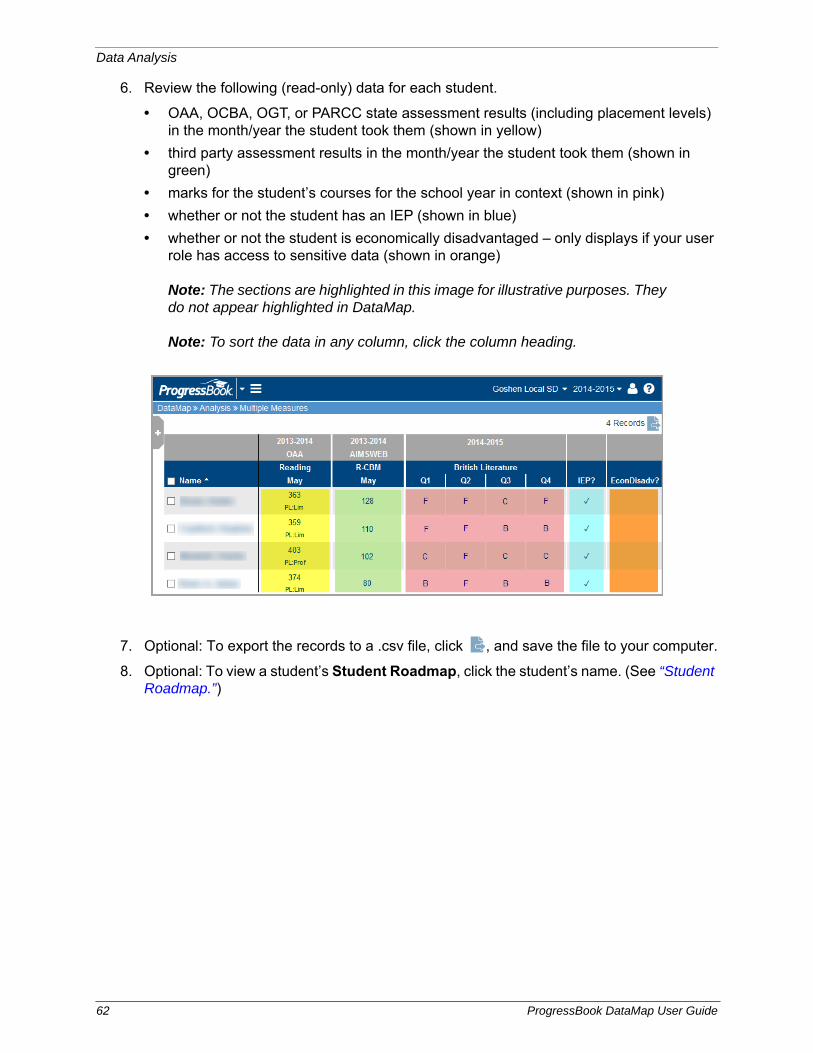
6. Review the following (read-only) data for each student.
• OAA, OCBA, OGT, or PARCC state assessment results (including placement levels) in the month/year the student took them (shown in yellow)
• third party assessment results in the month/year the student took them (shown in green)
• marks for the student’s courses for the school year in context (shown in pink)
• whether or not the student has an IEP (shown in blue)
• whether or not the student is economically disadvantaged – only displays if your user role has access to sensitive data (shown in orange)
Note: The sections are highlighted in this image for illustrative purposes. They do not appear highlighted in DataMap.
Note: To sort the data in any column, click the column heading.
7. Optional: To export the records to a .csv file, click , and save the file to your computer.
8. Optional: To view a student’s Student Roadmap, click the student’s name. (See “Student Roadmap.”)
62 ProgressBook DataMap User Guide
Student Learning Objectives
You can use DataMap to manage your Student Learning Objectives (“SLOs” or “objectives”) to measure your students’ growth.
Note: As a teacher, you can only see your own objectives. Administrators can see all objectives in the district.
Refer to the appropriate topic as follows:
• For an overview of the SLO workflow, see “Understand the Objective Workflow.”
• To create a new objective, see “Create Objectives.”
• To edit an existing objective, see “Edit Objectives.”
• To print an objective, see “Print Objectives.”
• To export all of your objective records, see “Export Objectives.”
• To delete an objective, see “Delete Objectives.”
• To submit an objective to the review committee, see “Submit Objectives for Review.”
• To make revisions requested by the review committee, see “Make Requested Revisions to Objectives.”
• To exclude students from an objective, see “Exclude Students from an Objective.”
• To score an objective, see “Score Objectives.”
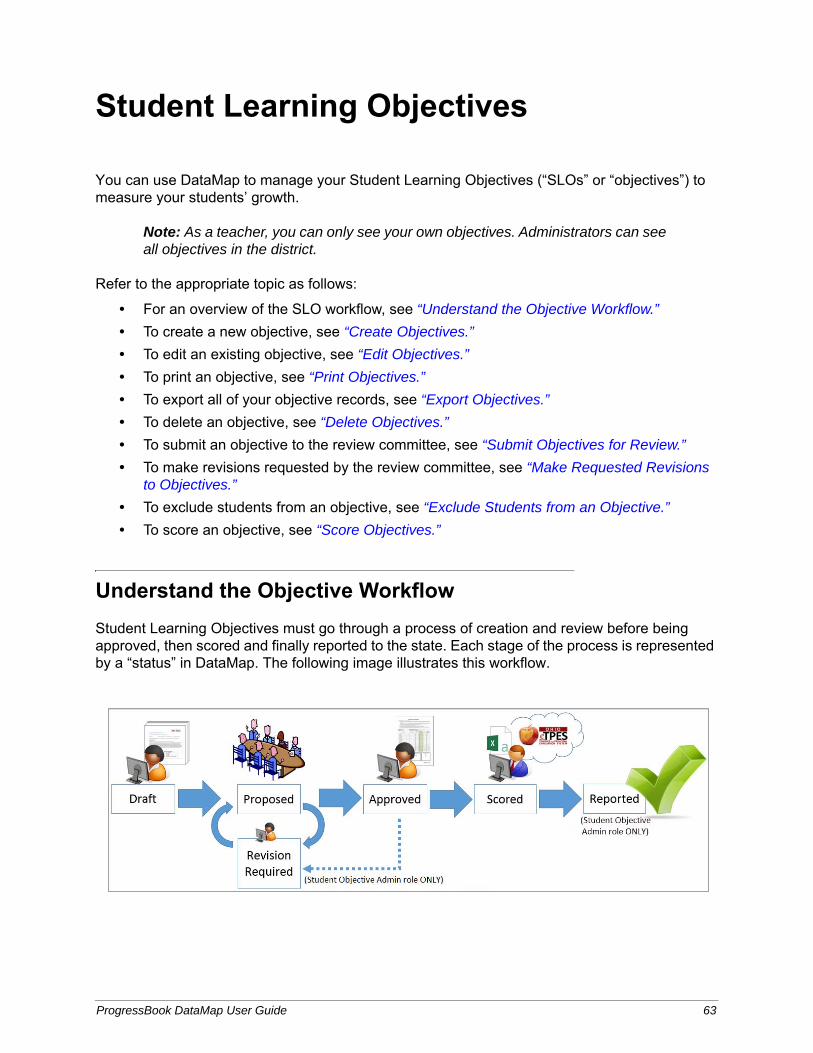
Understand the Objective Workflow
Student Learning Objectives must go through a process of creation and review before being approved, then scored and finally reported to the state. Each stage of the process is represented by a “status” in DataMap. The following image illustrates this workflow.
ProgressBook DataMap User Guide 63

Student Learning Objectives
Create Objectives
The process of creating an objective involves the following steps:
1. “Add Objective”
2. “Add Data to Objective”
3. “Add Students to Objective”
4. “Add Tiers”
5. “Add Students to Tiers”
6. “Add Baseline Scores”
7. “Add Growth Targets”
Note: To create an objective, your user account must be associated with a staff member.
Add Objective1. On the Student Objectives screen, click Add Objective.
2. On the Add Student Objective screen, enter a Name for this objective.
3. In the Content Area & Course(s) field, enter text describing the courses to which this objective applies.
4. In the Subject drop-down list, select the subject in which you want to measure student growth using this objective.
5. Click Save.
64 ProgressBook DataMap User Guide
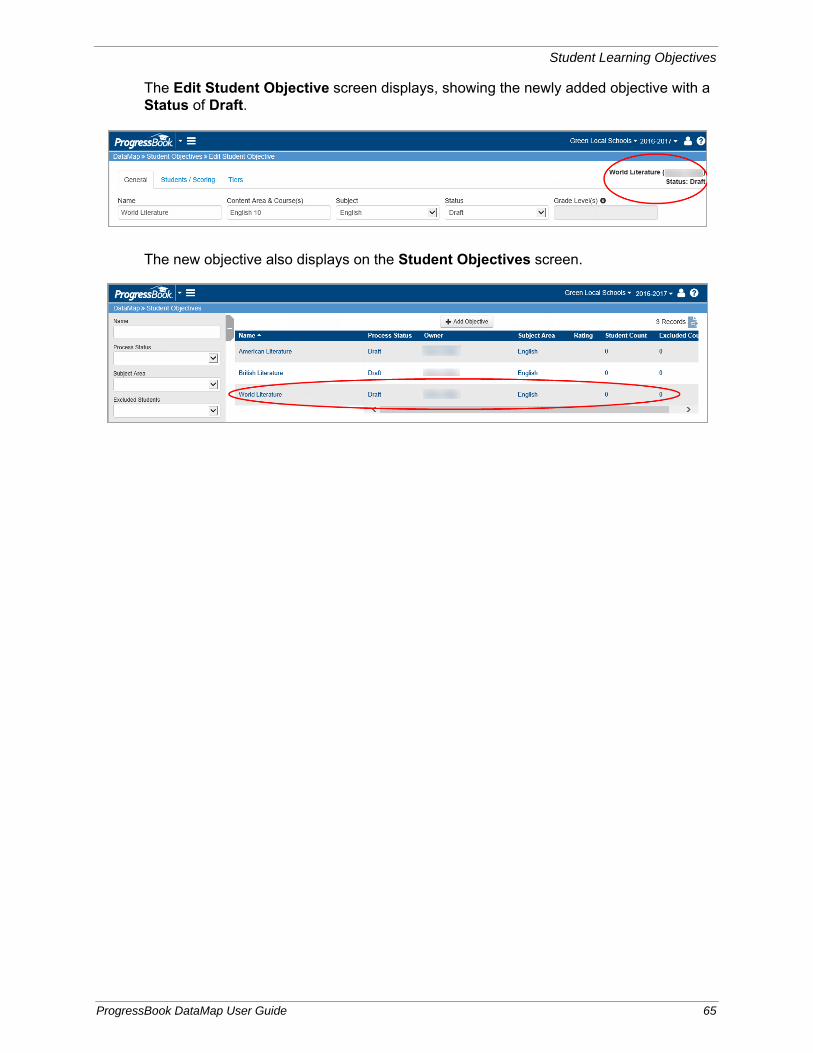
Student Learning Objectives
The Edit Student Objective screen displays, showing the newly added objective with a Status of Draft.
The new objective also displays on the Student Objectives screen.
ProgressBook DataMap User Guide 65
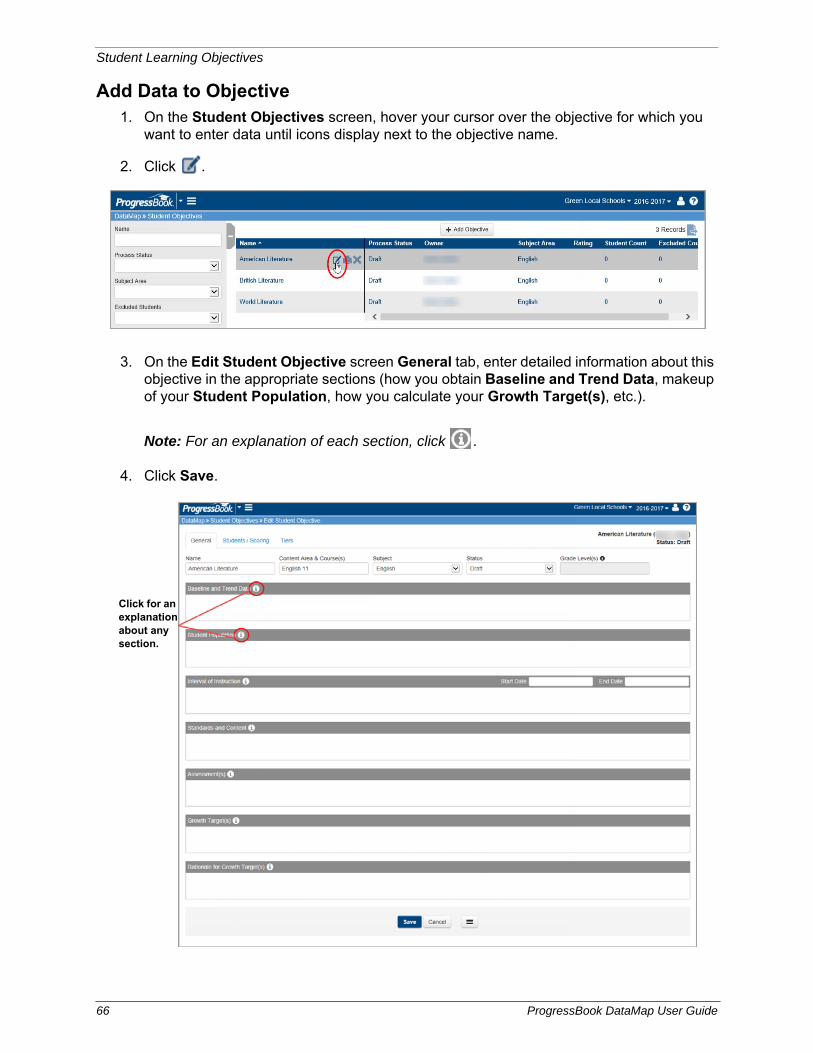
Student Learning Objectives
Add Data to Objective1. On the Student Objectives screen, hover your cursor over the objective for which you
want to enter data until icons display next to the objective name.
2. Click .
3. On the Edit Student Objective screen General tab, enter detailed information about this objective in the appropriate sections (how you obtain Baseline and Trend Data, makeup of your Student Population, how you calculate your Growth Target(s), etc.).
Note: For an explanation of each section, click .
4. Click Save.
Click for an explanation about any section.
66 ProgressBook DataMap User Guide

Student Learning Objectives
Add Students to Objective1. On the Edit Student Objective screen Students / Scoring tab, click Add Students.
2. In the drop-down list, find and select students to add using one of the following methods:
• To add a single student:
i. Enter the first few letters of the student’s first or last name.
ii. In the search results that display beneath the field, select the correct student.
iii. Click .
The student now displays on the Students / Scoring tab.
ProgressBook DataMap User Guide 67
Student Learning Objectives
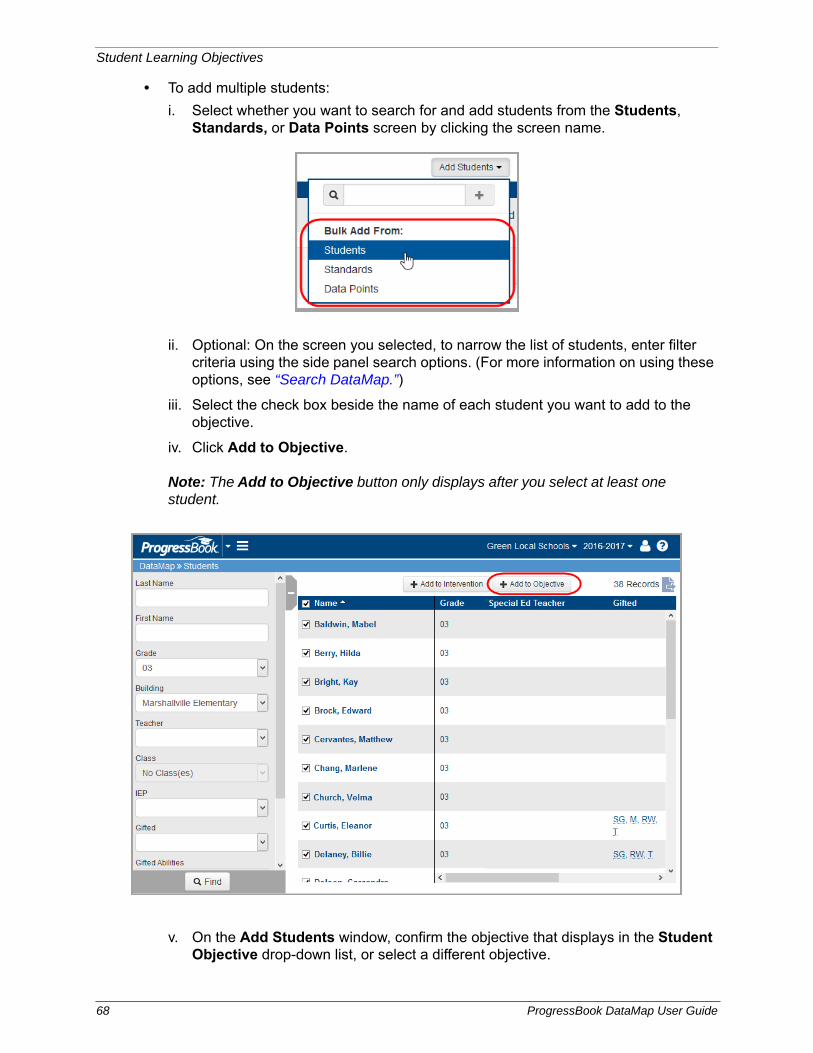
• To add multiple students:
i. Select whether you want to search for and add students from the Students, Standards, or Data Points screen by clicking the screen name.
ii. Optional: On the screen you selected, to narrow the list of students, enter filter criteria using the side panel search options. (For more information on using these options, see “Search DataMap.”)
iii. Select the check box beside the name of each student you want to add to the objective.
iv. Click Add to Objective.
Note: The Add to Objective button only displays after you select at least one student.
v. On the Add Students window, confirm the objective that displays in the Student Objective drop-down list, or select a different objective.
68 ProgressBook DataMap User Guide
Student Learning Objectives
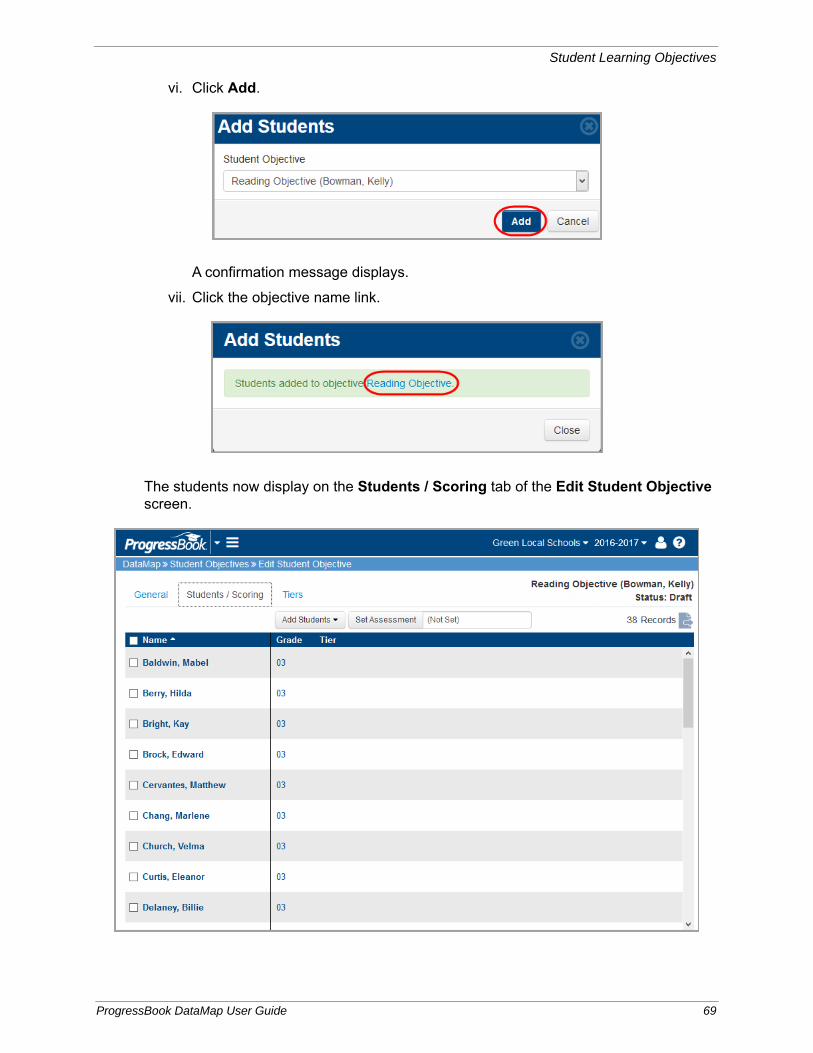
vi. Click Add.
A confirmation message displays.
vii. Click the objective name link.
The students now display on the Students / Scoring tab of the Edit Student Objective screen.
ProgressBook DataMap User Guide 69
Student Learning Objectives
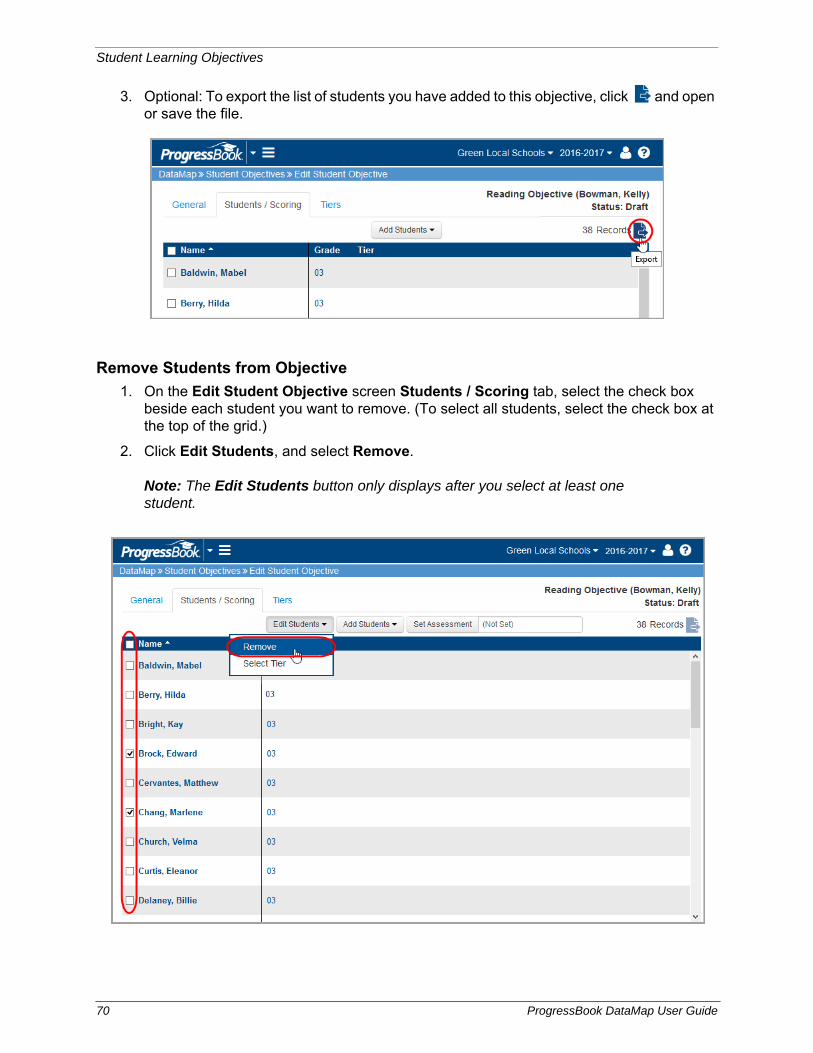
3. Optional: To export the list of students you have added to this objective, click and open or save the file.
Remove Students from Objective
1. On the Edit Student Objective screen Students / Scoring tab, select the check box beside each student you want to remove. (To select all students, select the check box at the top of the grid.)
2. Click Edit Students, and select Remove.
Note: The Edit Students button only displays after you select at least one student.
70 ProgressBook DataMap User Guide

Student Learning Objectives
3. On the confirmation window, click Remove.
The students are removed from the objective, as shown in the updated record count.
Add TiersYou can create tiers to categorize students based on target growth measures. These tiers should represent what you believe your students’ growth measures should be based on a specific baseline pre-test assessment administered at the beginning of the school year.
1. On the Edit Student Objective screen Tiers tab, click Add Tier.
ProgressBook DataMap User Guide 71
Student Learning Objectives
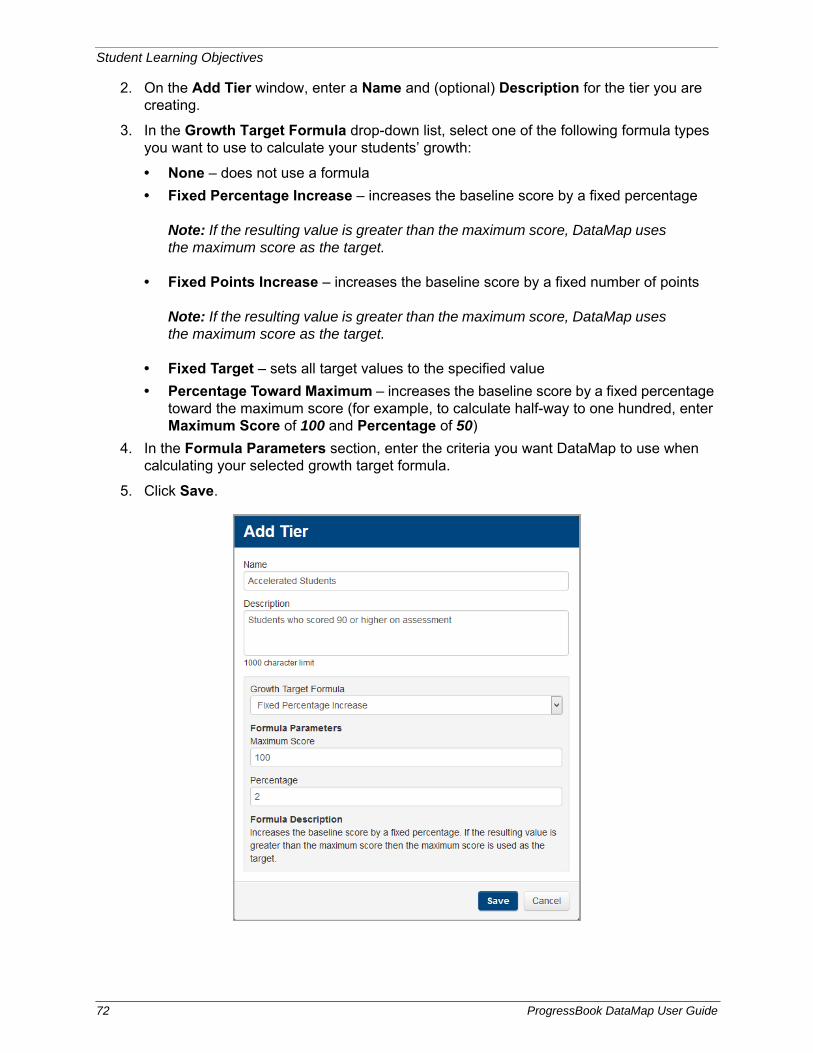
2. On the Add Tier window, enter a Name and (optional) Description for the tier you are creating.
3. In the Growth Target Formula drop-down list, select one of the following formula types you want to use to calculate your students’ growth:
• None – does not use a formula
• Fixed Percentage Increase – increases the baseline score by a fixed percentage
Note: If the resulting value is greater than the maximum score, DataMap uses the maximum score as the target.
• Fixed Points Increase – increases the baseline score by a fixed number of points
Note: If the resulting value is greater than the maximum score, DataMap uses the maximum score as the target.
• Fixed Target – sets all target values to the specified value
• Percentage Toward Maximum – increases the baseline score by a fixed percentage toward the maximum score (for example, to calculate half-way to one hundred, enter Maximum Score of 100 and Percentage of 50)
4. In the Formula Parameters section, enter the criteria you want DataMap to use when calculating your selected growth target formula.
5. Click Save.
72 ProgressBook DataMap User Guide
Student Learning Objectives
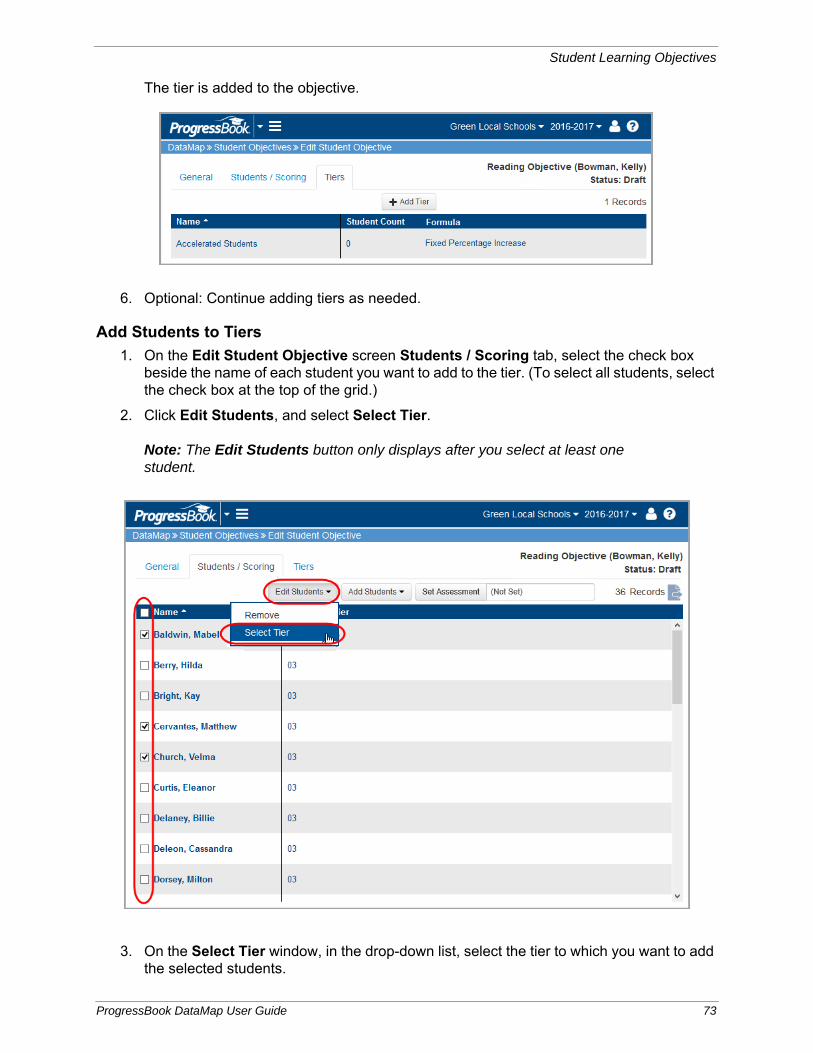
The tier is added to the objective.
6. Optional: Continue adding tiers as needed.
Add Students to Tiers
1. On the Edit Student Objective screen Students / Scoring tab, select the check box beside the name of each student you want to add to the tier. (To select all students, select the check box at the top of the grid.)
2. Click Edit Students, and select Select Tier.
Note: The Edit Students button only displays after you select at least one student.
3. On the Select Tier window, in the drop-down list, select the tier to which you want to add the selected students.
ProgressBook DataMap User Guide 73
Student Learning Objectives
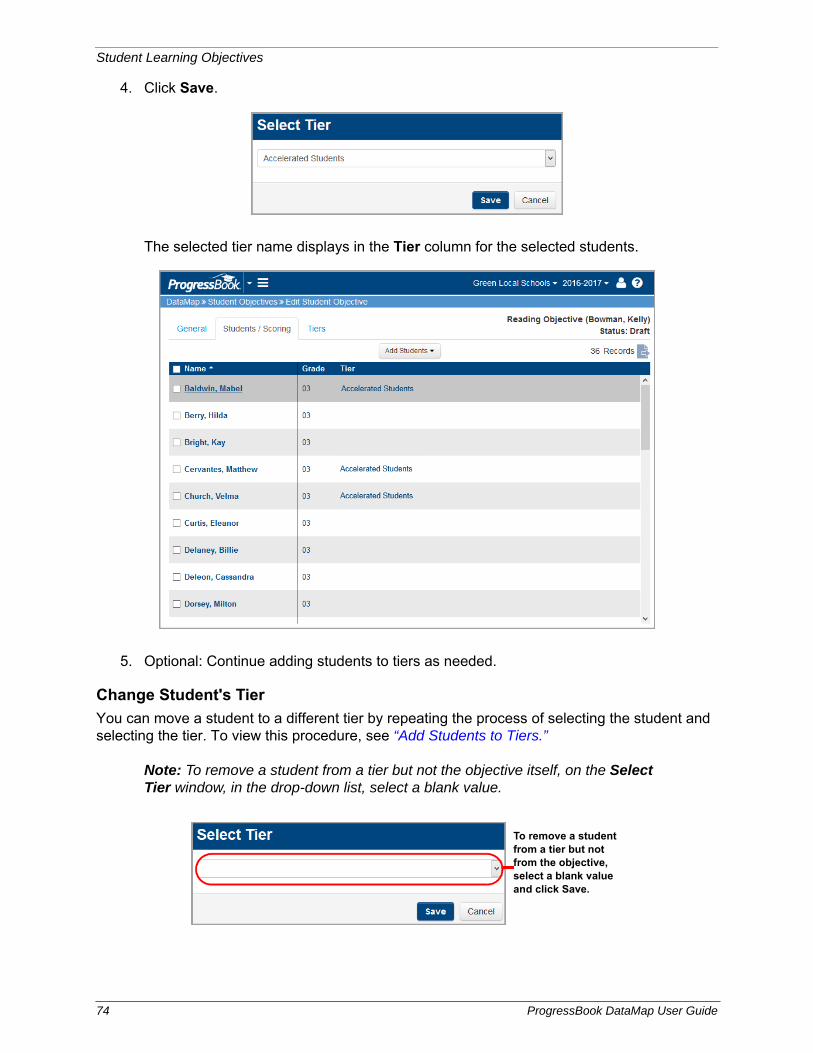
4. Click Save.
The selected tier name displays in the Tier column for the selected students.
5. Optional: Continue adding students to tiers as needed.
Change Student's Tier
You can move a student to a different tier by repeating the process of selecting the student and selecting the tier. To view this procedure, see “Add Students to Tiers.”
Note: To remove a student from a tier but not the objective itself, on the Select Tier window, in the drop-down list, select a blank value.
To remove a student from a tier but not from the objective, select a blank value and click Save.
74 ProgressBook DataMap User Guide
Student Learning Objectives
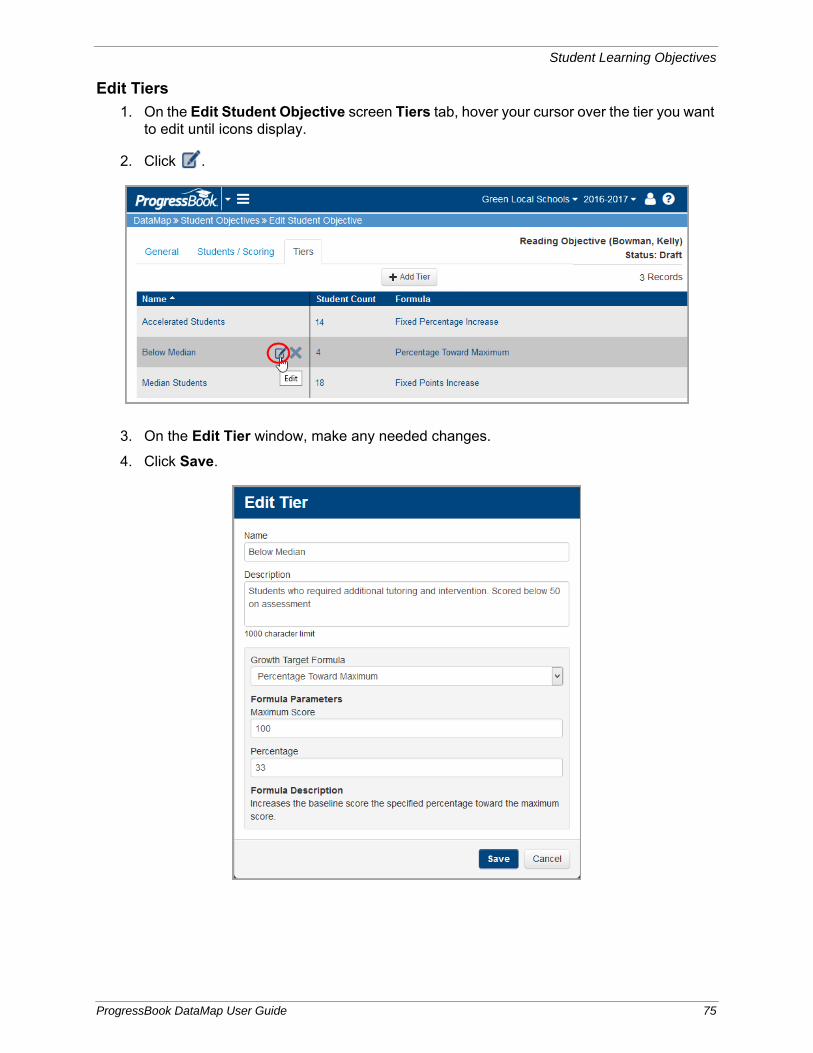
Edit Tiers
1. On the Edit Student Objective screen Tiers tab, hover your cursor over the tier you want to edit until icons display.
2. Click .
3. On the Edit Tier window, make any needed changes.
4. Click Save.
ProgressBook DataMap User Guide 75
Student Learning Objectives
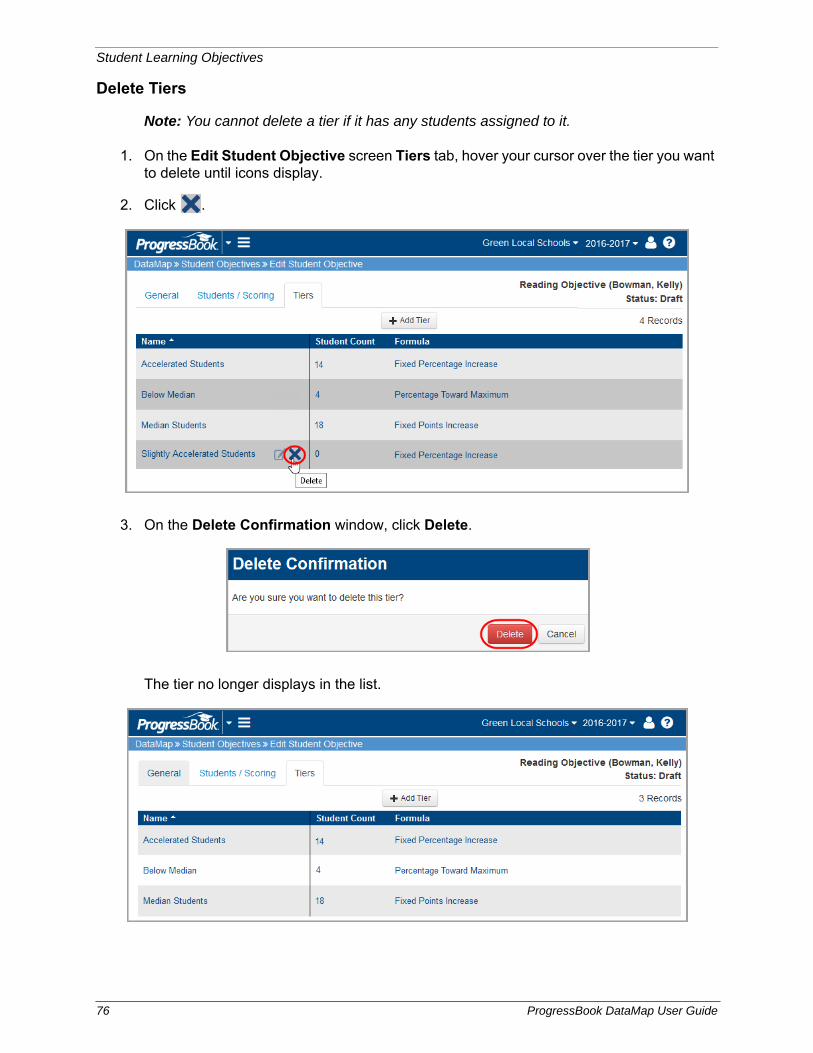
Delete Tiers
Note: You cannot delete a tier if it has any students assigned to it.
1. On the Edit Student Objective screen Tiers tab, hover your cursor over the tier you want to delete until icons display.
2. Click .
3. On the Delete Confirmation window, click Delete.
The tier no longer displays in the list.
76 ProgressBook DataMap User Guide
Student Learning Objectives
Add Baseline Scores• To enter scores manually, see “Enter Baseline Scores Manually.”
• To use baseline scores that are already in DataMap, see “Add Baseline Scores Using Data Points Assessment Scores.”
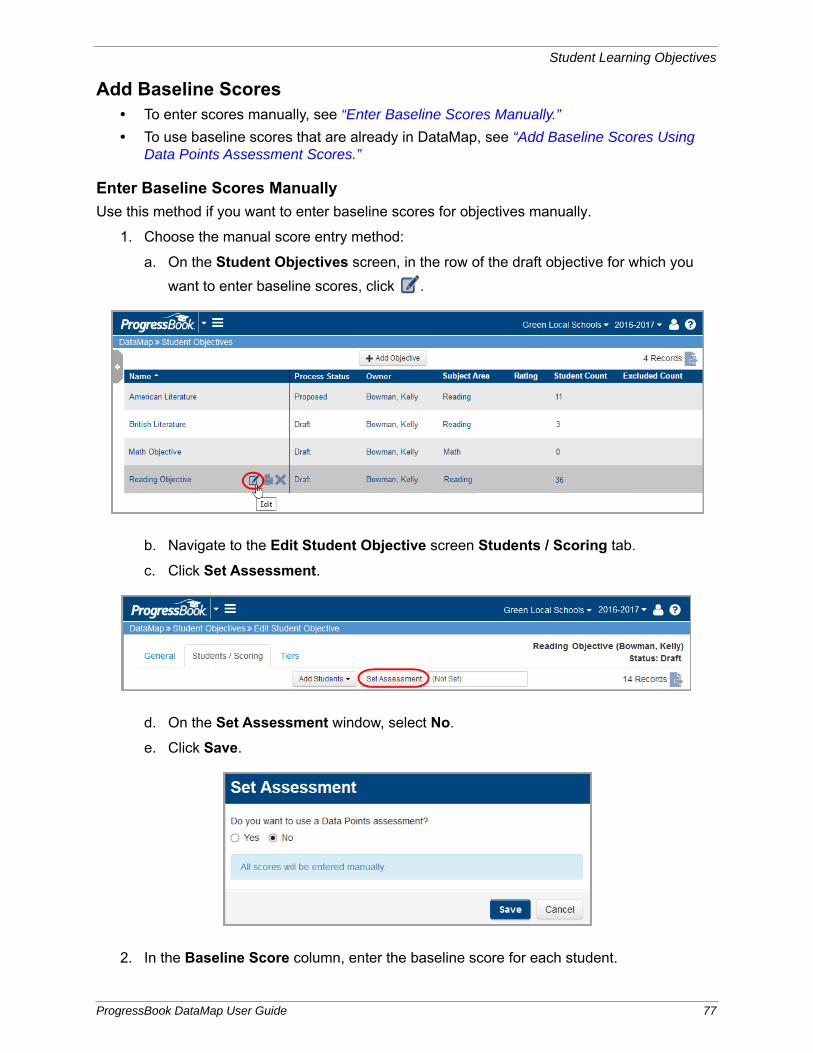
Enter Baseline Scores Manually
Use this method if you want to enter baseline scores for objectives manually.
1. Choose the manual score entry method:
a. On the Student Objectives screen, in the row of the draft objective for which you
want to enter baseline scores, click .
b. Navigate to the Edit Student Objective screen Students / Scoring tab.
c. Click Set Assessment.
d. On the Set Assessment window, select No.
e. Click Save.
2. In the Baseline Score column, enter the baseline score for each student.
ProgressBook DataMap User Guide 77
Student Learning Objectives
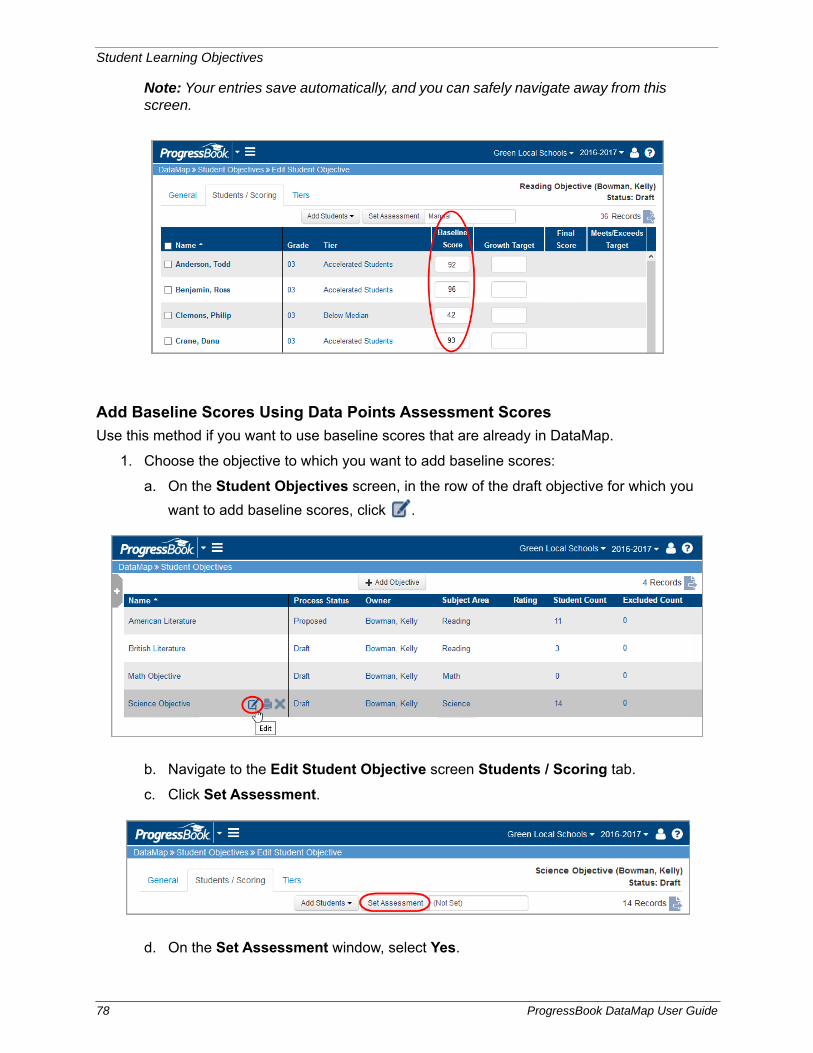
Note: Your entries save automatically, and you can safely navigate away from this screen.
Add Baseline Scores Using Data Points Assessment Scores
Use this method if you want to use baseline scores that are already in DataMap.
1. Choose the objective to which you want to add baseline scores:
a. On the Student Objectives screen, in the row of the draft objective for which you
want to add baseline scores, click .
b. Navigate to the Edit Student Objective screen Students / Scoring tab.
c. Click Set Assessment.
d. On the Set Assessment window, select Yes.
78 ProgressBook DataMap User Guide
Student Learning Objectives
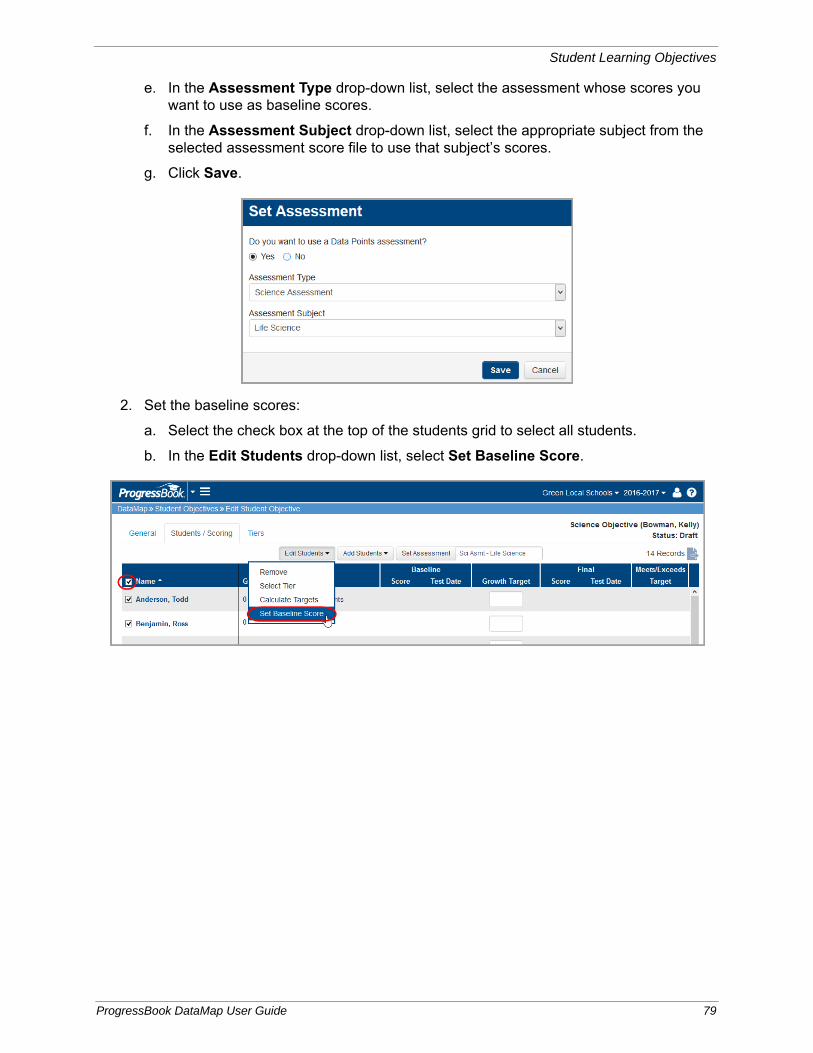
e. In the Assessment Type drop-down list, select the assessment whose scores you want to use as baseline scores.
f. In the Assessment Subject drop-down list, select the appropriate subject from the selected assessment score file to use that subject’s scores.
g. Click Save.
2. Set the baseline scores:
a. Select the check box at the top of the students grid to select all students.
b. In the Edit Students drop-down list, select Set Baseline Score.
ProgressBook DataMap User Guide 79
Student Learning Objectives
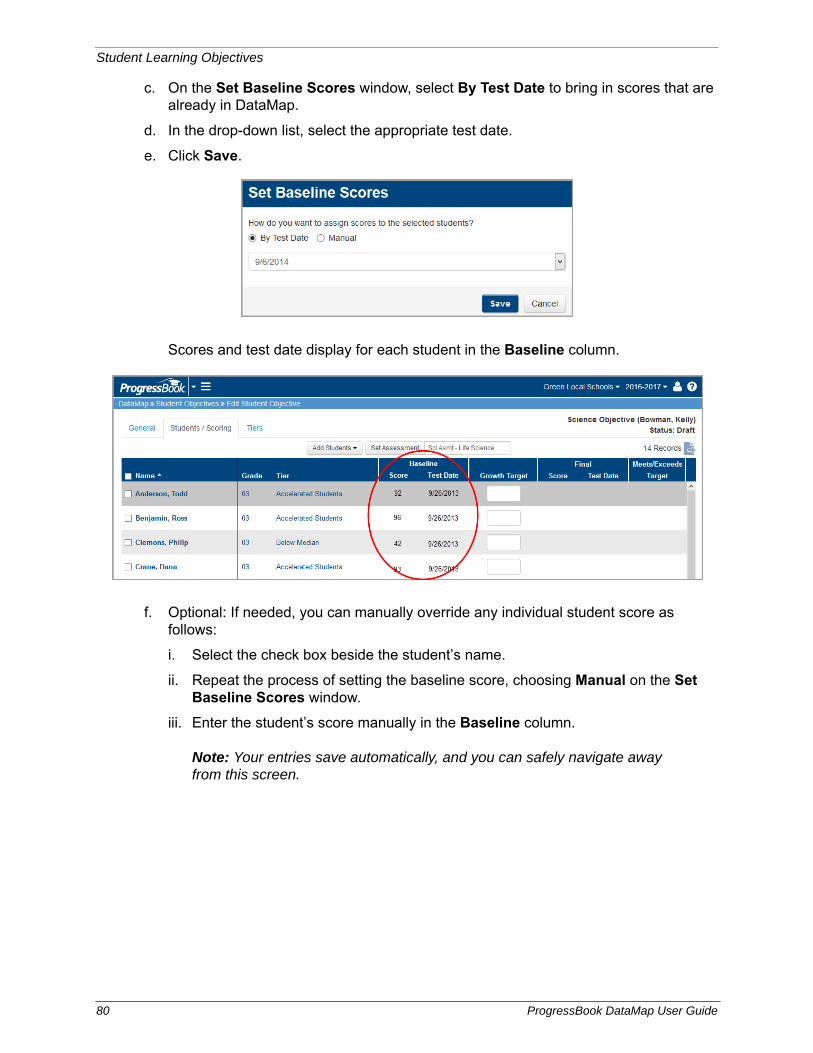
c. On the Set Baseline Scores window, select By Test Date to bring in scores that are already in DataMap.
d. In the drop-down list, select the appropriate test date.
e. Click Save.
Scores and test date display for each student in the Baseline column.
f. Optional: If needed, you can manually override any individual student score as follows:
i. Select the check box beside the student’s name.
ii. Repeat the process of setting the baseline score, choosing Manual on the Set Baseline Scores window.
iii. Enter the student’s score manually in the Baseline column.
Note: Your entries save automatically, and you can safely navigate away from this screen.
80 ProgressBook DataMap User Guide
Student Learning Objectives
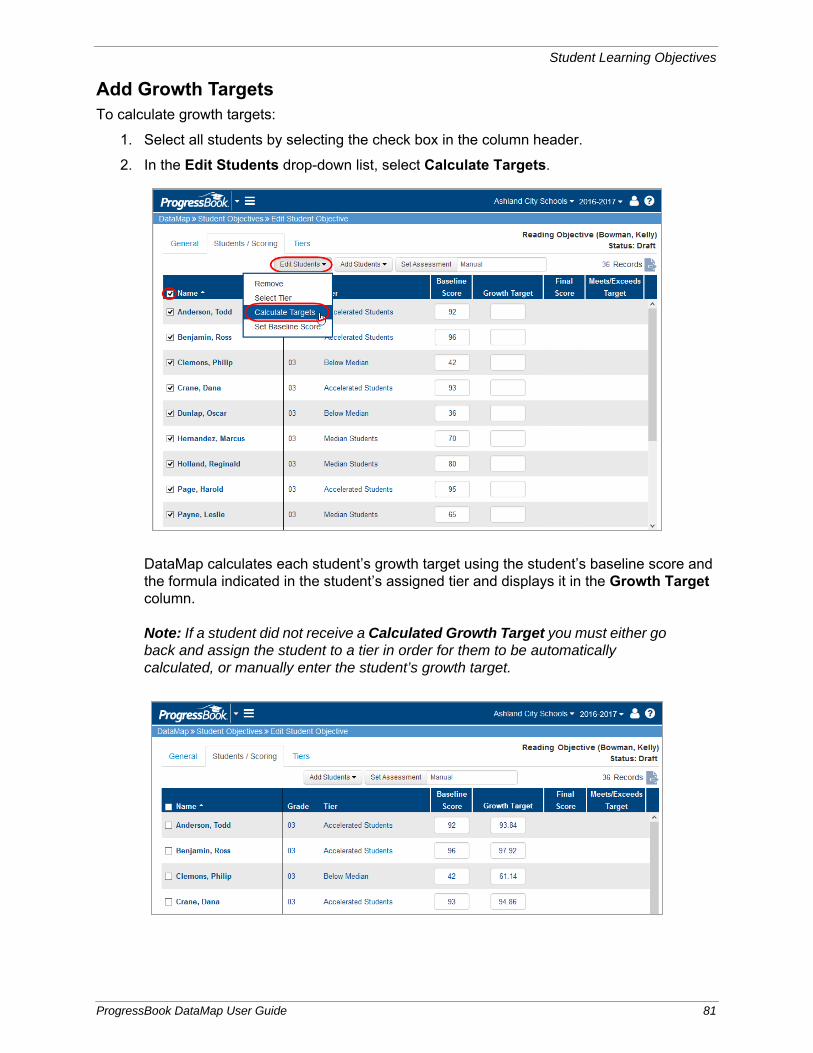
Add Growth TargetsTo calculate growth targets:
1. Select all students by selecting the check box in the column header.
2. In the Edit Students drop-down list, select Calculate Targets.
DataMap calculates each student’s growth target using the student’s baseline score and the formula indicated in the student’s assigned tier and displays it in the Growth Target column.
Note: If a student did not receive a Calculated Growth Target you must either go back and assign the student to a tier in order for them to be automatically calculated, or manually enter the student’s growth target.
ProgressBook DataMap User Guide 81
Student Learning Objectives
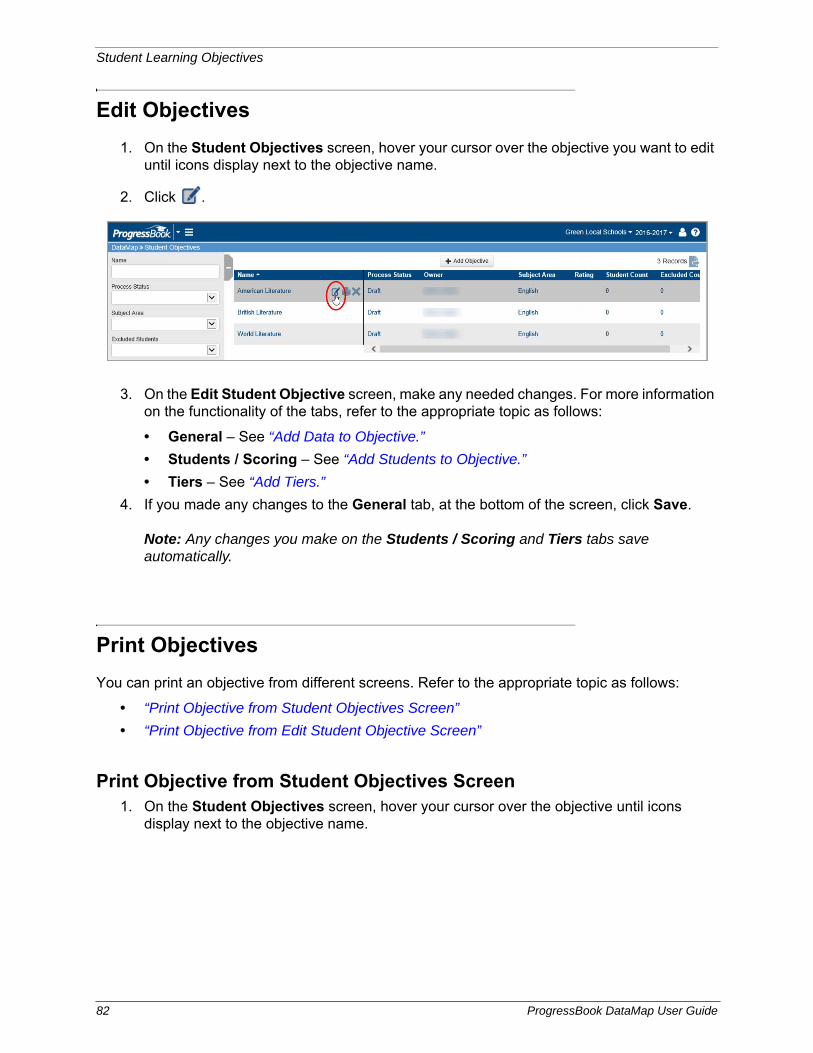
Edit Objectives
1. On the Student Objectives screen, hover your cursor over the objective you want to edit until icons display next to the objective name.
2. Click .
3. On the Edit Student Objective screen, make any needed changes. For more information on the functionality of the tabs, refer to the appropriate topic as follows:
• General – See “Add Data to Objective.”
• Students / Scoring – See “Add Students to Objective.”
• Tiers – See “Add Tiers.”
4. If you made any changes to the General tab, at the bottom of the screen, click Save.
Note: Any changes you make on the Students / Scoring and Tiers tabs save automatically.
Print Objectives
You can print an objective from different screens. Refer to the appropriate topic as follows:
• “Print Objective from Student Objectives Screen”
• “Print Objective from Edit Student Objective Screen”
Print Objective from Student Objectives Screen1. On the Student Objectives screen, hover your cursor over the objective until icons
display next to the objective name.
82 ProgressBook DataMap User Guide
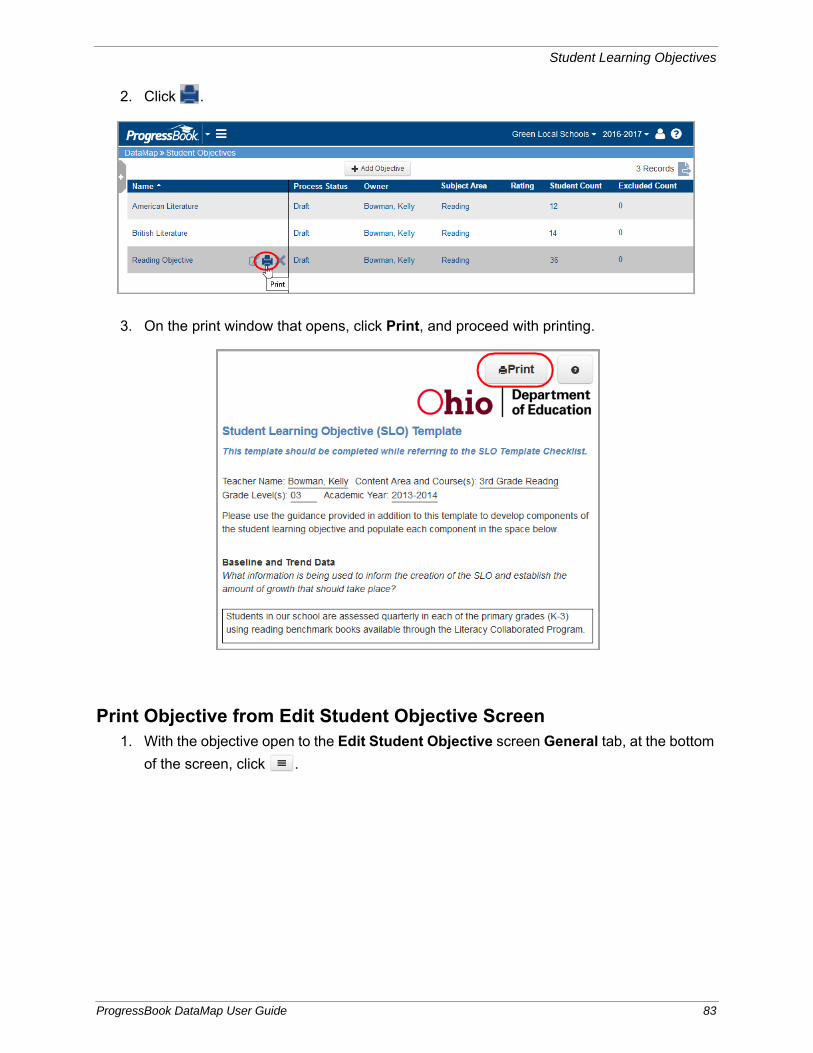
Student Learning Objectives
2. Click .
3. On the print window that opens, click Print, and proceed with printing.
Print Objective from Edit Student Objective Screen1. With the objective open to the Edit Student Objective screen General tab, at the bottom
of the screen, click .
ProgressBook DataMap User Guide 83
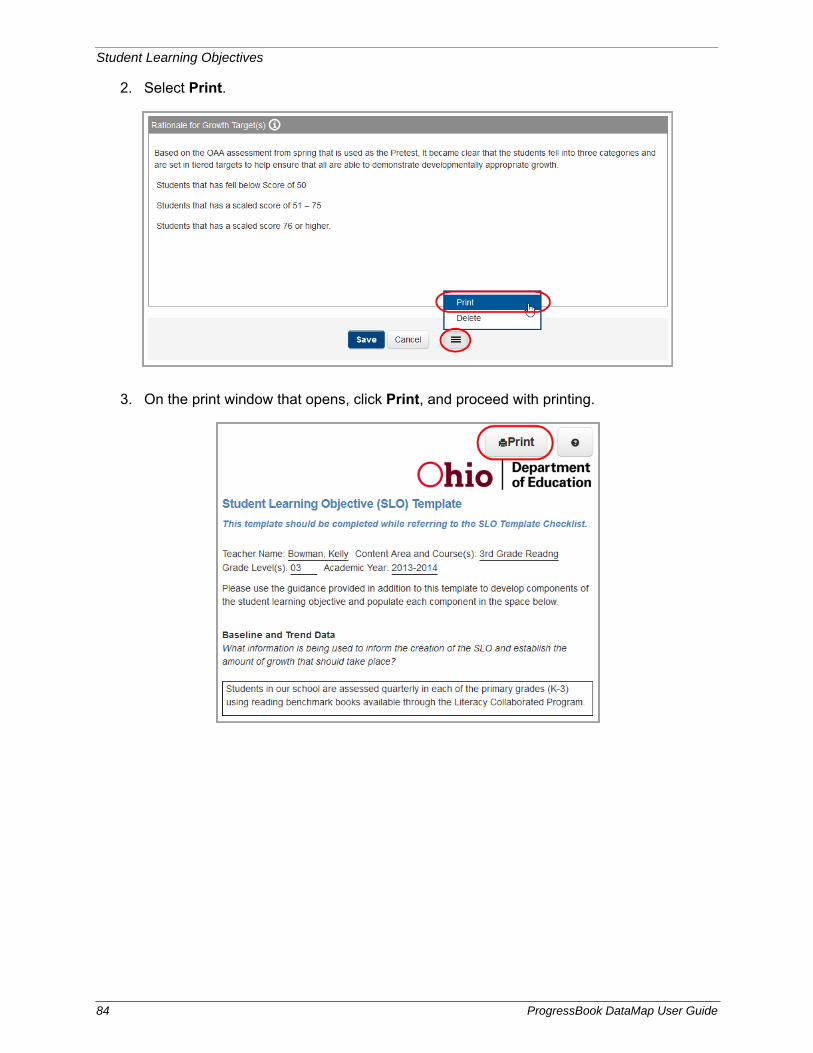
Student Learning Objectives
2. Select Print.
3. On the print window that opens, click Print, and proceed with printing.
84 ProgressBook DataMap User Guide
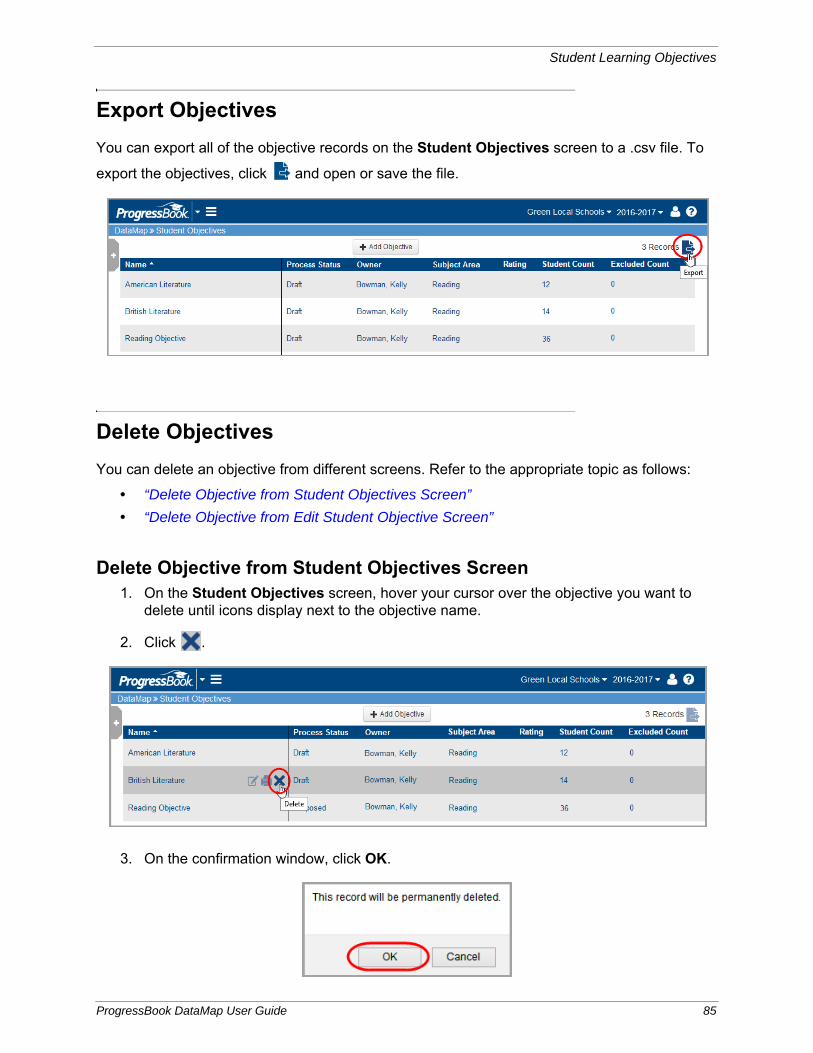
Student Learning Objectives
Export Objectives
You can export all of the objective records on the Student Objectives screen to a .csv file. To
export the objectives, click and open or save the file.
Delete Objectives
You can delete an objective from different screens. Refer to the appropriate topic as follows:
• “Delete Objective from Student Objectives Screen”
• “Delete Objective from Edit Student Objective Screen”
Delete Objective from Student Objectives Screen1. On the Student Objectives screen, hover your cursor over the objective you want to
delete until icons display next to the objective name.
2. Click .
3. On the confirmation window, click OK.
ProgressBook DataMap User Guide 85
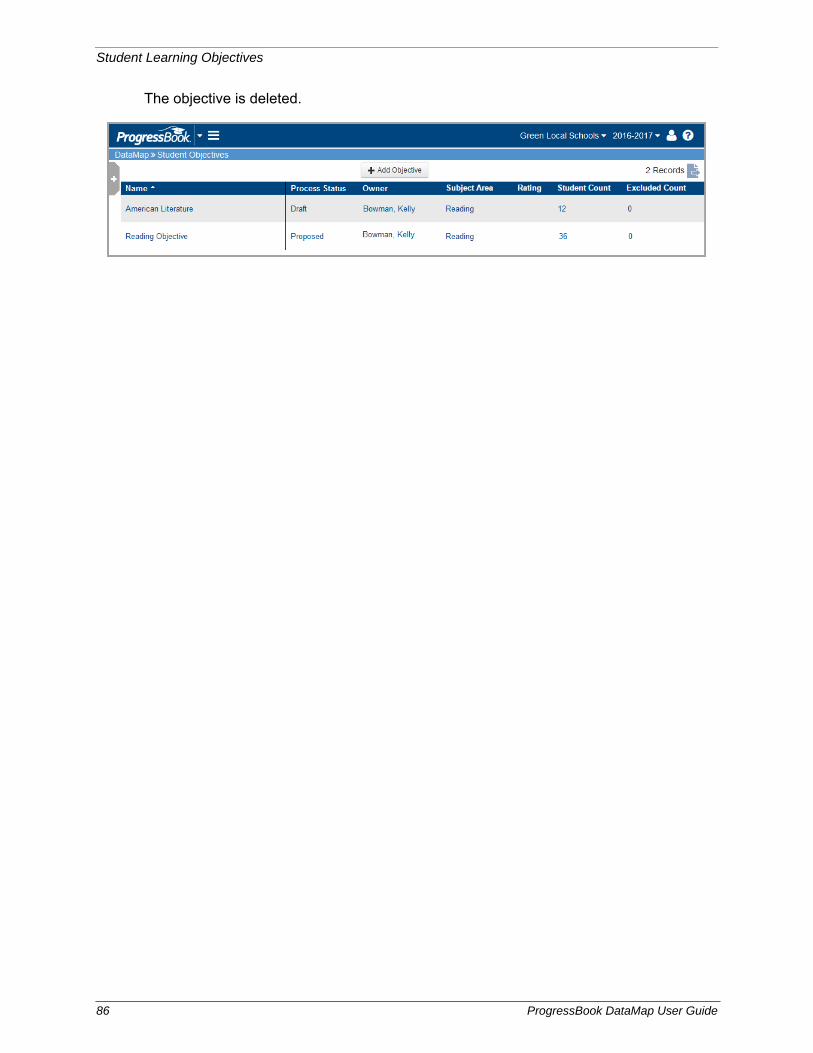
Student Learning Objectives
The objective is deleted.
86 ProgressBook DataMap User Guide

Student Learning Objectives
Delete Objective from Edit Student Objective Screen1. With the objective open to the Edit Student Objective screen General tab, at the bottom
of the screen, click .
2. Select Delete.
3. On the Delete Confirmation window, click Delete.
The objective no longer displays in the list.
ProgressBook DataMap User Guide 87
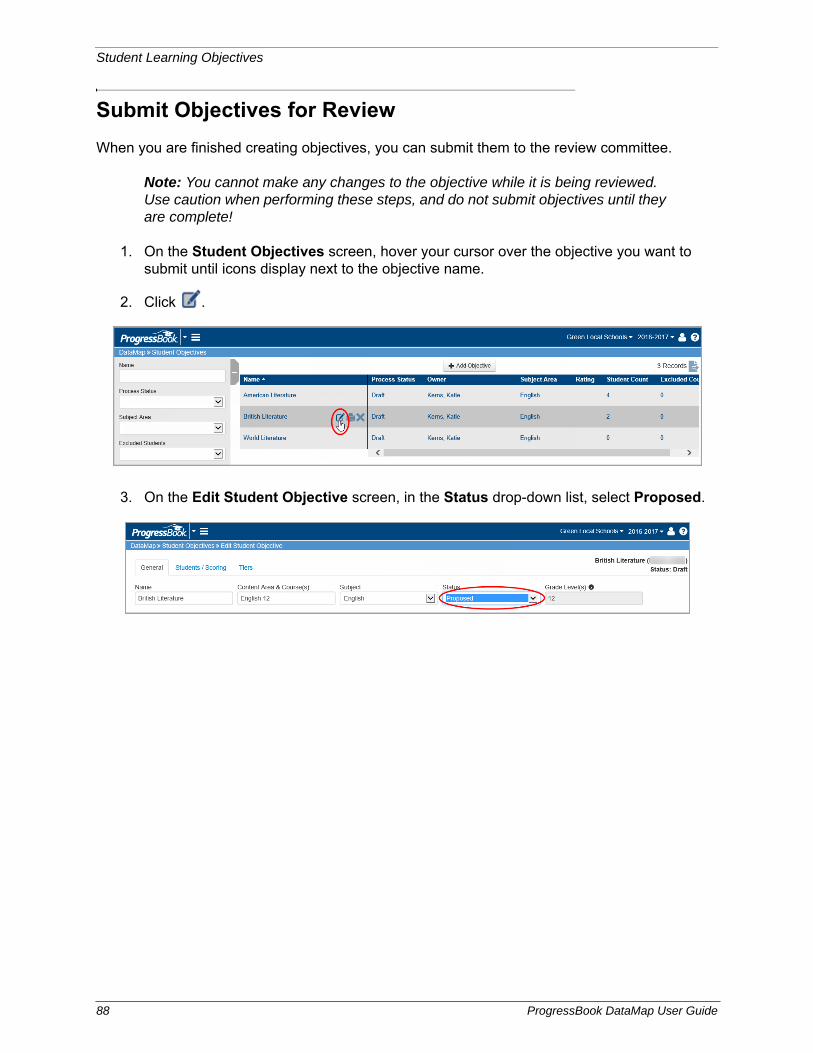
Student Learning Objectives
Submit Objectives for Review
When you are finished creating objectives, you can submit them to the review committee.
Note: You cannot make any changes to the objective while it is being reviewed. Use caution when performing these steps, and do not submit objectives until they are complete!
1. On the Student Objectives screen, hover your cursor over the objective you want to submit until icons display next to the objective name.
2. Click .
3. On the Edit Student Objective screen, in the Status drop-down list, select Proposed.
88 ProgressBook DataMap User Guide
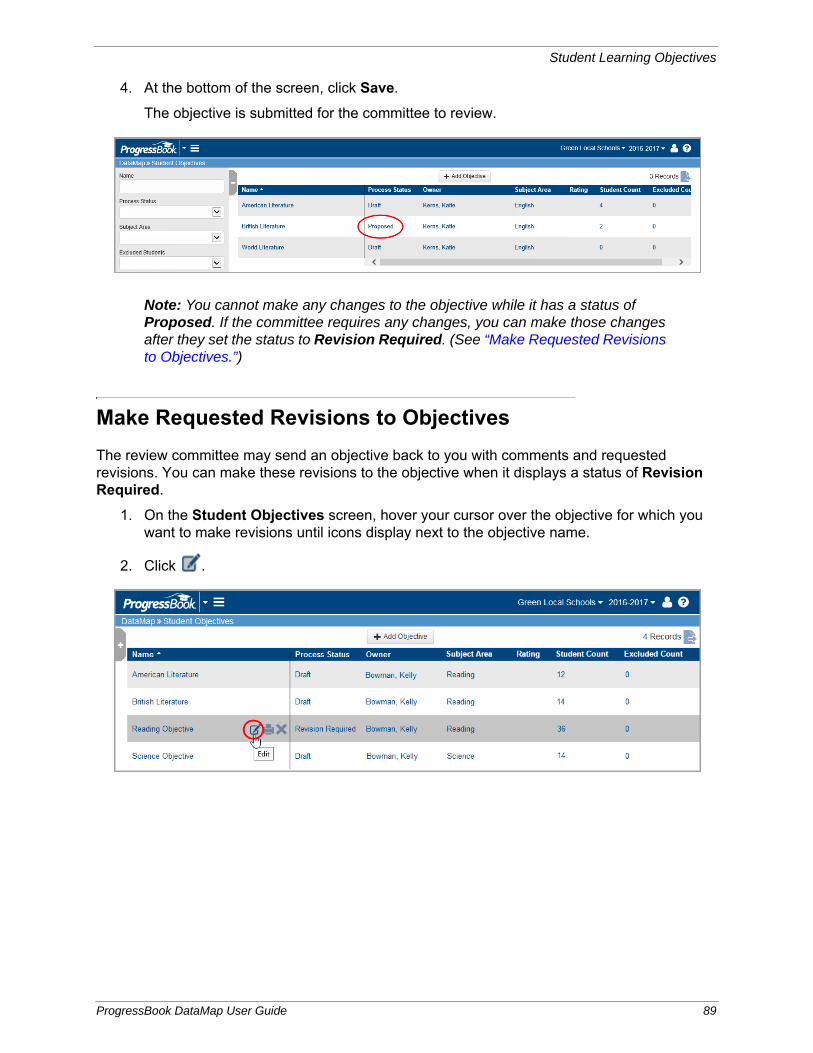
Student Learning Objectives
4. At the bottom of the screen, click Save.
The objective is submitted for the committee to review.
Note: You cannot make any changes to the objective while it has a status of Proposed. If the committee requires any changes, you can make those changes after they set the status to Revision Required. (See “Make Requested Revisions to Objectives.”)
Make Requested Revisions to Objectives
The review committee may send an objective back to you with comments and requested revisions. You can make these revisions to the objective when it displays a status of Revision Required.
1. On the Student Objectives screen, hover your cursor over the objective for which you want to make revisions until icons display next to the objective name.
2. Click .
ProgressBook DataMap User Guide 89

Student Learning Objectives
3. On the Edit Student Objective screen General tab, review any comments from the review committee.
4. Make the needed revisions to each applicable section.
5. In the Status drop-down list, select Proposed.
6. At the bottom of the screen, click Save.
90 ProgressBook DataMap User Guide
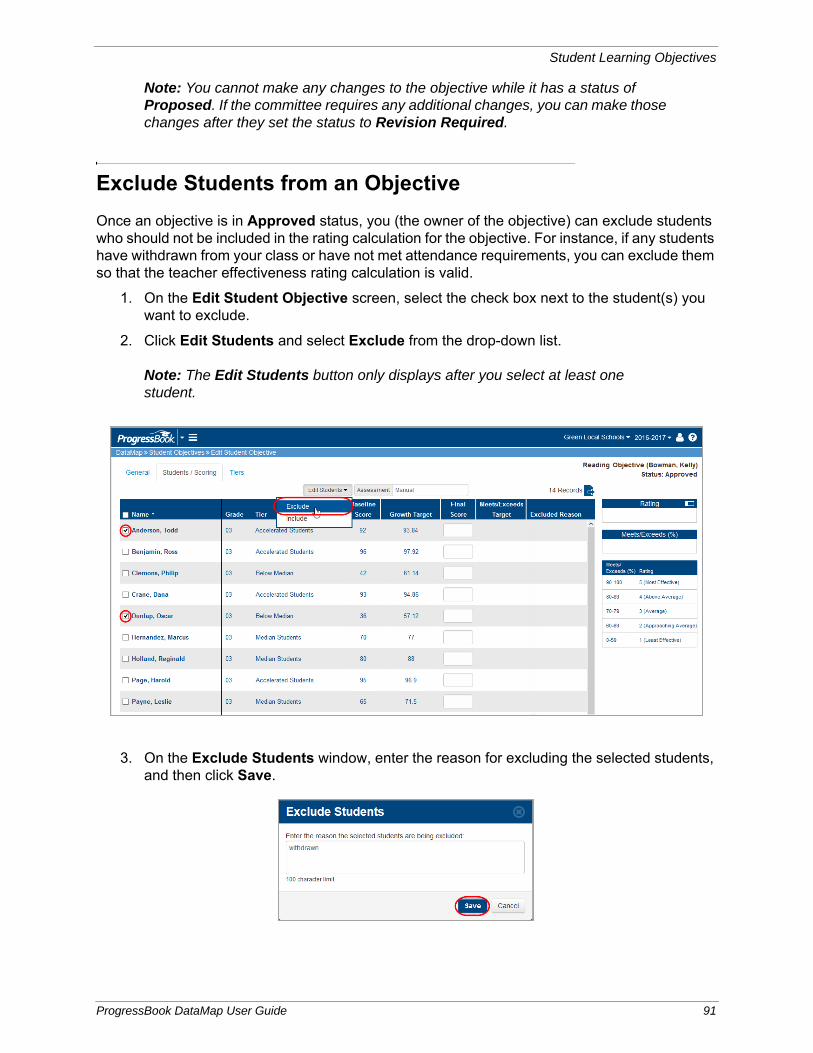
Student Learning Objectives
Note: You cannot make any changes to the objective while it has a status of Proposed. If the committee requires any additional changes, you can make those changes after they set the status to Revision Required.
Exclude Students from an Objective
Once an objective is in Approved status, you (the owner of the objective) can exclude students who should not be included in the rating calculation for the objective. For instance, if any students have withdrawn from your class or have not met attendance requirements, you can exclude them so that the teacher effectiveness rating calculation is valid.
1. On the Edit Student Objective screen, select the check box next to the student(s) you want to exclude.
2. Click Edit Students and select Exclude from the drop-down list.
Note: The Edit Students button only displays after you select at least one student.
3. On the Exclude Students window, enter the reason for excluding the selected students, and then click Save.
ProgressBook DataMap User Guide 91
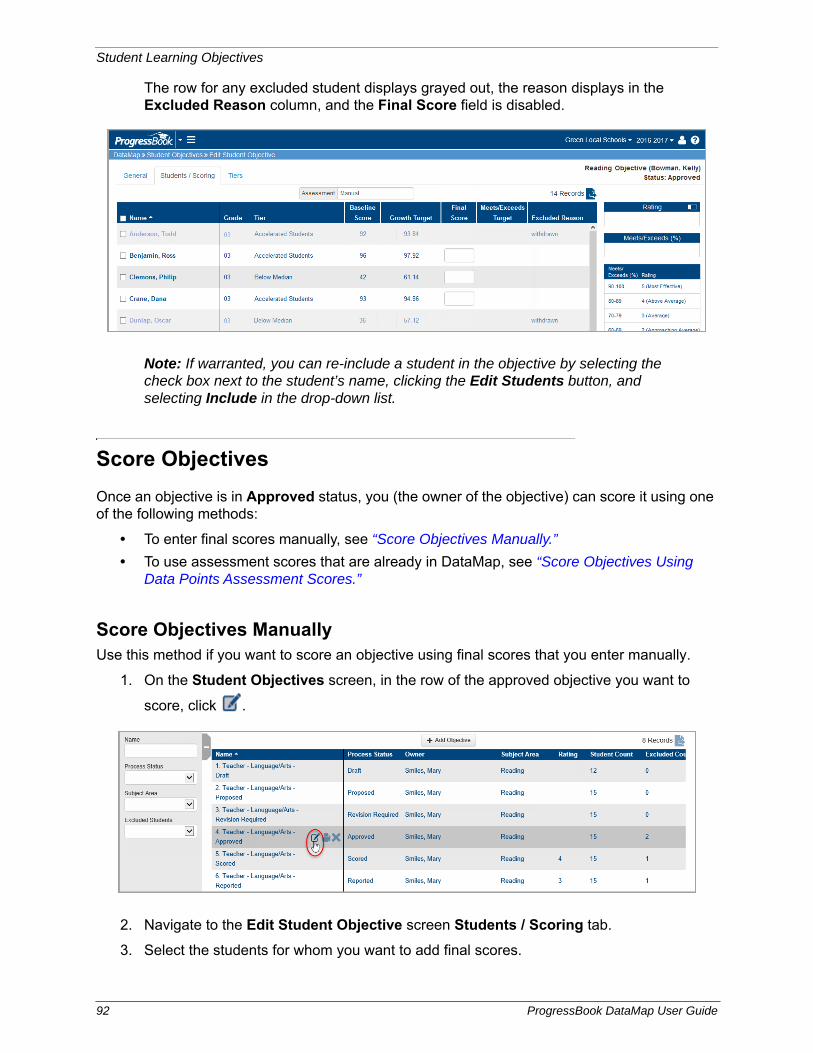
Student Learning Objectives
The row for any excluded student displays grayed out, the reason displays in the Excluded Reason column, and the Final Score field is disabled.
Note: If warranted, you can re-include a student in the objective by selecting the check box next to the student’s name, clicking the Edit Students button, and selecting Include in the drop-down list.
Score Objectives
Once an objective is in Approved status, you (the owner of the objective) can score it using one of the following methods:
• To enter final scores manually, see “Score Objectives Manually.”
• To use assessment scores that are already in DataMap, see “Score Objectives Using Data Points Assessment Scores.”
Score Objectives ManuallyUse this method if you want to score an objective using final scores that you enter manually.
1. On the Student Objectives screen, in the row of the approved objective you want to
score, click .
2. Navigate to the Edit Student Objective screen Students / Scoring tab.
3. Select the students for whom you want to add final scores.
92 ProgressBook DataMap User Guide
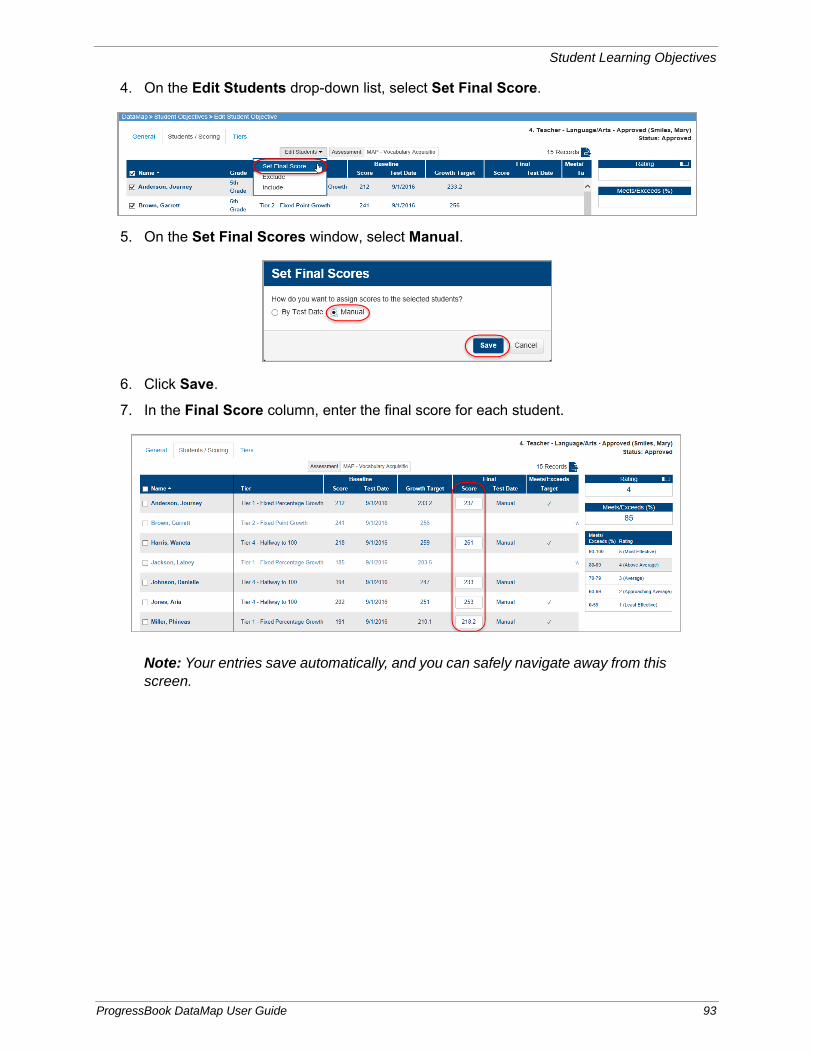
Student Learning Objectives
4. On the Edit Students drop-down list, select Set Final Score.
5. On the Set Final Scores window, select Manual.
6. Click Save.
7. In the Final Score column, enter the final score for each student.
Note: Your entries save automatically, and you can safely navigate away from this screen.
ProgressBook DataMap User Guide 93

Student Learning Objectives
If a student’s final score is greater than or equal to the growth target, a check mark displays in the Meets/Exceeds Target column.
Based on the percentage of students who meet or exceed their growth target and ODE’s prescribed rating system (shown in the grid), the Rating section displays your teacher effectiveness rating for this objective (from 1-5).
Note: To collapse this section to show only the rating, click . To export the
records to a .csv file, click , and save the file to your computer.
8. When you finish scoring the objective and are ready to finalize it:
a. On the General tab, in the Status drop-down list, select Scored.
b. At the bottom of the screen, click Save.
Note: Once you move the objective to Scored status, only you (as the owner) and student objective admins and reviewers can see it.
export records
expand or collapse section
94 ProgressBook DataMap User Guide
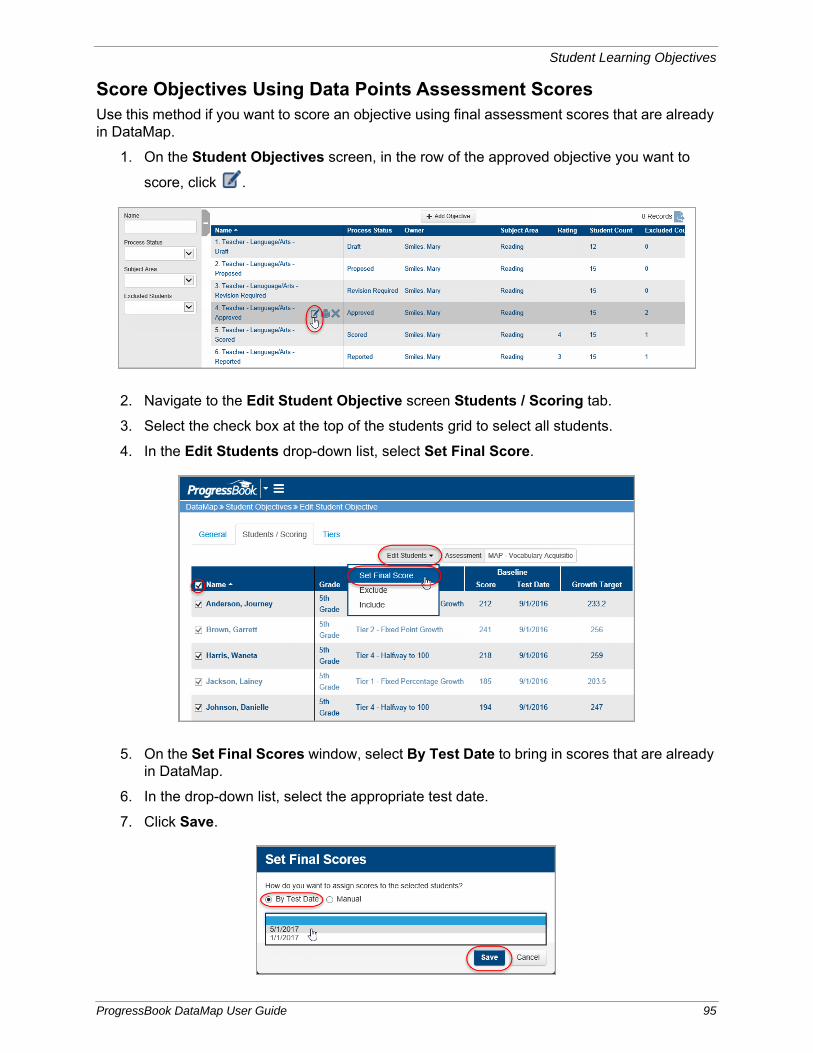
Student Learning Objectives
Score Objectives Using Data Points Assessment ScoresUse this method if you want to score an objective using final assessment scores that are already in DataMap.
1. On the Student Objectives screen, in the row of the approved objective you want to
score, click .
2. Navigate to the Edit Student Objective screen Students / Scoring tab.
3. Select the check box at the top of the students grid to select all students.
4. In the Edit Students drop-down list, select Set Final Score.
5. On the Set Final Scores window, select By Test Date to bring in scores that are already in DataMap.
6. In the drop-down list, select the appropriate test date.
7. Click Save.
ProgressBook DataMap User Guide 95
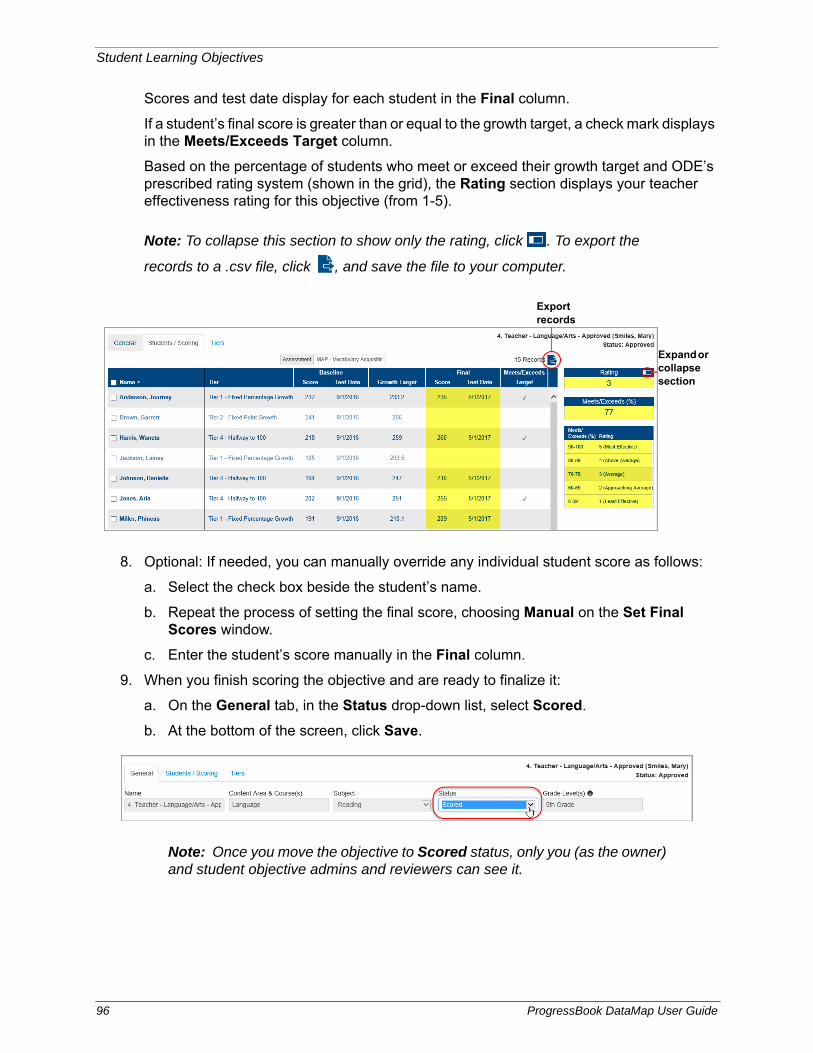
Student Learning Objectives
Scores and test date display for each student in the Final column.
If a student’s final score is greater than or equal to the growth target, a check mark displays in the Meets/Exceeds Target column.
Based on the percentage of students who meet or exceed their growth target and ODE’s prescribed rating system (shown in the grid), the Rating section displays your teacher effectiveness rating for this objective (from 1-5).
Note: To collapse this section to show only the rating, click . To export the
records to a .csv file, click , and save the file to your computer.
8. Optional: If needed, you can manually override any individual student score as follows:
a. Select the check box beside the student’s name.
b. Repeat the process of setting the final score, choosing Manual on the Set Final Scores window.
c. Enter the student’s score manually in the Final column.
9. When you finish scoring the objective and are ready to finalize it:
a. On the General tab, in the Status drop-down list, select Scored.
b. At the bottom of the screen, click Save.
Note: Once you move the objective to Scored status, only you (as the owner) and student objective admins and reviewers can see it.
Export records
Expand or collapse section
96 ProgressBook DataMap User Guide
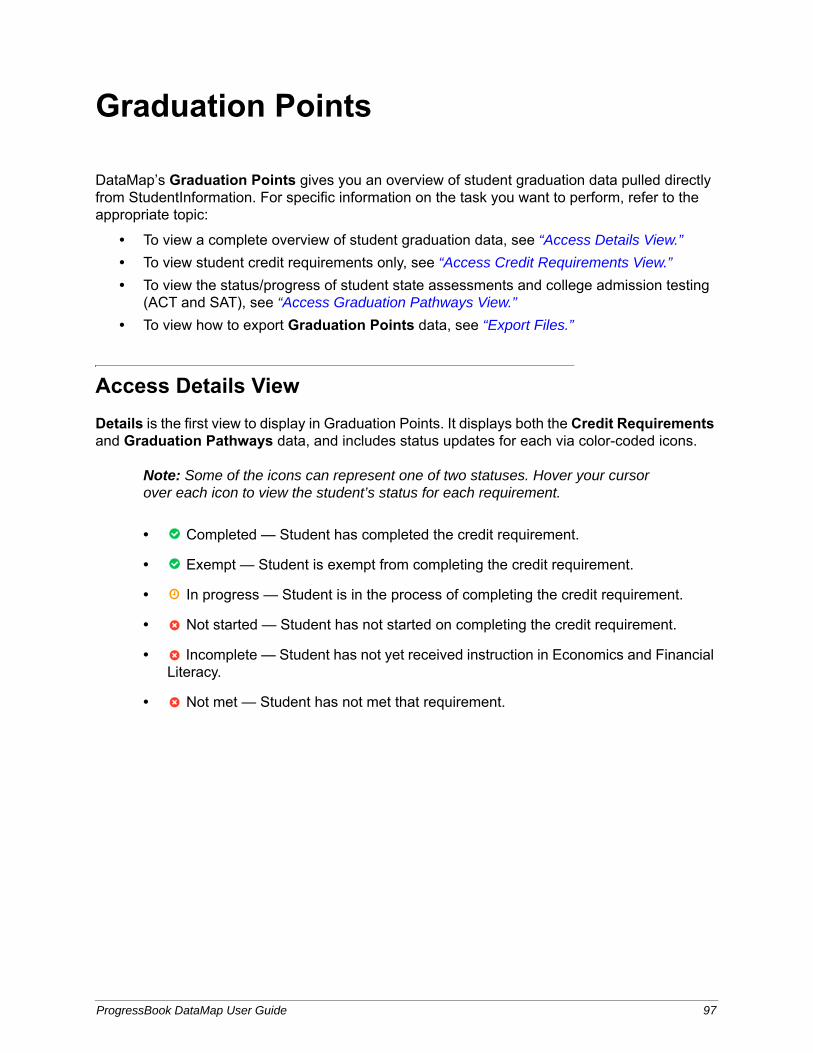
Graduation Points
DataMap’s Graduation Points gives you an overview of student graduation data pulled directly from StudentInformation. For specific information on the task you want to perform, refer to the appropriate topic:
• To view a complete overview of student graduation data, see “Access Details View.”
• To view student credit requirements only, see “Access Credit Requirements View.”
• To view the status/progress of student state assessments and college admission testing (ACT and SAT), see “Access Graduation Pathways View.”
• To view how to export Graduation Points data, see “Export Files.”
Access Details View
Details is the first view to display in Graduation Points. It displays both the Credit Requirements and Graduation Pathways data, and includes status updates for each via color-coded icons.
Note: Some of the icons can represent one of two statuses. Hover your cursor over each icon to view the student’s status for each requirement.
• Completed — Student has completed the credit requirement.
• Exempt — Student is exempt from completing the credit requirement.
• In progress — Student is in the process of completing the credit requirement.
• Not started — Student has not started on completing the credit requirement.
• Incomplete — Student has not yet received instruction in Economics and Financial Literacy.
• Not met — Student has not met that requirement.
ProgressBook DataMap User Guide 97
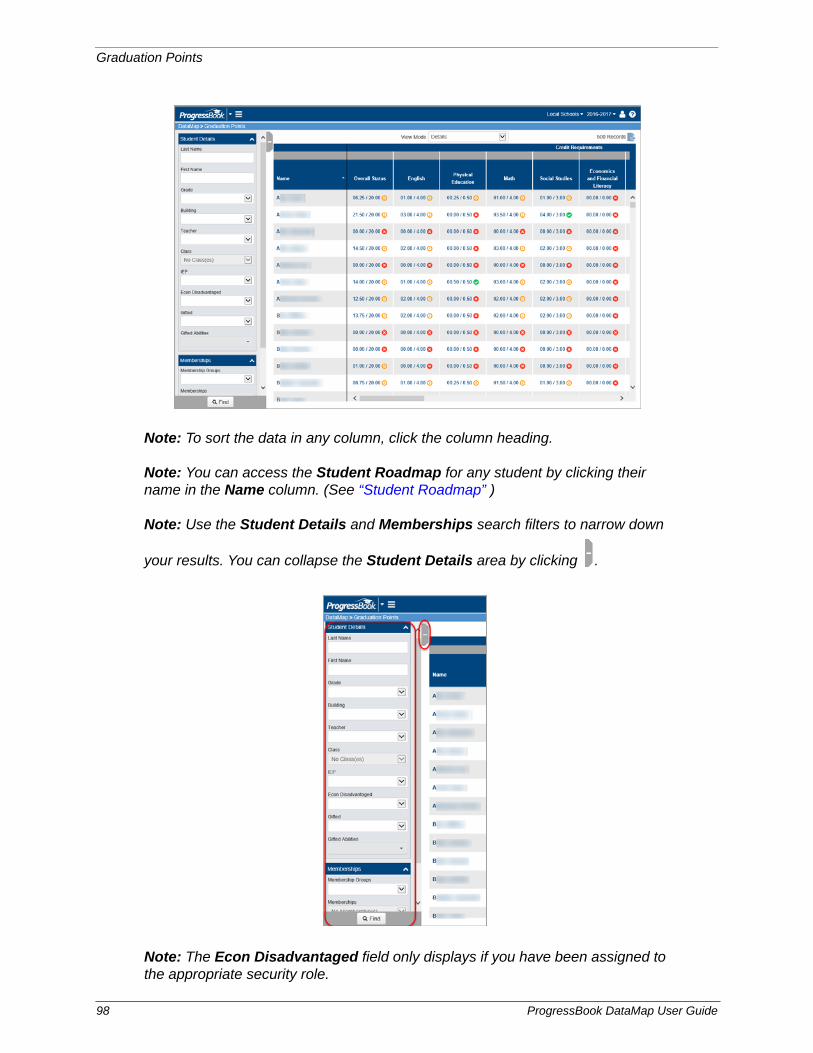
Graduation Points
Note: To sort the data in any column, click the column heading.
Note: You can access the Student Roadmap for any student by clicking their name in the Name column. (See “Student Roadmap” )
Note: Use the Student Details and Memberships search filters to narrow down
your results. You can collapse the Student Details area by clicking .
Note: The Econ Disadvantaged field only displays if you have been assigned to the appropriate security role.
98 ProgressBook DataMap User Guide
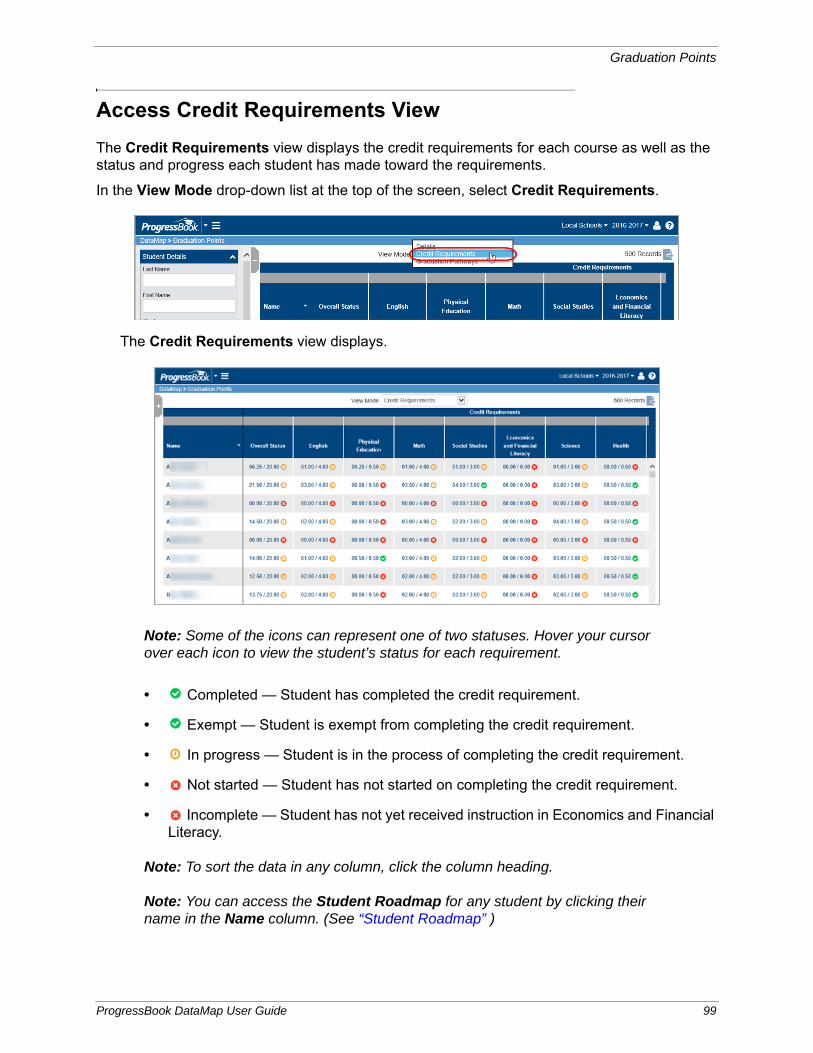
Graduation Points
Access Credit Requirements View
The Credit Requirements view displays the credit requirements for each course as well as the status and progress each student has made toward the requirements.
In the View Mode drop-down list at the top of the screen, select Credit Requirements.
The Credit Requirements view displays.
Note: Some of the icons can represent one of two statuses. Hover your cursor over each icon to view the student’s status for each requirement.
• Completed — Student has completed the credit requirement.
• Exempt — Student is exempt from completing the credit requirement.
• In progress — Student is in the process of completing the credit requirement.
• Not started — Student has not started on completing the credit requirement.
• Incomplete — Student has not yet received instruction in Economics and Financial Literacy.
Note: To sort the data in any column, click the column heading.
Note: You can access the Student Roadmap for any student by clicking their name in the Name column. (See “Student Roadmap” )
ProgressBook DataMap User Guide 99
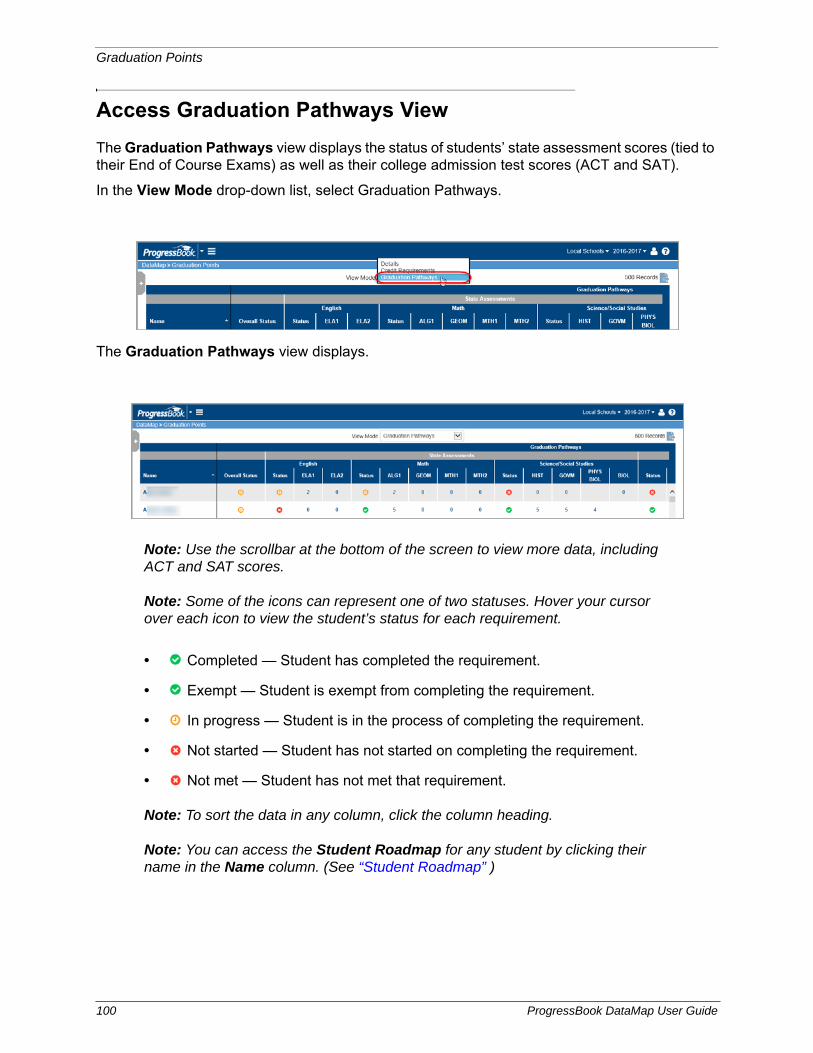
Graduation Points
Access Graduation Pathways View
The Graduation Pathways view displays the status of students’ state assessment scores (tied to their End of Course Exams) as well as their college admission test scores (ACT and SAT).
In the View Mode drop-down list, select Graduation Pathways.
The Graduation Pathways view displays.
Note: Use the scrollbar at the bottom of the screen to view more data, including ACT and SAT scores.
Note: Some of the icons can represent one of two statuses. Hover your cursor over each icon to view the student’s status for each requirement.
• Completed — Student has completed the requirement.
• Exempt — Student is exempt from completing the requirement.
• In progress — Student is in the process of completing the requirement.
• Not started — Student has not started on completing the requirement.
• Not met — Student has not met that requirement.
Note: To sort the data in any column, click the column heading.
Note: You can access the Student Roadmap for any student by clicking their name in the Name column. (See “Student Roadmap” )
100 ProgressBook DataMap User Guide

Graduation Points
Export Files
You can export the results of your Graduation Points search to an Excel spreadsheet.
1. Click at the top of the screen.
A notification displays at the bottom of your screen indicating the file has been downloaded and is ready to view and/or save.
2. Open the file to view the spreadsheet.
Note: You can choose to save the document to your computer from within the Excel application.
ProgressBook DataMap User Guide 101

Graduation Points
This page intentionally left blank.
102 ProgressBook DataMap User Guide


