The Netherlands +31 (0)24 648 86 88 Belgium +32 (0)3 309 32 09 [email protected]www.gotoPEO.com ⚖ Production data information’s are current as of publication date. Products conform to specifications per the terms of MAZeT GmbH. The information in this document is subject of change without notice, please check that this is the latest version or contact a MAZeT sales representative for availability and further information’s. Full legal notices can be found on the last pages. MAZeT GmbH db14396e V1.10 - 2015-08-18 DATASHEET SET DK MTCS-C3 Development Kit with USB interface Order No.: 090054-001-30 Status: certified INTRODUCTION The SET DK MTCS-C3 Development Kit includes the MTCS-C3 OEM sensor board embedded into a metallic casing with optical components and test software. The main components of the system and its installation and usage are described within this document. The Set DK MTCS-C3 is delivered without pre-calibration. So it is not specified for an application but was prepared for a user specific calibration as application specific setting and calibration of the system. That can be performed via known XYZ targets or similar within the application or via parallel connected spectrometer, spectral photometer, densitometer or other devices for color measurement and XYZ output. The user calibrations can be saved in the sensor within the EEPROM of the MTCS-C3 for the various applications. Data logging and evaluation options can be used for testing and analysis. The SET DK MTCS-C3 was designed as a test system under laboratory conditions – it is intended to be used for system and application tests in applications for color measurement and control. The OEM sensor board MTCS-C3 [4] is a small PCB for general color measurement and control applications, with a high bandwidth of light energy designed for in-line and handheld applications. The sensor board includes the True Color sensor MTCSiCF [2] (XYZ sensor based on the international CIE 1931 standard (human eye perception), a special analog-to-digital converter MCDC04EQ [1] with a high dynamic range (1-to-1,000,000), power supply, a μC with EEPROM for sensor data, an integrated temperature sensor and an USB interface. USB is used for external communication, configuration of the sensor, readout of the sensor data as well as writing and reading of the memory. The standard software is only designed for Windows based systems (Windows 7 and above). For Windows based customer test software MAZeT will offer a JENCOLOR ® C3 Library. Figure 1: Block diagram OEM Sensor board MTCS-C3
⚖ Production data information’s are current as of publication date. Products conform to specifications per the terms of MAZeT GmbH. The information in this document is subject of change without notice, please check that this is the latest version or contact a MAZeT sales representative for availability and further information’s. Full legal notices can be found on the last pages. M
AZ
eT G
mb
H d
b143
96e
V1.
10 -
201
5-08
-18
DATASHEET SET DK MTCS-C3 Development Kit with USB interface Order No.: 090054-001-30 Status: certified
INTRODUCTION
The SET DK MTCS-C3 Development Kit includes the MTCS-C3 OEM sensor board embedded into a metallic casing with optical components and test software. The main components of the system and its installation and usage are described within this document. The Set DK MTCS-C3 is delivered without pre-calibration. So it is not specified for an application but was prepared for a user specific calibration as application specific setting and calibration of the system. That can be performed via known XYZ targets or similar within the application or via parallel connected spectrometer, spectral photometer, densitometer or other devices for color measurement and XYZ output. The user calibrations can be saved in the sensor within the EEPROM of the MTCS-C3 for the various applications.
Data logging and evaluation options can be used for testing and analysis. The SET DK MTCS-C3 was designed as a test system under laboratory conditions – it is intended to be used for system and application tests in applications for color measurement and control.
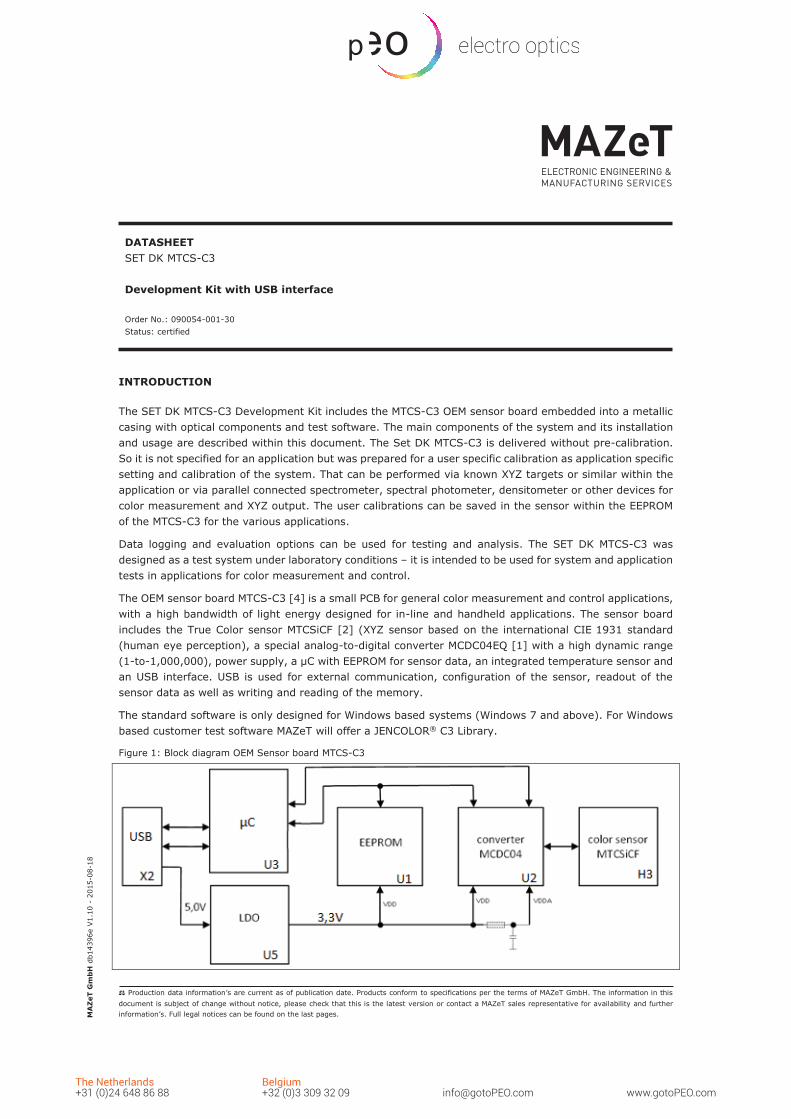
The OEM sensor board MTCS-C3 [4] is a small PCB for general color measurement and control applications, with a high bandwidth of light energy designed for in-line and handheld applications. The sensor board includes the True Color sensor MTCSiCF [2] (XYZ sensor based on the international CIE 1931 standard (human eye perception), a special analog-to-digital converter MCDC04EQ [1] with a high dynamic range (1-to-1,000,000), power supply, a µC with EEPROM for sensor data, an integrated temperature sensor and an USB interface. USB is used for external communication, configuration of the sensor, readout of the sensor data as well as writing and reading of the memory.
The standard software is only designed for Windows based systems (Windows 7 and above). For Windows based customer test software MAZeT will offer a JENCOLOR® C3 Library.
mazet.de db14396e_V1.10_certified_2015-08-18 Page 2 of 31
SET DK MTCS-C3
V1.10
The description of the sensor, converter, OEM hardware, I²C communication, sensor interface and application notes to initialize the sensor and for special functions can be found in the reference documents – see chapter 10. All links to the reference documents are located at the last section of this document.
The following chapters describe the Development Kit and especially the software setup and usage for Windows PCs. Please make sure to install all libraries and the test software before connecting the Development Kit to a computer via USB. Otherwise the test software only runs a demonstration mode (not with spectrometer functions) and does not make real measurements.
mazet.de db14396e_V1.10_certified_2015-08-18 Page 4 of 31
SET DK MTCS-C3
V1.10
1 SCOPE OF DELIVERY
The SET DK MTCS-C3 includes:
▪ One or more sensor board(s) DK MTCS-C3 ▪ Documentation: data sheet and more on USB stick ▪ Setup for PC test software, driver and MATLAB Compiler Runtime on USB stick ▪ USB cable (original <3 m) ▪ Optional JENCOLOR® C3 Library
For the scope of delivery of alternatives of SET DK MTCS-C3 see the following table.
Table 1: Scope of delivery for MTCS-C3 product family
Name DK MTCS-C3 JENCOLOR® Sensor with USB-Interface
SET DK MTCS-C3 Development Kit
with USB-Interface
Article 090054-001-271 090054-001-301
Form of product Packaged sensor Packaged sensor with PC interface, USB cable and test
software
Type of delivery Plastic cases in carton Special case with inserted components
Sensor-IC MTCSiCF O O
Signal converter MCDC04EQ O O
Interface description O O
USB interface O O
Firmware µP-programmed O O
JENCOLOR® C3 Library (O)3 On request
Test software --- O
Sensor package O O
USB cable --- O
Suitcase for components --- O
1 Please note, the color sensor is inserted in a metallic package for EMC safety reasons - but this sensor package cannot prevent static discharges. So sensor handling precautions should be observed to avoid static discharge.
mazet.de db14396e_V1.10_certified_2015-08-18 Page 5 of 31
SET DK MTCS-C3
V1.10
Table 2: Scope of delivery for MTCS-C3
Name MTCS-C3 JENCOLOR® Sensor
Board with USB-Interface
SET MTCS-C3 JENCOLOR® Development Board
with USB-Interface
Article 090010-172-252 090010-172-302
Form of product OEM sensor PCB OEM Sensor PCB with USB interface, USB cable and test software
Type of delivery Plastic cases in carton Special case with inserted components
Sensor-IC MTCSiCF O O
Signal converter MCDC04EQ
O O
Optional optical optics (O)3 Order# E082Z000847
O
Interface description O O
USB interface O O
Firmware µP-programmed O O
JENCOLOR® C3 Library (O)3 On request
Test software --- O
Sensor package --- ---
USB cable --- O
Suitcase for components --- O
2 SYSTEM REQUIREMENTS
The minimum system requirements are the following:
▪ PC Pentium 1000 MHz or better, 512 MB RAM, one free USB (2.0) port ▪ 1.5 MB free hard drive memory (+ ca. 1.3 GB for MATLAB Compiler Runtime) ▪ .Net Framework 4.54 ▪ Microsoft Windows 7 and above ▪ (optional5 for import/export functions) Microsoft EXCEL
2 Please note, the color sensor is a PCB without package. So sensor handling precautions should be observed to avoid static discharge. 3 Optional, must be ordered separately. 4 Use the download from Microsoft’s websites to install original .NET Framework. 5 E.g. recommend to use some special program functions like write protocol and others
mazet.de db14396e_V1.10_certified_2015-08-18 Page 7 of 31
SET DK MTCS-C3
V1.10
4 START-UP, INSTALLATION, UPDATES
This section of the document describes how to install and use the MTCS-C3 PC-software.
After installing the software and drivers connect the sensor board(s) to free USB port(s) of the computer. By using more than one sensor please check that the PC system is able to recognize all sensors. Note, common USB hubs may not be able to connect all sensors. It is required to have administration rights and an Internet connection during the installation process. To start the installation of the software just execute the setup.exe file and all required files is installed automatically.
If no driver has been found or the system cannot find a required DLL and an error message appears; it is required to manually install the driver and libraries on your system. These files for installation are found within the directory of the Setup software.
The sensor board is configured via start-up values but it is necessary to change and adapt them for your application. Select the parameters for amplification and conversion to get a maximum of digits and stable sensor results.
The MTCS-C3 software is prepared to work with one or more sensor(s) (DK) MTCS-C3 and in addition (optional) with a special (prepared) spectrometer parallel during the calibration process. Please ask our sales team for information about the supported devices6 and the installation process of add-on drivers for the spectrometers to use this option.
4.1 Firmware
The software on C3’s Microcontroller is named firmware. It’s a fixed part of the sensor system. In case of MAZeT will insert new or optional functions into the firmware and send a new release then use an update software named BootLoader7 to upload the new firmware into your sensor system via USB and PC. This upload software, a .bin file as binary source, a batch file to start the upload function and comments as readme.txt are parts of the delivery of MAZeT in case of a firmware update.
4.2 Sensor Software Interface and JENCOLOR® C3 Library
The sensor software interface is described in [8]. This description can be used to implement the C3 sensor in customized test systems. Depend on the scope of delivery MAZeT alternatively offers a JENCOLOR® C3 Library [9] with pre-designed sensor algorithms which can be used to implement the C3 sensor into own test software. This DLL files are stored on the same medium as the install software and documents or must be ordered separately. Please copy the required files from the install medium or alternatives into the own directories. The process which install the test software will not copy any DLL file or documentations. Please note also any readme.txt in case of using the JENCOLOR® C3 Library.
4.3 Software
All installation software tools can be found in the setup directory of the USB drive. Normally the setup software (setup.exe) will install the test software MTCS-C3 and necessary driver and DLLs. Execute the Setup file and follows the installation steps.
If the USB drivers cannot be installed automatically then please install them manually. The file “VCP_V1.3.1_Setup.exe” is used for 32 bit Windows systems and the file “VCP_V1.3.1_Setup_x64” is used for 64 bit systems depending on your computer system. Please check the connection before starting Setup again.
6 Currently: JETI Specbos 1201/1211 are supported. Ask our sales team for alternatives. The referred driver for the spectrometer must be installed before the MTCS-C3 software was started. 7 Our sales team will contact you and send it or ask for the software:
mazet.de db14396e_V1.10_certified_2015-08-18 Page 8 of 31
SET DK MTCS-C3
V1.10
For installation of the test software the MATLAB Compiler Runtime 8.2 version or compatible is required. The setup routines check internally for the required MATLAB DLLs and will install them if necessary8. Use the file “MCR_R2013b_win32_installer.exe”8 to install the library manually in case any errors occur.
In case of new software releases MAZeT will send the update typically as setup.exe. If necessary please use this setup.exe to install the update. More details for the new release will be in a file named readme.txt with comments the update.
4.4 Repair and Remove
The Setup software also allows to repair and uninstall the MTCS-C3 software as long as the software is installed on the local computer. The Setup Wizard opens and the user needs to select the Repair or Remove option in the second window.
Please note, the Remove procedure only deletes all files and directories of the test software MTCS-C3. Drivers and MATLAB DLLs must be deleted manually by using standard Windows procedure (“System control”, “Programs and functions”).
8 The install software for MATLAB (MCR_R2013b_win32_installer.exe) must be/is located in the same directory than the setup.exe.
mazet.de db14396e_V1.10_certified_2015-08-18 Page 9 of 31
SET DK MTCS-C3
V1.10
5 SOFTWARE
5.1 Startup Configuration
Starting the program is possible with/without using a spectrometer6 parallel to the color sensor. Please note, a spectrometer is required for the sensor calibration and increases the software initialization time. The startup configuration chooses which hardware will be scanned. When using a spectrometer the startup configuration must be configured as following (chapter 5.6):
▪ Create/copy a shortcut from the software ▪ right-click to the shortcut and open the properties ▪ within the shortcut tab, add the line: “-useSpectrometer” at the end of the target field
Immediately after executing the test software “MTCS-C3 Testsoftware.exe” an initialization window appears which starts and scans the system for existing devices. This window indicates the scan progress and reads the current sensor configuration for each connected sensor board. Depending on the used PC hardware, system software and used interfaces this process could take a few moments. Please do not interrupt this process.
mazet.de db14396e_V1.10_certified_2015-08-18 Page 10 of 31
SET DK MTCS-C3
V1.10
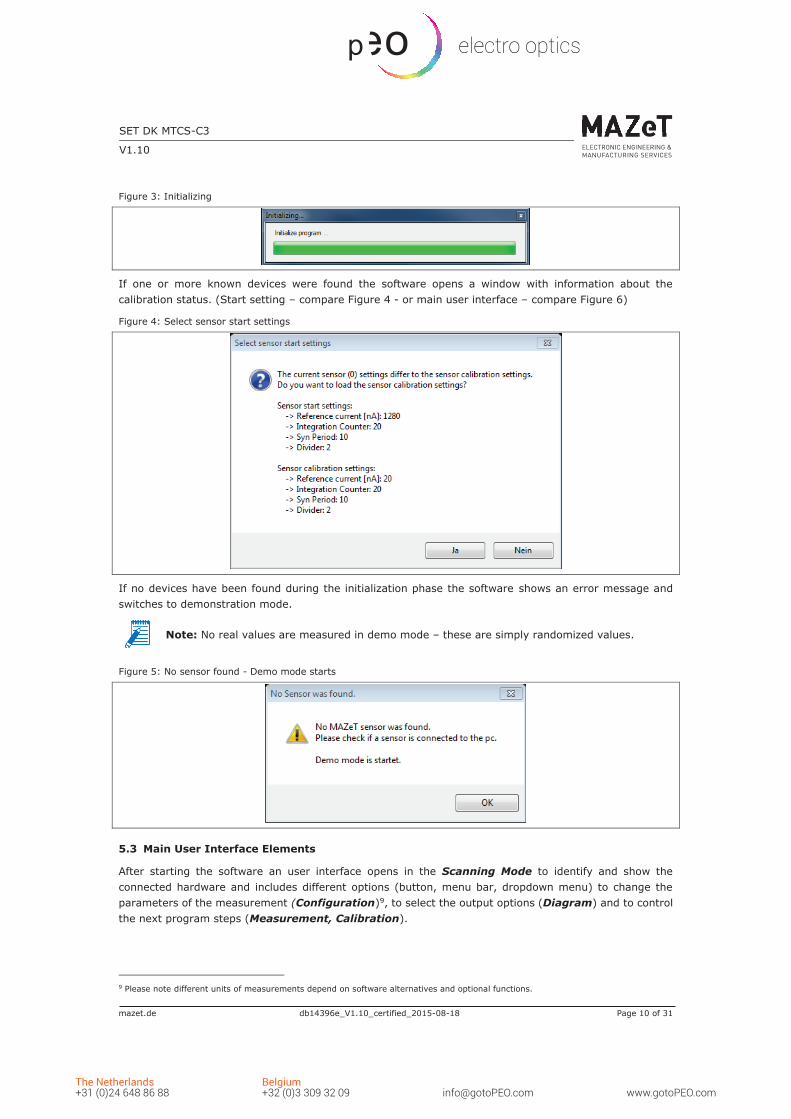
Figure 3: Initializing
If one or more known devices were found the software opens a window with information about the calibration status. (Start setting – compare Figure 4 - or main user interface – compare Figure 6)
Figure 4: Select sensor start settings
If no devices have been found during the initialization phase the software shows an error message and switches to demonstration mode.
Note: No real values are measured in demo mode – these are simply randomized values.
Figure 5: No sensor found - Demo mode starts
5.3 Main User Interface Elements
After starting the software an user interface opens in the Scanning Mode to identify and show the connected hardware and includes different options (button, menu bar, dropdown menu) to change the parameters of the measurement (Configuration)9, to select the output options (Diagram) and to control the next program steps (Measurement, Calibration).
9 Please note different units of measurements depend on software alternatives and optional functions.
mazet.de db14396e_V1.10_certified_2015-08-18 Page 11 of 31
SET DK MTCS-C3
V1.10
Figure 6: Main User interface elements
Configuration (Sensor settings): The most important parameters can be changed directly by the user. It is possible to initialize and control the measurements (see chapter 5.5 ). After activating via pressing the ‘Start’ button the test software begins with the measurements. Measurements will be performed sequentially in continuous mode. By selecting parameters such as Integration Time, Divider or Amplification, the sensor system can be directly controlled by the user.
Get pwm period: An optional function10 of MTCS-C3 is a frequency measurement & flicker compensation for monitors or displays which operate with specific background PWM frequencies. A Fourier transformation algorithm is utilized to determine these effects and analyzes the measurement frequency in relation to the display-specific PWM. The result is the potential detection of a dominant frequency and compensation recommendation. The analysis is performed at 2000 Hertz detection frequency. The settings of IntegrationCounter, reference current and divider are ignored during this detection procedure.
Spectrometer: Configures an optional spectrometer device for additional measurements by such a device. This one can be used as a reference to compare the measurement results that are taken by the sensor and optimize calibration procedures (see 5.7 ).
Measurement: Gives the option to modify the behavior during a measurement such as delay or the color space of the connected device. Additionally, the measurement can be started or stopped here (see 5.8).
10 If a grey button for that function is active then this function was not activated. Please contact our sales team if you have an interest to use this function.
mazet.de db14396e_V1.10_certified_2015-08-18 Page 12 of 31
SET DK MTCS-C3
V1.10
Delta values & plot: Allows to compare the measurement values to reference values that can be selected. Furthermore, the delta plot can be activated or deactivated. If only one Sensor is connected or more than one device (sensor, spectrometer) with different numbers of measurements is selected, the delta function is disabled or will be stopped by an error.
5.4 Menu Bar
The menu bar includes the functions to start the calibration or save the results to the device, export measurement data, clear measurement values and measure user defined colors via a color patch feature.
Figure 7: Menu bar
Show sensor information: Use this option to show information about the connected sensors. A table shows the serial number and the firmware version of all connected sensors.
Calibrate (F2): Use this option to start a calibration process (also compare chapter 5.10). If no calibration has been performed, the status of calibration is invalid and the button is highlighted in red. After completing a calibration the status is valid and the button is highlighted in green. Changing the amplification values or integration time may require a re-calibration.
Export to Excel (F3): Use this option to save the measurement and calibration data to a file11.
Excel (F3): Saves the data to an .XLSX file of MS Excel.
csv (F6): Saves the data to a .CSV file (tab stops as separator). All data and the results of each sensor(s) and spectrometer will be saved to an extra file according to the following pattern: “MTCS-C3_TIMESTAMP_sens_SERIAL.csv” or “MTCS-C3_TIMESTAMP_spectrometer_SERIAL.csv”
▪ TIMESTAMP: is the time and date of export data: YYYY-MM-DD_hh-mm-ss ▪ SERIAL: is the serial number of the sensor or the spectrometer ▪ Example: MTCS-C3_2014-10-14_11-39-30_sensor_100001
The Clear measurements (F4) button deletes all measurement values and closes the Color space window. But it does not delete any register settings12.
The Measure color patch (F5) button allows to measure defined colors. The user can insert own colors as RGB values. (For example [255; 0; 0] for red) All inserted RGB colors are shown in a separate window and can be measured via all connected sensors. The user can move the window to any position on the screen (also compare chapter 5.10).
11 Needs an installed MS Excel software on PC. 12 Please note that register settings only could be changed by new writing or after a hardware reset to default via USB disconnection/connection.
mazet.de db14396e_V1.10_certified_2015-08-18 Page 13 of 31
SET DK MTCS-C3
V1.10
5.5 Configuration
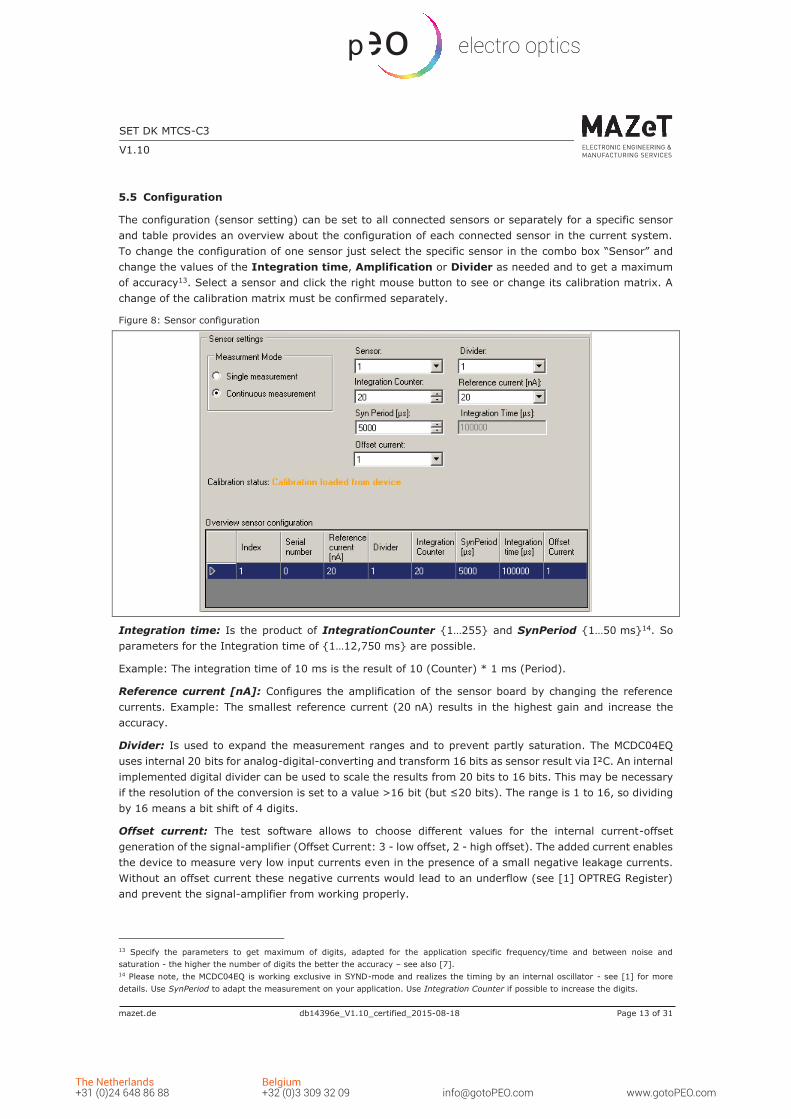
The configuration (sensor setting) can be set to all connected sensors or separately for a specific sensor and table provides an overview about the configuration of each connected sensor in the current system. To change the configuration of one sensor just select the specific sensor in the combo box “Sensor” and change the values of the Integration time, Amplification or Divider as needed and to get a maximum of accuracy13. Select a sensor and click the right mouse button to see or change its calibration matrix. A change of the calibration matrix must be confirmed separately.
Figure 8: Sensor configuration
Integration time: Is the product of IntegrationCounter {1…255} and SynPeriod {1…50 ms}14. So parameters for the Integration time of {1…12,750 ms} are possible.
Example: The integration time of 10 ms is the result of 10 (Counter) * 1 ms (Period).
Reference current [nA]: Configures the amplification of the sensor board by changing the reference currents. Example: The smallest reference current (20 nA) results in the highest gain and increase the accuracy.
Divider: Is used to expand the measurement ranges and to prevent partly saturation. The MCDC04EQ uses internal 20 bits for analog-digital-converting and transform 16 bits as sensor result via I²C. An internal implemented digital divider can be used to scale the results from 20 bits to 16 bits. This may be necessary if the resolution of the conversion is set to a value >16 bit (but ≤20 bits). The range is 1 to 16, so dividing by 16 means a bit shift of 4 digits.
Offset current: The test software allows to choose different values for the internal current-offset generation of the signal-amplifier (Offset Current: 3 - low offset, 2 - high offset). The added current enables the device to measure very low input currents even in the presence of a small negative leakage currents. Without an offset current these negative currents would lead to an underflow (see [1] OPTREG Register) and prevent the signal-amplifier from working properly.
13 Specify the parameters to get maximum of digits, adapted for the application specific frequency/time and between noise and saturation - the higher the number of digits the better the accuracy – see also [7]. 14 Please note, the MCDC04EQ is working exclusive in SYND-mode and realizes the timing by an internal oscillator - see [1] for more details. Use SynPeriod to adapt the measurement on your application. Use Integration Counter if possible to increase the digits.
mazet.de db14396e_V1.10_certified_2015-08-18 Page 14 of 31
SET DK MTCS-C3
V1.10
The offset current is added to the input current of the sensor and therefore also shows in the conversion result of the amplifier. To eliminate the artificial offset current from the conversion result a theoretical value corresponding to the added offset is subtracted later in the software. In case of small negative/positive leakage currents on the board this subtraction leads to negative/positive digital values in the software, which show the correct current and current direction at the input pins of the signal amplifier. To quantify these small negative/positive leakage currents we always recommend to perform a dark measurement before the start of serious measurements (completely cover the sensor).
Therefore a dark measurement is always an essential part of the calibration process (see Chapter 5.10 ).
Calibration status: shows the status of the calibration of the selected sensor (or all)
▪ Not calibrated: No calibration data was found on the sensor (standard - if the sensor will be used for first time).
▪ Calibrated: The sensor has been calibrated since the software was started. ▪ Calibrated manually: The sensor has been calibrated manually since the software was started ▪ Calibration loaded from device: The calibration data has been read from the sensor device and
loaded into the software calculation process. ▪ Calibrated to different settings: The parameters for divider and/or reference current have been
changed since the last calibration. ▪ The calibration of the devices differ: There are different calibration states on the sensors. This
information is only shown, when more than one sensor with different parameters has been selected.
▪ Please check the calibration of all devices: There is a calibration error within a device. This information is only shown, when multiple sensors have been selected.
Overview sensor configuration: The table shows the different sensors and their settings AND allows to change the calibration matrix manual. Select a sensor to change the settings.
Show and edit calibration matrix and dark current (click right mouse button): The current calibration matrix and dark current as noise for the selected sensor is shown. The calibration matrix can be edited for each individual sensor. The values can be copy and pasted by right-clicking the mouse button.
Note: When pasting values, these need to be tab stop separated or an XLS array). Otherwise the new values can be edited manually. The window can be closed by standard close button [x].
Note:. Be careful by using this function because deleted values cannot be restored.
Figure 9: Calibration matrix / values for dark current after the process calibration / reading the sensor values from EEPROM
mazet.de db14396e_V1.10_certified_2015-08-18 Page 15 of 31
SET DK MTCS-C3
V1.10
5.6 Get PWM period
Certain monitors or displays operate with specific background PWM frequencies up to 1000 Hertz (ideal 50~250 Hertz). These frequencies can lead to an overlap of the signal measurement and to oscillating measurement results.
The test software of the MTCS-C3 utilizes an integrated frequency identification and compensation method (PWM detection) to determine dominant error frequencies.
A Fourier transformation algorithm is utilized to determine these effects and analyzes the measurement frequency in relation to the display-specific PWM.
The result is the potential detection of a dominant frequency and compensation recommendation. The analysis is performed at 2000 Hertz detection frequency.
The settings of IntegrationCounter, reference current and divider are ignored during this detection procedure. For more details please see [6].
Note: This function is optional and must be ordered separately. Please contact our sales team if you want to order it.
5.7 Spectrometer
These features are optional and active if the startup parameter was set (see chapter 5.1) and a sensor MTCS-C3 and a spectrometer6 work parallel. In following the functions, parameters and windows used for the spectrometers from JETI Specbos 1201/1211 are described. For further technical details of the spectrometer please check the individual description of the device.
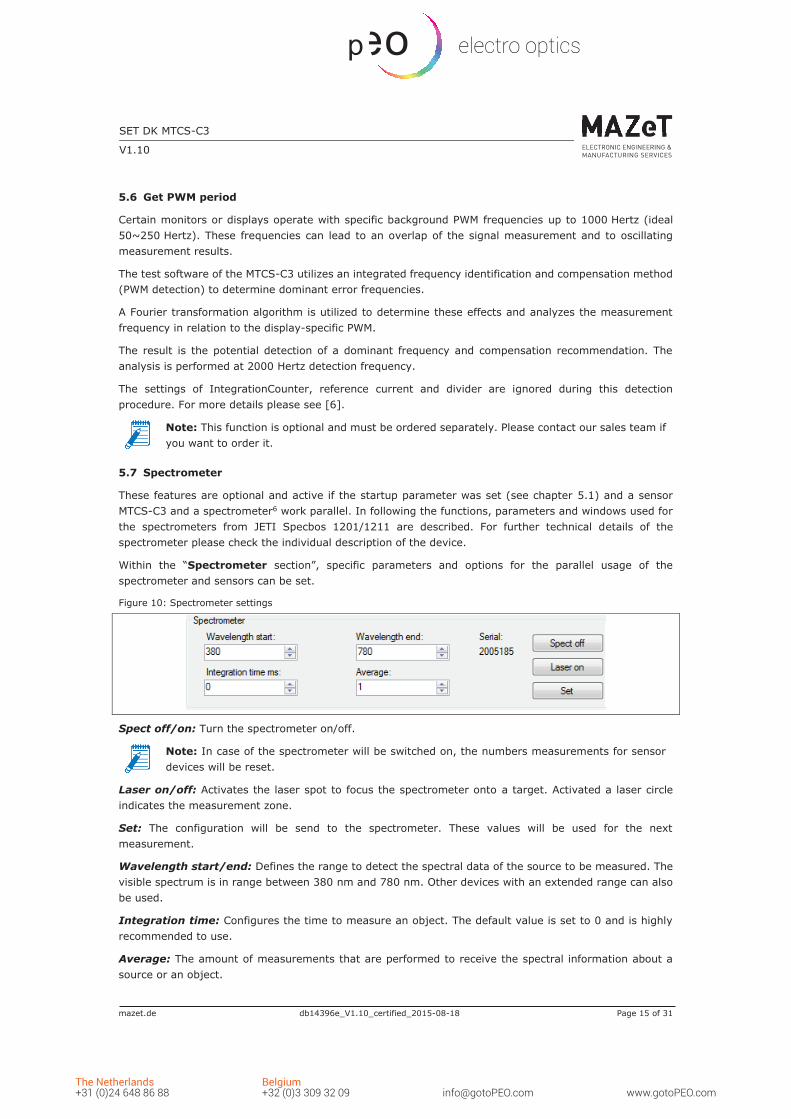
Within the “Spectrometer section”, specific parameters and options for the parallel usage of the spectrometer and sensors can be set.
Figure 10: Spectrometer settings
Spect off/on: Turn the spectrometer on/off.
Note: In case of the spectrometer will be switched on, the numbers measurements for sensor devices will be reset.
Laser on/off: Activates the laser spot to focus the spectrometer onto a target. Activated a laser circle indicates the measurement zone.
Set: The configuration will be send to the spectrometer. These values will be used for the next measurement.
Wavelength start/end: Defines the range to detect the spectral data of the source to be measured. The visible spectrum is in range between 380 nm and 780 nm. Other devices with an extended range can also be used.
Integration time: Configures the time to measure an object. The default value is set to 0 and is highly recommended to use.
Average: The amount of measurements that are performed to receive the spectral information about a source or an object.
mazet.de db14396e_V1.10_certified_2015-08-18 Page 16 of 31
SET DK MTCS-C3
V1.10
5.8 Measurement Configuration
Within the “Measurement section” the delay between the measurement and the selected color spaces for the specific sensor can be set. Additionally, the measurement procedure can be started and stopped here.
Figure 11: Measurement settings
Delay: Sets the waiting period between 2 measurements in milliseconds. The value has an accuracy of ±20 ms depending on the internal Windows scheduler. The minimum delay is equal to the integration time plus a specific time offset.
Sensor & Spectrometer: Configures the color standard to plot for the connected devices. The color standard for the spectrometer is only activated if such a device is connected. Following plots are available.
Note: They can be changed every time before or during measurements
Table 4: Measurement values
MEASURE(/STOP): Start the measurement procedure all connected devices and their respective configuration or stop the measurements. Additionally, the plot opens to show the measurement values (check Figure 12: Example for active plot).
15 Depends on the spectrometer and software implementation; available only for a limited amount of spectrometer. 16 Raw data’s of ADC with consideration of an internal Offset Value (see [1] Options Register OPTREG), without correction of dark current. This internal Offset Value will be considered by the software algorithm during the process of following calculations like photo current, XYZ values and others. 17 Calculated photo current based on Raw data’s with consideration of dark current if done. 18 By using parameters of customer’s calibration and standards of CIE1931.
Measurement variable Measured by C3 sensor Measured by Spectrometer15
mazet.de db14396e_V1.10_certified_2015-08-18 Page 17 of 31
SET DK MTCS-C3
V1.10
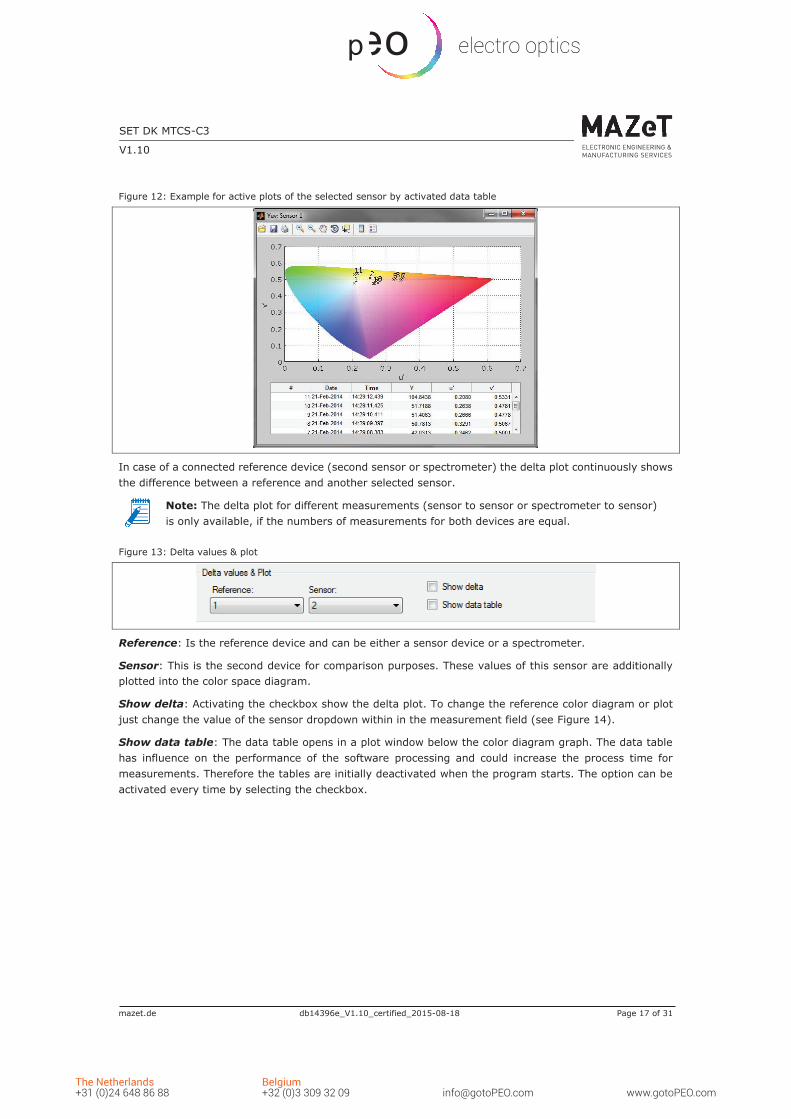
Figure 12: Example for active plots of the selected sensor by activated data table
In case of a connected reference device (second sensor or spectrometer) the delta plot continuously shows the difference between a reference and another selected sensor.
Note: The delta plot for different measurements (sensor to sensor or spectrometer to sensor) is only available, if the numbers of measurements for both devices are equal.
Figure 13: Delta values & plot
Reference: Is the reference device and can be either a sensor device or a spectrometer.
Sensor: This is the second device for comparison purposes. These values of this sensor are additionally plotted into the color space diagram.
Show delta: Activating the checkbox show the delta plot. To change the reference color diagram or plot just change the value of the sensor dropdown within in the measurement field (see Figure 14).
Show data table: The data table opens in a plot window below the color diagram graph. The data table has influence on the performance of the software processing and could increase the process time for measurements. Therefore the tables are initially deactivated when the program starts. The option can be activated every time by selecting the checkbox.
mazet.de db14396e_V1.10_certified_2015-08-18 Page 18 of 31
SET DK MTCS-C3
V1.10
Figure 14: Reference (delta) measurement
5.9 Color Patch
Color patch (Quick open via F5) or opened in calibration mode - is a window that can be used to generate user defined colors via RGB coordinates, for example (255, 0, 0) for red and (255,255,255) for white. After starting, it is possible to enter or import RGB coordinates for the color patch.
Figure 15: Import window - Color patch for 3 colors (rgb)
For the standard of three targets the RGB targets values can entered manually into the RGB matrix, like shown in Figure 15. It is also possible to fill the matrix values via ‘copy & paste’ of (3 x n) values for example from an Excel sheet.
It is also possible to import the data directly from Excel. Simple enter the required vales (ranging from 0 to 255) into an Excel sheet and select them all. Finally, just click ‘Import from xls’ and the values are loaded into the table. This is recommenced, when using multiple targets.
mazet.de db14396e_V1.10_certified_2015-08-18 Page 19 of 31
SET DK MTCS-C3
V1.10
Figure 16: Import window – Color patch import via Excel for RGB
After clicking ‘OK’ the Color patch window opens showing the color in the window and the RGB coordinates in its headline. Simply place this window in front of your measurement devices to measure it. The colors will be changed automatically after each device has properly performed the measurement. After all colors have been measured the color patch continues with the first color again, and cycles through.
Figure 17: Color patch window
5.10 Calibration
In general a calibration procedure is used to match the target color values with the application specific usage of the MTCS-C3 system, to obtain a nearly identical behavior of all measuring systems to another (compensate tolerances) and last not least it is essential that defined goals (reference values, operating conditions, light sources, etc.) are used to achieve the highest possible accuracy19.
Note: An absolute and accurate color measurement based on CIE1931 without calibration is not possible!
Traditionally reference values are measured via spectrometer or have to be known prior to the calibration process.
The calibration option is used to create a sensor specific calibration matrix via targets measured by a reference device such as a spectrometer. The standard calibration simply uses an identity matrix which approximates the color space values. Therefore it is recommended to calibrate the sensor in the configuration options for the specific application to get accurate results.
The results of a True Color sensor are XYZ coordinates that can be transformed into all shown color spaces. Please note that a performed calibration is only valid as long as the configuration of this application remains the same.
19 Normally, after calibration of the measurement system accuracies are possible that surpass the minimum error of the True Color to CIE 1931 (e.g. better than human eye, Delta u'v '<0.003). However, the measurement accuracy depends on many factors such as calibration algorithm, calibration target, faults and external influences as well as from the used reference device.
mazet.de db14396e_V1.10_certified_2015-08-18 Page 20 of 31
SET DK MTCS-C3
V1.10
Note: Changing the amplification level, requires a re-calibration.
This section describes how to calibrate device with MTCS-C3. For more details, like possible errors during the calibration process, target values for accuracy, variations in calibration, please ask our sales team for application notes or white papers.
Initially it is required to configure set goals for the calibration and to choose the reference values that need to be measured. The main variables are the number of calibration targets and observer (see colorimetric settings of your reference device). The usage of a spectrometer is optional if the XYZ values or the reference targets are known. If a reference device is connected all measurements are performed in parallel with a spectrometer and the sensor boards.
Figure 18: Configuration of the calibration
If the color patch is selected a window opens to insert the target values to calibrate directly on your screen. For further information please read chapter 5.9.
Figure 19: Configuration of the calibration
In the next step it is required to detect the dark current values of the sensor. The dark current IDark will be measured by the capsuled sensor. This step is but highly recommended to compensate the dark current of the photo diodes and will be needed for calculation photo currents for the sensor signals (as sensor response) and for the CIE1931 color points (sensor result).
mazet.de db14396e_V1.10_certified_2015-08-18 Page 21 of 31
SET DK MTCS-C3
V1.10
Figure 20: Calibration – dark current measure request
The software now guides the user through the calibration process and requests to setup and place the measurement devices. The following screenshot shows the activated color patch.
Figure 21: Calibration request to measure
Finally, when all specified colors of the color patch (see chapter 5.9) are measured the next step is to import/insert the XYZ values of the reference device20. The reference values can be added directly in the window into the matrix or by importing them for example from Excel.
Note: The reference values need to be measured in parallel and under same operating conditions (room temperature, device position, etc.). Use the color patch on the same reference device otherwise the calibration is invalid and/ or inaccurate.
Note: The usage of a unity matrix (all diagonal “1”) in the reference matrix means all sensor values are converted without reference/correction within the color space. These can be used for tests but are only approximate values. By using the diagonal values ”1 1 2” the effect of the blue filter is increased.
20 This is not necessary if a supported device was connected during the calibration process.
mazet.de db14396e_V1.10_certified_2015-08-18 Page 22 of 31
SET DK MTCS-C3
V1.10
Figure 22: Import / Insert XYZ reference values21
After confirming the reference input values via ‘OK’ button a message box appears and confirms the successful calibration. The calibration values are stored internally on the device and can be checked directly in the test software (see Figure 9) or via Excel export (compare chapter 5.4).
Figure 23: Extract of protocol .XLSX file with XYZ reference values, sensor data‘s and calibration matrix
Note: A calibration is valid for the used system and defined application. It is not required to re-calibrate until the system configuration or measurement parameters are changed.
For example changing the light source, target and distance to the sensor/object or the reference current require a re-calibration. Under normal usage after calibration the program configuration, e.g. integration time, the calibration remain the same.
21 Please note the notation „.“ when entering point values.
mazet.de db14396e_V1.10_certified_2015-08-18 Page 23 of 31
SET DK MTCS-C3
V1.10
6 QUICK START GUIDE
STEPS ACTION BASICS RESULT COMMENT / DESCRIPTION
Initializing Test system
Install software and drivers
Connect sensor boards via USB
Software and hardware are available, all system requirements are fulfilled
Installed software with one or more USB sensor(s) connected
See chapter 4
Setting / control parameters
Set SynPeriod Set IntegrationCounter Set Reference current (gain) Set Divider
Depending on timing of the application An ideal ratio between noise (digits) and brightness digits needs to be found (several thousands) Decrease until the digits are in a range with an excellent ratio between noise (digits) and brightness digits (several thousands) To prevent the risk of saturation increase divider as long as the sensor is not in saturation otherwise decrease gain or IntegrationCounter
Found the ideal time management Optimal digits = high accuracy Optimal digits = high accuracy Optimal digits = high accuracy
SynPeriod must be suitable for your application (See chapter 5.5) Specify it as low as possible but so high as necessary (See chapter 5.5) Specify it as low as possible but so high as necessary (See chapter 5.5) If possible decrease amplification to prevent saturation, consider the divider in the signal calculation (See chapter 5.5
Sensor calibration
Dark measurement Option #1 Known target values Option #2 Spectrometer Option #3 Trial & Error
Consider electronically noise – needed to increase accuracy Use known XYZ values for the calibration target Use an existing spectrometer which is supported by the test software of MAZeT Use a virtual calibration via simple calibration
matrix 1 0 00 1 00 0 2
IDark which correct sensor result ADC digit Possible calibration for the existing target Possible calibration of any target No existing reference values and spectrometer
See Fehler! erweisquelle konnte nicht gefunden werden. See chapter 5.10 See chapter 5.7 No absolute measurement, estimation values for relative color measurement
mazet.de db14396e_V1.10_certified_2015-08-18 Page 24 of 31
SET DK MTCS-C3
V1.10
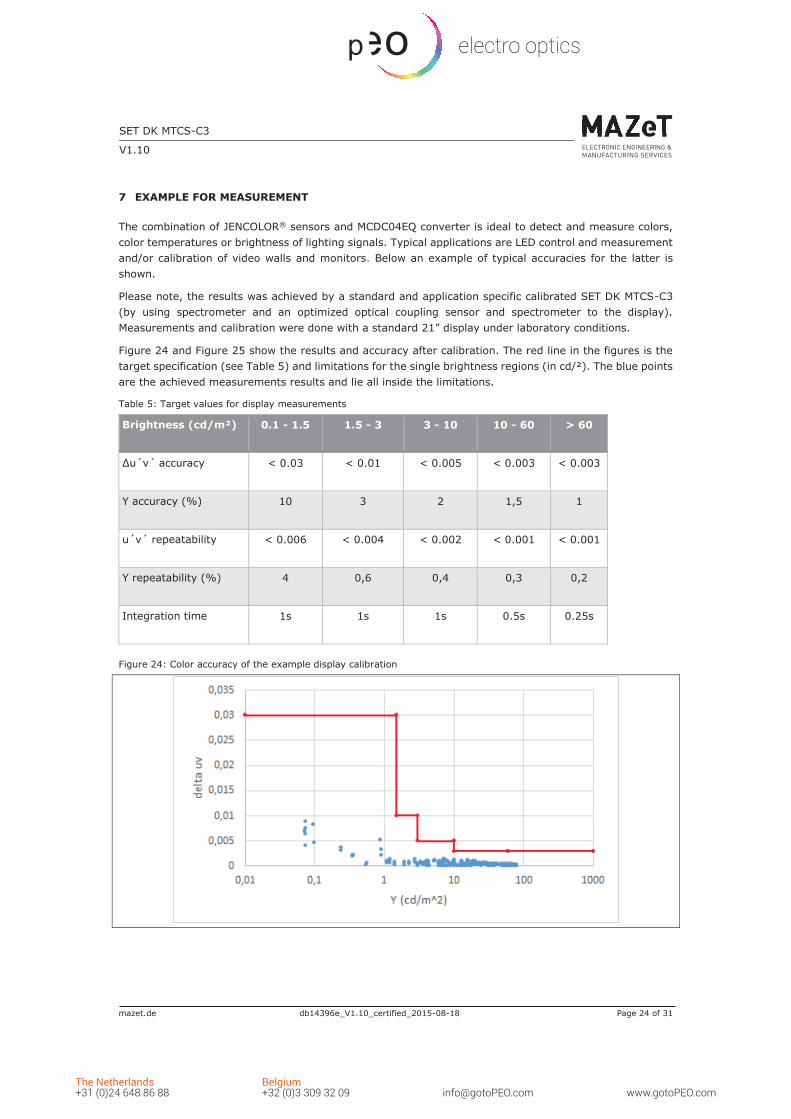
7 EXAMPLE FOR MEASUREMENT
The combination of JENCOLOR® sensors and MCDC04EQ converter is ideal to detect and measure colors, color temperatures or brightness of lighting signals. Typical applications are LED control and measurement and/or calibration of video walls and monitors. Below an example of typical accuracies for the latter is shown.
Please note, the results was achieved by a standard and application specific calibrated SET DK MTCS-C3 (by using spectrometer and an optimized optical coupling sensor and spectrometer to the display). Measurements and calibration were done with a standard 21” display under laboratory conditions.
Figure 24 and Figure 25 show the results and accuracy after calibration. The red line in the figures is the target specification (see Table 5) and limitations for the single brightness regions (in cd/²). The blue points are the achieved measurements results and lie all inside the limitations.
mazet.de db14396e_V1.10_certified_2015-08-18 Page 25 of 31
SET DK MTCS-C3
V1.10
Figure 25: Luminary accuracy of the example display calibration
8 MEASUREMENT ERRORS
You have received a tested device that works reliably. Therefore, measurement errors are generally due to the test setup, faults or incorrect operation. For example, colorimetric results from a non-calibrated test system are not useful and faulty. The results after calibration depend on the process of calibration itself, the target (color normal) and particularly by the observance of the operating and ambient conditions. So please make sure that there are no drifts or interferences during the measurements. A change or deviation will inevitably lead to errors and may require recalibration.
In case of results, with unexpected sizes, negative22,23 values or similar errors please check your test system reliability and consider all external influence parameters that take effect on the calibration matrix (see chapter 5.10). After optimization please test again. If you cannot solve the problem, please contact our Sales team for further support.
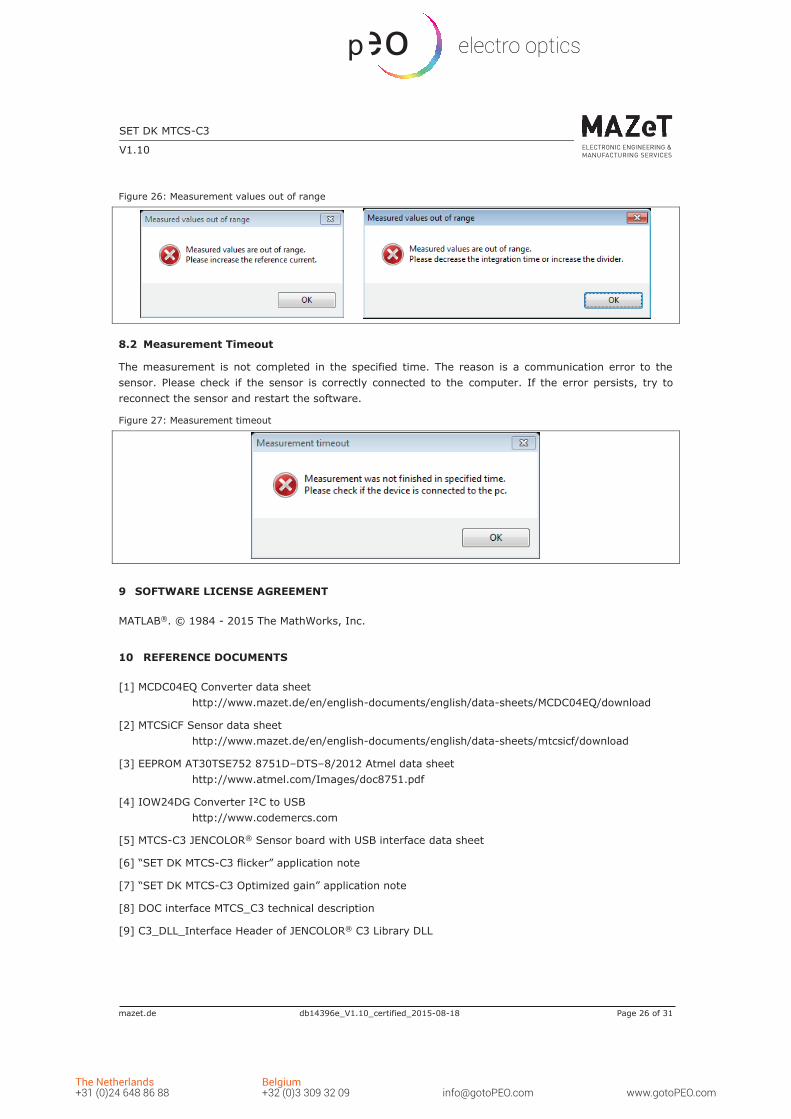
8.1 Out of Range
There are two different out of range errors that can occur during measurements.
▪ Integration time is to long decrease the integration time (SynPeriod or IntegrationCounter) or increase the divider
▪ Amplification is to high set the reference current to a higher value.
22 A negative coordinate or a coordinate out of the color space indicates on errors in calibration and/or, interferences or changed
conditions or measurement 23 In exception negative results in photo currents are possible and indicate negative leakage currents (technological reasons) in low-
energy measurements. In these cases, please use the method offset correction (see [1] OPTREG Register) and move depend on the Offset Value the workspace about the deficit balance per channel in the positive range.
mazet.de db14396e_V1.10_certified_2015-08-18 Page 26 of 31
SET DK MTCS-C3
V1.10
Figure 26: Measurement values out of range
8.2 Measurement Timeout
The measurement is not completed in the specified time. The reason is a communication error to the sensor. Please check if the sensor is correctly connected to the computer. If the error persists, try to reconnect the sensor and restart the software.
mazet.de db14396e_V1.10_certified_2015-08-18 Page 29 of 31
SET DK MTCS-C3
V1.10
ORDERING INFORMATION
NAME Status Article
SET DK MTCS-C3 Development Kit 090054-001-30
DK MTCS-C3 OEM JENCOLOR® Sensor 090054-001-27
SET MTCS-C3 Development Kit 090010-172-30
MTCS-C324 OEM JENCOLOR® Sensor 090010-172-25
Our Development Kits and OEM modules described here are only to be used for compatibility-, qualification tests, and verification procedures or as demonstrators. They are not designed to be used in series products.
Please note, the OEM sensors and kits were designed to be a test system for usage in laboratories only. They are not suitable for outdoor applications or to as series devices for inline measurements. Do not use the device in any process control or in any other series applications!
Before using engineering samples for anything other than system tests, please ask our sales team for status and availability of series or customized system solutions.
mazet.de db14396e_V1.10_certified_2015-08-18 Page 30 of 31
SET DK MTCS-C3
V1.10
LEGAL NOTES AND WARNINGS
Failure to comply with these instructions could result in death or serious injury.
Misuse of documentation – The information contained in this document is the property of MAZeT. Photocopying or otherwise reproducing any part of the catalog, whether electronically or mechanically is prohibited, except where the express permission of MAZeT GmbH has been obtained. In general, all company and brand names, as well as the names of individual products, are protected by brand, patent or product law.
State of document - The information provided in this document is for reference only. Do not use this document as product installation guide since products can be under development to improve performance or any other purpose. Before you start any development or place an order please contact your supplier or MAZeT for the latest version of this document. MAZeT explicitly reserves the right to make technical changes to information described in the document.
Information and Disclaimer – The information provided in this document is based on the knowledge of the MAZeT GmbH as of the date of publication. The MAZeT GmbH cannot give warranty regarding the accuracy of information provided by third parties. MAZeT may not have conducted testing or chemical analysis on all incoming material or chemicals. MAZeT GmbH performs and continues to perform reasonable measures to provide the most accurate data at the given time. Additional efforts to integrate information provided by third parties are performed and continue to be performed. Certain supplier information may be proprietary or limited and not available at release.
Personal Injury: All products are conform to the specifications in accordance with the terms and conditions of MAZeTs standard warranty. Production processing does not necessarily include testing of all parameters.
RoHS Directive 2011/65/EU /REACH INFORMATION - RoHS compliance and PB free: The products of MAZeT fully comply with the current RoHS-directives. Our semiconductor products do not contain any of the six substance chemical categories, for example including the restriction on lead usage (lead weight may not exceed 0.1% in homogeneous materials). RoHS compliant products are suitable for the usage in lead-free specified processes, when designed to be soldered at high temperatures.
REACH information: MAZeT products do not contain any of the latest REACH Substances of Very High Concern (SVHC) regarding the Europe Union (EU) Regulation 1907/2006. The latest 155 substances restricted per the REACH Regulation were last updated on June 16, 2014. Please refer to the following for the most current candidate list of substances: http://echa.europa.eu/candidate-list-table.
MAZeT solutions are not designed or intended for use in critical applications, in which the failures or malfunctions of the product may result in personal injury or death. Use of MAZeT products in life support systems is expressly unauthorized and any use by customer is completely at their own risk. In the case of a restricted use of the product described here, an application of the product outside of this limitation is at your own risk.
mazet.de db14396e_V1.10_certified_2015-08-18 Page 31 of 31
SET DK MTCS-C3
V1.10
Warranty disclaimer – The warranty expressed herein shall be in lieu of any other warranties, expressed or implied, including, without limitation, any implied warranties or conditions of merchantability and fitness for a particular purpose., which are expressly disclaimed, and is in lieu of any and all other obligations or liability on supplier’s part- For the avoidance of doubt, supplier shall not be liable for any special, incidental, indirect or consequential loss or damage, including loss pf revenue or profit, of any kind of nature, arising at any time, from any cause whatsoever resulting from the use or operation of the products or any breach of this limited warranty.
Legal liability - MAZeT assumes no responsibility for the use of any foreign products or circuits described in this document or customer product design, conveys no license, either expressed or implied, under any patent or other right, and makes no representation that the foreign circuits are free of patent infringement. MAZeT further makes no claim as to the suitability of its products for any particular purpose, nor does MAZeT assume any liability arising out of the use of any product or circuit, and specifically disclaims any and all liability, including without limitation consequential or incidental damages.
ESD Warning: Sensor handling precautions should be observed to avoid static discharge
WEEE Disposal: - The product should be disposed in to according the Directive 2002/96 / EC of the European Council on Waste Electrical and Electronic Equipment [WEEE] and the German electoral law [ElektroG] of 16 March 2005. Please contact our technical support if you need more details.