15
Data Visualization for Twitter Sentiment Analysis by Denali

Data Visualization for Twitter Sentiment Analysis by Denali
OUTLINE:• Background• Data source• Denali Introduction• Experiments Setup and Results• Conclusion

3
BACKGROUND
• Twitter sentiment analysis on political opinions• 3 sentiment polarities
Ø Positive,Ø NegativeØ Neutral
• Feature extraction and sentiment score computation• Represent tweet as a sparse feature vector• 3-paralleled DNN network• High dimensional data
Ø Feature vectorsØ Parameter space
4
DATA SOURCE
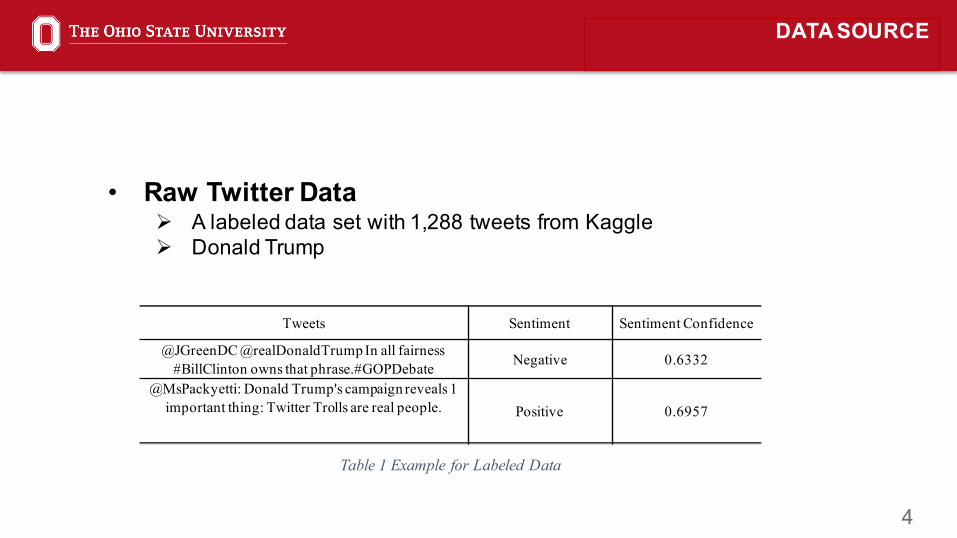
• Raw Twitter DataØ A labeled data set with 1,288 tweets from KaggleØ Donald Trump
Tweets Sentiment Sentiment Confidence
@JGreenDC @realDonaldTrump In all fairness #BillClinton owns that phrase.#GOPDebate Negative 0.6332
@MsPackyetti: Donald Trump's campaign reveals 1 important thing: Twitter Trolls are real people. Positive 0.6957
Table 1 Example for Labeled Data
5
DATA SOURCE
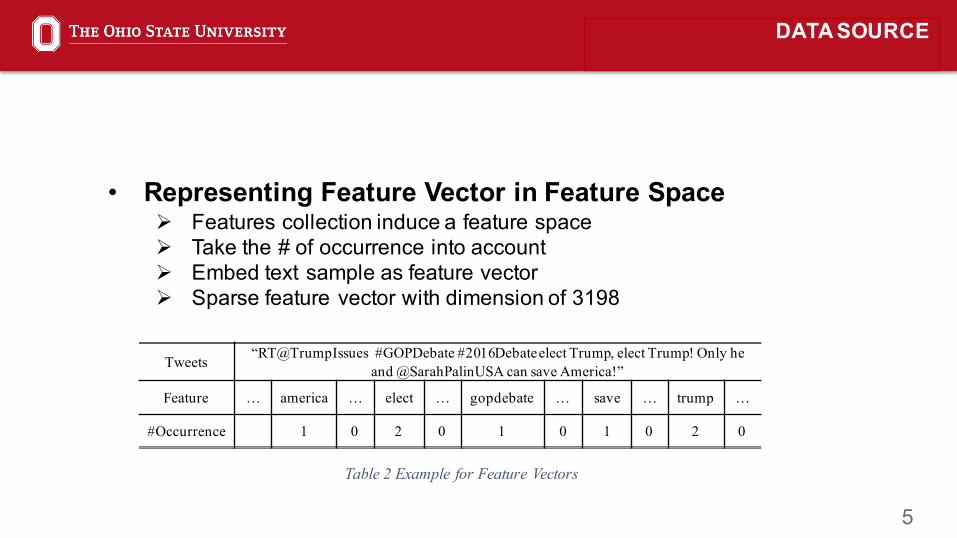
• Representing Feature Vector in Feature SpaceØ Features collection induce a feature spaceØ Take the # of occurrence into accountØ Embed text sample as feature vectorØ Sparse feature vector with dimension of 3198
Tweets “RT@TrumpIssues #GOPDebate #2016Debate elect Trump, elect Trump! Only he and @SarahPalinUSA can save America!”
Feature … america … elect … gopdebate … save … trump …
#Occurrence 1 0 2 0 1 0 1 0 2 0
Table 2 Example for Feature Vectors
6
DATA SOURCE
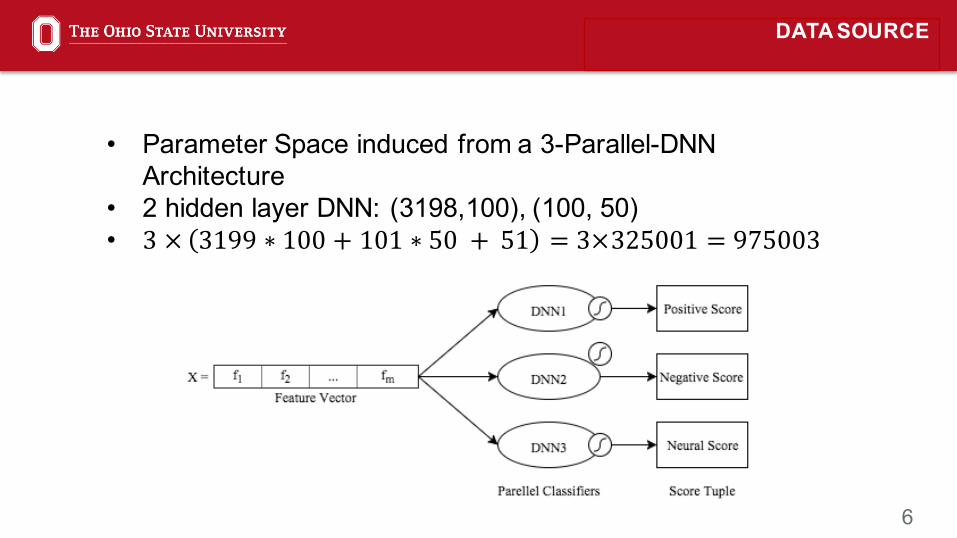
• Parameter Space induced from a 3-Parallel-DNN Architecture
• 2 hidden layer DNN: (3198,100), (100, 50) • 3 × 3199 ∗ 100 + 101 ∗ 50 + 51 = 3×325001 = 975003

7
DENALI INTRODUCTION
• A tool for visualizing trees as landscape metaphors• Two requisites for the data
Ø Tree structure extractable, usually hierarchicalØ Scalar function defined on it
• Two common approaches to extract tree structureØ Hierarchical Clustering TreeØ Contour Tree

8
EXPERIMENT SETUPS AND RESULTS
• Visualizing Contour Tree Extracted from Feature VectorsØ A topological space 𝑋 and function 𝑓: 𝑋 → 𝑅Ø 𝑋 is1,288 feature vectors of dimension 3198 Ø 𝑓 is the variance for the score of 3 sentiment polaritiesØ Sentiment score range is [0,1]Ø Scalar function range is [0.0042, 0.2222]

9
EXPERIMENT SETUPS AND RESULTS
Figure 2 Contour Tree Extracted from Feature Vectors

10
EXPERIMENT SETUPS AND RESULTS
• Visualizing Hierarchical Clustering Tree Extracted from Feature VectorsØ Applying average linkage clustering algorithmØ A hierarchical clustering tree is extracted base on the dissimilarity between feature
vectorsØ Born with scalar function defined (the distance where merges)
11
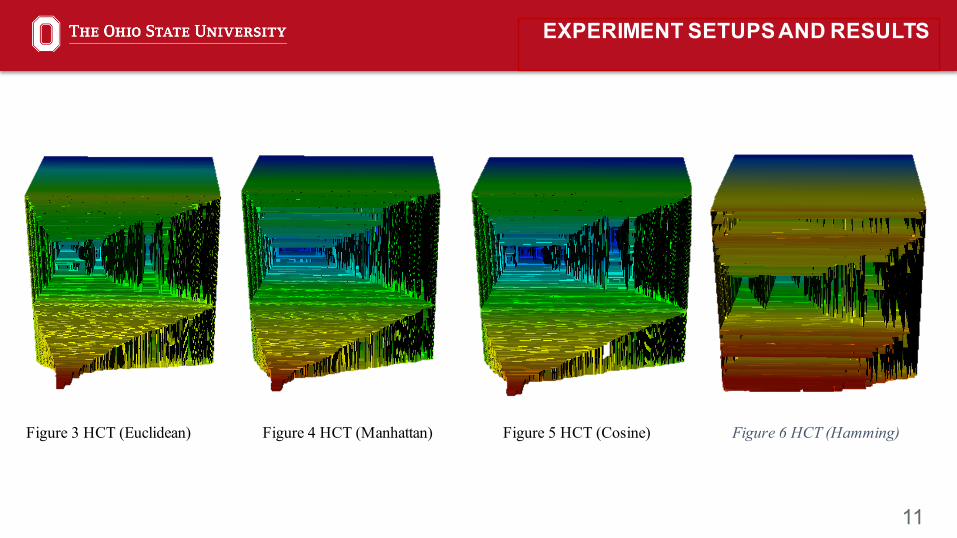
EXPERIMENT SETUPS AND RESULTS
Figure 3 HCT (Euclidean) Figure 4 HCT (Manhattan) Figure 5 HCT (Cosine) Figure 6 HCT (Hamming)
12
EXPERIMENT SETUPS AND RESULTS
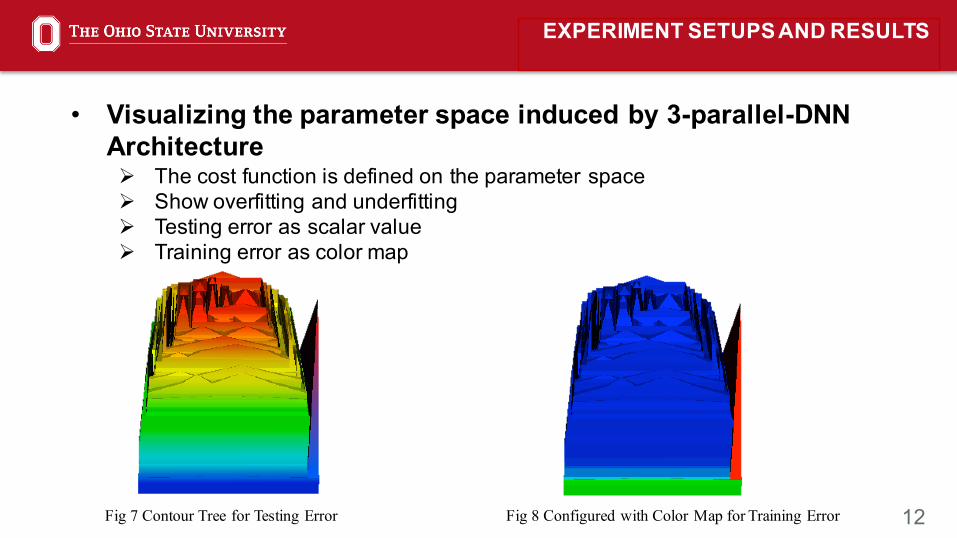
• Visualizing the parameter space induced by 3-parallel-DNN ArchitectureØ The cost function is defined on the parameter spaceØ Show overfitting and underfittingØ Testing error as scalar valueØ Training error as color map
Fig 7 Contour Tree for Testing Error Fig 8 Configured with Color Map for Training Error

13
EXPERIMENT SETUPS AND RESULTS
Overfitting Underfitting Optimal

14
CONCLUSION:• High dimensional data visualization by Denali• Hierarchical structure tree• Contour tree• Hierarchical clustering tree

15
Q & A


