11
Technical Information
UCD TI #801D
Date: February 23, 2017
Page 2 of 11
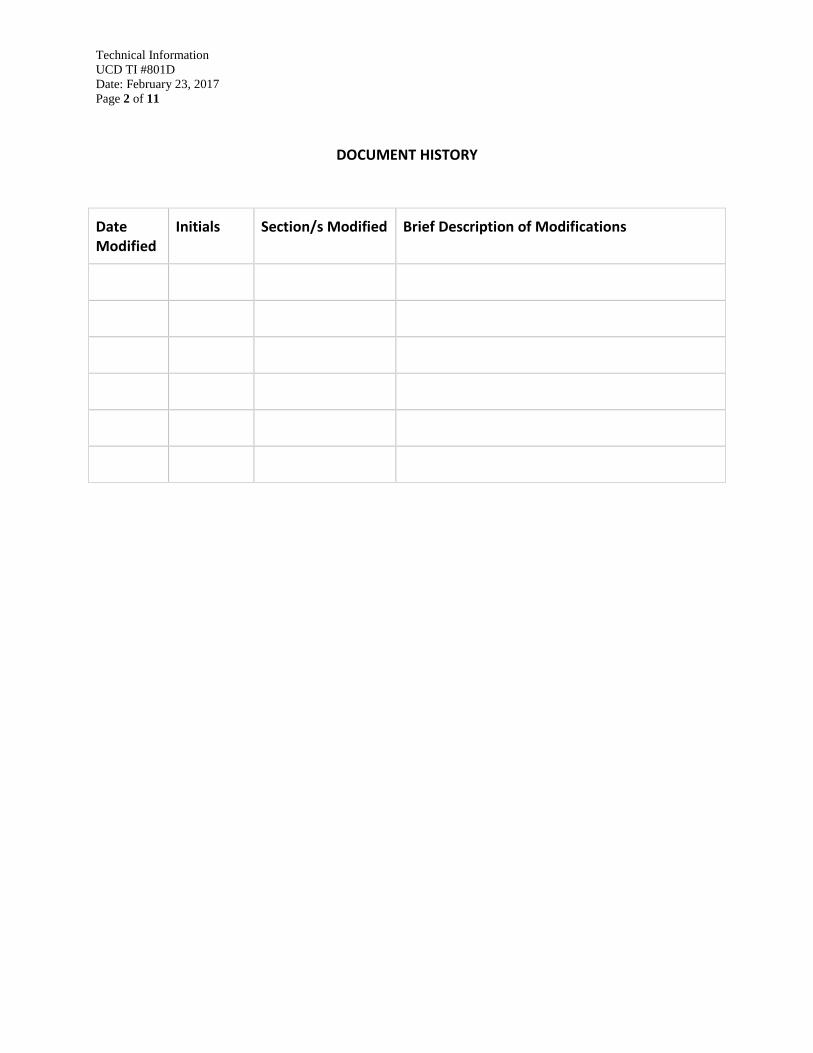
DOCUMENT HISTORY
Date Modified
Initials Section/s Modified Brief Description of Modifications
Technical Information
UCD TI #801D
Date: February 23, 2017
Page 3 of 11
Table of Contents
1. PURPOSE AND APPLICABILITY ................................................................................................. 4
2. Definitions ................................................................................................................................ 4
3. Procedures ............................................................................................................................... 4
3.1 Format data for DART Submission ................................................................................... 4
3.2 Receive and Review Returned Data from DART .............................................................. 5
3.3 Reformat Data and Submit to AQS .................................................................................. 7
4. Data Delivery ......................................................................................................................... 10
Table of Figures Figure 1. Returned DART datasets can be imported into the CSN database with this custom
upload tool. ..................................................................................................................................... 5
Figure 2. Filter details page in the CSN Data Management web application. ................................ 6
Figure 3. Login screen for the EPA's Exchange Network Services website. ................................. 7
Figure 4. Home screen of the Exchange Network Services website. ............................................. 8
Figure 5. Enter "AQS" into the search bar. ..................................................................................... 8
Figure 6. Search results from "AQS". The analyst should choose the Service named "AQS
Submit". .......................................................................................................................................... 9
Figure 7. AQS data submission form. ........................................................................................... 10
Figure 8. Flow diagram of the data delivery process. Rectangles represent data files, diamonds
represent R functions, circles represent databases, and lines represent inputs and outputs. ......... 10
Technical Information
UCD TI #801D
Date: February 23, 2017
Page 4 of 11
1. PURPOSE AND APPLICABILITY
The subject of this technical information document (TI) is delivery of the resultant data
from the CSN network. The collected results from the previous steps in the data
generation and validation processes are formatted into a DART-formatted file for
delivery to DART. After the 30 day validation period, a revised DART results file will be
returned to UC Davis. The user will review this file and reformat it for delivery to the
EPA’s AQS database.
2. DEFINITIONS
datvalCSN: A custom software package in the R language that contains the data
validation code used to collect, compare, and flag the final results.
CSN database: A SQL Server database that is the central warehouse of CSN preliminary
and final data at UC Davis.
AQS: A database that is the central warehouse of EPA air quality data.
DART: Data Analysis and Reporting Tool, a web application for environmental data
visualization and validation procedures.
STI: Sonoma Tech, Inc. Contractor developing and operating the DART interface.
3. PROCEDURES
Data delivery is performed using the datvalCSN R package, which is developed and
maintained by UC Davis specifically for data processing, monitoring, and validation of
the CSN data. Data delivery is performed by the UC Davis data management team on
monthly batches of data (a calendar month of sample start dates). Delivery occurs in three
step:
1. Format data and submit to DART;
2. Receive and review returned data from DART;
3. Reformat data and submit to AQS.
3.1 Format data for DART Submission
In the previous step, results for elements, ions and carbon fractions are validated using
the tools of the datvalCSN package. This package can also be used to produce the output
file for submission to DART. Using the main function,
[allData] <- datvalCSN::csn_validate(['MM'], ['YYYY'])
the analyst will produce data frames with the resultant data for the specified month for a
final review. Additionally, a timestamped output file will be written to the CSN/QA
folder of the networked U drive. This file is by default in DART format.
Technical Information
UCD TI #801D
Date: February 23, 2017
Page 5 of 11
If the analyst has already run the csn_validate function without writing the output file and
later wishes to do so, the analyst can execute the write.table command from base R1:
[output] <- [email protected]
[out.dir] <- 'U:/CSN/QA/'
[filename] <- paste0(format(Sys.time(), '%Y%m%d%H%M'),
'_840.UCDAVIS.csv')
write.csv([output], paste0([out.dir], [filename]), row.names = F, na='',
fileEncoding = 'UTF-8')
Once the data have been written, the analyst will submit this data to DART. Currently,
files are emailed directly to STI via Jennifer DeWinter. Eventually, a FTP service will be
set up to handle CSN data delivery and return.
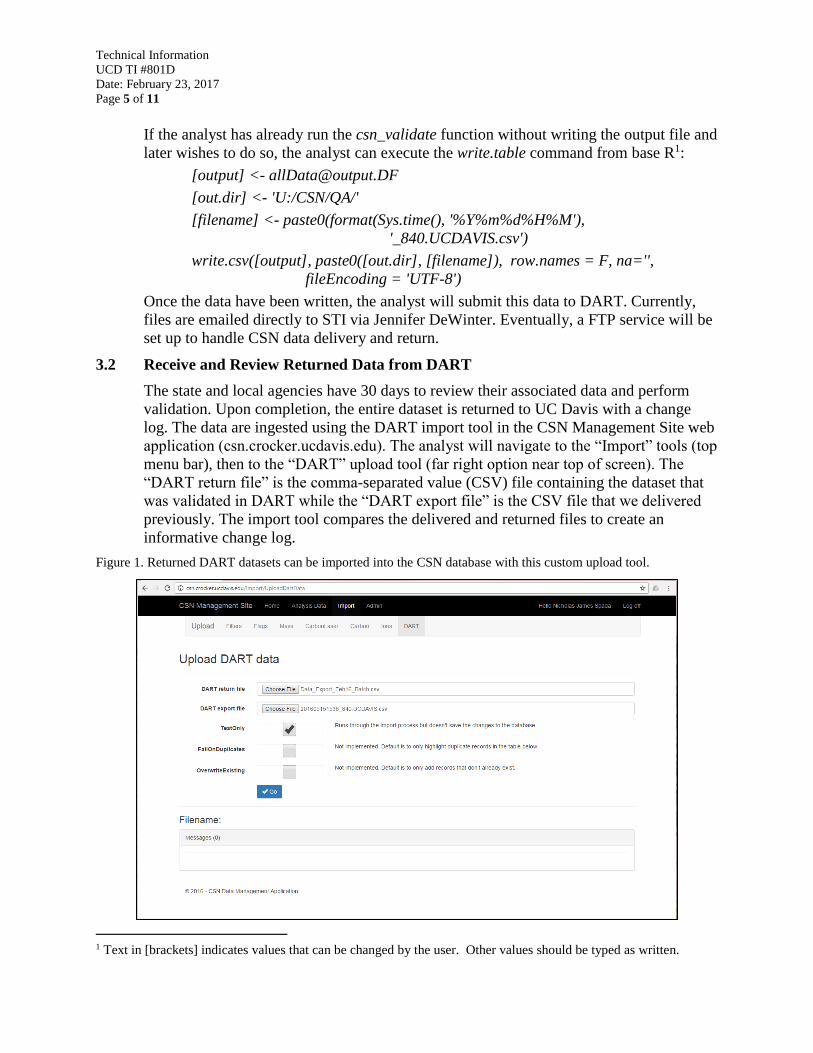
3.2 Receive and Review Returned Data from DART
The state and local agencies have 30 days to review their associated data and perform
validation. Upon completion, the entire dataset is returned to UC Davis with a change
log. The data are ingested using the DART import tool in the CSN Management Site web
application (csn.crocker.ucdavis.edu). The analyst will navigate to the “Import” tools (top
menu bar), then to the “DART” upload tool (far right option near top of screen). The
“DART return file” is the comma-separated value (CSV) file containing the dataset that
was validated in DART while the “DART export file” is the CSV file that we delivered
previously. The import tool compares the delivered and returned files to create an
informative change log.
Figure 1. Returned DART datasets can be imported into the CSN database with this custom upload tool.
1 Text in [brackets] indicates values that can be changed by the user. Other values should be typed as written.
Technical Information
UCD TI #801D
Date: February 23, 2017
Page 6 of 11
As with the other data upload processes, use the “Go” button to begin ingestion. It is
advisable to first run the import with the “TestOnly” box checked and review any error or
warning messages. The ingested data appear in the analysis.DartReturn table.
The analyst will review the change log from STI, including comments, and verify that all
changes are consistent with the DART users’ comments. To collect and review the
changes made during DART validation, the analyst can run
[dartChanges] <- datvalCSN::get_changes([startdate], [enddate])
where both the startdate and the enddate parameters are entered as 'YYYY-MM-DD'.
Typically, this process is being performed on the most recent dataset. If this is the case,
only the start date needs to be entered.
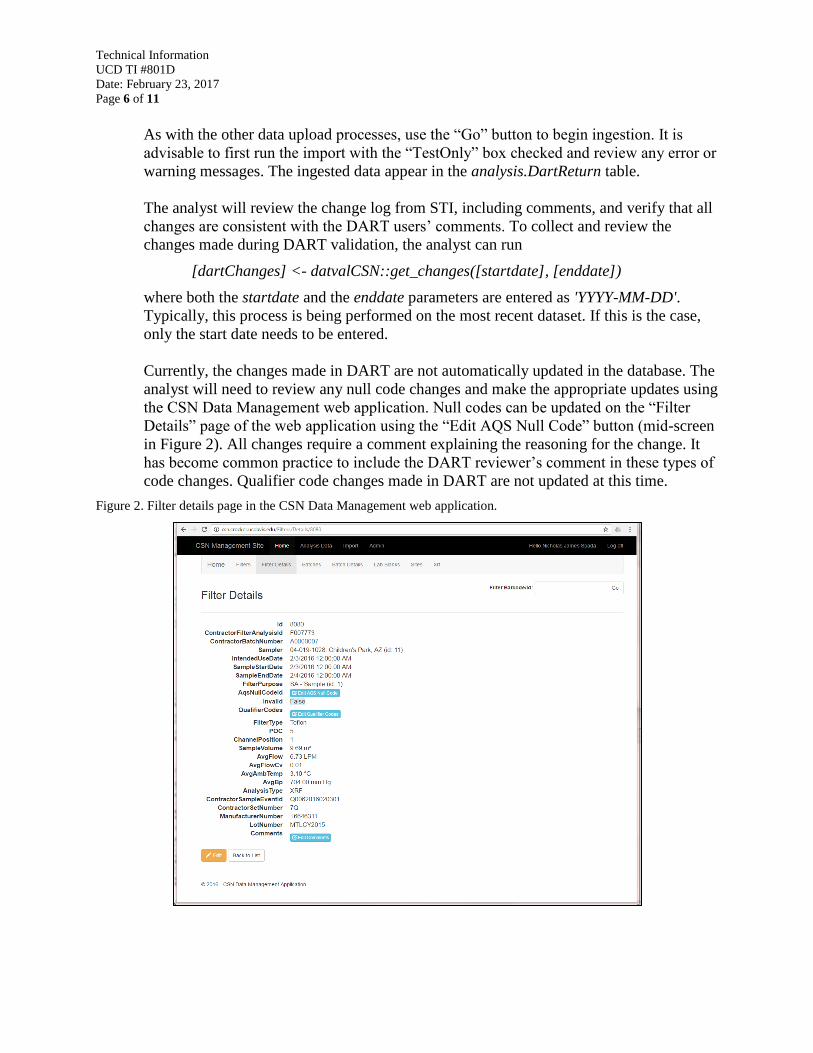
Currently, the changes made in DART are not automatically updated in the database. The
analyst will need to review any null code changes and make the appropriate updates using
the CSN Data Management web application. Null codes can be updated on the “Filter
Details” page of the web application using the “Edit AQS Null Code” button (mid-screen
in Figure 2). All changes require a comment explaining the reasoning for the change. It
has become common practice to include the DART reviewer’s comment in these types of
code changes. Qualifier code changes made in DART are not updated at this time.
Figure 2. Filter details page in the CSN Data Management web application.
Technical Information
UCD TI #801D
Date: February 23, 2017
Page 7 of 11
3.3 Reformat Data and Submit to AQS
Once the new file has been validated, the analyst will convert it from DART to AQS
format using the function,
[aqs] <- dart2aqs(['MM'], ['YYYY'])
with the appropriate month and year of data. This function automatically generates a new
file in AQS format in the CSN/QA folder with the current date in the filename. The
analyst should review the output dataset for accuracy and consistency with AQS
formatting rules. AQS reference documents are conveniently located in
U:/CSN/Documentation/Reference.
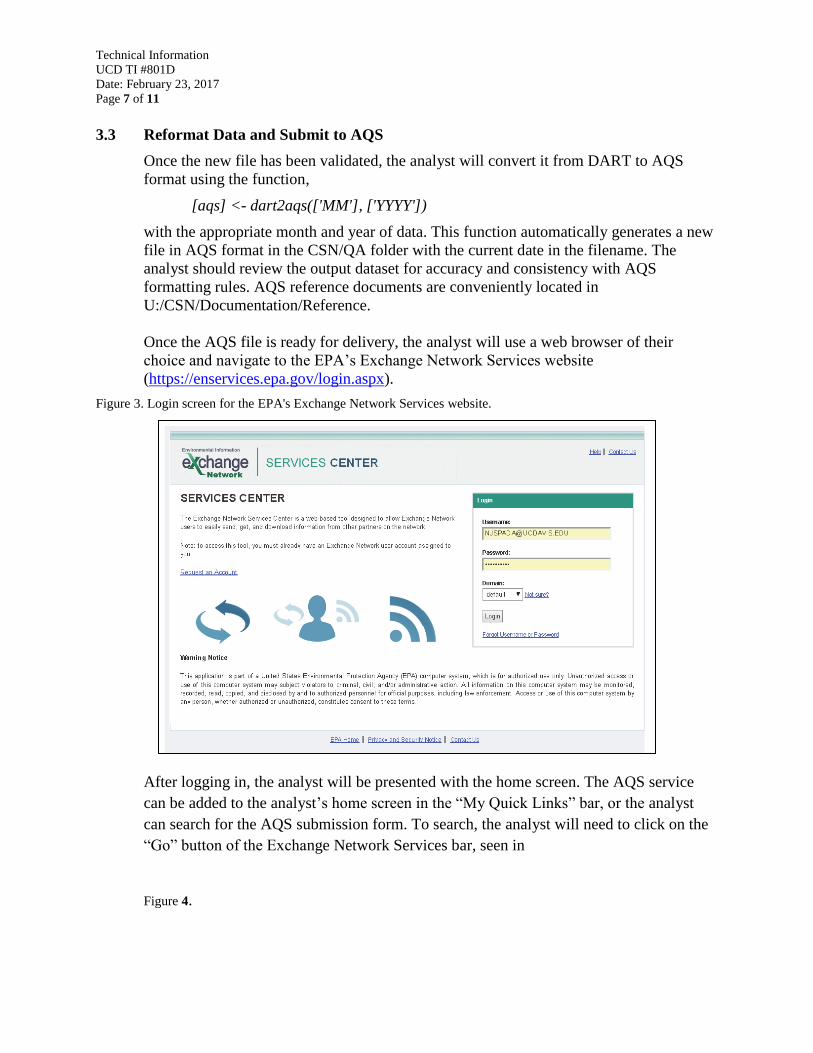
Once the AQS file is ready for delivery, the analyst will use a web browser of their
choice and navigate to the EPA’s Exchange Network Services website
(https://enservices.epa.gov/login.aspx).
Figure 3. Login screen for the EPA's Exchange Network Services website.
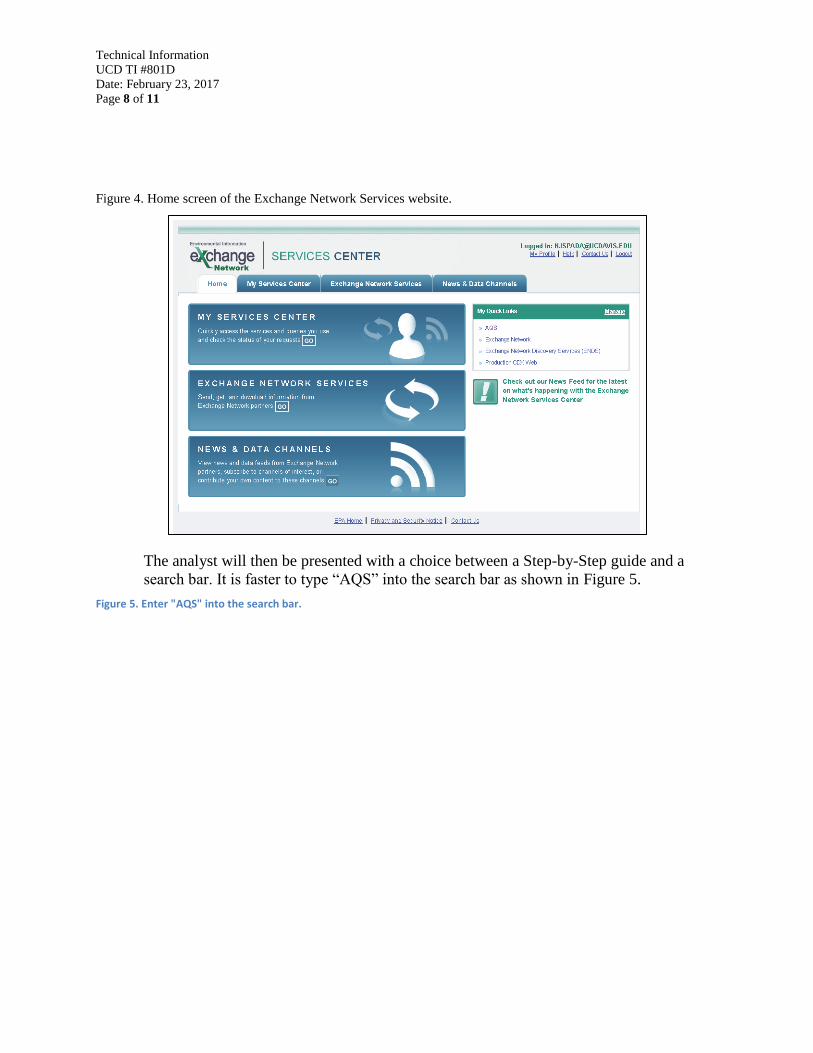
After logging in, the analyst will be presented with the home screen. The AQS service
can be added to the analyst’s home screen in the “My Quick Links” bar, or the analyst
can search for the AQS submission form. To search, the analyst will need to click on the
“Go” button of the Exchange Network Services bar, seen in
Figure 4.
Technical Information
UCD TI #801D
Date: February 23, 2017
Page 8 of 11
Figure 4. Home screen of the Exchange Network Services website.
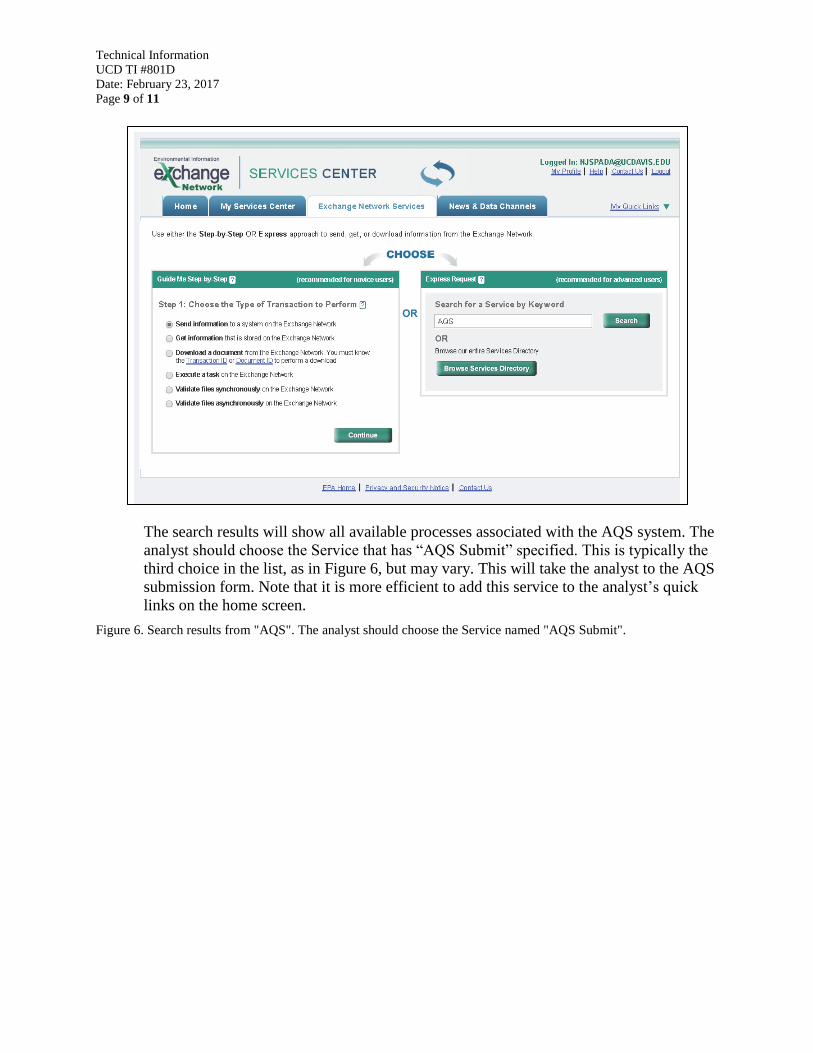
The analyst will then be presented with a choice between a Step-by-Step guide and a
search bar. It is faster to type “AQS” into the search bar as shown in Figure 5.
Figure 5. Enter "AQS" into the search bar.
Technical Information
UCD TI #801D
Date: February 23, 2017
Page 9 of 11
The search results will show all available processes associated with the AQS system. The
analyst should choose the Service that has “AQS Submit” specified. This is typically the
third choice in the list, as in Figure 6, but may vary. This will take the analyst to the AQS
submission form. Note that it is more efficient to add this service to the analyst’s quick
links on the home screen.
Figure 6. Search results from "AQS". The analyst should choose the Service named "AQS Submit".
Technical Information
UCD TI #801D
Date: February 23, 2017
Page 10 of 11
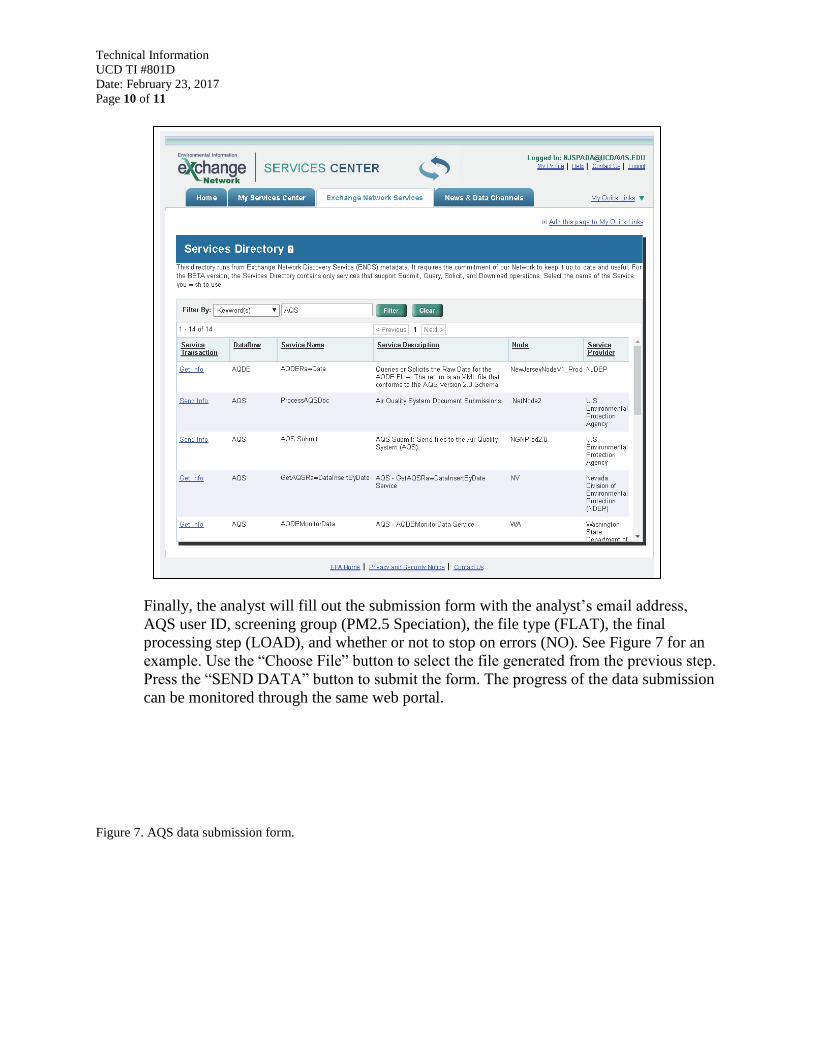
Finally, the analyst will fill out the submission form with the analyst’s email address,
AQS user ID, screening group (PM2.5 Speciation), the file type (FLAT), the final
processing step (LOAD), and whether or not to stop on errors (NO). See Figure 7 for an
example. Use the “Choose File” button to select the file generated from the previous step.
Press the “SEND DATA” button to submit the form. The progress of the data submission
can be monitored through the same web portal.
Figure 7. AQS data submission form.
Technical Information
UCD TI #801D
Date: February 23, 2017
Page 11 of 11
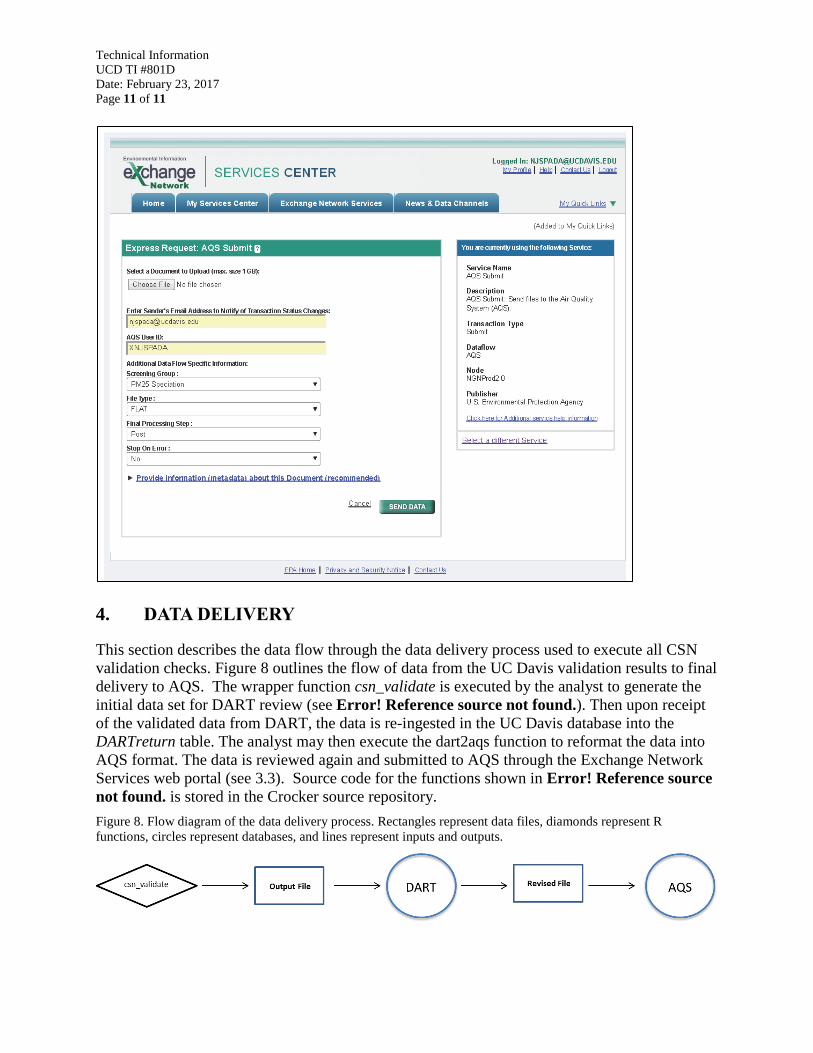
4. DATA DELIVERY
This section describes the data flow through the data delivery process used to execute all CSN
validation checks. Figure 8 outlines the flow of data from the UC Davis validation results to final
delivery to AQS. The wrapper function csn_validate is executed by the analyst to generate the
initial data set for DART review (see Error! Reference source not found.). Then upon receipt
of the validated data from DART, the data is re-ingested in the UC Davis database into the
DARTreturn table. The analyst may then execute the dart2aqs function to reformat the data into
AQS format. The data is reviewed again and submitted to AQS through the Exchange Network
Services web portal (see 3.3). Source code for the functions shown in Error! Reference source
not found. is stored in the Crocker source repository.
Figure 8. Flow diagram of the data delivery process. Rectangles represent data files, diamonds represent R
functions, circles represent databases, and lines represent inputs and outputs.


