This paper proposes a system for monitoring of condition and surface of roads in developing countries like India. This systemwill be used by government agencies to monitor municipal activities like road laying and planning. The system utilizes a databasecreated by geo-citizens or government workers as an input. The heavy machinery in existing systems is not an optimized solutionto this problem. Some existing systems use GPS and accelerometer data for determining such artifacts. So, it is evident that thereis a need for a system that generates robust, frequent and accountable geo-tagged data. We propose a new collaborative model forsuch a purpose by fusion of data from multiple sensors hosted on smart-phones of several active geo-citizens. The system focusesmainly on volunteered geographic information, in which users can use their respective smart-phones to collect the data required andupload it for further analysis. The server side of the system infuses this data into a PostGIS database and displays the road conditionon a near real-time basis over a WebGIS. The strength of a good visualization in imparting insight to decision-makers is widelyrecognized. We advance the paper by assessing procured road data and displaying it in an easy to understand format. In additionto visualization, the WebGIS component also provides for timeline analysis of changes in road conditions, which may help in theimproved management of road infrastructure.
1. INTRODUCTION
A crucial aspect of urban infrastructure management in cities isthe continuous monitoring and maintenance of roads. Specificdepartments employed by governing authorities track the roaddeterioration and ensure timely repair and maintenance ofroads. Traditional methods in this domain use high powerlaser or radar sensors and thereby go on to become intricateand demanding. Regardless of the data collection method, theprocess of gathering, assimilating and post-processing of datais an expensive and time-consuming task with low coverageand often in need of assistance from experts. Additionally,frequent collection of data is essential to generate efficientand accountable results. High-end systems are inefficient incovering large areas at regular intervals of time which leads tocomplexity in activity planning.
To address these challenges in an ever-expanding urbanenvironment, we propose an innovative collaborative sys-tem for road condition monitoring leveraging the existingtechnologies by data fusion approach. Derived from spatialcitizenship, we envision an ecosystem operating through amobile application on smart-phones of geo-citizens for largedata collection and executing centralized processing. Primeadvantages of such a platform are the multiplicity of data pointsand crowd-sourcing model.
Data collection from numerous sources ensures statisticaladvantage and expandable coverage for the monitoring system.Crowd-sourcing model provides reliable coverage and elimin-ates the need for deploying specialized road monitoring tools.This system is also dynamic to meet the increasing demandand prioritizes the areas of high usage. On the whole, theData Analytics and Visualization (DAV) system can disrupt
∗Corresponding author
the existing traditional methods and serve as an alternateinnovative solution.
This paper primarily presents the architecture and systemdesign of the two main subsystems of the DAV system viz.visualization and data fusion.
2. RELATED WORK
There is a wide range of existing systems that leveragedifferent methods for road monitoring. Smartphones todayare powerful devices that are capable of executing intensivetasks. We can make use of their multiple sensors for roadmonitoring. Complex LASER and RADAR based systemsmay be profitable in some cases but smartphone-based systemscan be easily scaled up to run vigorous applications. Existingsmartphone-based systems Nericell (Mohan et al., 2008) andWolverine (Bhoraskar et al., 2012) detect road artifacts basedon a change in accelerometer readings along the direction ofgravity (Z direction). Roadroid (Forslof, Jones, 2015) is an-other innovative approach to this problem that uses Root MeanSquare (RMS) vibration analysis and quarter-car simulationtechniques to determine the road quality.
The data fusion approach as mentioned in Maargha (Ra-jamohan et al., 2015) and (Gannu, Rajan, 2018) was a proofof concept developed to address the classification of roads bymulti-sensor fusion uniquely and simply. Most of the systemsmentioned above use a single source analysis to arrive at theresult. To achieve an accountable source of data and to designa sustainable system, data source from several participants isnecessary. In addition to this, such a system can also be used toperform temporal analysis of the road structure.
Monitoring based on crowd-sourced data has been a part
ISPRS Annals of the Photogrammetry, Remote Sensing and Spatial Information Sciences, Volume V-4-2020, 2020 XXIV ISPRS Congress (2020 edition)
of many projects over the recent past. Air-quality monitoringbased on crowd-sourced data has been gaining popularity.AirCloud (Cheng et al., 2014) uses a heterogeneous set ofdata sources as inputs. This data is stored and analyzed by theair quality analytics engine in the cloud, to provide accuratedevice calibration and fine-granularity estimation based onGPS location. Crowd-based data is also used in systems andmethods for providing passive crowd-sourced alternate routerecommendations (Curtis et al., 2013).
The combination of spatial data from the variety of sources onthe web, being either legislative, commercially or voluntarilydriven, is a major requirement for the establishment of afully integrated geospatial web. Therefore, spatial data fusiontechniques need to be linked to current web-developments, inparticular on Spatial Data Infrastructures and the SemanticWeb, to allow for standardized and effective use of combinedspatial data for information retrieval. (Schmitt, Zhu, 2016).
3. SYSTEM DESIGN
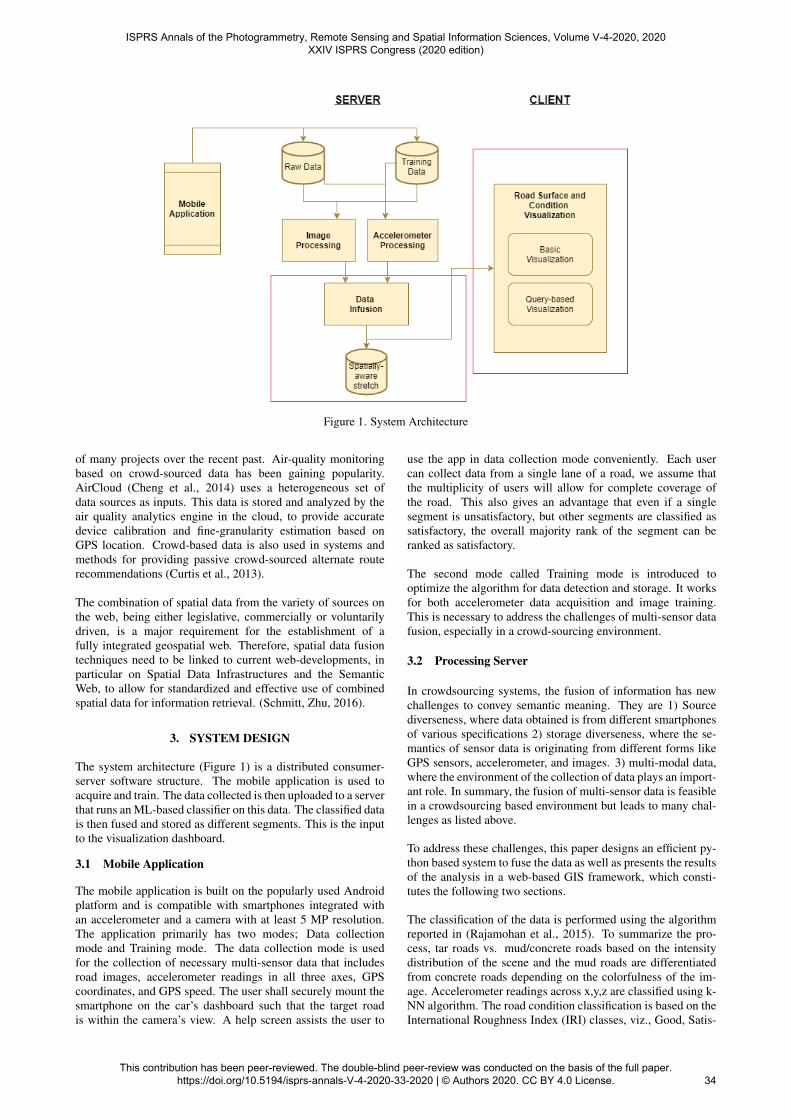
The system architecture (Figure 1) is a distributed consumer-server software structure. The mobile application is used toacquire and train. The data collected is then uploaded to a serverthat runs an ML-based classifier on this data. The classified datais then fused and stored as different segments. This is the inputto the visualization dashboard.
3.1 Mobile Application
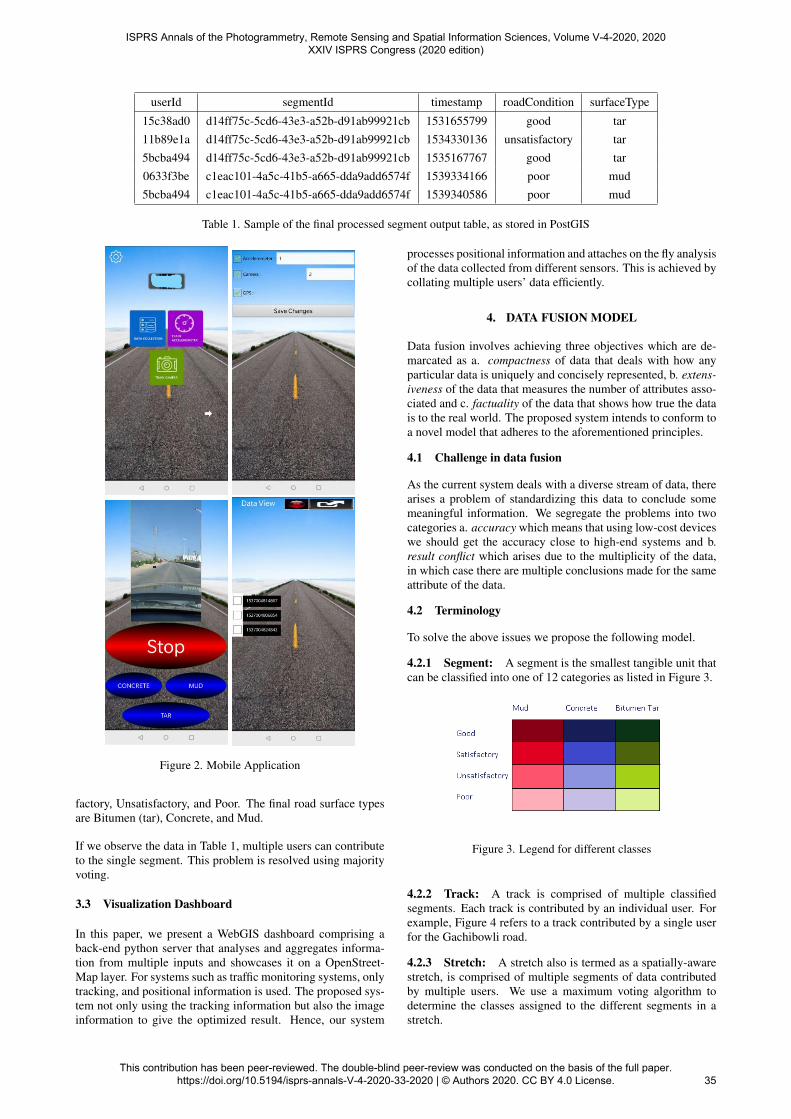
The mobile application is built on the popularly used Androidplatform and is compatible with smartphones integrated withan accelerometer and a camera with at least 5 MP resolution.The application primarily has two modes; Data collectionmode and Training mode. The data collection mode is usedfor the collection of necessary multi-sensor data that includesroad images, accelerometer readings in all three axes, GPScoordinates, and GPS speed. The user shall securely mount thesmartphone on the car’s dashboard such that the target roadis within the camera’s view. A help screen assists the user to
use the app in data collection mode conveniently. Each usercan collect data from a single lane of a road, we assume thatthe multiplicity of users will allow for complete coverage ofthe road. This also gives an advantage that even if a singlesegment is unsatisfactory, but other segments are classified assatisfactory, the overall majority rank of the segment can beranked as satisfactory.
The second mode called Training mode is introduced tooptimize the algorithm for data detection and storage. It worksfor both accelerometer data acquisition and image training.This is necessary to address the challenges of multi-sensor datafusion, especially in a crowd-sourcing environment.
3.2 Processing Server
In crowdsourcing systems, the fusion of information has newchallenges to convey semantic meaning. They are 1) Sourcediverseness, where data obtained is from different smartphonesof various specifications 2) storage diverseness, where the se-mantics of sensor data is originating from different forms likeGPS sensors, accelerometer, and images. 3) multi-modal data,where the environment of the collection of data plays an import-ant role. In summary, the fusion of multi-sensor data is feasiblein a crowdsourcing based environment but leads to many chal-lenges as listed above.
To address these challenges, this paper designs an efficient py-thon based system to fuse the data as well as presents the resultsof the analysis in a web-based GIS framework, which consti-tutes the following two sections.
The classification of the data is performed using the algorithmreported in (Rajamohan et al., 2015). To summarize the pro-cess, tar roads vs. mud/concrete roads based on the intensitydistribution of the scene and the mud roads are differentiatedfrom concrete roads depending on the colorfulness of the im-age. Accelerometer readings across x,y,z are classified using k-NN algorithm. The road condition classification is based on theInternational Roughness Index (IRI) classes, viz., Good, Satis-
ISPRS Annals of the Photogrammetry, Remote Sensing and Spatial Information Sciences, Volume V-4-2020, 2020 XXIV ISPRS Congress (2020 edition)
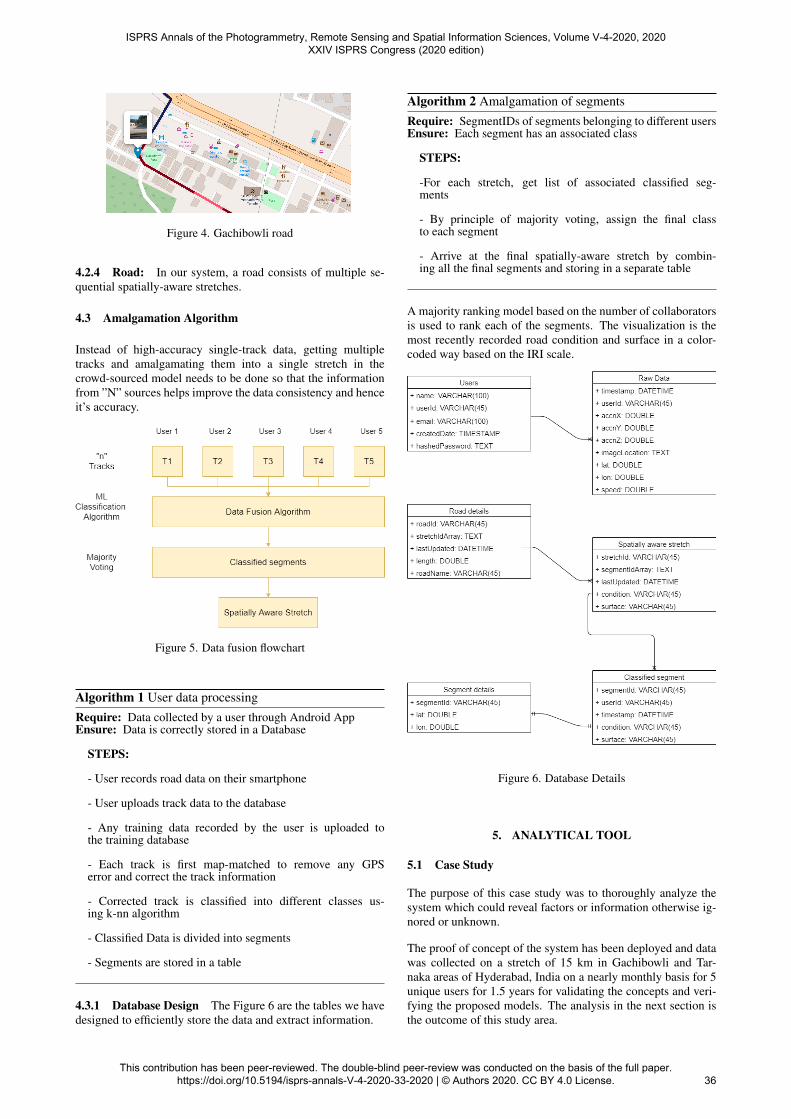
Table 1. Sample of the final processed segment output table, as stored in PostGIS
Figure 2. Mobile Application
factory, Unsatisfactory, and Poor. The final road surface typesare Bitumen (tar), Concrete, and Mud.
If we observe the data in Table 1, multiple users can contributeto the single segment. This problem is resolved using majorityvoting.
3.3 Visualization Dashboard
In this paper, we present a WebGIS dashboard comprising aback-end python server that analyses and aggregates informa-tion from multiple inputs and showcases it on a OpenStreet-Map layer. For systems such as traffic monitoring systems, onlytracking, and positional information is used. The proposed sys-tem not only using the tracking information but also the imageinformation to give the optimized result. Hence, our system
processes positional information and attaches on the fly analysisof the data collected from different sensors. This is achieved bycollating multiple users’ data efficiently.
4. DATA FUSION MODEL
Data fusion involves achieving three objectives which are de-marcated as a. compactness of data that deals with how anyparticular data is uniquely and concisely represented, b. extens-iveness of the data that measures the number of attributes asso-ciated and c. factuality of the data that shows how true the datais to the real world. The proposed system intends to conform toa novel model that adheres to the aforementioned principles.
4.1 Challenge in data fusion
As the current system deals with a diverse stream of data, therearises a problem of standardizing this data to conclude somemeaningful information. We segregate the problems into twocategories a. accuracy which means that using low-cost deviceswe should get the accuracy close to high-end systems and b.result conflict which arises due to the multiplicity of the data,in which case there are multiple conclusions made for the sameattribute of the data.
4.2 Terminology
To solve the above issues we propose the following model.
4.2.1 Segment: A segment is the smallest tangible unit thatcan be classified into one of 12 categories as listed in Figure 3.
Figure 3. Legend for different classes
4.2.2 Track: A track is comprised of multiple classifiedsegments. Each track is contributed by an individual user. Forexample, Figure 4 refers to a track contributed by a single userfor the Gachibowli road.
4.2.3 Stretch: A stretch also is termed as a spatially-awarestretch, is comprised of multiple segments of data contributedby multiple users. We use a maximum voting algorithm todetermine the classes assigned to the different segments in astretch.
ISPRS Annals of the Photogrammetry, Remote Sensing and Spatial Information Sciences, Volume V-4-2020, 2020 XXIV ISPRS Congress (2020 edition)
4.2.4 Road: In our system, a road consists of multiple se-quential spatially-aware stretches.
4.3 Amalgamation Algorithm
Instead of high-accuracy single-track data, getting multipletracks and amalgamating them into a single stretch in thecrowd-sourced model needs to be done so that the informationfrom ”N” sources helps improve the data consistency and henceit’s accuracy.
Figure 5. Data fusion flowchart
Algorithm 1 User data processingRequire: Data collected by a user through Android AppEnsure: Data is correctly stored in a Database
STEPS:
- User records road data on their smartphone
- User uploads track data to the database
- Any training data recorded by the user is uploaded tothe training database
- Each track is first map-matched to remove any GPSerror and correct the track information
- Corrected track is classified into different classes us-ing k-nn algorithm
- Classified Data is divided into segments
- Segments are stored in a table
4.3.1 Database Design The Figure 6 are the tables we havedesigned to efficiently store the data and extract information.
Algorithm 2 Amalgamation of segmentsRequire: SegmentIDs of segments belonging to different usersEnsure: Each segment has an associated class
STEPS:
-For each stretch, get list of associated classified seg-ments
- By principle of majority voting, assign the final classto each segment
- Arrive at the final spatially-aware stretch by combin-ing all the final segments and storing in a separate table
A majority ranking model based on the number of collaboratorsis used to rank each of the segments. The visualization is themost recently recorded road condition and surface in a color-coded way based on the IRI scale.
Figure 6. Database Details
5. ANALYTICAL TOOL
5.1 Case Study
The purpose of this case study was to thoroughly analyze thesystem which could reveal factors or information otherwise ig-nored or unknown.
The proof of concept of the system has been deployed and datawas collected on a stretch of 15 km in Gachibowli and Tar-naka areas of Hyderabad, India on a nearly monthly basis for 5unique users for 1.5 years for validating the concepts and veri-fying the proposed models. The analysis in the next section isthe outcome of this study area.
ISPRS Annals of the Photogrammetry, Remote Sensing and Spatial Information Sciences, Volume V-4-2020, 2020 XXIV ISPRS Congress (2020 edition)
An assumption has been made that even-though commuterstravel through different lanes on a multi-lane road, we do notdistinguish the lanes to provide the outcome. Let us take anexample of the Old Mumbai highway in Hyderabad, which is a3-lane road on both sides. In our experiments we have observedthat commuters prefer to take the lane that is free from potholes.Hence, a majority vote of all user data collected for the stretchof road is taken for each segment and final verdict is allocated.
BASIC VISUALIZATION
The basic visualization shows the most current classification ac-cording to the 12 classes.
QUERY-BASED VISUALIZATION
The system supports two types of queries as given below: Spa-tial Queries: Analysis of the road based on municipality wardcan be opted.Temporal Queries: Queries based on different time periodscan also be performed for different roads.
Using this tool we are able to answer the following queriesas per data from Table 2 which represents data collected by
volunteers for different parts of the city:
Spatial Queries
Road length: 10 kmMost stable road in any city: Old Mumbai highway, IIIT MainroadAnalysis of current road : Old Mumbai Highway - This roadis 95% good.
Temporal Queries
Road length: 10 kmAnalysis of status change of a road over a period of timeStatus change of Old Mumbai Highway over the past 1 year -negligibleCurrent state of roads in any city In Hyderabad, over 80% ofthe roads have good condition.
We can see from the above data that we have built a spatially-aware knowledge base from the existing system.
6. CONCLUSION
A low cost sensor based visualization framework is a solidmatch for city districts since it removes the requirement for spe-cific high-end checking infrastructure. This system can be util-ized to produce geo-labeled insights on road infrastructure. For
ISPRS Annals of the Photogrammetry, Remote Sensing and Spatial Information Sciences, Volume V-4-2020, 2020 XXIV ISPRS Congress (2020 edition)
instance, faster deterioration of some roads over others can beeasily determined. The framework presently gathers and showsthe information which gives different organizations a preparedreference about surface and condition qualities. This frame-work proposes an intuitive citizen supported model to screenroad surface and condition. Crowd-sourced model for such ap-plications can be actualized by 1) Geo-citizens; 2) Office staffof districts or city enterprises; 3) Campaign or strategic activ-ities which are onetime occasions; 4) Cabs and commercialvehicle operations units. The present system is a convenientmethodology that can be utilized in any of these methods.Mostof the existing systems only provide information regarding thecondition of the road, but this system also covers the surface in-formation. By making such a system available, we show a trueexample of utilizing GIS in governance.
REFERENCES
Bhoraskar, R., Vankadhara, N., Raman, B., Kulkarni, P., 2012.Wolverine: Traffic and road condition estimation using smart-phone sensors. 2012 fourth international conference on com-munication systems and networks (COMSNETS 2012), IEEE,1–6.
Cheng, Y., Li, X., Li, Z., Jiang, S., Li, Y., Jia, J., Jiang, X.,2014. Aircloud: a cloud-based air-quality monitoring systemfor everyone. Proceedings of the 12th ACM Conference on Em-bedded Network Sensor Systems, 251–265.
Curtis, S., Halber, E. P., Evans, G. M., Petersen, S. L., 2013.Passive crowd-sourced map updates and alternate route recom-mendations. US Patent 8,620,532.
Forslof, L., Jones, H., 2015. Roadroid: Continuous road condi-tion monitoring with smart phones. Journal of Civil Engineer-ing and Architecture, 9(4), 485–496.
Gannu, B., Rajan, K., 2018. Maarg: Geo-processing and in-formation fusion approach for road condition and surface mon-itoring. http://toc.proceedings.com/47496webtoc.pdf.
Mohan, P., Padmanabhan, V. N., Ramjee, R., 2008. Nericell:rich monitoring of road and traffic conditions using mobilesmartphones. Proceedings of the 6th ACM conference on Em-bedded network sensor systems, 323–336.
Rajamohan, D., Gannu, B., Rajan, K. S., 2015. MAARGHA:a prototype system for road condition and surface type estim-ation by fusing multi-sensor data. ISPRS International Journalof Geo-Information, 4(3), 1225–1245.
Schmitt, M., Zhu, X. X., 2016. Data fusion and remote sens-ing: An ever-growing relationship. IEEE Geoscience and Re-mote Sensing Magazine, 4(4), 6–23.
ISPRS Annals of the Photogrammetry, Remote Sensing and Spatial Information Sciences, Volume V-4-2020, 2020 XXIV ISPRS Congress (2020 edition)