+ All Categories
Home > Documents > David C Wilson Imperial CollegeDavid C Wilson, Imperial ... Scheinberg.pdf · David C Wilson...

David C Wilson Imperial CollegeDavid C Wilson, Imperial ... Scheinberg.pdf · David C Wilson...

Date post: 30-Aug-2019
Category:
Upload: others
View: 45 times
Download: 0 times
Share this document with a friend
42
Solid waste management in the worlds cities: Highlights from the UN-Habitat 2010 book David C Wilson Imperial College 2010 book David C Wilson, Imperial College Anne Scheinberg, WASTE Ljiljana Rodic Wageningen University --and a Ljiljana Rodic, Wageningen University --and a team of global experts
Transcript

Solid waste management in the world’s cities: Highlights from the UN-Habitat 2010 book

David C Wilson Imperial College

2010 book

David C Wilson, Imperial CollegeAnne Scheinberg, WASTELjiljana Rodic Wageningen University --and a Ljiljana Rodic, Wageningen University --and a team of global experts

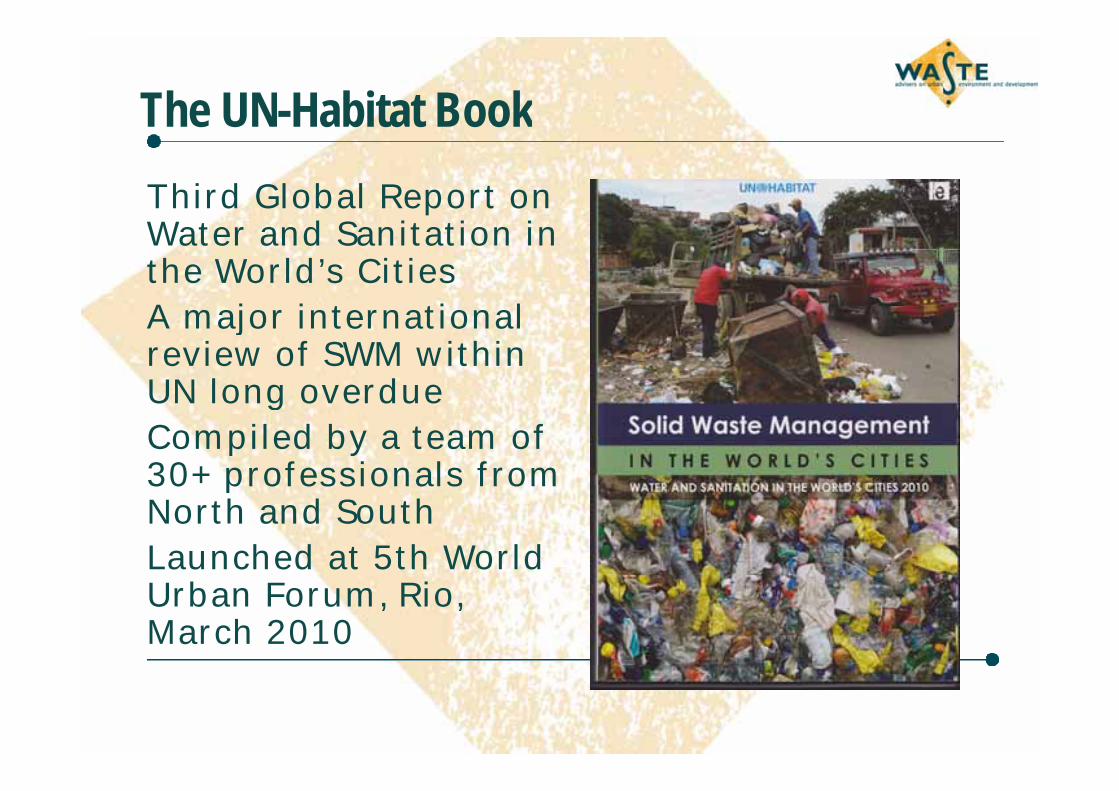
The UN-Habitat BookThe UN Habitat BookThird Global Report on Water and Sanitation in the World’s CitiesA j i i l A major international review of SWM within UN long overdueUN long overdueCompiled by a team of 30+ professionals from 30 professionals from North and SouthLaunched at 5th World Urban Forum, Rio, March 2010

Filling the information gap

Preparing a critical review & guidelines would p g ghave been relatively easy

But we decided rather to face up to the critical But we decided rather to face up to the critical lack of solid waste & recycling data, benchmarks, “smart” indicatorsbenchmarks, smart indicators

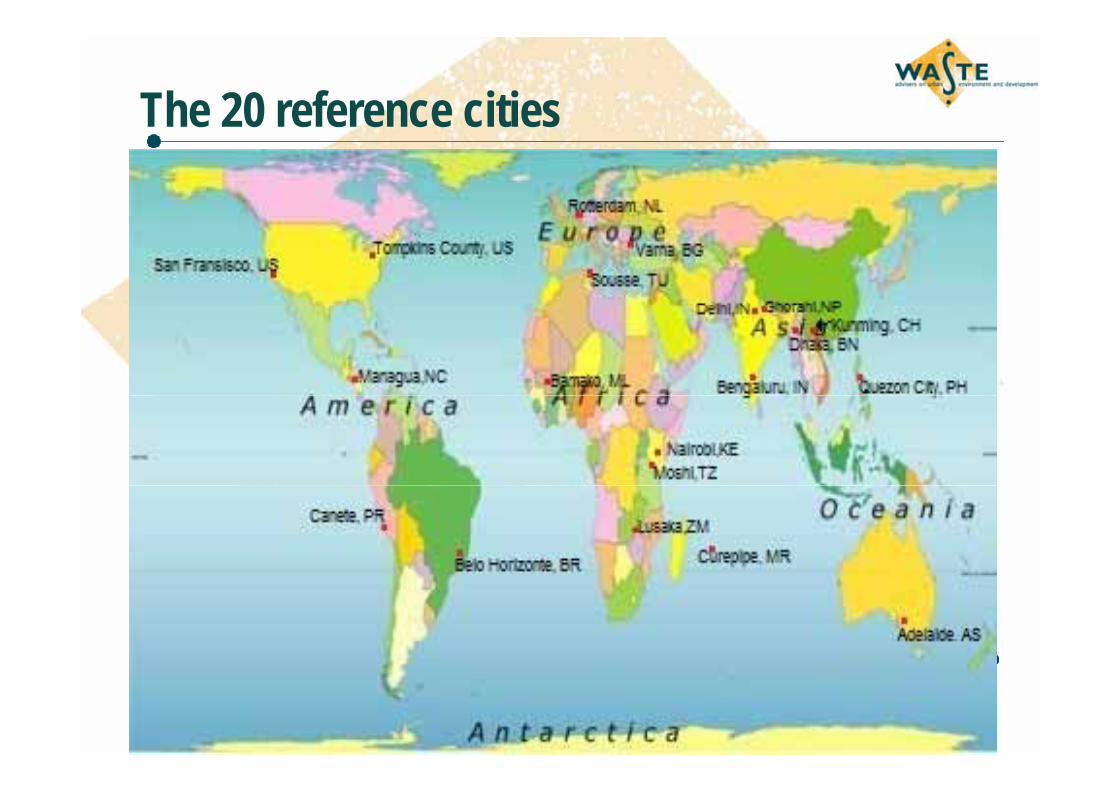
Set out to collect reliable and consistent data from 20 citiesfrom 20 cities

Match indicators to “drivers” and governance

Low, middle, and high-income countries and cities in the same frame

Reliable and consistent data

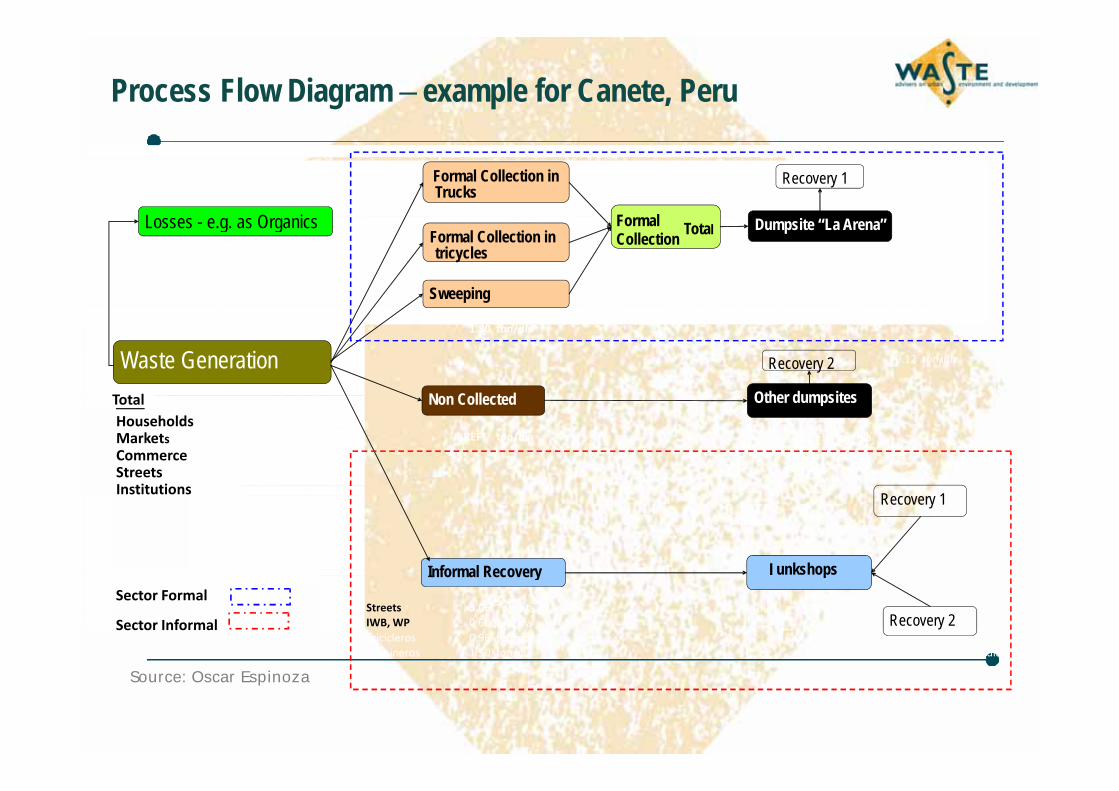
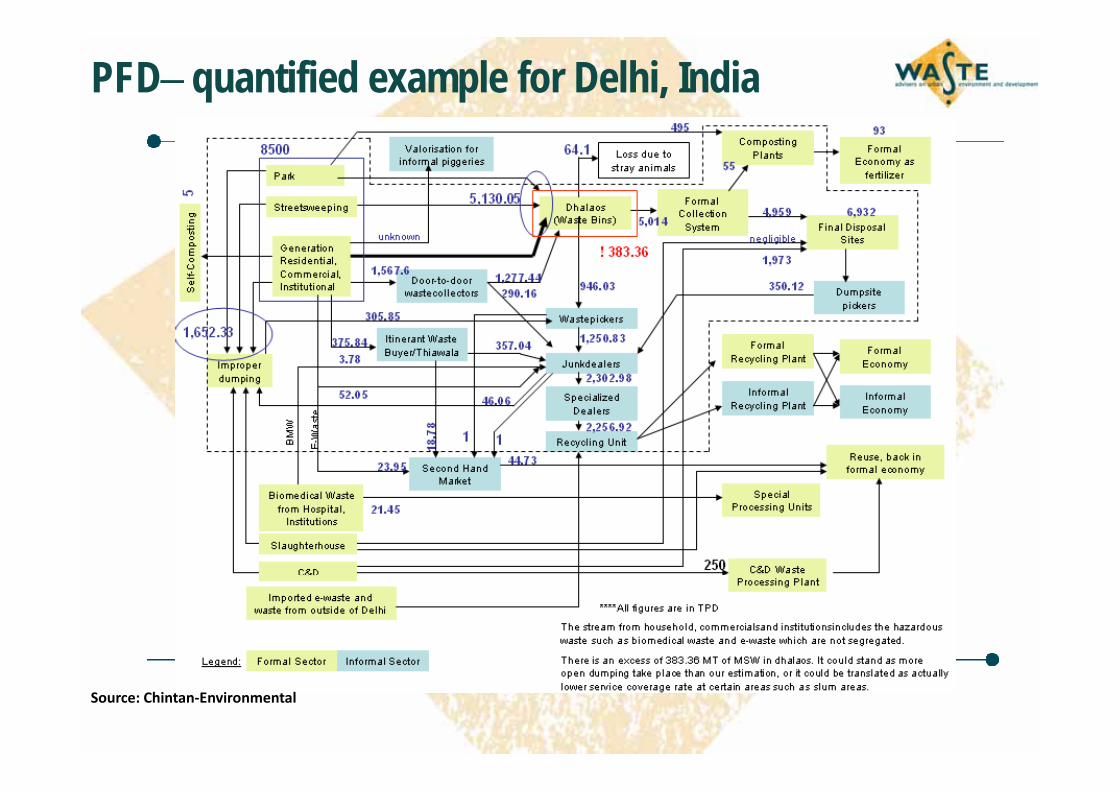
Detailed data protocol to ensure consistencyconsistencyUsing a process flow (mass balance) diagram to understand entire systemdiagram to understand entire systemIncluding formal and informal sectorsD l i i di f Developing indicators even for more qualitative criteriaD i i i fil i i l Designating a city profiler - critical review of the data

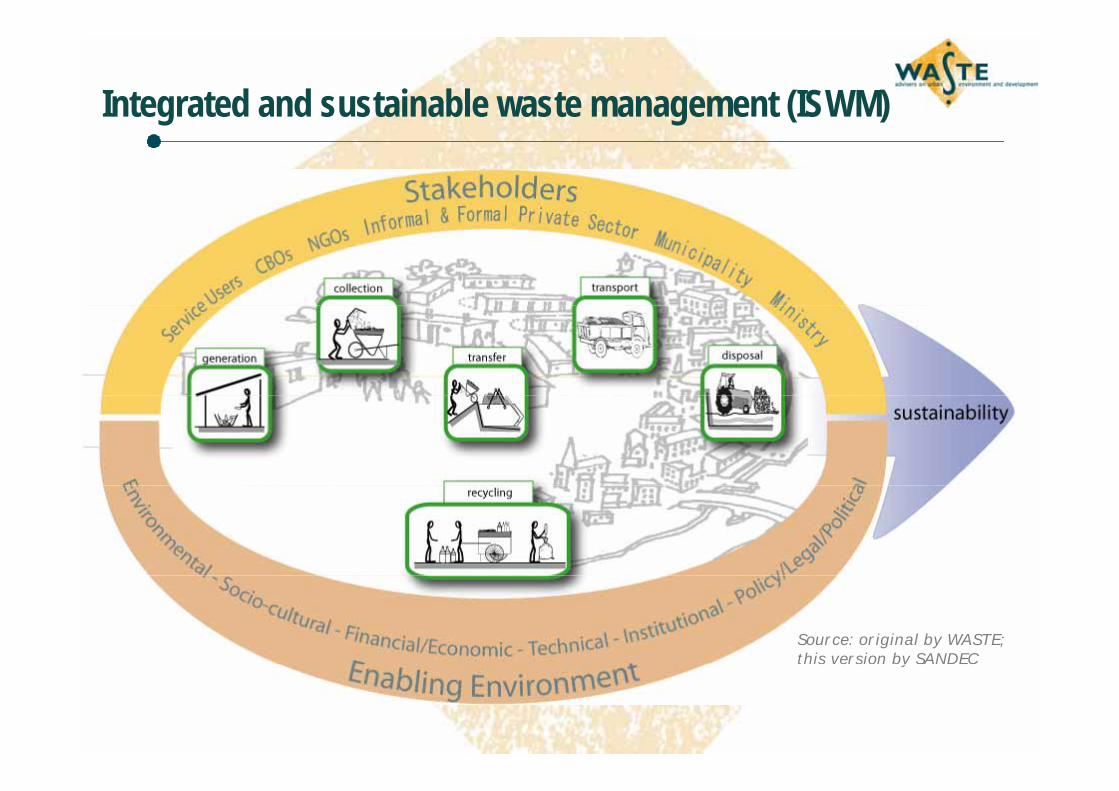
Integrated and sustainable waste management (ISWM)

Source: original by WASTE; this version by SANDECy

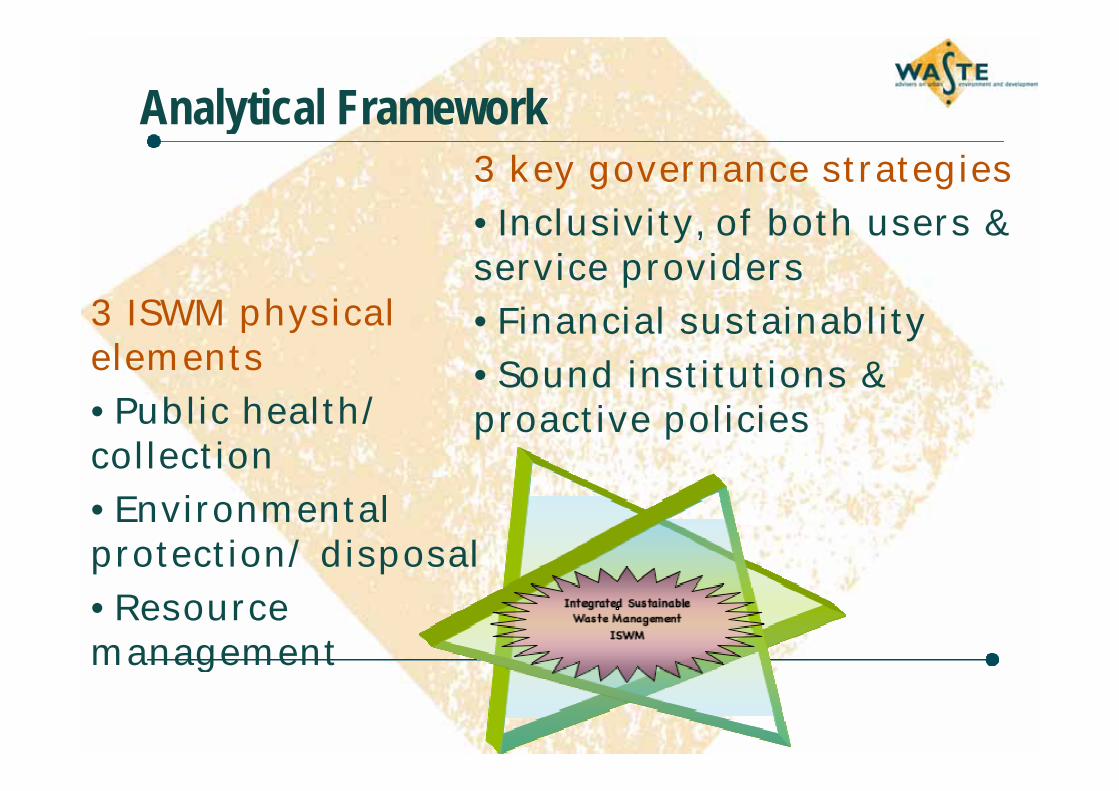
Analytical Frameworky3 key governance strategies

Inclusivity of both users &
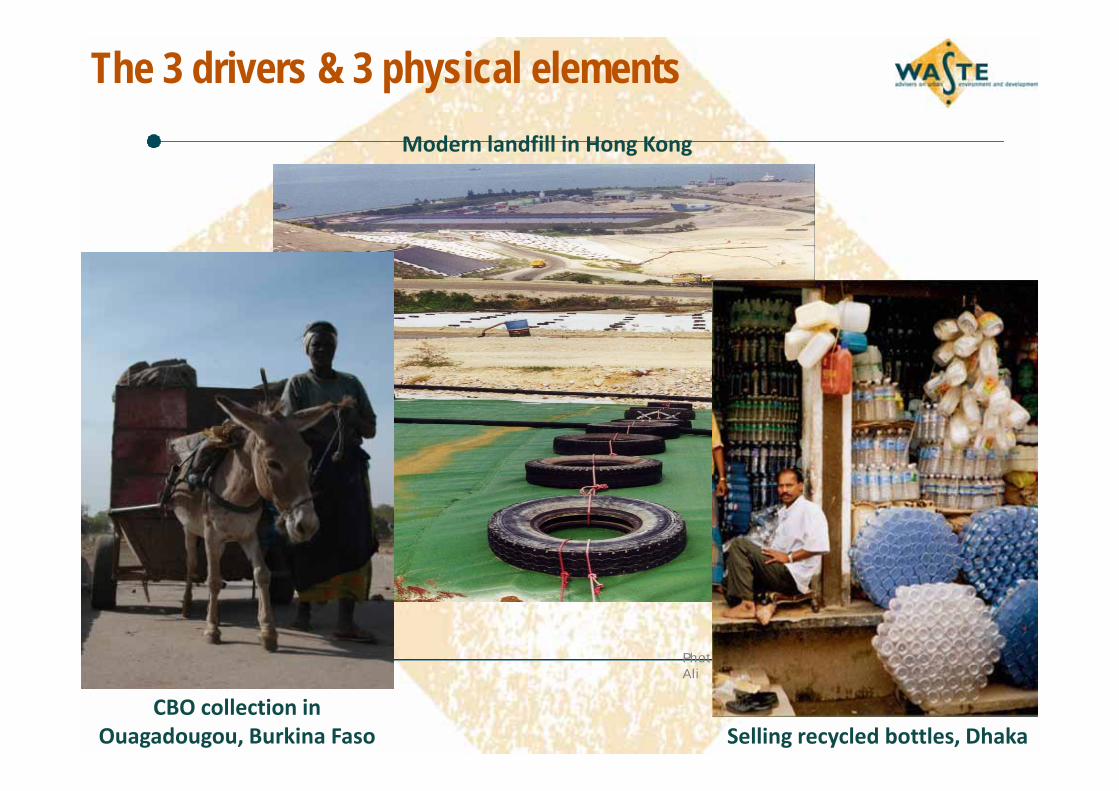
3 ISWM physical

•Inclusivity, of both users &service providers

i i l i bli3 ISWM physical elements
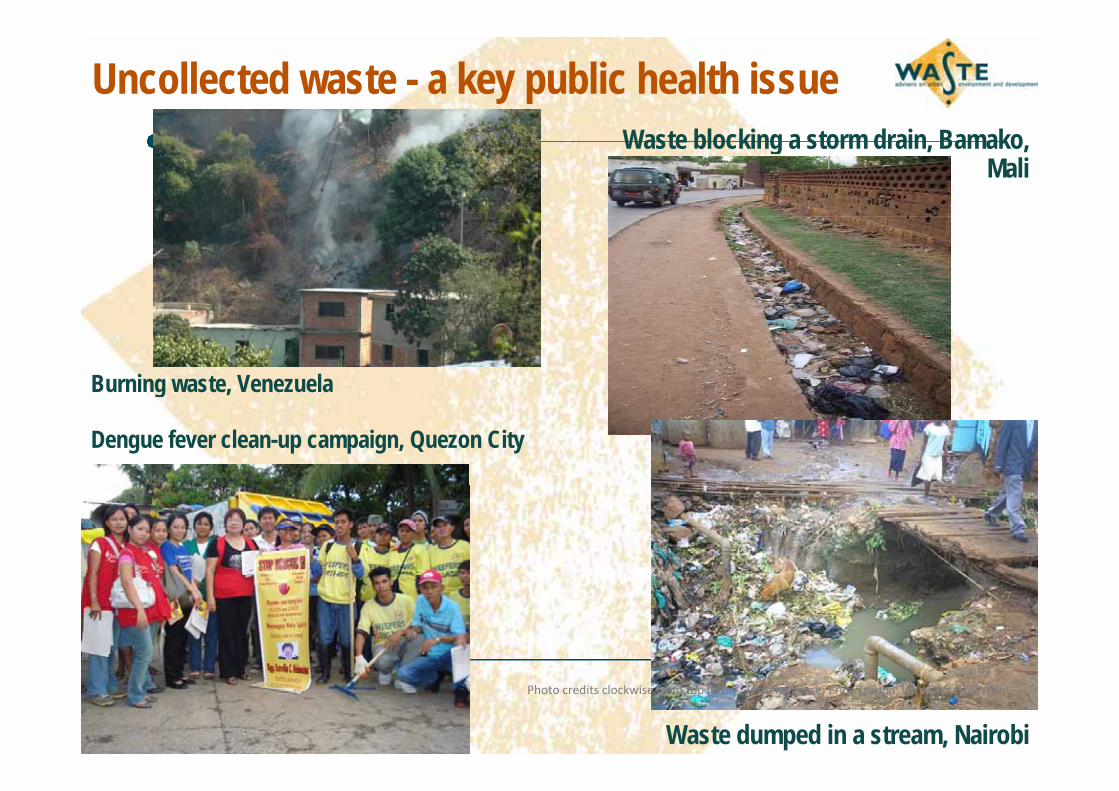
bl h l h/

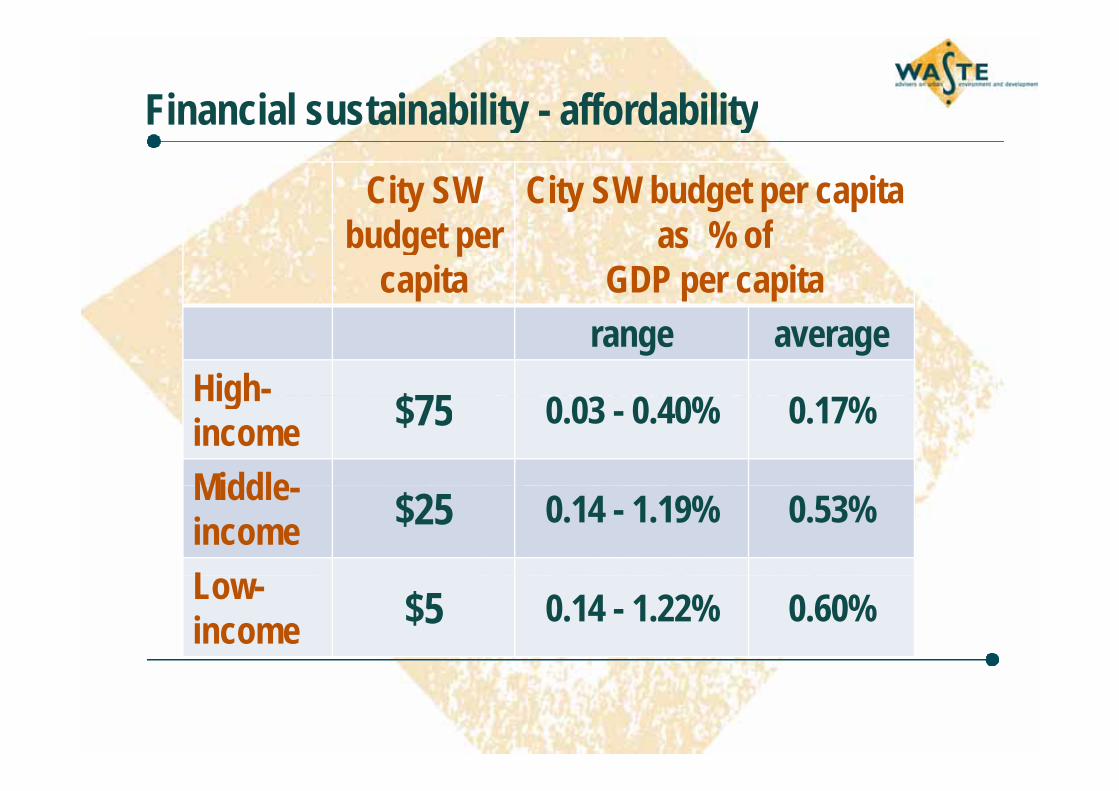
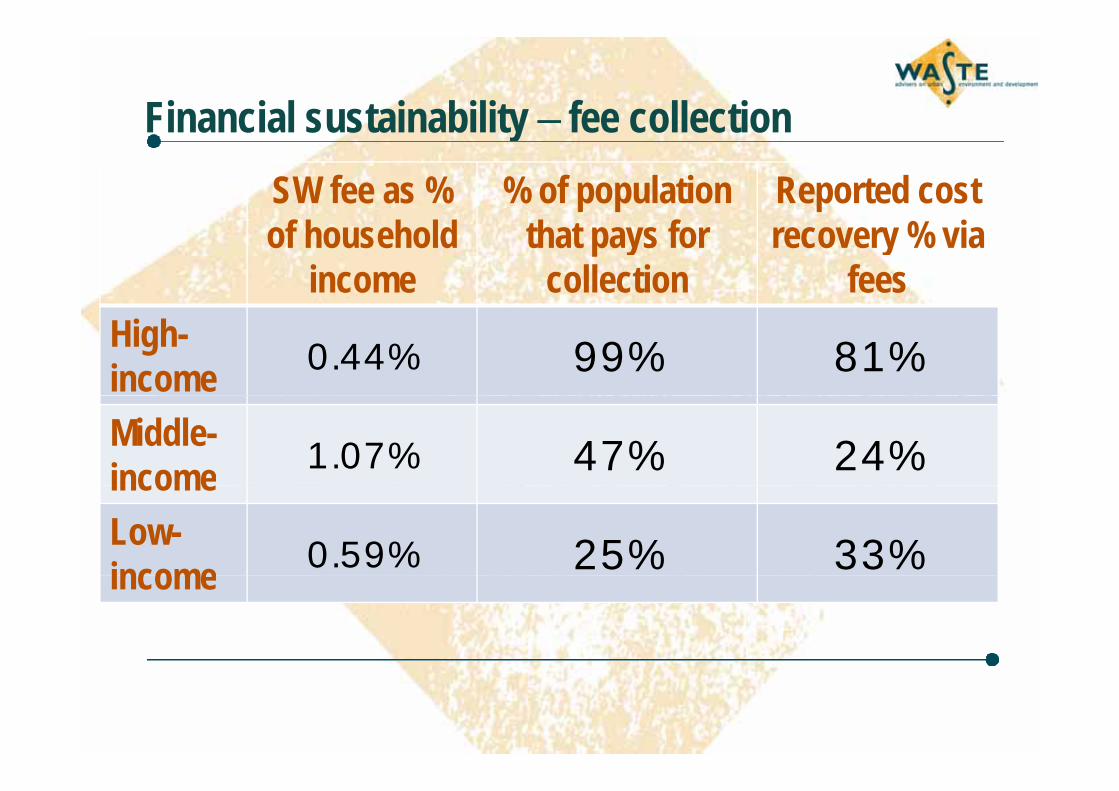
•Financial sustainablity

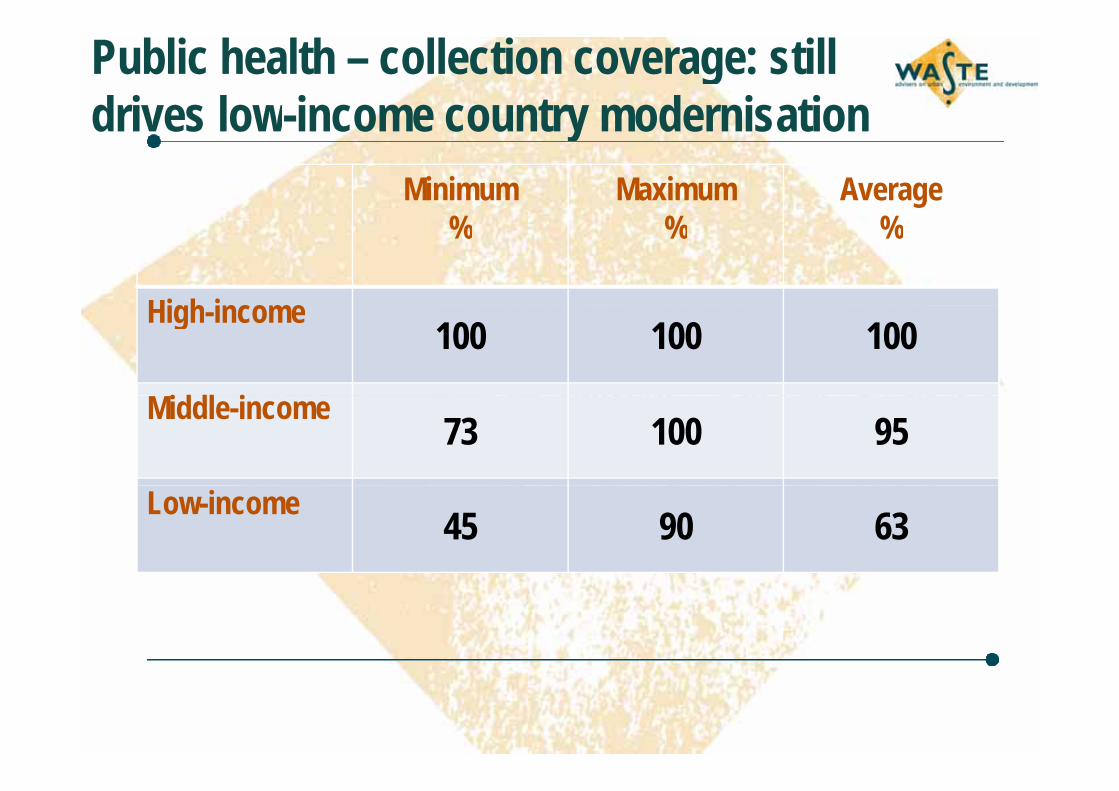
•Sound institutions &•Public health/ collection

proactive policies

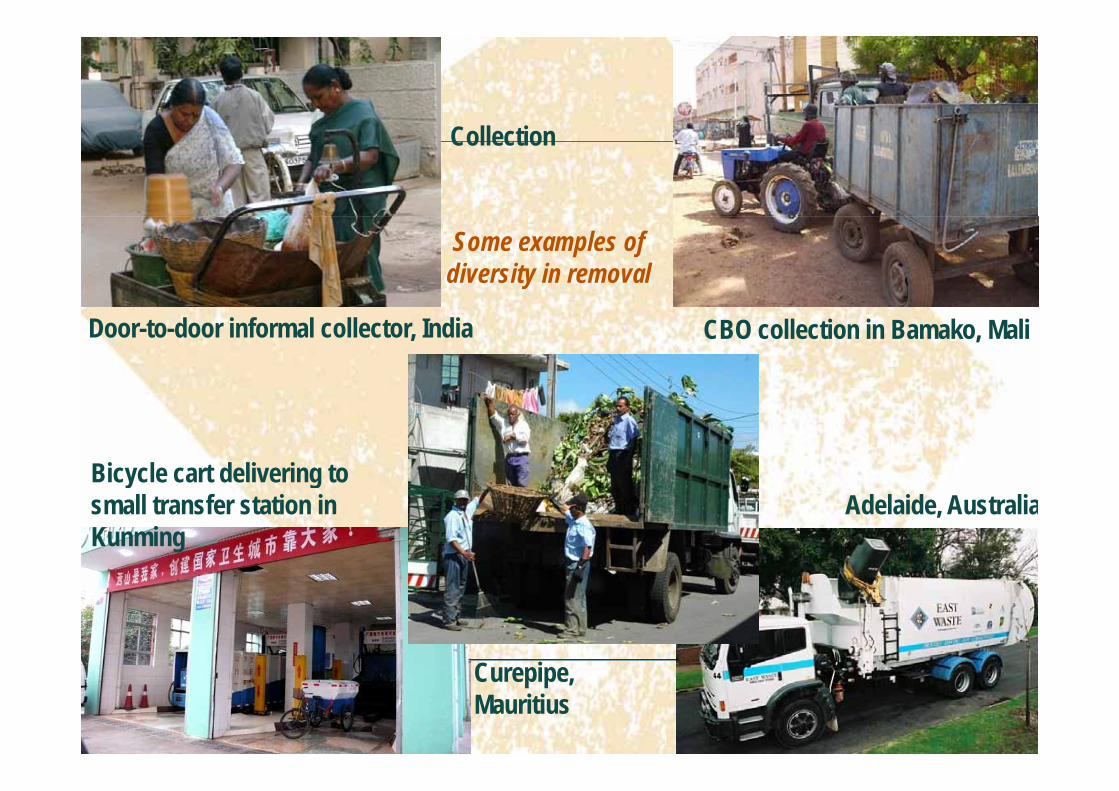
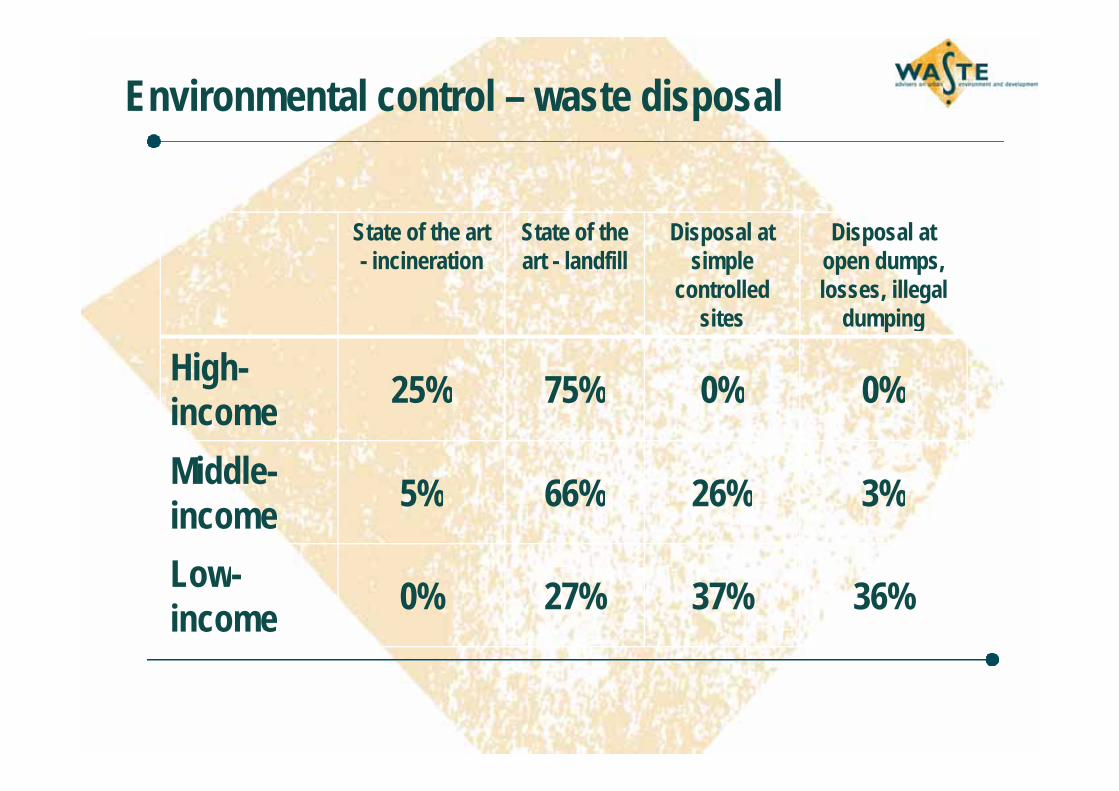
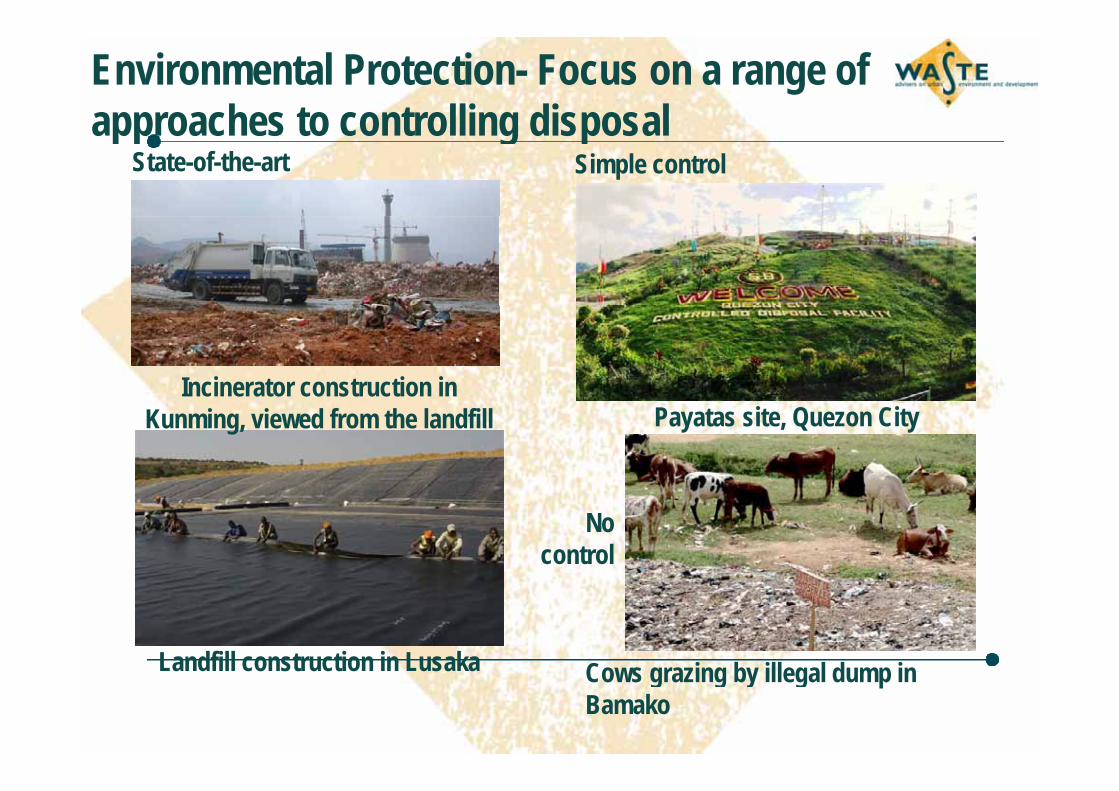
•Environmental protection/ disposal

•Resource managementa age e t

The 20 reference citiesThe 20 reference cities

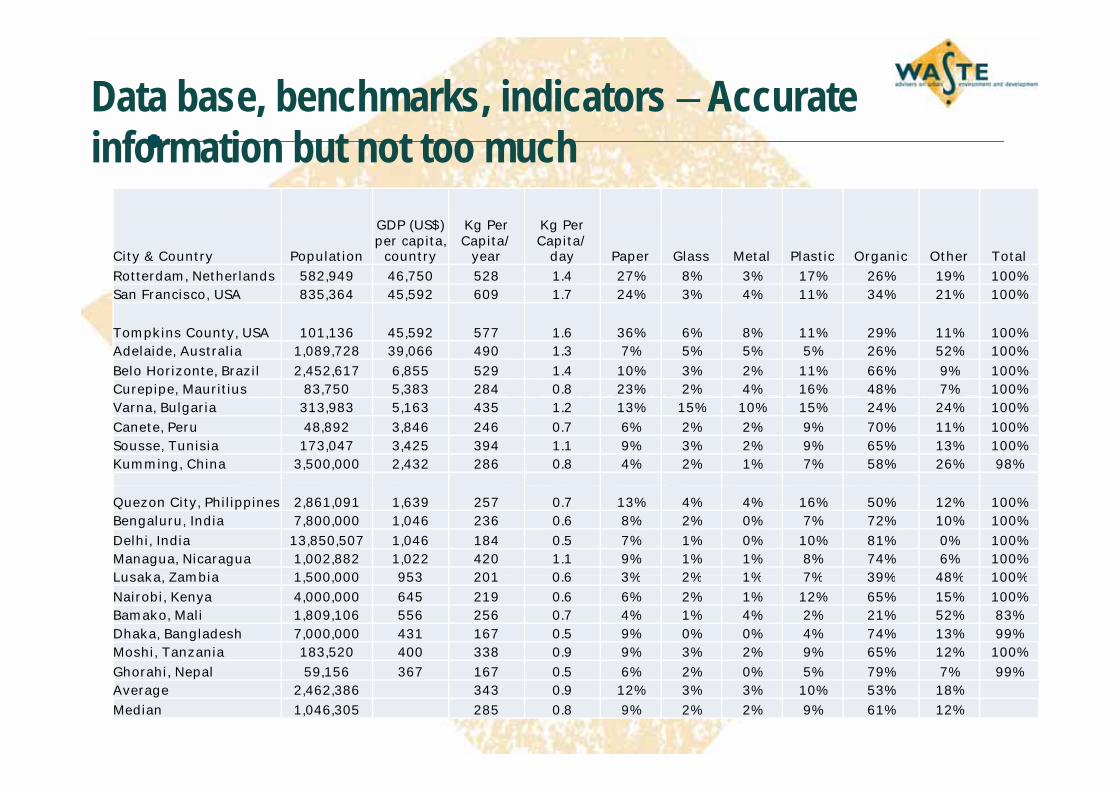
Data base, benchmarks, indicators – Accurate information but not too much

City & Country Population

GDP (US$) per capita,

country

Kg Per Capita/

year

Kg Per Capita/

day Paper Glass Metal Plastic Organic Other Total

Rotterdam, Netherlands 582,949 46,750 528 1.4 27% 8% 3% 17% 26% 19% 100%San Francisco, USA 835,364 45,592 609 1.7 24% 3% 4% 11% 34% 21% 100%

Tompkins County, USA 101,136 45,592 577 1.6 36% 6% 8% 11% 29% 11% 100%Adelaide, Australia 1,089,728 39,066 490 1.3 7% 5% 5% 5% 26% 52% 100%

Belo Horizonte, Brazil 2,452,617 6,855 529 1.4 10% 3% 2% 11% 66% 9% 100%Curepipe, Mauritius 83,750 5,383 284 0.8 23% 2% 4% 16% 48% 7% 100%p p , , ,Varna, Bulgaria 313,983 5,163 435 1.2 13% 15% 10% 15% 24% 24% 100%

Canete, Peru 48,892 3,846 246 0.7 6% 2% 2% 9% 70% 11% 100%Sousse, Tunisia 173,047 3,425 394 1.1 9% 3% 2% 9% 65% 13% 100%Kumming, China 3,500,000 2,432 286 0.8 4% 2% 1% 7% 58% 26% 98%

Quezon City, Philippines 2,861,091 1,639 257 0.7 13% 4% 4% 16% 50% 12% 100%Bengaluru, India 7,800,000 1,046 236 0.6 8% 2% 0% 7% 72% 10% 100%

Delhi, India 13,850,507 1,046 184 0.5 7% 1% 0% 10% 81% 0% 100%Managua, Nicaragua 1,002,882 1,022 420 1.1 9% 1% 1% 8% 74% 6% 100%Lusaka Zambia 1 500 000 953 201 0 6 3% 2% 1% 7% 39% 48% 100%Lusaka, Zambia 1,500,000 953 201 0.6 3% 2% 1% 7% 39% 48% 100%

Nairobi, Kenya 4,000,000 645 219 0.6 6% 2% 1% 12% 65% 15% 100%Bamako, Mali 1,809,106 556 256 0.7 4% 1% 4% 2% 21% 52% 83%Dhaka, Bangladesh 7,000,000 431 167 0.5 9% 0% 0% 4% 74% 13% 99%Moshi, Tanzania 183,520 400 338 0.9 9% 3% 2% 9% 65% 12% 100%

Ghorahi, Nepal 59,156 367 167 0.5 6% 2% 0% 5% 79% 7% 99%Average 2,462,386 343 0.9 12% 3% 3% 10% 53% 18%

Median 1,046,305 285 0.8 9% 2% 2% 9% 61% 12%

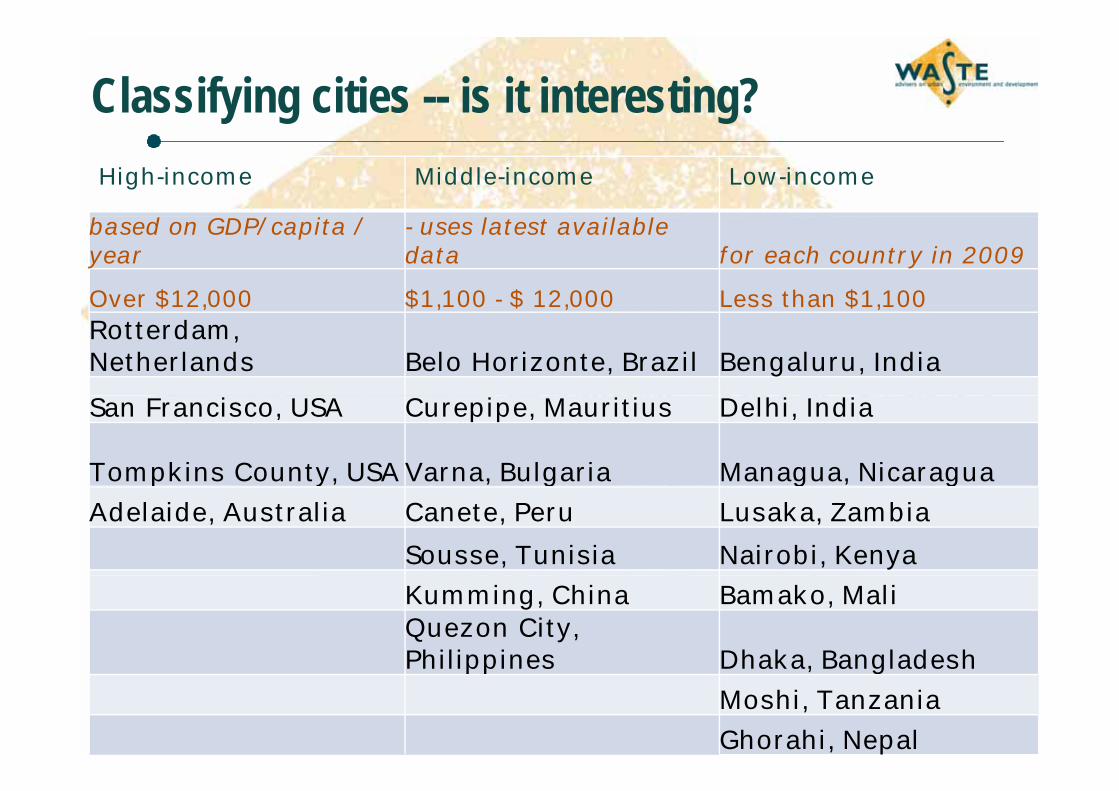
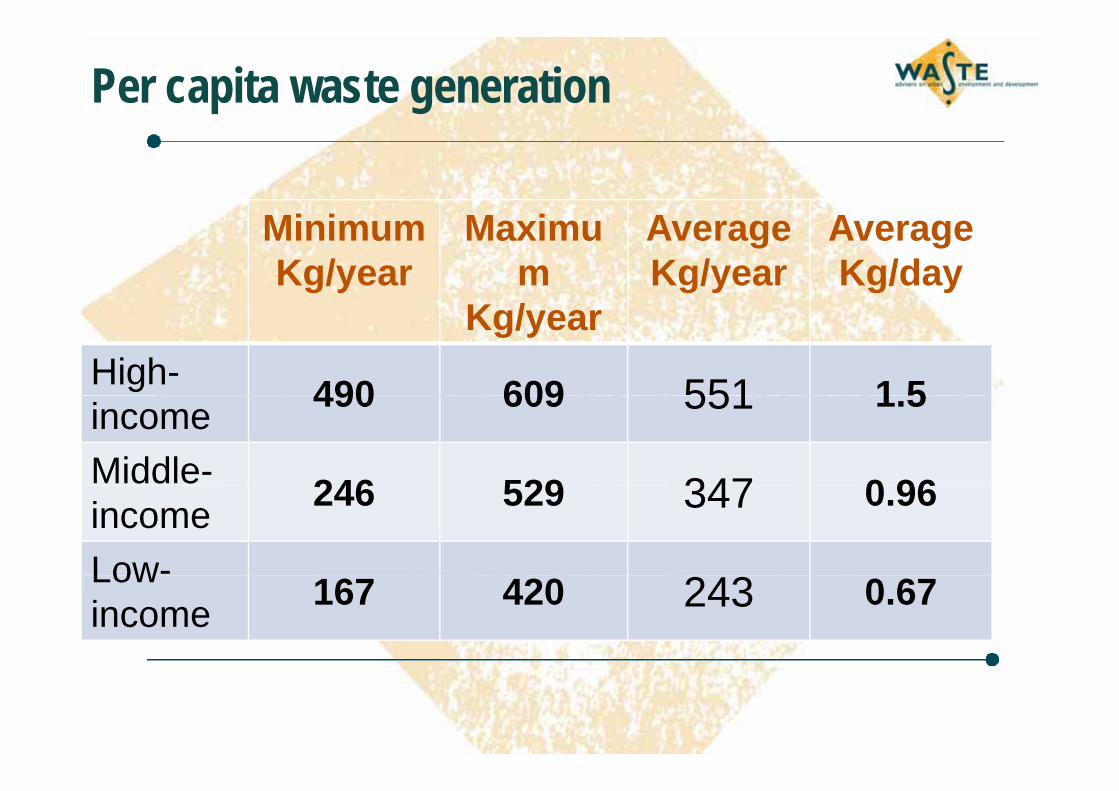
Classifying cities -- is it interesting?High-income Middle-income Low-income

based on GDP/capita / year

- uses latest available data for each country in 2009

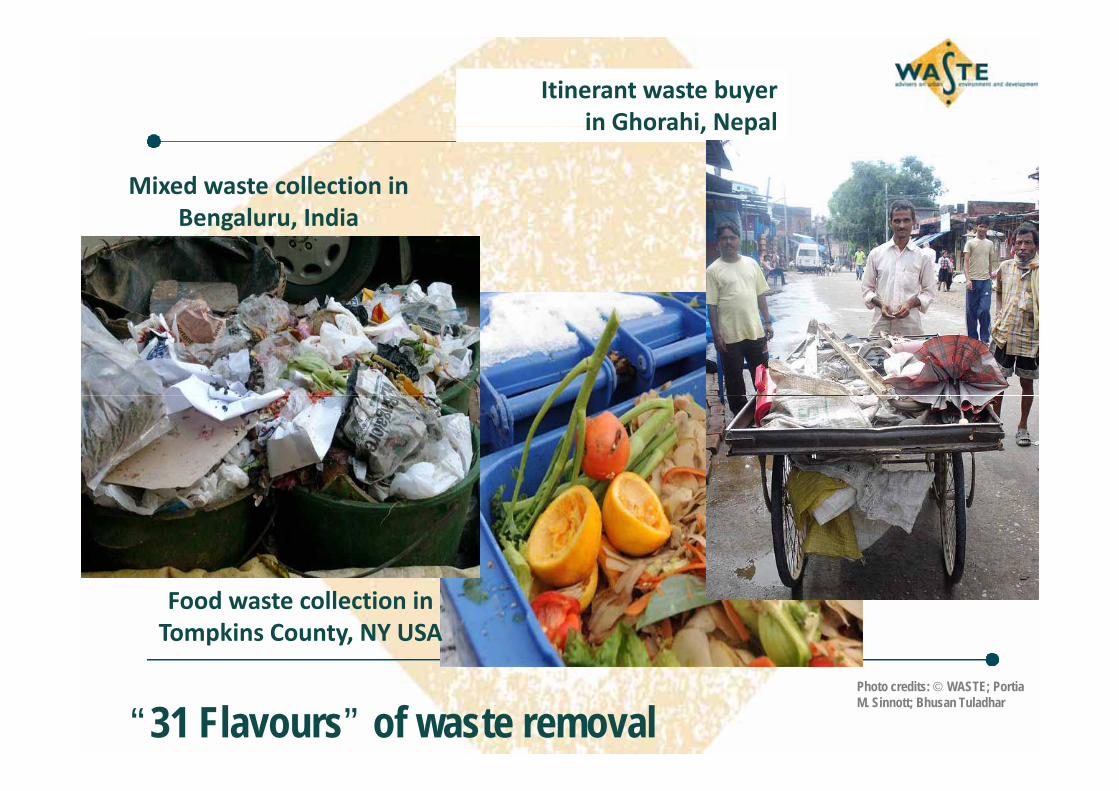
Over $12,000 $1,100 - $ 12,000 Less than $1,100Over $12,000 $1,100 $ 12,000 Less than $1,100Rotterdam, Netherlands Belo Horizonte, Brazil Bengaluru, India

San Francisco, USA Curepipe, Mauritius Delhi, India

Tompkins County, USA Varna, Bulgaria Managua, Nicaraguap y g g g

Adelaide, Australia Canete, Peru Lusaka, Zambia

Sousse, Tunisia Nairobi, Kenya

Kumming, China Bamako, MaliQuezon City, Philippines Dhaka, BangladeshPhilippines Dhaka, Bangladesh

Moshi, Tanzania

Ghorahi, Nepal

Itinerant waste buyer in Ghorahi Nepal

Mixed waste collection in Bengaluru India

in Ghorahi, Nepal

Bengaluru, India

Food waste collection in Tompkins County, NY USA

“31 Flavours” of waste removalPhoto credits: © WASTE; Portia M. Sinnott; Bhusan Tuladhar

Per capita waste generation

Mi i M i A AMinimum Kg/year

Maximum

K /

AverageKg/year

AverageKg/day

Kg/yearHigh- 490 609 551 1 5income 490 609 551 1.5

Middle- 246 529 347 0 96income 246 529 347 0.96

Low-Lowincome 167 420 243 0.67

Average waste composition

paper glass metal plastic organic other

High-income 24% 6% 5% 11% 29% 26%MiddlMiddle-income 11% 4% 4% 12% 54% 15%

Low-income 7% 2% 1% 7% 63% 18%

L i Low-income excluding outliers 73% 9%

Process Flow Diagram – example for Canete, Peru

0.32 ton/día

19.71 ton/día

Formal Collection in Trucks

F l

Recovery 1

L O i1.21 Ton/día #¡REF! 21.91 ton/día #¡REF! 21.58 ton/día

0.40 ton/día

Formal Collection in tricycles

Sweeping

Dumpsite “La Arena”Formal Collection TotalLosses - e.g. as Organics

1.80 ton/día

0.12 ton/día

T t l N C ll t d Other dumpsites

Waste Generation Recovery 2

Total  #¡REF! Ton/día

Households Ton/día

Markets Ton/día #¡REF! ton/día #¡REF! #¡REF! ton/día

Commerce Ton/día

Streets Ton/día

I tit ti T /dí

Non Collected Other dumpsites

Institutions Ton/día

0.32 ton/día

Informal Recovery Junkshops

Recovery 1

Sector FormalStreets 3.06 Ton/día #¡REF! 3.50 ton/día

Sector Informal IWB, WP 0.60 ton/díaTricicleros 0.96 ton/díaCachineros 1.50 ton/día 0.12 ton/día

Informal Recovery p

Recovery 2

Source: Oscar Espinoza

PFD– quantified example for Delhi, India

Source: Chintan‐Environmental

The 3 drivers & 3 physical elementsModern landfill in Hong Kong

Photo credits: © Jeroen Ijgosse; David C Wilson;, MansojgAli

CBO collection in Ouagadougou, Burkina Faso  Selling recycled bottles, Dhaka

Uncollected waste - a key public health issueWaste blocking a storm drain, Bamako,

Mali

Burning waste, Venezuelag ,

Dengue fever clean-up campaign, Quezon City

Waste dumped in a stream, Nairobi

Photo credits clockwise from top left: © Jeroen Ijgosse; Erica Trauba; UN‐Habitat; SWAPP 

Public health – collection coverage: still drives low-income country modernisationdrives low income country modernisation

Minimum %

Maximum%

Average%% % %

High incomeHigh-income 100 100 100

Middle-income 73 100 95

Low-income 45 90 63

CCollection

Some examples of diversity in removal

Door-to-door informal collector, India CBO collection in Bamako, Mali

Bicycle cart delivering to Adelaide, Australia

y gsmall transfer station in Kunming

C i Curepipe, Mauritius

Environmental control – waste disposal

State of the art - incineration

State of the art - landfill

Disposal at simple

controlled

Disposal at open dumps, losses, illegal

sites dumping

High- 25% 75% 0% 0%income 25% 75% 0% 0%

Middle- 5% 66% 26% 3%income 5% 66% 26% 3%

Low-Low-income 0% 27% 37% 36%

Environmental Protection- Focus on a range of approaches to controlling disposalapproaches to controlling disposal

State-of-the-art Simple control

No controlIncinerator construction in No controlIncinerator construction in Kunming, viewed from the landfill Payatas site, Quezon City

No control

Landfill construction in Lusaka C i b ill l d i Landfill construction in Lusaka Cows grazing by illegal dump in Bamako

Case Study- Ghorahi, Nepal 20092009Karauti Danda Landfill

including waste sorting / recycling

Photo credits : © BhushanTuladhar

Resource recovery – valorisation and high recycling rateshigh recycling rates

Minimum %

Maximum%

Average%

High-income

30 72 54income 5

Middle-6 39 22income6 39 22

Low-6 85 27income6 85 27

Resource recovery formal vs informalResource recovery - formal vs informal

A F l I f lAverage%

Formal%

Informal%

High-income 54 54 0incomeMiddle-i 22 8 13income 22 13Low- 27 3 24income 27 3 24

Building on informal recycling enterprises

Relies entirely on the market value of materialsSaves cities money from in avoided collection & disposal costs

Opportunity for win-win solutions1 Build recycling 1. Build recycling

rates2. Improve

l l h dlivelihoods3. Improve

working working conditions

4. Save the city money

Plastics recycling in Delhimoney

Case study: Quezon City, Phili iPhilippines

Sharp increase in recycling Year Total IWBs1997 6% 4%

p y g

2006 25% 16%2009 37% 24%

NGO‐led ‘Linis Ganda’Linkages across supply chaing pp yRecognition & respectability

uniforms, ID, accessliti ll t dpolitically connected

Organise co‐operativesFacilitate affordable credit

Photo credits: Embassy of Japan in the Philippines; Government of the Philippines, 2006

G t t i li it t

Moshi – the ‘cleanest city in Tanzania’ Waste & Citizenship Forum, Belo Horizonte

Governance strategies: policy commitment matters (a lot) more than money( ) y

Photo credits: © Alodia Ishengoma, Sonia Maria Dias

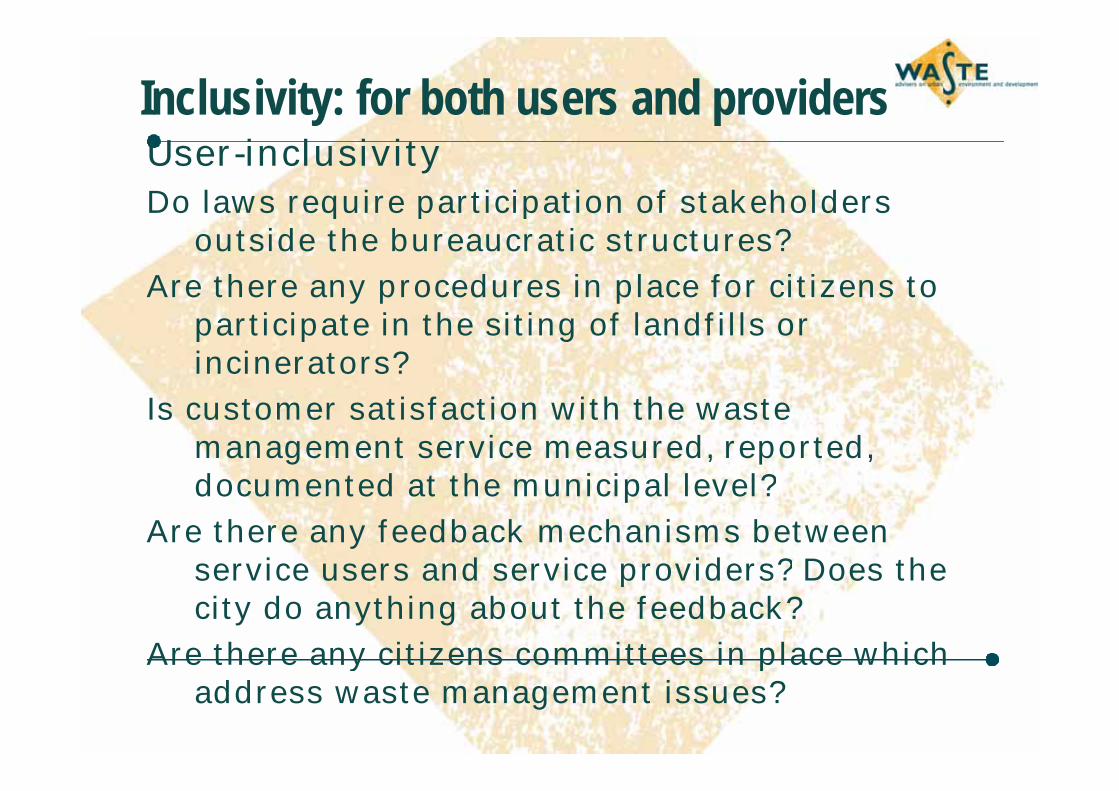
Inclusivity: for both users and providersUser-inclusivityDo laws require participation of stakeholders q p p

outside the bureaucratic structures?

Are there any procedures in place for citizens to participate in the siting of landfills or incinerators?

f h hIs customer satisfaction with the waste management service measured, reported, documented at the municipal level?documented at the municipal level?

Are there any feedback mechanisms between service users and service providers? Does the service users and service providers? Does the city do anything about the feedback?

Are there any citizens committees in place which e t e e a y c t e s co ttees p ace caddress waste management issues?

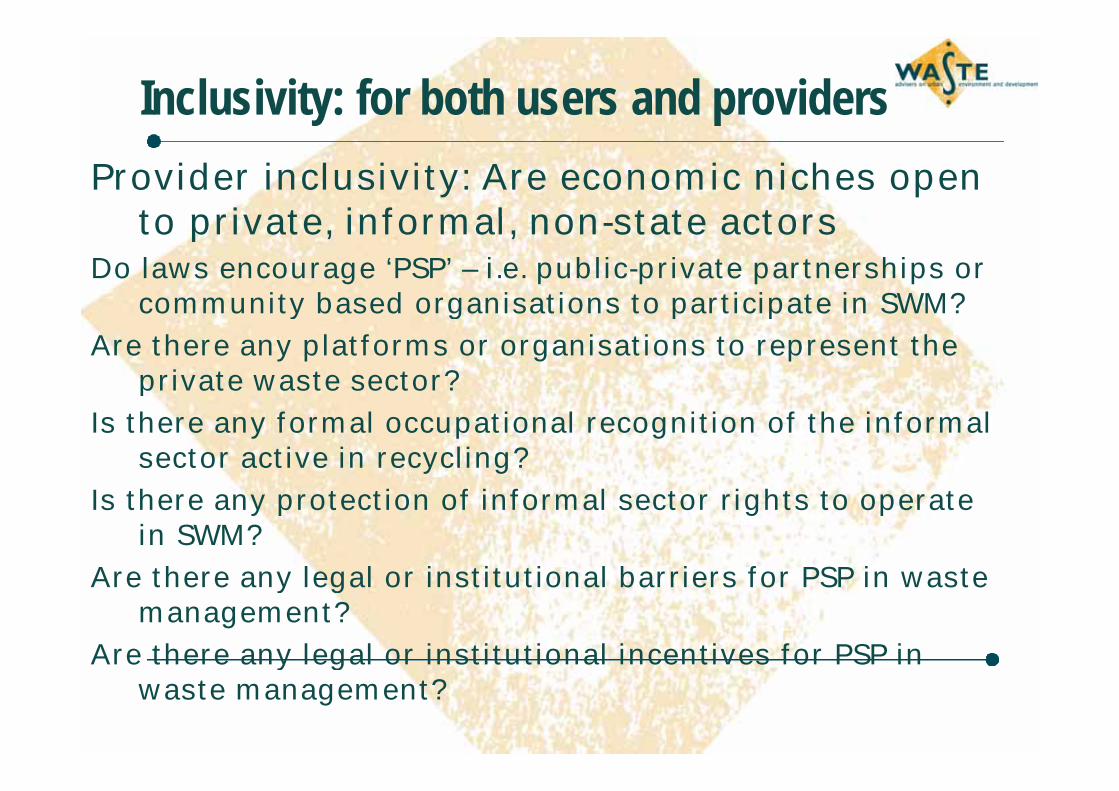
Inclusivity: for both users and providersProvider inclusivity: Are economic niches open

to private informal non state actorsto private, informal, non-state actorsDo laws encourage ‘PSP’ – i.e. public-private partnerships or

community based organisations to participate in SWM? community based organisations to participate in SWM?

Are there any platforms or organisations to represent the private waste sector?p

Is there any formal occupational recognition of the informal sector active in recycling?

Is there any protection of informal sector rights to operate in SWM?

Are there any legal or institutional barriers for PSP in waste Are there any legal or institutional barriers for PSP in waste management?

Are there any legal or institutional incentives for PSP in y gwaste management?

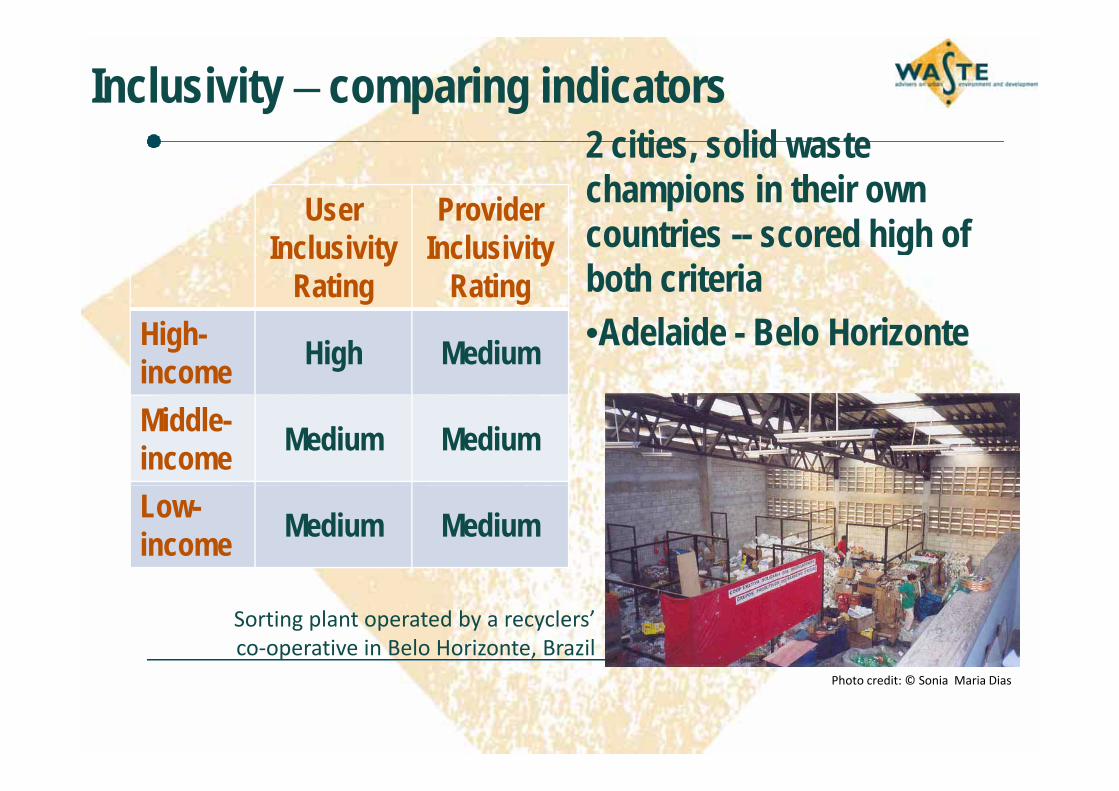
Inclusivity – comparing indicators

User Provider

2 cities, solid waste champions in their own User

InclusivityRating

Provider Inclusivity

Ratingcountries -- scored high of both criteria

High-income High Medium •Adelaide - Belo Horizonte

Middle-income Medium Medium

Low-income Medium Medium

Sorting plant operated by a recyclers’ co‐operative in Belo Horizonte, Brazil

Photo credit: © Sonia  Maria Dias

Data on nos of informal waste sector workers

City % of total populationBengaluru 0.5%Bengaluru 0.5%

Belo Horizonte 0.0%Canete 0.4%Delhi 1.3%Dhaka 1.7%

Ghorahi 0 1%Ghorahi 0.1%Lusaka 0.0%

Managua 0.3%Managua 0.3%Quezon City 0.5%

Sousse 0.1%Average 0.5%

Total workers in 10 cities 350,000

Financial sustainability - affordabilityy y

City SW City SW budget per capita budget per

capitaas % of

GDP per capitarange average

High- $75Highincome $75 0.03 - 0.40% 0.17%

MiddleMiddle-income $25 0.14 - 1.19% 0.53%

LLow-income $5 0.14 - 1.22% 0.60%

Financial sustainability – fee collection for formal t i t h h ldwaste services to households

Direct Direct waste No direct No direct fee Direct charging via a waste bill

Direct waste fee +

property tax

No direct fee

(financed

No direct fee (finance

from a waste bill or a utility

bill (U)

property tax (financed via property

tax)

from general

sources)bill (U) tax) sources)Adelaide Bamako Belo Horizonte Ghorahi

Canete Bengaluru Curepipe Quezon CityCanete Bengaluru Curepipe Quezon City

Kunming Delhi

Lusaka DhakaLusaka Dhaka

Moshi Managua

( )Nairobi (U) Sousse

Rotterdam

Financial sustainability – fee collectionFinancial sustainability fee collectionSW fee as % % of population Reported cost of household

incomethat pays for

collectionrecovery % via

feesHigh-income 0.44% 99% 81%

Middle-income 1.07% 47% 24%incomeLow-income 0.59% 25% 33%income

Sound institutions, proactive policies

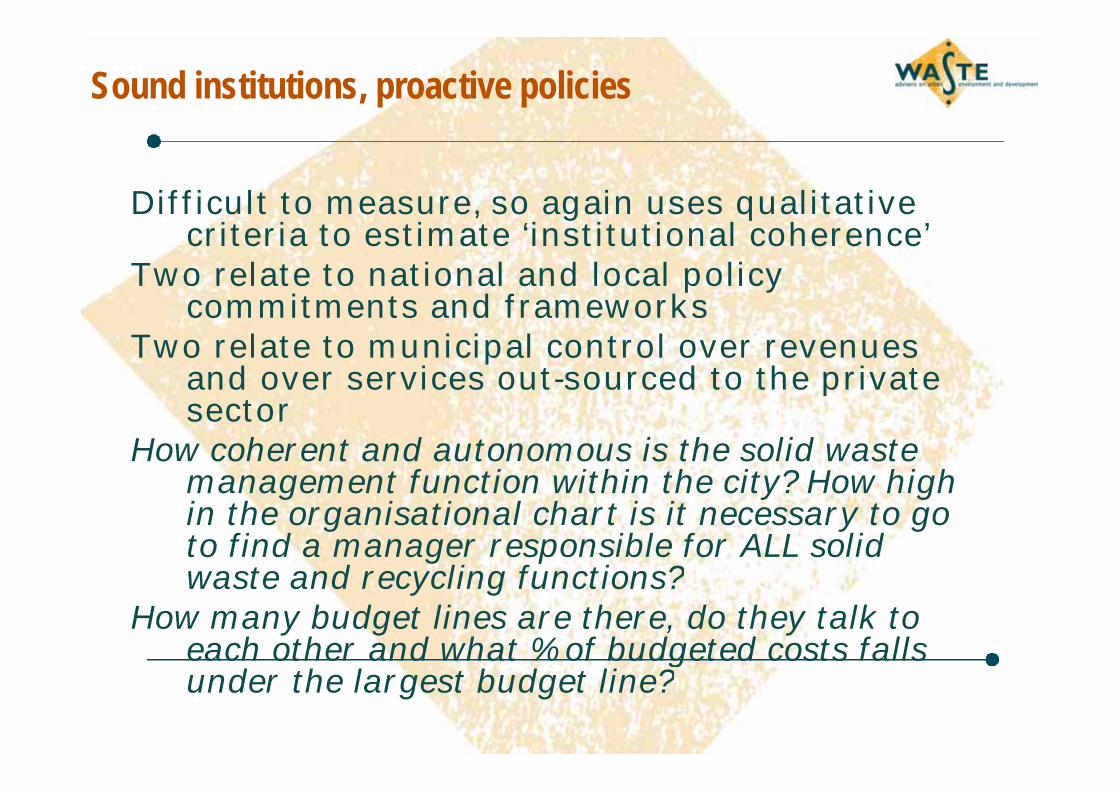
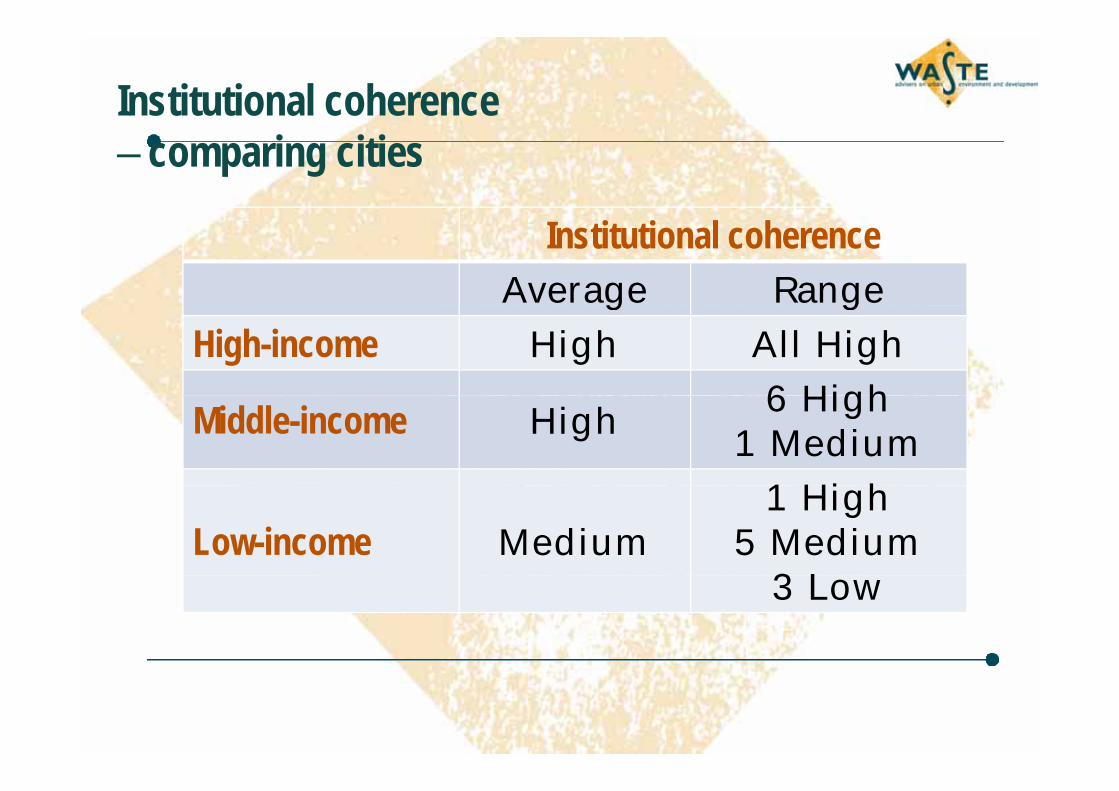
Difficult to measure, so again uses qualitative , g qcriteria to estimate ‘institutional coherence’

Two relate to national and local policy commitments and frameworkscommitments and frameworks

Two relate to municipal control over revenues and over services out-sourced to the private psector

How coherent and autonomous is the solid waste management function within the city? How high management function within the city? How high in the organisational chart is it necessary to go to find a manager responsible for ALL solid waste and recycling functions?waste and recycling functions?

How many budget lines are there, do they talk to each other and what % of budgeted costs falls f g funder the largest budget line?

Institutional coherence – comparing cities

Institutional coherenceAverage Rangeg g

High-income High All High

6 HighMiddle-income High6 High

1 Medium

1 Hi hLow-income Medium

1 High5 Medium

3 L3 Low

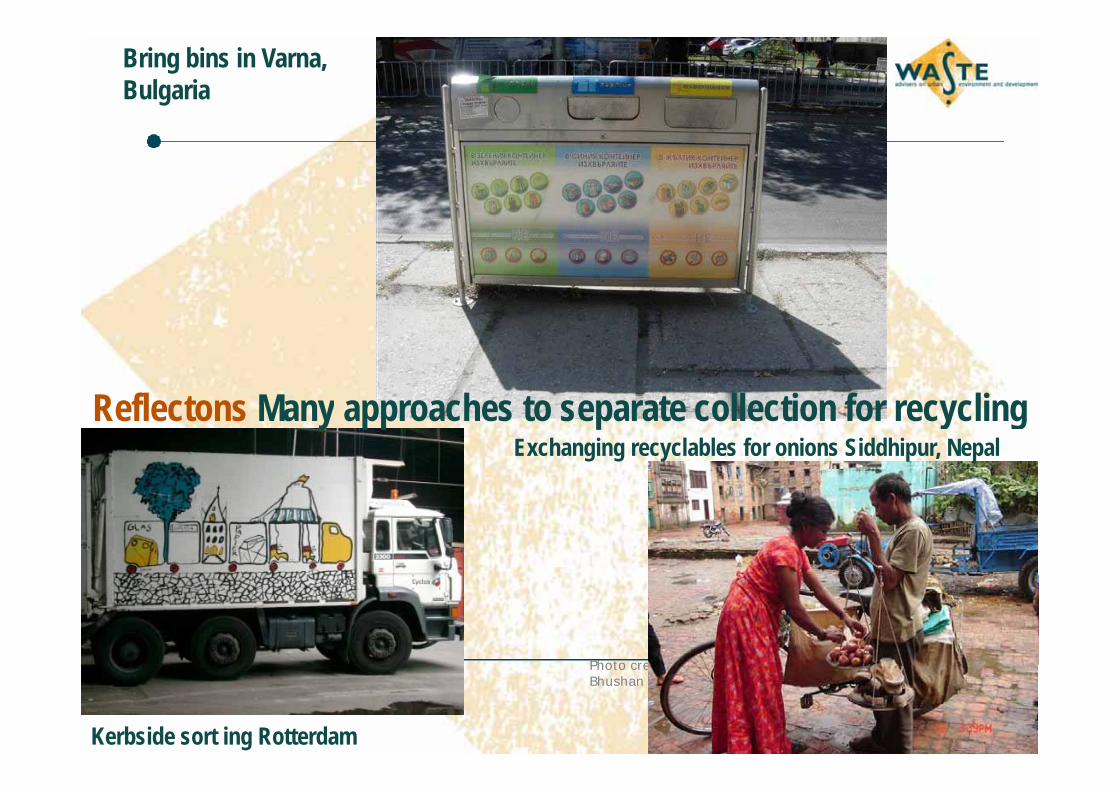
Bring bins in Varna, Bulgaria

R fl t M h t t ll ti f liReflectons Many approaches to separate collection for recyclingExchanging recyclables for onions Siddhipur, Nepal

Photo credits: © City of Rotterdam; Kossara Bozhilova Kisheva; Photo credits: © City of Rotterdam; Kossara Bozhilova-Kisheva; Bhushan Tuladhar

Kerbside sort ing Rotterdam

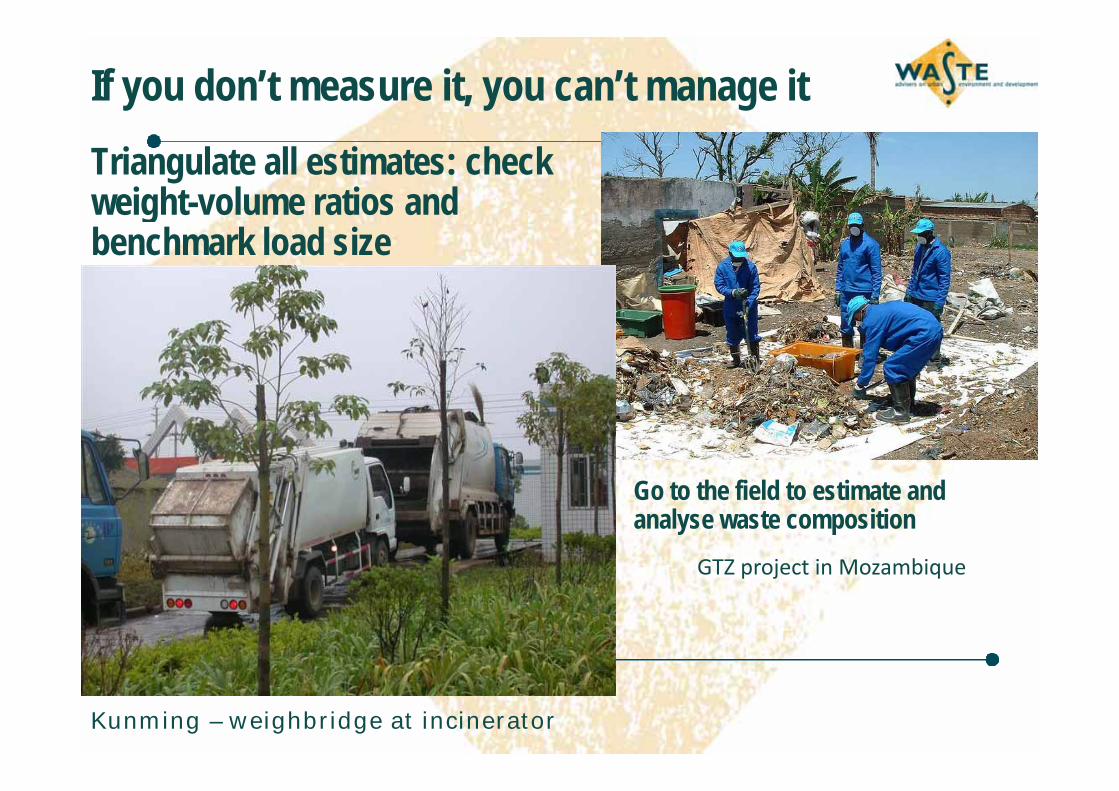
If you don’t measure it, you can’t manage itTriangulate all estimates: check weight-volume ratios and gbenchmark load size

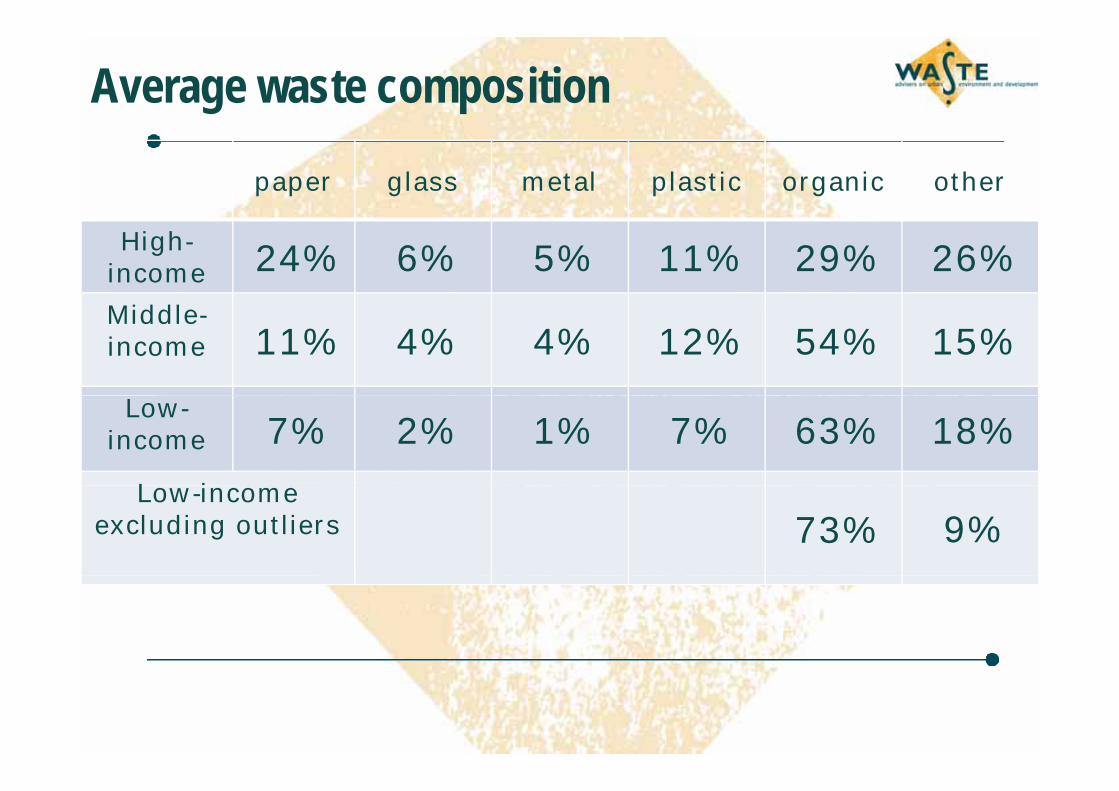
G t th fi ld t ti t d Go to the field to estimate and analyse waste composition

GTZ project in Mozambiquep j q

Kunming – weighbridge at incinerator

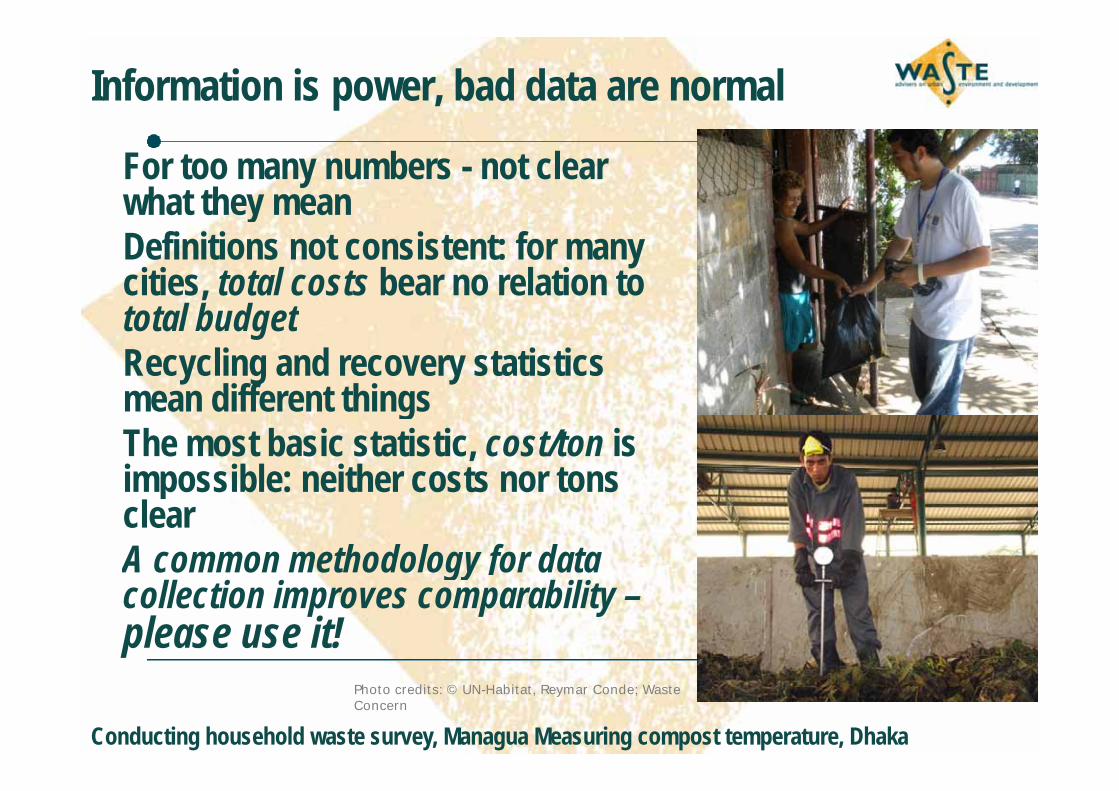
Information is power, bad data are normal

For too many numbers - not clear what they meanyDefinitions not consistent: for many cities, total costs bear no relation to t t l b d ttotal budgetRecycling and recovery statistics mean different thingsmean different thingsThe most basic statistic, cost/ton is impossible: neither costs nor tons impossible: neither costs nor tons clearA common methodology for data gycollection improves comparability –please use it!

Photo credits: © UN-Habitat, Reymar Conde; Waste Concern

Conducting household waste survey, Managua Measuring compost temperature, Dhaka

Key messagesKey messagesNo one size fits all – need a local solutionCommitment does more than money: several poor cities with good systemscities with good systemsBuilding on what you have worksIncluding informal activities in formal reporting would make cities look a lot betterwould make cities look a lot betterTechnical ambitions need to be modified to achieve affordability: a sanitary landfill is worth nothing if it pushes the cost to be recovered above 2% of phousehold income -- the city won’t use it

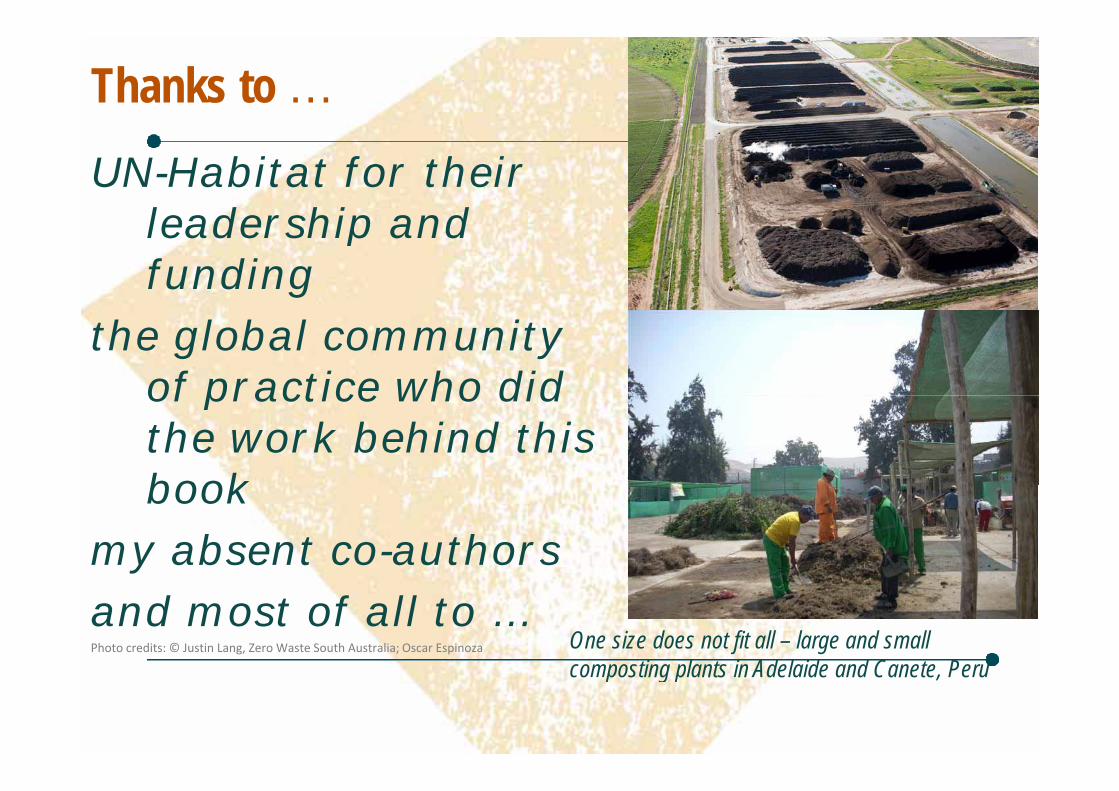
Thanks to …UN-Habitat for their

leadership and leadership and funding

the global community of practice who did of practice who did the work behind this book book

my absent co-authors

and most of all to …One size does not fit all – large and small composting plants in Adelaide and Canete Peru

Photo credits: © Justin Lang, Zero Waste South Australia; Oscar Espinoza

composting plants in Adelaide and Canete, Peru

… the millions of recycling & waste workers y garound the world, who are working hard -- outside of gformal structures

Clockwise from top left: Canete, Nepal, Delhi, Sousse, Cairo, Bengaluru, Dhaka, San Francisco, Rotterdam

Ph di i d © O E i Bh T l dh E i F bi V l d V d D id C Wil J Ij W C P i M Si R dPhoto credits in same order: © Oscar Espinoza; Bhusan Tuladhar; Enrico Fabian; Verele de Vreede; David C Wilson; Jeroen Ijgosse; Waste Concern; Portia M. Sinnott; Rotterdam

Thank you for your attention!i ?Questions or comments?

Please buy the book at ywww.earthscan.co.uk

using discount code EN1010using discount code EN1010


Recommended