PROGRESS REPORT Performance Period: Sept. 1, 2001 – Feb. 28, 2003 Validation of the AMSR-E Brightness Temperature and Soil Moisture Products with Coupled Hydrologic/Radiobrightness Modeling NASA Project UPN 291-07-75 Submitted to David Starr, EOS Validation Scientist EOS Project Science Office National Aeronautics and Space Administration March 1, 2003 In Support of NRA-00-OES-03 Validation Studies for Data Products from the Earth Observing System Aqua (PM) Platform and EOS-related Spectroscopic Studies Principal Investigator: Charles Laymon Universities Space Research Association Global Hydrology and Climate Center National Space Science and Technology Center 320 Sparkman Dr. Huntsville, AL 35805
Validation of the AMSR-E Brightness Temperature and Soil Moisture Products with Coupled Hydrologic/Radiobrightness Modeling
NASA Project UPN 291-07-75
Submitted to David Starr, EOS Validation Scientist EOS Project Science Office National Aeronautics and Space Administration March 1, 2003
In Support of NRA-00-OES-03 Validation Studies for Data Products from the Earth Observing System Aqua (PM) Platform and EOS-related Spectroscopic Studies
Principal Investigator: Charles Laymon Universities Space Research Association Global Hydrology and Climate Center National Space Science and Technology Center 320 Sparkman Dr. Huntsville, AL 35805
BACKGROUND
We proposed to utilize a coupled hydrologic/radiobrightness model (H/RM) to provide “best estimates” of footprint-scale mean volumetric soil moisture and TB at C and X bands with associated variance and confidence limits. This information provides quantitative validation of AMSR-derived soil moisture and C and X band TB. Modeling is being conducted at a high spatial and temporal resolution relative to AMSR observations to take advantage of the relative abundance of sampling data in conjunction with validation experiments. In so doing, we are evaluating a.) the errors associated with using limited GSM data or point-scale measurements of soil moisture from network stations to estimate footprint-scale mean soil moisture, b.) the errors associated with asynchronous sampling times, and c.) the relationship between surface moisture (~1 cm) and profile moisture. These analyses are necessary to characterize the accuracy of the AMSR data products at footprint scale. By applying the H/RM in simulation mode we will assess the limits of roughness/soil/vegetation parameter values beyond which AMSR soil moisture retrievals are not possible. Comparison between these simulations and AMSR-derived TB will identify areas where subpixel-scale heterogeneity warrants the use of effective parameter values or regions where AMSR C and X band soil moisture retrievals are not feasible.
APPROACH
Our approach is depicted in Figure 1. Our hydrologic model produces soil moisture and temperature profiles that are utilized by the radiative transfer model to estimate TB at C and X bands. Our research has shown that significant improvements in modeled soil moisture can be obtained by assimilating periodic soil moisture observations from other sources. We run the H/RM model by assimilating soil moisture data from the various networks of in situ automated instruments, soil moisture derived from GSM data, and TB derived from aircraft-based microwave instruments during the Soil Moisture Experiments in 2002 (SMEX’02). Because numerous uncertainties exist in defining the parameters and variables required for soil moisture modeling, model runs are being conducted using an ensemble of input data to derive the best estimate of the mean and variance of spatially-distributed profile soil moisture and TB at C and X bands. Input data from in situ networks, GSM, and aircraft are being assimilated to define the mean TB and soil moisture for each grid cell. The population of footprint-scale mean values for the ensemble defines the statistical dispersion about the footprint mean. The results of the ensemble runs will then be manipulated and interpreted in various ways to address the AMSR validation issues.
We aggregate the high-resolution model-derived C and X band TB to the AMSR footprint scale. The accuracy of the model-derived footprint-mean value is defined by the distribution of aggregated ensemble results. We also run the H/RM at the AMSR footprint scale using footprint mean parameters and variables. We use the ensemble approach here as well to define the dispersion about the mean value. The two model-derived TB data sets are compared with the AMSR-observed C and X band TB. Any significant discrepancies between the AMSR-observed TB and the H/RM-derived TB using footprint mean parameter values may suggest potential instrument calibration errors and/or errors in defining algorithm parameters and variables (i.e., surface roughness, vegetation water content, etc.). These errors are usually due to lack of accounting for spatial heterogeneity within the footprint, use of inaccurate remote sensing proxies for parameters and variables, scaling techniques, etc. Any significant discrepancies between the AMSR-observed TB and the aggregated H/RM-derived TB might indicate that nonlinear radiative transfer processes are affecting the observed value or that assumptions about the emitting depth or near-surface moisture and temperature gradients are invalid. These
discrepancies will be investigated using the high-resolution model-derived products including the information about surface heterogeneity derived during model tuning. In addition, these data may also lead to an understanding of vegetation thresholds, that is, vegetation density above which emission from the soil is significantly attenuated, and the use of “effective” parameters in areas where surface heterogeneity is characterized by large contrast in surface vegetation types.
Figure 1: Strategy for validating AMSR-E brightness temperatures and soil moisture using a hydrologic/ radiobrightness model and data assimilation.
RESULTS FROM THE PAST YEAR
We initially proposed that we would conduct our modeling activities in central Oklahoma. At the time of proposal writing, a validation experiment was anticipated for the summer of 2001 to be run concurrently in Oklahoma and Iowa. However, with delays in the launch of NASA’s Aqua satellite, this experiment was postponed. As plans for SMEX’02 began to unfold, only Iowa remained as a study site so we shifted our focus to central Iowa in anticipation of that experiment yielding a better validation data set with data acquisition from several aircraft sensors at various resolutions concurrent with acquisition from AMSR-E.
Participation in SMEX’02 All three investigators in this activity participated in the SMEX’02 field campaign in
central Iowa between June 25-July 12, 2002. Our efforts were concentrated in the Walnut Creek
watershed a few miles south of Ames, Iowa. We participated in the daily field sampling for gravimetric soil moisture and soil temperature. In addition, we contributed two unique data sets to the corporate archive. We collected 0-6 cm soil cores daily from two corn fields and two soybean fields. These cores were sliced at 1 cm intervals to provide high-resolution profiles of near-surface volumetric soil moisture. We also deployed one automated soil moisture and temperature profile monitoring station on each of the same four fields. These stations were installed one week before the experiment and sampled continuously throughout the duration. Two of the systems were left for an additional three weeks. These data were collected to support hydrologic modeling, data assimilation, and soil moisture remote sensing validation.
Figure 2: Schematic and photographs of soil moisture and temperature profile stations deployed during SMEX’02.
Modeling Activities During this period we refined our strategy for modeling near-surface soil moisture and
microwave brightness temperatures for validating the AMSR-E data products at the EASE Grid scale (Figure 1). Because the AMSR-E soil moisture products are not yet available, our preliminary validation has focused on brightness temperatures. Our modeling/validation domain was defined as six EASE Grid cells covering an area of 75 km x 50 km that coincide with the SMEX’02 experiment.
Soils, topography and vegetation data were prepared for the model domain. The vegetation classification derived from Landsat ETM data that was generated for SMEX’02 was unsuitable for modeling applications because a fixed-width road network was “burned” into the image data. Consequently, we developed our own classification using an image segmentation technique that permitted us to aggregate land cover features independent of the road network and small-scale heterogeneity that is present in pixel-based classification. The segmentation units (irregular polygons) from the vegetation classification were utilized to resample all model input data including rainfall. Subsequent modeling was not performed on a traditional grid, but rather on each segmentation unit thereby permitting each cell to be treated as homogeneous with respect to land cover characteristics.
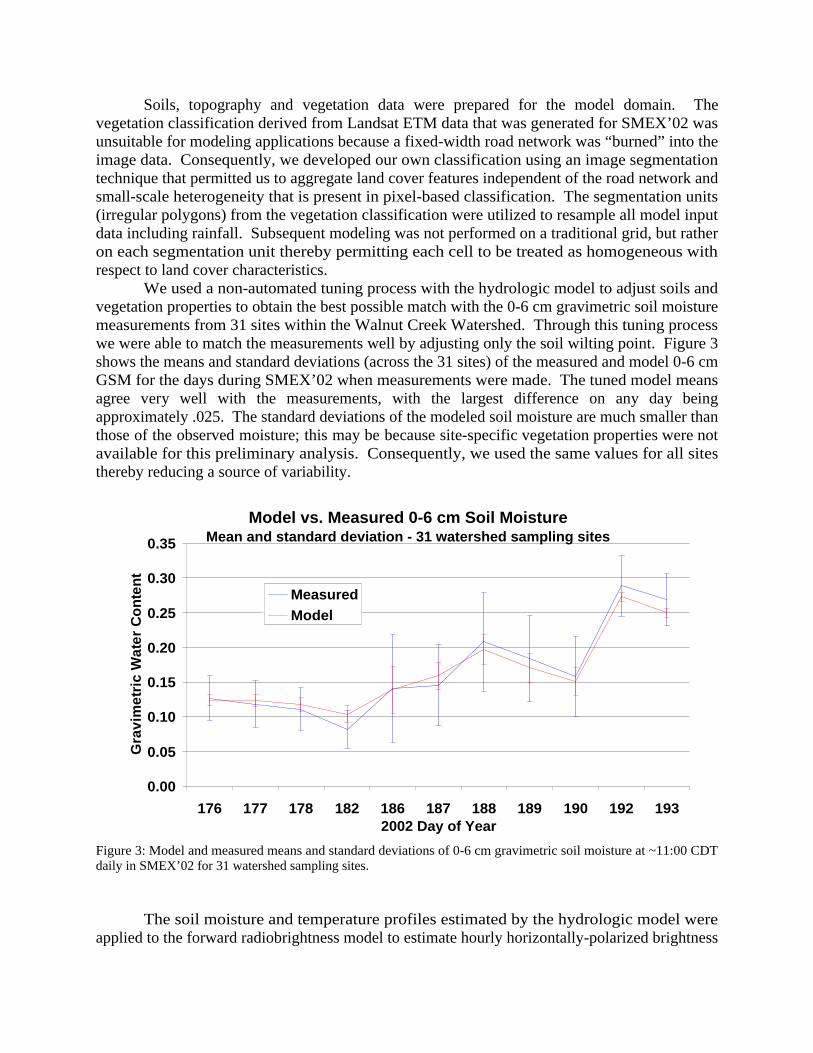
We used a non-automated tuning process with the hydrologic model to adjust soils and vegetation properties to obtain the best possible match with the 0-6 cm gravimetric soil moisture measurements from 31 sites within the Walnut Creek Watershed. Through this tuning process we were able to match the measurements well by adjusting only the soil wilting point. Figure 3 shows the means and standard deviations (across the 31 sites) of the measured and model 0-6 cm GSM for the days during SMEX’02 when measurements were made. The tuned model means agree very well with the measurements, with the largest difference on any day being approximately .025. The standard deviations of the modeled soil moisture are much smaller than those of the observed moisture; this may be because site-specific vegetation properties were not available for this preliminary analysis. Consequently, we used the same values for all sites thereby reducing a source of variability.
Model vs. Measured 0-6 cm Soil MoistureMean and standard deviation - 31 watershed sampling sites
0.00
0.05
0.10
0.15
0.20
0.25
0.30
0.35
176 177 178 182 186 187 188 189 190 192 1932002 Day of Year
Gra
vim
etri
c W
ater
Co
nte
nt
MeasuredModel
Figure 3: Model and measured means and standard deviations of 0-6 cm gravimetric soil moisture at ~11:00 CDT daily in SMEX’02 for 31 watershed sampling sites.
The soil moisture and temperature profiles estimated by the hydrologic model were applied to the forward radiobrightness model to estimate hourly horizontally-polarized brightness
temperatures at C-band (6.9 GHz). The resulting brightness temperatures were averaged over all model cells within each EASE Grid cell for comparison with AMSR-E TB measurements. We obtained the Level 2A version X1 AMSR-E TB data for the SMEX’02 period and extracted the data pertaining to the Iowa modeling domain. Figure 4 shows a comparison of model and AMSR TB averaged over the 6 EASE Grid cells for the 14 days when AMSR TB measurements were available. On average, AMSR-E TB values are much higher than model values on almost every day for the study area (and also for individual cells). The lower AMSR-E TB on day 180 is inconsistent with observed soil moisture conditions and is not yet understood. Also shown in these figures are model-derived mean surface temperatures. In some cases, AMSR-E TB values are essentially as high as the modeled surface temperature, implying microwave emissivities very close to 1.0 (assuming that the modeled surface temperatures are accurate). Since these data are for nighttime (~1:30 AM LST) overpasses, and surface temperatures at that time are typically very close to the air temperature, which is measured, it is unlikely that the model surface temperature estimates are in error by more than a few degrees. In any case, an upper bound for surface temperature at this time would be about 295 K, and the AMSR-E TB values are mostly above 280 K. This indicates that the re-calibrated AMSR-E TB values for this area are biased high. We will take a broader look at the AMSR-E data to examine the potential cause of this bias.
In addition to the systematic differences between model and AMSR-E TB measurements, there is an apparent lack of sensitivity in the latter. Significant rainfall occurred over part or all of the study area on days 184, 185, 187 and 191, as manifested in the model brightness temperature estimates. However, any response of the AMSR-E TB measurements to this rainfall is not evident.
Study Area Means
220
240
260
280
300
176 178 180 181 182 183 185 186 187 188 189 190 191 192 193 1942002 Day of Year
Kel
vin
s
SHEELS/RTM C-band TBAMSR C-band TBSHEELS surface temperature
Figure 4: Model and AMSR-E mean brightness temperatures over the study domain corresponding to times of the AMSR-E descending overpass (~1:30 AM LST). SHEELS surface temperature is also shown for comparison.
MEETINGS AND CONFERENCES ATTENDED
1. Soil Moisture Experiments in 2002 Planning Meeting, September 18-20, 2001, Ames, IA
2. AMSR-E Science Validation Team Meeting, August 8-9, 2002, Santa Rosa, CA
3. Soil Moisture Experiments in 2003 Planning Meeting, October 1-2, 2002, Huntsville, AL
4. Soil Moisture Experiments in 2002 Science Workshop, January 14-15, 2003, Columbia, MD
5. Symposium on Observing and Understanding the Variability of Water in Weather and Climate, 83rd Annual Meeting, American Meteorological Society, February 9-13, Long Beach, CA.
PRESENTATIONS
Laymon, C.A, F. Archer, W.L. Crosson and A. Limaye, 2003. Soil moisture measurements and modeling for validating AMSR-E soil moisture products. Symposium on Observing and Understanding the Variability of Water in Weather and Climate, 83nd Annual Meeting, American Meteorological Society, (February 9-13, Long Beach, CA), Amer. Meteor. Soc., Boston, MA, p. 170.
ISSUES/PROBLEMS/CHALLENGES
Delay in the launch of Aqua, delay in the availability of calibrated brightness temperatures and derived soil moisture products from AMSR-E, delay in the availability of vegetation data and regional-scale volumetric soil moisture data for SMEX’02 have resulted in delays in subsequent validation analyses. Dr. Wentz has graciously provided a “calibrated” Level 2a brightness temperature and SIPS is presently processing these for soil moisture. We expect that most of the ground truth data for SMEX’02 will be available by the end of March 2003, but availability of aircraft data from SMEX’02 is not expected until the middle of 2003.
Interactions with EOS investigators has been productive and uninhibited.
This document was created with Win2PDF available at http://www.daneprairie.com.The unregistered version of Win2PDF is for evaluation or non-commercial use only.