Spatio-Temporal Wildland Arson Crime Functions David T. Butry and Jeffrey P. Prestemon * Respectively, Economist and Research Forester, Southern Research Station of the USDA Forest Service, PO Box 12254, Research Triangle Park, NC 27709. David T. Butry is the corresponding author: e-mail [email protected], tel. 919-549-4037. Selected Paper prepared for presentation at the American Agricultural Economics Association Annual Meeting, Providence, Rhode Island, July 24-27, 2005. Abstract Wildland arson creates damages to structures and timber and affects the health and safety of people living in rural and wildland urban interface areas. We develop a model that incorporates temporal autocorrelations and spatial correlations in wildland arson ignitions in Florida. A Poisson autoregressive model of order p, or PAR(p) model, is estimated for six high arson Census tracts in the state for the period 1994-2001. Spatio-temporal lags of wildland arson ignitions are introduced as dummy variables indicating the presence of an ignition in previous days in surrounding Census tracts and counties. Temporal lags of ignition activity within the Census tract are shown to be statistically significant and larger than previously reported for non-spatial variants of the PAR(p) model. Spatio-temporal lagged relationships with current arson that are statistically significant show that arson activity up to a county away explains arson patterns, and spatio-temporal lags longer than two days were not significant. Other variables showing significance include weather and wildfire activity in the previous six years, but prescribed fire and several variables that provide evidence that such activity is consistent with an economic model of crime were less commonly significant. Keywords: Arson, Poisson, Spatial, Temporal, Crime, Wildfire JEL Codes: Q230, K490, C220, C250 Copyright Notice: This article was produced by employees of the United States Government and is in the public domain. 1
Transcript
Spatio-Temporal Wildland Arson Crime Functions
David T Butry and Jeffrey P Prestemon
Respectively Economist and Research Forester Southern Research Station of the
USDA Forest Service PO Box 12254 Research Triangle Park NC 27709 David T
Butry is the corresponding author e-mail dtbutryfsfedus tel 919-549-4037
Selected Paper prepared for presentation at the American Agricultural Economics
Association Annual Meeting Providence Rhode Island July 24-27 2005
Abstract
Wildland arson creates damages to structures and timber and affects the health and safety of people living in rural and wildland urban interface areas We develop a model that incorporates temporal autocorrelations and spatial correlations in wildland arson ignitions in Florida A Poisson autoregressive model of order p or PAR(p) model is estimated for six high arson Census tracts in the state for the period 1994-2001 Spatio-temporal lags of wildland arson ignitions are introduced as dummy variables indicating the presence of an ignition in previous days in surrounding Census tracts and counties Temporal lags of ignition activity within the Census tract are shown to be statistically significant and larger than previously reported for non-spatial variants of the PAR(p) model Spatio-temporal lagged relationships with current arson that are statistically significant show that arson activity up to a county away explains arson patterns and spatio-temporal lags longer than two days were not significant Other variables showing significance include weather and wildfire activity in the previous six years but prescribed fire and several variables that provide evidence that such activity is consistent with an economic model of crime were less commonly significant Keywords Arson Poisson Spatial Temporal Crime Wildfire
JEL Codes Q230 K490 C220 C250
Copyright Notice This article was produced by employees of the United States
Government and is in the public domain
1
Introduction
Wildland arson creates damages to structures and timber and affects the health and safety
of people living in rural and wildland urban interface areas Wildland arson is the single
leading cause of wildfire on private lands in several heavily populated states including
California and Florida Wildland managers and law enforcement agencies seek to predict
wildland arson occurrence and they could benefit from new information that enables
more effective strategies and tactics for reducing risks and damages from such firesetting
Published time series event models of wildland arson have been static and nonspatial
relating ignition events to weather seasonal trends and law enforcement These models
therefore have ignored the role of some socioeconomic variables that can predict crime
Additionally if a time series process is autoregressive and spatial then such static non-
spatial models could produce biased and inconsistent parameter estimates or their
estimators may be inefficient
The objective of this research is to more completely explain the spatio-temporal
nature of wildland arson ignitions in the context of an economic model of property
crime To do this we outline a Poisson autoregressive model of order p as first described
by Brandt and Williams Different from previous research on wildland arson (Prestemon
and Butry) the model includes information on recent and spatially distant wildland arson
ignitions Also unique is the spatial resolution with observations deriving from ignitions
in individual Census tracts Because wildland arson is an infrequent activity in order to
identify parameters of the extended PAR(p) model of wildland arson we limit our
analysis to six Census tracts in Florida where arson has been historically highest Our
model is similar to work by Prestemon and Butry relating criminal activity to variables
2
associated with opportunity costs of crime these include economic measures as well as
measures associated with likely high arson success (weather fuels) and free time
(holidays and weekends)
Methods
Theoretical Development
Wildland arson has been the cause of major wildfire disasters in recent history In 2002
the Hayman Fire which burned southwest of Denver burned 138000 acres and created
costs and losses totaling well over $100 million (Kent et al) Other recent fires include
part of the Rodeo-Chediski fire in Arizona in 2002 which burned nearly a half-million
acres Similarly damaging arson events occurred in the Black Hills of South Dakota in
2000 Butry Pye and Prestemon described how arson wildfire in Florida more commonly
occurred near built-up areas of the state hinting that the potential damages from these
fires are higher than they are for other principal ignition sources (eg lightning)
In spite of these damages research that has sought to explain or predict wildland
arson is limited to only a few studies (eg Donohue and Main Prestemon and Butry) In
a technical advance in the area of wildland arson prediction Prestemon and Butry found
that in Florida significant autocorrelation of wildland arson ignitions exist lasting up to
eleven days Missing from all analyses however has been specific attention to using
recent crime information in nearby locations to explain arson events Such research has
been done to help explain urban crime patterns (eg Bowers and Johnson Corcoran
Wilson and Ware Deadman) indicating its potential for wildland arson prediction In
fact crime prediction using spatial and temporal data is a relatively new topic in
3
criminology (Gorr and Harries Gorr Olligschlaeger and Thompson) enabled by better
data gathering processing and statistical modeling techniques (eg Liu and Brown
Ratcliffe and McCullagh)
The spatio-temporal modeling of crime adds to a larger literature that has sought
to understand some of the underlying causes of crime That research has sought to link
economic conditions and law enforcement with criminal activity many in the context of
an economic model of crime (Becker) Studies include those by Arthur Brotman and
Fox Hannon Hershbarger and Miller and Neustrom and Norton examining povertyrsquos
link Burdett Lagos and Wright and Gould Weinberg and Mustard linking crime to
working conditions and Corman and Mocan and Di Tella and Schargrodsky and Marvell
and Moody who have examined the effectiveness of law enforcement at reducing crime
incidences
Statistical Approach to Wildland Arson Modeling
Following Prestemon and Butryrsquos approach to modeling an autoregressive crime
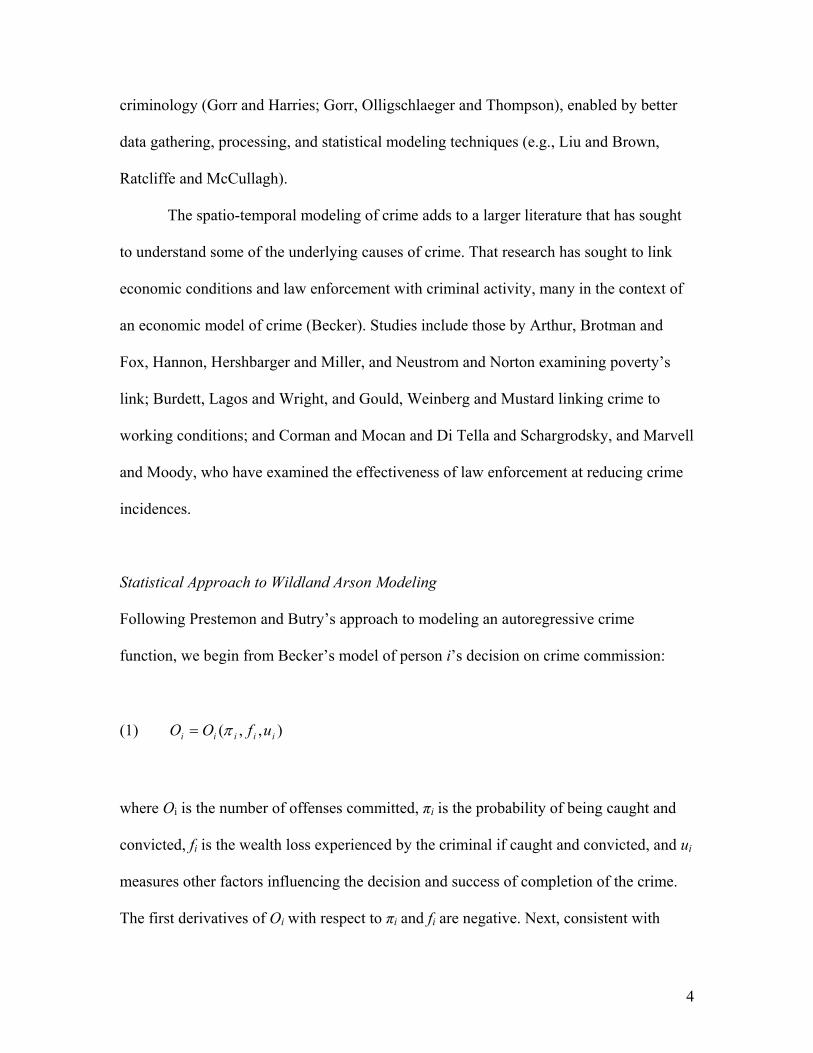
function we begin from Beckerrsquos model of person irsquos decision on crime commission
(1) )( iiiii ufOO π=
where Oi is the number of offenses committed πi is the probability of being caught and
convicted fi is the wealth loss experienced by the criminal if caught and convicted and ui
measures other factors influencing the decision and success of completion of the crime
The first derivatives of Oi with respect to πi and fi are negative Next consistent with
4
Becker we describe the arsonistrsquos psychic and income benefits from illegal firesetting as
gi and the production cost for the firesetting as ci1 The loss from being caught and
convicted of the crime is a positive function of income while employed
where w
)( iiii Wwff =
i are wages (Burdett Lagos and Wright Gould Weinberg and Mustard) and Wi
is the employment status The prospective arsonistrsquos expected utility from successfully2
starting a wildland arson fire may be expressed as (Becker)
Hershbarger RA and RK Miller ldquoThe Impact of Economic Conditions on the
Incidence of Arsonrdquo Journal of Risk Insurance 45(1978)275-90
Jacob BA and L Lefgren ldquoAre Idle Hands the Devilrsquos Workshop Incapacitation
Concentration and Juvenile Crimerdquo American Economic Review 93(2003)1560-77
Keetch JJ and GM Byram A Drought Index for Forest Fire Control Asheville NC
Southeast Forest Experiment Station Research Paper SE-38 1968
Kent B K Gebert S McCaffrey W Martin D Calkin E Schuster I Martin HW
Bender G Alward Y Kumagai PJ Cohn M Carroll D Williams and C Ekarius
ldquoSocial and Economic Issues of the Hayman Firerdquo Hayman Fire Case Study USDA
Forest Service General Technical Report RMRS-GTR-114 (Revision) RT Graham ed
p 315-95 Fort Collins CO USDA Forest Service 2003
17
Liu H and DE Brown ldquoCriminal Incident Prediction Using a Point-Pattern-Based
Density Modelrdquo International Journal of Forecasting 19(2003)603ndash22
Marvell T and C Moody ldquoSpecification Problems Police Levels and Crime Ratesrdquo
Criminology 34(1996)609-46
Neustrom MW and WM Norton ldquoEconomic Dislocation and Property Crimerdquo
Journal of Criminal Justice 23(1995)29-39
Prestemon JP and DT Butry ldquoTime to Burn Modeling Wildland Arson as an
Autoregressive Crime Functionrdquo American Journal of Agricultural Economics
(forthcoming)
Prestemon JP JM Pye DT Butry TP Holmes and DE Mercer ldquoUnderstanding
Broad Scale Wildfire Risks in a Human-Dominated Landscaperdquo Forest Science
48(2002)685-93
Prestemon JP DN Wear TP Holmes and F Stewart ldquoWildfire Timber Salvage and
the Economics of Expediencyrdquo Forest Policy and Economics (forthcoming)
Ratcliffe JH MJ McCullagh ldquoHotbeds of Crime and the Search for Spatial
Accuracyrdquo Journal of Geographic Systems (1999)385-98
18
United States Department of Commerce Census Bureau ldquoSmall Area Income and
Poverty Estimates State and County Estimatesrdquo Available at
lthttpwwwCensusgovhheswwwsaipeestimatetochtmlgt Accessed by authors on
September 3 2002
United States Department of Labor ldquoLocal Area Unemployment Statisticsrdquo Available at
lthttpwwwblsgovgt Accessed by authors on October 31 2002
United States Department of Labor ldquoQuarterly Census of Employment and Wages
Retail Traderdquo Available at lthttpwwwblsgovgt Accessed by authors on July 12
2004
Vega Garcia C PM Woodard SJ Titus WL Adamowicz and BS Lee ldquoA Logit
Model for Predicting the Daily Occurrence of Human Caused Forest Firesrdquo International
Journal of Wildland Fire 5(1995)101-11
19
Table 1 Summary statistics
Santa Rosa
County Census Tract 101
Sarasota County Census Tract 2712
Dixie County Census Tract 9802
Charlotte County Census Tract 204
Volusia County Census Tract 83204
Taylor County Census Tract 9504
Arson IgnitionsDay Mean 011 009 006 004 004 003 Maximum 8 5 10 4 14 7 Minimum 0 0 0 0 0 0 Standard Deviation 051 039 044 026 034 026 Census Tract Neighborhood 1 Day Lag Dummy Mean 005 007 005 010 005 008 Maximum 1 1 1 1 1 1 Minimum 000 0 0 0 0 0 Standard Deviation 021 025 021 030 022 027 County Neighborhood 1 Day Lag Dummy Mean 030 027 022 031 049 021 Maximum 1 1 1 1 1 1 Minimum 0 0 0 0 0 0 Standard Deviation 033 032 030 037 045 030 KBDI Mean 212 434 324 432 293 320 Maximum 681 783 749 783 694 749 Minimum 0 4 0 4 1 0 Standard Deviation 180 194 211 194 181 211 Unemployment Rate () Mean 389 280 678 385 405 878 Maximum 570 470 1090 590 688 1412 Minimum 281 160 390 240 270 570 Standard Deviation 049 070 149 089 103 180 State-Level Wage Rate ($year) Mean 16871 16836 16832 16844 16831 16819 Maximum 17803 17727 17689 17727 17727 17689 Minimum 16146 16146 16146 16146 16146 16146 Standard Deviation 582 563 552 562 564 553 Poverty Rate () Mean 1096 847 2329 946 1332 2008 Maximum 1249 970 2576 1020 1524 2200 Minimum 730 730 2000 860 1110 1780 Standard Deviation 143 072 193 039 145 159
20
Table 1 Continued Police Officers (County Full-time Equivalent) Mean 642 194 15 203 1022 33 Maximum 730 234 17 214 1135 34 Minimum 554 162 12 177 921 31 Standard Deviation 53 19 1 11 64 1 Population of the Census Tract Mean 3365 5433 3605 4725 14959 4826 Maximum 3812 7701 3705 5409 17621 5558 Minimum 2994 3264 3510 4068 12448 4149 Standard Deviation 232 1357 57 409 1590 421 Wildfire Lag 0-2 years (Acres) Mean 3338 1478 875 1653 19400 809 Maximum 6380 3625 2448 2653 43892 1303 Minimum 808 562 338 719 1692 541 Standard Deviation 1952 686 425 466 19300 143 Wildfire Lag 3-5 years (Acres) Mean 2157 1460 722 1219 5279 1574 Maximum 4888 3607 1099 2358 43640 5949 Minimum 808 562 338 332 2266 541 Standard Deviation 985 978 160 539 6150 1832 Prescribed Fire 0 years (Acres) Mean 59482 1651 9046 95 2831 2574 Maximum 118484 8250 25185 450 6825 10226 Minimum 11805 0 0 0 209 0 Standard Deviation 20282 2526 7777 161 1669 2625 Prescribed Fire Lag 1 year (Acres) Mean 62838 1685 10643 84 3183 2414 Maximum 118484 8250 25196 450 6915 10433 Minimum 11805 0 485 0 729 151 Standard Deviation 23444 2516 7087 160 1600 2634 Observations 2909 2771 2642 2763 2792 2694
21
Table 2 Poisson Autoregressive Models of Maximum Order Estimable Six Study Areas in Florida Daily Counts of Wildland
Arson Ignitions 1994-2001 (Standard Errors in Parentheses)
Model Locations Variables Charlotte Dixie Santa Rosa Sarasota Taylor VolusiaConstant 4341 -6455 -1687 4434 -6444 043 (3299) (5793) (1129) (3393) (3259) (1576) KBDI
(004) Unemployment Rate x Census Tract Population 004 (009) State-wide Retail Wage x Census Tract Population -028
(026)
25
Table 3 Continued Police 444
(579) Wildfire Area Years 0 to -2 x Census Tract Population -00064
-00073 Wildfire Area Years -3 to -5 x Census Tract Population -011
(010) Haz Red PB Years 0 to -1 x Census Tract Population 0033
(0011) Haz Red PB Years -1 to -2 x Census Tract Population -0010
(0010) p1 021
(003) p2 0086
(0024) p3 011
(003) p4 0072
(0022) p5 011
(003) p6 0074
(0023) p7 0067
(0023) p8 0052
(0021) p9 0069
(0022) p10 0066
(0023) p11 0024
(0019) Number of Observations 16571 LL PAR(p) -3245 LL PAR(p) All Neighbors=0 -3279 LL Null Model -4194
Asterisks correspond to the significance level of the parameter estimates for 1
for 5
26
Figure 1 The locations of the six individual Census tracts in Florida
27
Figure 2 A close-up of the arson activity (1994-2001) by Census tract in
Duval St Johns Flagler and Volusia County
28
Wildland arson has been the cause of major wildfire disaster
The likelihood equation associated this model is (suppressin
(6)
Table 2 Poisson Autoregressive Models of Maximum Order Estimable Six Study Areas in Florida Daily Counts of Wildland
Arson Ignitions 1994-2001 (Standard Errors in Parentheses)
Model Locations Variables Charlotte Dixie Santa Rosa Sarasota Taylor VolusiaConstant 4341 -6455 -1687 4434 -6444 043 (3299) (5793) (1129) (3393) (3259) (1576) KBDI