International Conference on Emerging Trends in Technology, Science and Upcoming Research in Computer Science DAVIM, Faridabad, 25 th April, 2015 ISBN: 978-81-931039-3-7 146 | Page UTILIZATION OF NON-CONVENTION ENERGY SOURCE TO FULFILL OUR REQUIREMENT OF POWER DEMAND AND REDUCE POLLUTION Prakash Kumar Sen 1 , Dev Kumar Khande 2 , Shailendra Kumar Bohidar 3 1 Student, M.Tech. Manufacturing Management, BITS Pilani 2 Student, Mechanical Engineering, Kirodimal Institute of Technology, Raigarh, (India) 3 Ph.D. Research Scholar, Kalinga University, Raipur ABSTRACT There are many natural sources to develop electricity without depends on any sources of non - renewable energy and without environmental pollution. Even though the power generated is less but the benefits gained from this energy is the ability to raise the standard living of residents in remote areas and it does not emit any pollution gas which is able to give an unacceptable effect in the local environment, get free from pollution and helps to maintain good health. Non-convention energy source is able to support the mission of protecting the environment particularly to the ecosystem. It is helpful to reduce the greenhouse effect also. The primary source of energy is fissile fuel, however these fissile fuel sources are finite also with their fastly widespread use degradation of environment takes place, which causes global warming, urban air pollution and acid rain, It strongly suggest that the time is now come to harness and use the non-conventional and environment friendly energy sources is vital for steering the global energy supplies towards sustainable path. This paper presents a use of non-conventional energy sources such as solar power, wind power, hydro power, bio mass and biogas for the fulfillment of power demand to some extent and gives remedial measures during extreme emergencies of electrical power. Keywords: Non-Conventional and Conventional Energy Source, Solar Power, Hydro Power, Biomass and Biogas, Tidal Energy I. INTRODUCTION Energy is most important input for social and economic development of any country. The demand for energy has been increased for agricultural, industrial and domestic activities. Energy is the primary and most universal measure of all kinds of works by human being s and human and nature. Everything what happens in the world in the expression of flow of energy in one of its forms. Every country draws its energy needs forms a variety of sources. We can broadly categorize this as conventional and non-conventional. this conventional source include the fossil fuels (coal, oil and natural gas),hydroelectric power and nuclear power, while the nonconventional sources such as sunlight, wind, rain, tides, and geothermal heat, which are renewable.[1]energy security has an important bearing on achieving national economic development goals and improving the quality of life of the people. India‘s dependence on crude oil will continue for most part of the 21st century. In addition, global warming, caused largely by greenhouse gas emissions from fossil fuel energy generating systems, is also a major concern energy which comes from natural resources. Despite the obvious advantages of renewable energy, it presents important drawbacks, such as the discontinuity of generation, as most renewable energy
Transcript
International Conference on Emerging Trends in Technology, Science and Upcoming Research in Computer Science
DAVIM, Faridabad, 25th April, 2015 ISBN: 978-81-931039-3-7
146 | P a g e
UTILIZATION OF NON-CONVENTION ENERGY
SOURCE TO FULFILL OUR REQUIREMENT OF
POWER DEMAND AND REDUCE POLLUTION Prakash Kumar Sen1, Dev Kumar Khande2, Shailendra Kumar Bohidar3
1Student, M.Tech. Manufacturing Management, BITS Pilani 2Student, Mechanical Engineering, Kirodimal Institute of Technology, Raigarh, (India)
3Ph.D. Research Scholar, Kalinga University, Raipur
ABSTRACT There are many natural sources to develop electricity without depends on any sources of non - renewable
energy and without environmental pollution. Even though the power generated is less but the benefits gained
from this energy is the ability to raise the standard living of residents in remote areas and it does not emit any
pollution gas which is able to give an unacceptable effect in the local environment, get free from pollution and
helps to maintain good health. Non-convention energy source is able to support the mission of protecting the
environment particularly to the ecosystem. It is helpful to reduce the greenhouse effect also. The primary source
of energy is fissile fuel, however these fissile fuel sources are finite also with their fastly widespread use
degradation of environment takes place, which causes global warming, urban air pollution and acid rain, It
strongly suggest that the time is now come to harness and use the non-conventional and environment friendly
energy sources is vital for steering the global energy supplies towards sustainable path. This paper presents a
use of non-conventional energy sources such as solar power, wind power, hydro power, bio mass and biogas for
the fulfillment of power demand to some extent and gives remedial measures during extreme emergencies of
electrical power.
Keywords: Non-Conventional and Conventional Energy Source, Solar Power, Hydro Power,
Biomass and Biogas, Tidal Energy
I. INTRODUCTION
Energy is most important input for social and economic development of any country. The demand for energy
has been increased for agricultural, industrial and domestic activities. Energy is the primary and most universal
measure of all kinds of works by human being s and human and nature. Everything what happens in the world in
the expression of flow of energy in one of its forms. Every country draws its energy needs forms a variety of
sources. We can broadly categorize this as conventional and non-conventional. this conventional source include
the fossil fuels (coal, oil and natural gas),hydroelectric power and nuclear power, while the nonconventional
sources such as sunlight, wind, rain, tides, and geothermal heat, which are renewable.[1]energy security has an
important bearing on achieving national economic development goals and improving the quality of life of the
people. India‘s dependence on crude oil will continue for most part of the 21st century. In addition, global
warming, caused largely by greenhouse gas emissions from fossil fuel energy generating systems, is also a
major concern energy which comes from natural resources. Despite the obvious advantages of renewable
energy, it presents important drawbacks, such as the discontinuity of generation, as most renewable energy
International Conference on Emerging Trends in Technology, Science and Upcoming Research in Computer Science
DAVIM, Faridabad, 25th April, 2015 ISBN: 978-81-931039-3-7
147 | P a g e
resources depend on the climate, which is why their use requires complex design, planning and control
optimization methods. Overall the increasing consumption of conventional fuels coupled with environmental
pollution has led to the development of eco-friendly non-conventional energy sources [2]. The development of
remote rural areas could not take place even after more than 50 years independence, as the grid could not be
extended due to its high cost, scattered nature of the area and low load factor. In recent years, the considerable
research and development has been initiated to energize such areas through renewable energy sources, the
energy needs using energy resources in individualistic manner, the demand can be best met using combination
of the resources in integrative manner in cost effective and sustainable manner.
II. NON-CONVENTIONAL AND CONVENTIONAL ENERGY SOURCE
In the world there are two type of energy source which is conventional or non-conventional. The conventional
sources of energy are generally non-renewable sources of energy, which are being used since a long time. These
sources of energy are being used extensively in such a way that their known reserves have been depleted to a
great extent. the conventional are fossil fuels ,coal, petrol, diesel, oil, gas, uranium etc. which is limited and the
daily use of this fuel in industries and automobile causes the environmental pollution. The fossil fuels are not
going to last longer and that remaining reserves should be conserved for the petro-chemical industry. But
unfortunately, both nuclear and coal energy pose serious environmental problems. The combustion of coal may
upset the planet’s heat balance. The production of carbon dioxide and sulphur dioxide may adversely affect the
ability of the planet to produce food for its people. Coal is also a valuable petro-chemical and from long term
point of view it is undesirable to burn coal for generation of electricity. The major difficulty with nuclear energy
is waste disposal and accidental leakage [3]. There for we need to reserve them and find the best way utilization
of non-conventional energy source. The contemporary non-conventional sources of energy like wind, tidal, solar
etc. The non-conventional sources are available free of cost, are pollution-free and inexhaustible. Man has used
these sources for many centuries in propelling ships, driving windmills for grinding corn and pumping water,
etc. Because of the poor technologies then existing, the cost of harnessing energy from these sources was quite
high. Also because of uncertainty of period of availability and the difficulty of transporting this form of energy,
to the place of its use are some of the factors which came in the way of its adoption or development. The use of
fossil fuels and nuclear energy replaced totally the non-conventional methods because of inherent advantages of
transportation and certainty of availability; however these have polluted the atmosphere toe great extent. In fact,
it is feared that nuclear energy may prove to be quite hazardous in case it is not properly controlled. it was
decided by almost all the countries to develop and harness the non-conventional sources of energy, even though
they are relatively costlier as compared to fossil-fuel sources. It is hoped that with advancement in technology
and more research in the field of development of non-conventional sources of energy, these sources may prove
to be cost-effective as well. The future of wind, solar, tidal and other energy sources is bright and these will play
an important role in the world energy scenario [4]
III. SOURCE OF NON-CONVENTIONAL ENERGY
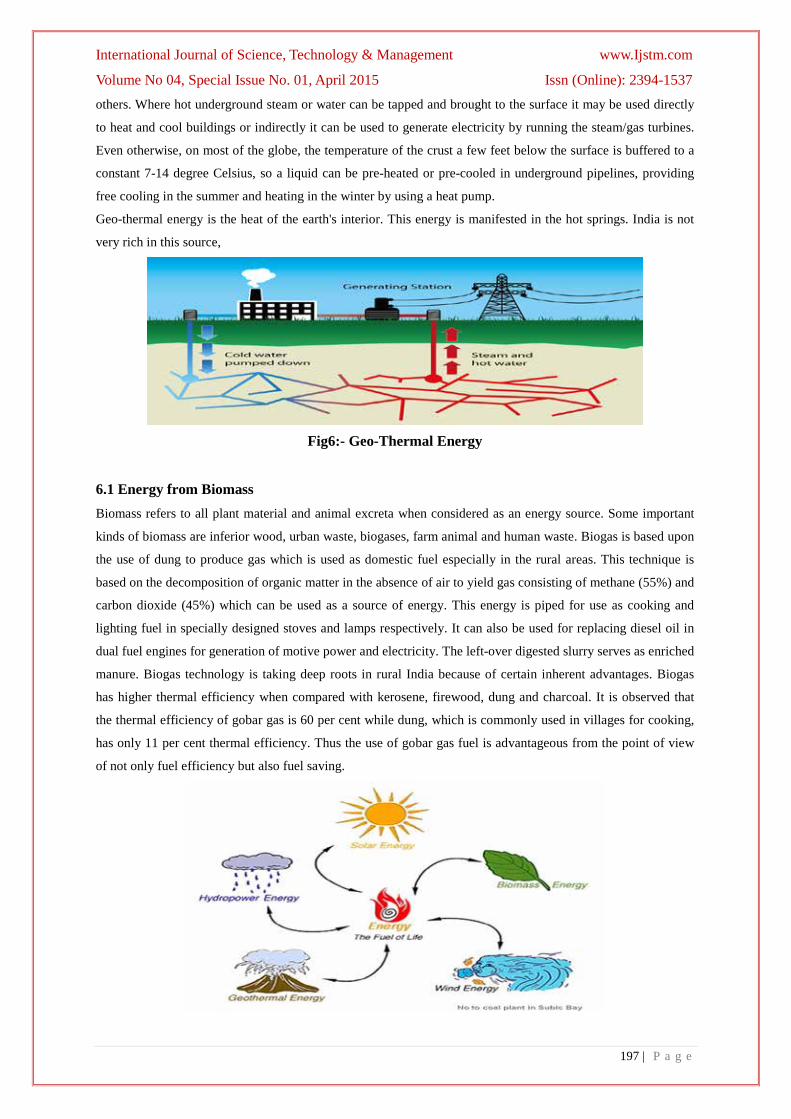
3.1 Solar Energy Solar energy has the greatest potential of all the sources of renewable energy and if only a small amount of this
form of energy could be used, it will be one of the most important supplies of energy especially when other
sources in the country have depleted.
International Conference on Emerging Trends in Technology, Science and Upcoming Research in Computer Science
DAVIM, Faridabad, 25th April, 2015 ISBN: 978-81-931039-3-7
148 | P a g e
Energy comes to earth from the sun. This energy keeps the temperature of the earth above that in colder space,
causes the water cycle and generates photosynthesis in plant. The solar power where sun hits atmosphere is 1017
watts whereas the solar power on earth surface is 1016watts.the total the total world-wide power demand of all
needs of civilization is1013 watts. Therefore, the sun gives us 1000 time more power than we need, if we can use
5%of this energy, it will be 50 times what the world will require.1 kW/m2, attempts have been made to make use
of this energy in raising steam which may be used in driving the prime movers for the or pose of generation of
electrical. Utilization Of solar energy is of great importance to India since it lies in a temperature climate of
region of the world where sun light is abundant for major part of year.
Application of solar energy:
3.1.1 Solar Cooker
The solar cooker is one of the important applications of the solar energy. In village 95% of people use the fossil
fuel, wood, cow dung etc. therefore the solar cooker is another option for cooking food in village or urban areas.
It not produces any kind of pollution content like smoke. It save money and fuel preserves the nutritional valve
of the food. It has got limitation or taking more time to cook but an ideal appliance for rural and rural population
who can keep the food in this cooker while working in the field and take food during lunch time.
3.1.2 Solar Distillation
Solar stills are systems designed to filter or purify water. The numbers of systemsdesigned to filter water have
increased dramatically in recent years. As water supplies have increased in salinity, have been contaminated, or
have experienced periods of contamination, people have lost trust in their drinking water supply. Water filtration
systems can be as simple as a filter for taste and odor to complex systems to remove impurities and toxins. Solar
water distillation is one of the simplest and most effective methods of purifying water. Solar water distillation
replicates the way nature purifies water. The sun's energy heats water to the point of evaporation. As the water
evaporates, purified water vapor rises, condensing on the glass surface for collection [5]. This process removes
impurities such as salts and heavy metals, as well as destroying microbiological organisms. The end result is
water cleaner than the purest rainwater. Solar energy is allowed into the collector to heat the water. The water
evaporates only to condense on the underside of the glass. When water evaporates, only the water vapor rises,
leaving contaminants behind. The gentle slope of the glass directs the condensate to a collection trough, which
in turn delivers the water to the collection bottle.
3.1.3 Solar Dryers
Using the sun to dry crops and grain is one of the oldest and most widely used applications of solar energy. The
simplest and least expensive technique is to allow crops to dry naturally in the field, or to spread grain and fruit
out in the sun after harvesting. The disadvantage of these methods is that the crops and grain are subject to
damage by birds, rodents, wind, and rain, and contamination by windblown dust and dirt. More sophisticated
solar dryers protect grain and fruit, reduce losses, dry faster and more uniformly, and produce a better quality
product than open air methods[6].The basic components of a solar dryer are an enclosure or shed, screened
drying trays or racks, and a solar collector. In hot, arid climates the collector may not even be necessary. The
southern side of the enclosure itself can be glazed to allow sunlight to dry the material. The collector can be as
simple as a glazed box with a dark colored interior to absorb the solar energy that heats air. The air heated in the
solar collector moves, either by natural convection or forced by a fan, up through the material being dried. The
size of the collector and rate of airflow depends on the amount of material being dried, the moisture content of
International Conference on Emerging Trends in Technology, Science and Upcoming Research in Computer Science
DAVIM, Faridabad, 25th April, 2015 ISBN: 978-81-931039-3-7
149 | P a g e
the material, the humidity in the air, and the average amount of solar radiation available during the drying
season [7]
3.1.4 Solar Cooling
Solar cooling consists of using thermal energy collected from the sun as the principal energy input for the
cooling system to cool and dehumidify the space [8]. This replaces the existing electrical power input typically
required in a vapor compression refrigeration cycle. The benefit of this system is that it has the potential to
reduce the amount of electricity used (and carbon dioxide produced from the generation of electricity) during
Canada’s hot summer months when the demand on the power grid is at its highest. These systems can be
effective as the availability of solar radiation coincides with the energy demands imposed on buildings by
cooling loads, allowing for the greatest amount of cooling to be generated when it is needed most.
3.1.5 Solar Collector
A solar collector is a device for collecting solar radiation and transfers the energy to a fluid passing in contact
with it. Utilization of solar energy requires solar collectors. These are general of two types first one is non-
concentrating or flat plate type solar collector and second on is concentrating type solar collector. the solar
energy collector, with its associated absorber, is essential component of any system for the conversion of solar
radiation energy into more usable from heat or electricity. In the non-concentration type, the collector area is the
same as the absorber area. On the other hand, in concentrating co collectors the area intercepting the solar
radiation is greater, sometimes hundreds of times greater than absorber area. By means of concentrating
collectors, much higher temperatures can obtained then with non-concentrating type. Concentrating collector
may be used to medium pressure steam. They use many different arrangements of mirrors and lenses to
concentrate the sun’s ray on the boiler. This type shows better efficiency than the flat plate collector.
3.1.6 Solar Thermal
Solar Thermal power is heat energy obtained by exposing a collecting device to the rays of the sun. A solar
thermal system makes use of the warmth absorbed by the collector to heat water or another working fluid, or to
make steam. Hot water is used in homes or commercial buildings and for industrial processes. Steam is used for
process heat or for operating a turbine generator to produce electricity or industrial power. There are several
basic kinds of solar thermal power systems including “flat plate “solar water heaters; concentrating collectors,
such as central tower receivers; and parabolic trough and dish collectors [9].
3.1.7 Photovoltaic
Photovoltaic are solar cells that produce electricity directly from sunlight. The solar cells are made of thin layers
of material, usually silicon. The layers, after treatment with special compounds, have either too many or too few
electrons. When light strikes a sandwich of the different layers, electrons start flowing and an electric current
result [10].Photovoltaic are used throughout the nation and elsewhere to operate appliances, provide lighting,
and to power navigation and communication aids. Photovoltaic panels provide power for equipment in space
ships and satellites. PV cells supply power needed to operate many kinds of consumer products such as
calculators and watches. Photovoltaic systems provide electricity to remote villages, residences, medical centers,
and other isolated sites where the cost of photovoltaic equipment is less than the expense of extending utility
power lines or using diesel-generated electricity [11].
3.2 Hydro Power Hydropower is a renewable, non-polluting and environmentally benign source of energy. Hydropower is based
on simple concepts. Moving water turns a turbine, the turbine spins a generator, and electricity is produced. The
International Conference on Emerging Trends in Technology, Science and Upcoming Research in Computer Science
DAVIM, Faridabad, 25th April, 2015 ISBN: 978-81-931039-3-7
150 | P a g e
use of water falling through a height has been utilized as a source of energy since a long time. It is perhaps the
oldest renewable energy technique known to the mankind for mechanical energy conversion as well as
electricity generation. The first hydro power plant was of 130 kW set up in Darjeeling during 1897,which
marked the development of hydropower in the country. Similarly, by 1924 Switzerland had nearly 7000 small
scale hydropower stations in use. Most of the small hydro power plants are run of river scheme, implying that
they do not have any water storage capability. The power is generated only when enough water is available from
the river. When the stream flow reduces below the design flow value, the generation will reduce as the water
does not flow through the intake structure into the turbine Small hydro plants may be standalone system in
isolated areas but could also be grid connected. The connection to the grid has the advantage of the easier
control of the electrical system frequency of the electricity, but the disadvantage of being tripped off the system
due to problems outside of the plant operator’s control. Power generation from the water depends upon the
combination of head and flow. Both must available to produce electricity. Water is diverted from a stream into
a pipeline (penstock) where it is directed downhill and through the turbine. The vertical drop creates pressure at
the bottom end of the pipeline. The pressurized water from the end of the pipe creates the force that drives the
turbine. The turbine in turn drives the generator where electrical power is produced. More flow or more head
produces more electricity. Electrical power output will always be slighter less than water power input due to
turbine and system inefficiencies. Head can be expressed as vertical distance or as pressure such as pounds per
square inch (psi)[12]. Net head is the pressure available at the turbine when water is flowing which will always
be less than the pressure when water flow is turned off, due to the friction between water and pipe. it is used for
power generation
Fig.1 Hydroelectric Power Plant [13]
3.3 Wind Energy The wind wheel, like the water wheel, has been used by man for a long time for grinding corn and pumping
water. Ancient seamen used wind power to sail their ships. With the development of the fossil fuelled and
hydro-electric plants, there was decline in the use of wind power due to the less cost involved in the new
methods. Another difficulty with wind power was the problem of energy storage. The energy could not be made
available, on demands, due to uncertainties of wind. Due to these two reasons, no further attempt was made to
develop wind power for large scale power generation. In recent years, however, as a result of energy crisis in the
world, it has been decided to investigate all possible means of developing power, as alternatives to fuel fired
plants. The wind could supply a significant portion of the world’s energy demand. An estimate by an American
Professor indicates the potentialities of wind power. According to him about 350,000wind mills each rated for
about 1250 KW to 2200 KW could develop power of the order of 190,000 MW. With the advancement in the
International Conference on Emerging Trends in Technology, Science and Upcoming Research in Computer Science
DAVIM, Faridabad, 25th April, 2015 ISBN: 978-81-931039-3-7
151 | P a g e
knowledge of aero-dynamics it has been possible to build larger and more efficient wind power plants. A typical
example is the 1250 KW installation at Grandpa’s Knol in U.S.A. Whereas some success has been achieved in
developing small and medium size plants, the prospects of large scale generation i.e., 1 MW or above are not, as
yet very encouraging[14].
Several types of wind wheels have been used but the advantage of propeller rotating about a horizontal shaft; in
a plane perpendicular to the direction of the wind make it the most likely type to realize economic generation on
a large scale. A propeller consisting of two or three blades (with an aero foil section) and capable of running at
the high speeds is likely to be the most efficient. Present technology has been able to build systems with 60 m
long blades, on towers as high as 305 m. A large tower system, to support many small rotor-generator units, can
also be built. Wind pressure rotates the wind vanes or propellers attached to a shaft. The revolving shaft rotates
the rotor of a generator, through a mechanism of gears couplings etc. Thus, electricity is generated. The wind
power plants can be operated in combination with steam or hydro power station, which will lead to saving in
fuel and increase in firm capacity, respectively of these plants. Wind energy can prove to be a potential source
of energy for solving the energy problem. It can certainly go a long way to supply pollution-free energy to
millions of people, living in the villages all over the world. The economic viability of wind mills is better in
situations where conventional transmission costs are extremely high (because of inaccessibility and small load)
or where continuous availability of supply is not essential so that only a limited amount of storage on standby
power need be provided.
3.3.1 Uses of Wind Energy
(i)Small micro-generation and hybrid systems.
(ii) Machines and wind farms,
(iii) Offshore wind power,
(iv) Wind resources and environmental issues,
(v) Connection and integration,
(vi) National and regional programmed, and
(vii) Economic and institutional issues.
3.4 Biomass Biomass is an important energy which is considered as one of the most promising renewable energy sources,
and it attracts more and more attention owing to meet the challenges of increasing energy demand. Gasification
for power generation is one of new techniques for utilization of biomass energy. It has been largely recognized
that biomass will play a substantial role in the global energy balance. Compared with other renewable energy
resources, biomass is abundant in annual production, up to 2740 Quads, with a geographically widespread
distribution in the world. World Energy Outlook predicts a 53% increase in global energy demand by 2030, 70%
of which will come from China and other developing countries. In China it has abundant biomass resources
contained wood-chip, agricultural residues etc. and large population that farmer takes up nearly 60%, And
because it is believed that energy obtained from biomass has a carbon-neutral cycle, for fuel gas/product gas
production by gasification as the produced fuel gas can be flexibly applied in boilers, engine, gas turbine or fuel
cell [15]. So biomass energy utilization will be very promising. Furthermore, there has been great interest in the
idea of the development of new technologies for power generation from biomass. It is the conversion of biomass
to biogas in the gasifer by heating in oxidant or gasifying agents such as air, oxygen or steam. The purified gas
International Conference on Emerging Trends in Technology, Science and Upcoming Research in Computer Science
DAVIM, Faridabad, 25th April, 2015 ISBN: 978-81-931039-3-7
152 | P a g e
will be burnt in gas turbines or power gas engines for power generation. The application of biomass gasification
and power generation (BGPG) technology would be one of the most advanced methods ways to use biomass as
an energy source. Biomass resource is widely available in China, which chiefly comes from agricultural residues
and forest residues. Now Chinese government pays more attention on biomass and its conversion technologies
through fund support for researches and some demonstrations [16], so it is of great importance to know the
status and technologies of biomass gasification for power generation.
3.4.1 Use of Biomass
(i) Heat and electricity generation,
(ii) Energy crops and residues,
(iii) Liquid fuels,
(iv) Socio-economics, case studies, and environmental impacts, and
(v) Gasification processes.
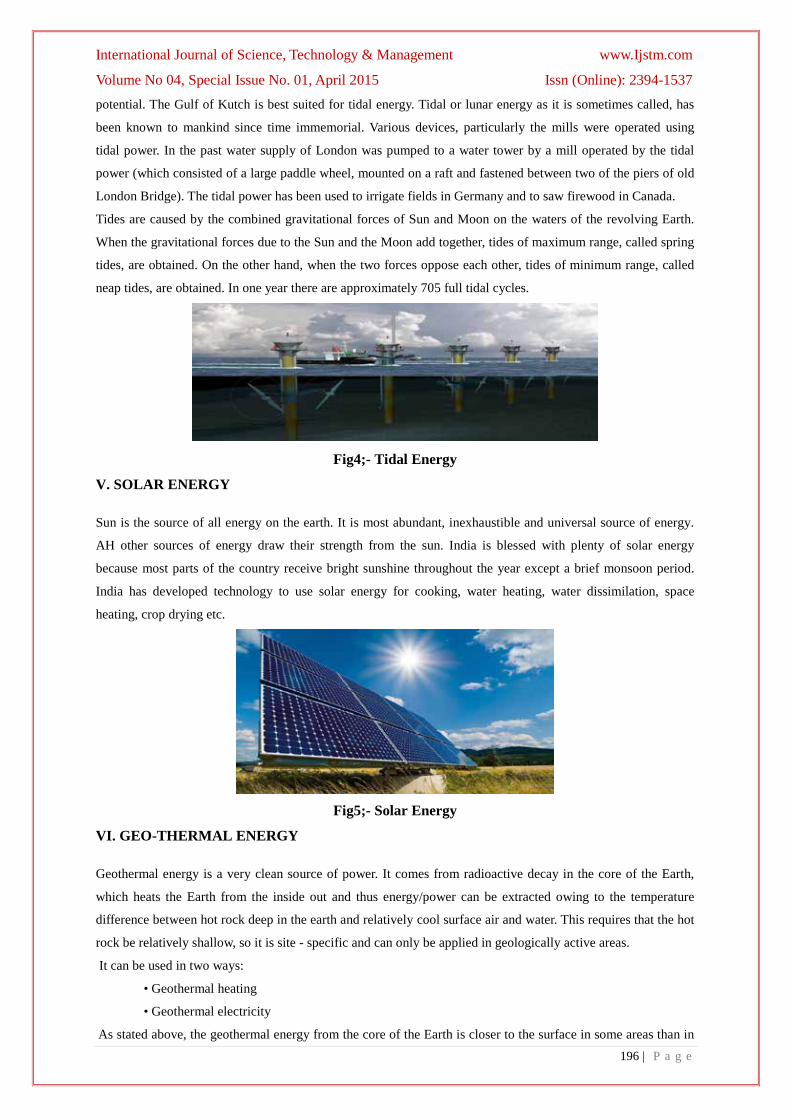
3.5. Tidal Power Tidal power also called tidal energy is a form of hydropower that converts the energy of tides into electricity
Tidal power is the only form of energy which derives directly from the relative motions of the Earth–Moon sys-
tem, and to a lesser extent from the Earth–Sun system. Tidal forces produced by the Moon and Sun, in
combination with Earth's rotation, are responsible for the generation of the tides. Other sources of energy
originate directly or indirectly from the Sun, including fossil fuels, conventional hydroelectric, wind, biofouls,
wave power and solar. Nuclear energy makes use of Earth's mineral deposits of fissile elements, while
geothermal power uses the Earth's internal heat which comes from a combination of residual heat from planetary
accretion (about 20%) and heat produced through radioactive decay (80%).Tidal energy is extracted from the
relative motion of large bodies of water. Periodic changes of water levels, and associated tidal currents, are due
to the gravitational attraction of the Sun and Moon. Magnitude of the tide at a location is the result of the
changing positions of the Moon and Sun relative to the Earth, the effects of Earth rotation, and the local
geography of the sea floor and coastlines. Because the Earth's tides are ultimately due to gravitational
interaction with the Moon and Sun and the Earth's rotation, tidal power is practically inexhaustible and
classified as a renewable energy resource. A tidal generator uses this phenomenon to generate electricity.
Greater tidal variation or tidal current velocity can dramatically increase the potential for tidal electricity
generation. The movement of the tides causes a continual loss of mechanical energy in the Earth–Moon system
due to pumping of water through the natural restrictions around coastlines, and consequent viscous dissipation at
the seabed and in turbulence. This loss of energy has caused the rotation of the Earth to slow in the 4.5 billion
years since formation. During the last 620 million years the period of rotation has increased from 21.9 hours to
the 24hours we see now; in this period the Earth has lost 17% of its rotational energy. While tidal power may
take additional energy from the system, increasing the rate of slowdown, the effect would be noticeable over
millions of years only, thus being negligible [17].
IV. ADVANTAGES OF NON-CONVENTIONAL ENERGY SOURCES
International Conference on Emerging Trends in Technology, Science and Upcoming Research in Computer Science
DAVIM, Faridabad, 25th April, 2015 ISBN: 978-81-931039-3-7
153 | P a g e
1. Non-convention energy is an indigenous resource available in considerable quantities to all developing
nations and capable, in principle of having a significant local, regional or national economic impact.
2.Sevral renewable option are financially and economically competitive for certain application, such as in
remote location, when the cost of transmitting electrical power or transporting conventional fuels are high, or in
those well-endowed with biomass, hydro or geothermal resources.
3. This conversion technology tends to the tends to be flexible and modular, it can usually be rapid deployed
4. Rapid scientific and technology advantages are expected to expand the economic range of non-conventional
energy application over the next 8-10 years, making it making it imperative for international decision makers
and planners to keep abreast developments.
V. DISADVANTAGE OF NON-CONVENTIONAL ENERGY SOURCE
1. Non-conventional energy is that it is difficult to generate the quantities of electricity that are as large as those
produced by fossil fuel generators. This may mean that we need to reduce the amount of energy we use or
simply build more energy facilities. It also indicates that the best solution to our energy problems may be to
have a balance of many different power sources.
2. Disadvantage of non-conventional energy sources is the reliability of supply. Renewable energy often relies
on the weather for its source of power. Hydro generators need rain to fill dams to supply flowing water. Wind
turbines need wind to turn the blades, and solar collectors need clear skies and sunshine to collect heat and make
electricity.
VI. CONCLUSIONS
The non-conventional energy source is pollution free. It is good for our environment and another source of
energy which is never end till earth is existing. Promoting innovative and effective use of application of non-
conventional energy source. Non-conventional energy technologies, to find the valuables and cost effective
applications of non-conventional energy resources suitable for use. the local, regional and global environmental
benefits of non-conventional energy applications, Ensuring the renewable energy takes its proper place in the
sustainable developments, supply and use of energy for greatest benefit of all, taking due account of research
requirements, energy efficiency, conservation and cost criteria, and find the best way to utilized the non-
conventional energy source.
REFRENCES
[1]. Vijay Kandalkar at el.” Utility of Non-conventional Energy Sources to MeetIncreasing Power Demands by
Solar Power Plant” Volume 3, Issue 4, April 2013, ISSN 2250-3153
[2]. PijushKantiBhattacharjee at el. “Solar-Rains-Wind-Lightning Energy Source Power Generation System”
Vol. 2, No. 2, April, 2010 ISSN 1793-8163
[3]. M. Thirugnanasambandam, S. Iniyan, and R. Goic, “A Review of Solar Thermal Technologies”,
Renewable and Sustainable Energy Reviews, Elsevier, vol. 14, 2010, pp. 312-22.
[4]. R. EATOCK TAYLOR.” Non-Conventional Energy Sources”ISSN 0974-5904, Vol. 03, No. 02, April
2010, pp. 125-141
[5]. P. P. Singh, S. Singh and S. S. Dhaliwal, “Multi-shelf domestic solar dryer”, Energy Conversion
Management, vol. 47, (2006), pp. 1799-815
International Conference on Emerging Trends in Technology, Science and Upcoming Research in Computer Science
DAVIM, Faridabad, 25th April, 2015 ISBN: 978-81-931039-3-7
154 | P a g e
[6]. L. M. Bal, S. Satya and S. N. Naik, “Solar dryer with thermal energy storage systems for drying
agricultural food products: A review”, Renewable and Sustainable Energy Reviews, vol. 14, (2010),
pp.2298-2314.
[7]. D. Jain, “Modeling the performance of the reversed absorber with packed bed thermal storage natural
convection solar crop dryer”, Journal of Food Engineering, vol. 78, (2007), pp. 637-47
[8]. H. Henning, “Solar assisted air conditioning of buildings-an overview”, Applied Thermal Engineering,
(2006).
[9]. R. Smitabhindu, S. Janjai and V. Chankong, “Optimization of a solar-assisted drying system for drying
bananas”, Renew Energy, vol. 33, (2008), pp. 1523-3123
[10]. A. Feltrin and A. Freundlich, “Material considerations for terawatt level deployment of
photovoltaics”,Renewable Energy, vol. 33, (2008), pp. 180-5
[11]. T. Schmidt, D. Mangold and H. Muller-Steinhagen, “Seasonal thermal energy storage in Germany”,ISES
solar world congress, (2003).
[12]. Chauhan D S, Gagan Singh “Simulation and Modeling of Hydro Power Plant to study Time Response
during Different Gate States” International Journal of Advanced Sciences and Technologies Vol 10 Issue
No. 1, 42- 47 2007
[13]. Vineesh V, A. Immanuel Selvakumar “Design of Micro Hydel Power Plant” ISSN: 2249 –8958,Volume-2,
Issue-2-December 2012
[14]. Abdeen Mustafa Omer“ A review of non-conventional energy systems and
environmental pollution control” Vol. 1 (7), pp. 1 27-1 54, September 2010, ISSN 21 41 -2391
[15]. T. Khatiba, A. Mohameda and K. Sopianb, “A review of solar energy modeling techniques”, Renewable
and Sustainable Energy Reviews, vol. 16, (2012), pp. 2864-2869
[16]. McVendry, “Energy production from biomass (part1): gasification technologies,” Bio resource
Technology, vol.83, pp.37-46, 2002.
[17]. Shaikh Md. RubayiatTousif et al.”Tidal Power: An Effective Method of Generating Power” ISSN 2229-
5518
.
International Conference on Emerging Trends in Technology, Science and Upcoming Research in Computer Science
DAVIM, Faridabad, 25th April, 2015 ISBN: 978-81-931039-3-7
155 | P a g e
A SURVEY ON HANDLING BIG DATA ISSUES BY
IMPROVING PERFORMANCE OF HYBRID CLOUD
MANAGEMENT THROUGH AGENT BASED CLOUD
COMPUTING FRAMEWORK Mrs. Suvarna. L. Kattimani1, Mr. Vilas S.Balaganur2
1Asst.Prof, 2PG scholar, Dept of CSE, BLDEA’s, Bijapur (India)
ABSTRACT Big data is defined as large amount of data which requires advanced technologies and architectures to extract
result of analysis process. Big data due to its various properties like volume, velocity, variety, variability, value
and complexity put forward many challenges. To handle the Big data issues Scientific Data Infrastructure (SDI)
can be naturally implemented using modern cloud based infrastructure services provisioning model. Since the
Big data involves some of the sensitive data of users security issues are important. By improving performance of
cloud management can be handle Big data issues. Cloud computing yet to solve security challenges.Agent-based
cloud computing is concerned with the design and development of software agents for bolstering cloud service
discovery, service negotiation, and service composition. To improve performance of cloud computing we need
to manage security key issues.
I. INTRODUCTION
1.1 Cloud Computing Cloud computing is internet (cloud) based development and use of computer technology (computing) whereby
dynamically scalable and often virtualized resources are provided as a service over the internet.Whereas many
existing works in cloud computing focus on the development of infrastructures and tools for pooling together
computational resources, this work
Complements and supplements existing works in cloud computing by introducing “agent-based cloud
computing”— applying
Agent-based approaches to managing cloud computing infrastructures.
1.2 Big Data Big data is a notion covering several aspects by one term, ranging from a technology base to a set of economic
models. In this white paper,the following definition of big data will be applied:
“Big data” is a term encompassing the use of techniques to capture, process, analyze and visualize potentially
large datasets in a reasonable timeframe not accessible to standard it technologies. By extension, the platform,
tools and software used for this purpose are collectively called “big data technologies”.
1.3 Agent-based Cloud Computing An agent is an independent computer system that cans take autonomous decisions on the actions to be
performed to fulfill its design goals. In agent-based cloud computing software agents bolster the cloud service
discovery, service negotiation, and service composition.
International Conference on Emerging Trends in Technology, Science and Upcoming Research in Computer Science
DAVIM, Faridabad, 25th April, 2015 ISBN: 978-81-931039-3-7
156 | P a g e
1.4 Cloud Service Discovery An agent-based cloud search engine module called Cloudle is devised to help in the service discovery by
querying against the database of cloud services registered in the search engine. TheCloudle consists of a service
discovery agent (SDA) and a set of cloud crawlers. The SDA composed of
1) Query processor, extracts essential keywords in the consumer’s requirements
2) Service reasoning module, find the degree of matching between consumer and provider service specification.
3) Price and time slot matching module, determine the rate of matching between customer and provider
specification on the price incurred and time schedule.
4) Service rating module, rates the services to be provided by different providers relative to the service
specifications of the consumer
SDA refers to the cloud ontology to reason about the similarities of the customer’s requirements submitted and
the provider’s specifications. The cloud ontology maintains the available cloud services for the customers by
storing a set of cloud concepts. The cloud crawlers gather information about cloud service providers by visiting
web pages serially. Thus the SDA gives out a list of services of providers ordered in terms of the service rates.
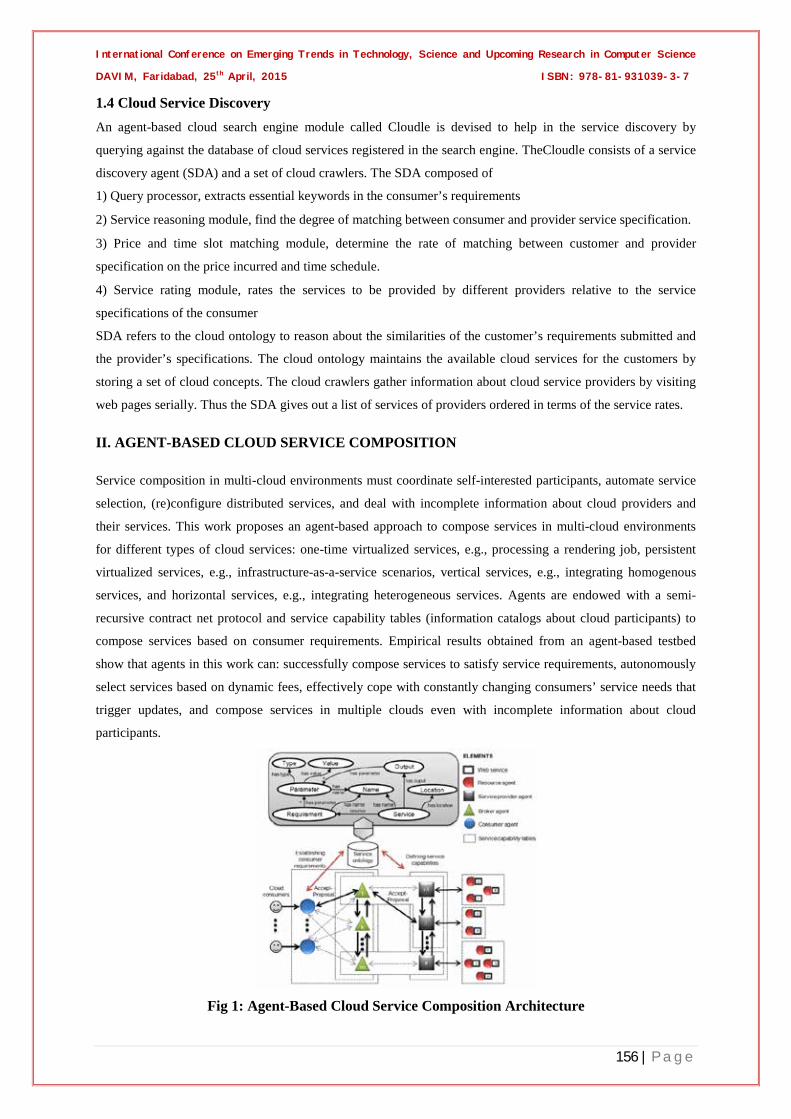
II. AGENT-BASED CLOUD SERVICE COMPOSITION
Service composition in multi-cloud environments must coordinate self-interested participants, automate service
selection, (re)configure distributed services, and deal with incomplete information about cloud providers and
their services. This work proposes an agent-based approach to compose services in multi-cloud environments
for different types of cloud services: one-time virtualized services, e.g., processing a rendering job, persistent
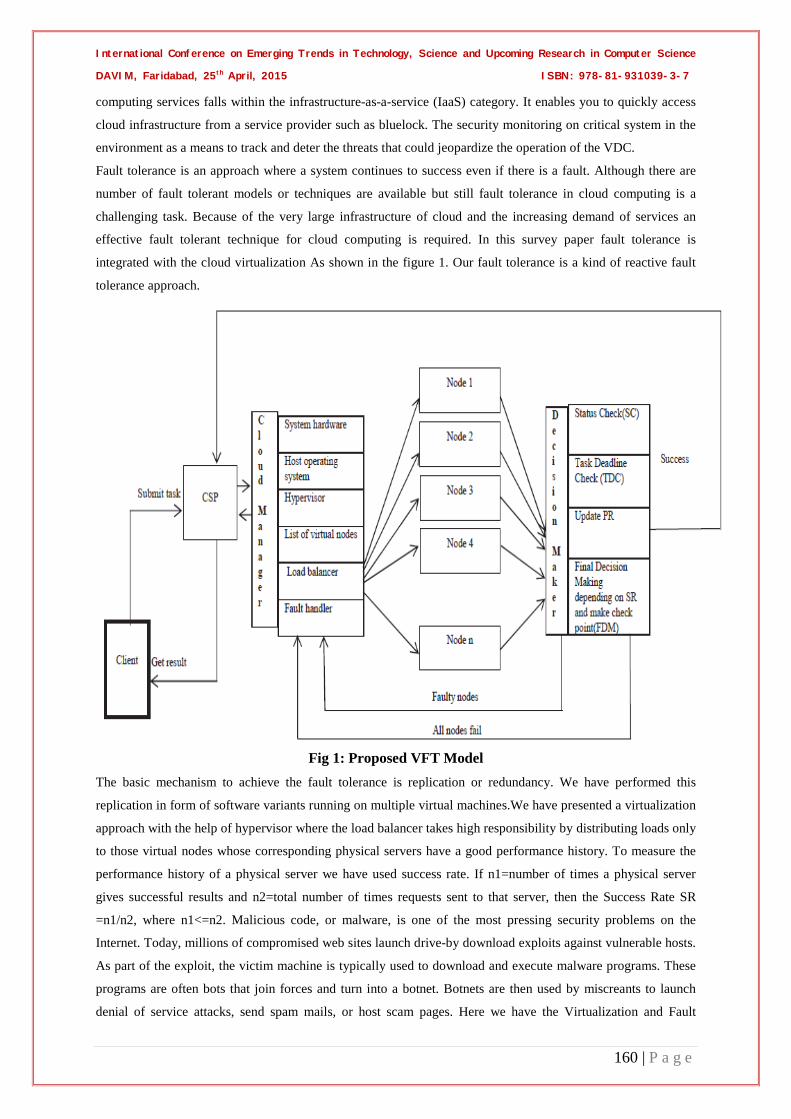
1Student of M. Tech. Manufacturing Management, BITS Pilani 2Student of Mechanical Engineering Kirodimal Institute of Technology, Raigarh, (India)
3Ph.D. Research Scholar, Kalinga University, Raipur
ABSTRACT In this paper presents the working analysis of wind turbine as a distributed generation unit with different
simulated conditions. Wind energy is natural and renewable, wind turbines are similar to hydraulic turbines,
hence the technology is mature and well establish. What is good about wind energy, its available even in winter,
when solar energy is not so good, so it makes a natural compliment so solar energy. Wind energy is becoming
popular despite some concerns about visual impact and so on, and its is one of the most competitive renewable
energy in most cases. In this paper, the performance analysis of wind turbine as a distributed generation unit is
presented. In this study a model of wind power is driven by an induction machine. Wind power that is
distributed generation is capable of supplying power to ac power distribution network. Wind power generation
system is modeled and simulated using Matlab Simulink software such that it can be suitable for modeling some
kind of induction generator configurations. To analyze more deeply the performance of the wind turbine system,
both normal and fault conditions scenarios have been applied. Simulation results prove the excellent
performance of the wind power unit under normal and fault conditions in the power distribution system.
Keywords: Distributed Generation, Wind Turbine, Working Analysis, Power Input & Output,
Blades, Wind Energy, Controlling
I. INTRODUCTION
There are three major challenges in the world at present, i.e. conservation of energy resources, protection of
environmental and development of sustainable [1]. One of the important issues is how to satisfy the needs of
energy for people without causing depletion of the natural energy resources rapidly and damage the
environmental. In power electrical energy field, the use of Distributed Generation (DG) has the new issue in the
last decade. DG is related to the use of small generating units, usually less than 10 MW, that are connected to
transmission or distribution systems. The emerging new technologies such as wind energy, fuel cells, solar
photovoltaics, and microhydro power sources make DG more and more affordable and popular [2]. The
government of Indonesia has targeted that DG from renewable energy resources for up to 25% of all electrical
power generation capacity going online to the distribution network by the year 2025 [3]. The target has been
emerged because the fuel and coal energy sources are limited and have pollution to the environment.[1]
International Conference on Emerging Trends in Technology, Science and Upcoming Research in Computer Science
DAVIM, Faridabad, 25th April, 2015 ISBN: 978-81-931039-3-7
168 | P a g e
The power output of a turbine will increase with the swept area (i.e. proportional to the square of the length of
the blade). For this workshop, however, the fact that the wind source is a fan means that beyond a certain blade
length, there will be no increase – in fact it will decrease due to the extra weight and increased drag force. Blade
shapes which are more aerodynamic will increase the power output. Blade angle is an optimum at around 20o in
this case, with lower and higher angles giving less power output. The wind output from the fan is not very
similar to real wind conditions, due to the rotating blades that increase the kinetic energy in the air (the
windspeeds are similar though – on the highest setting, the wind speed from the fan is around 4.8ms-1, and in
the square kilometer in which the engineering department is situated, the average windspeed 10m above ground
level is 4.7ms-1, 25m above ground level it is 5.5ms-1, and 45m above ground level it is 6ms-1). This means
that there will not be a steady power output from the turbine. The small turbines in this workshop work similarly
well with both 3 and 6 blades.[3]
II. WORKING OF WIND TURBINE
Wind turbines usually consist of a set of blades attached to a rotor hub, which together form the rotor; this rotor
deflects the airflow, which produces a force on the blades, which in turn produces a torque on the shaft such that
the rotor rotates about a horizontal axis (N.B. this does not apply to all wind turbines, some rotate about a
vertical axis), which is connected to a gearbox and generator. These are housed in the nacelle (at the top of the
tower) with other electrical components. The generator produces electricity, which is transmitted down the
cables through the tower and out to a transformer, to convert it from the output voltage (typically around 700V)
to the right voltage for either the national grid (33000V) or for whatever personal use it is being put to (so
240V).[2]
These Horizontal Axis Wind Turbines must always be pointed in the correct direction (into or away from the
wind, depending on the design) if they are to be used efficiently. Those which face away from the wind –
downwind turbines (“downwind” referring to the position of the turbine relative to the tower) – are blown into
the correct orientation. In older and smaller upwind wind turbines, correct orientation is achieved through use of
a simple wind vane; larger turbines contain a yaw meter and yaw motor. The yaw meter detects the direction of
the wind, and the yaw motor rotates the turbine so that it is always facing into the wind. Because it is possible
for the turbine to thus yaw in the same direction for many turns, twisting the cables, turbines have a cable twist
counter which causes the system to yaw back around so that the cables untwist, once they have reached a certain
number of turns in one direction.[2]
The shape of the blades is very important in controlling the turbine. The shape must be optimised to give lift so
that the rotor will turn. To this end, for the most part they have an aerofoil shape (as an aeroplane's wing), but
for large wind turbines the blades are always twisted. From the point of view of the blade, the wind will be
coming from a much steeper angle as you move towards the root of the blade. Since the blade will stop giving
lift (it will stall) if the blade is hit at an angle of attack which is too steep, the rotor blade must be twisted to
achieve an optimum angle of attack throughout the length of the blade.[1]
III. DISTRIBUTED GENERATION
In the future, Distributed Generation (DG) is expected to provide the most economical solution for load growth.
The impact due to load growth such as low voltage or overload is expected to be resolved by applying the DG in
many locations. There are many locations in a series of problems, where the DG may be located to provide the
International Conference on Emerging Trends in Technology, Science and Upcoming Research in Computer Science
DAVIM, Faridabad, 25th April, 2015 ISBN: 978-81-931039-3-7
169 | P a g e
necessary control to overcome the problems of voltage drop. In theory, the DG is able to provide the lowest cost
solution to the problem and the circuit will be installed to provide the required voltage control. DG further
placement in the circuit can lead to improvements in both losses and reliability of the electrical power
system.[4]
IV. WIND ENERGY SYSTEM
Have made many effort to build large-scale wind-powered systems to generate electrical energy. Historically,
power generation using wind power in the world created by Charles Bush in Cleveland, Ohio, USA in 1887. In
creation of wind power, he uses a DC generator for electricity production and is designed to charge the battery.
While the use of an induction generator as wind power for the first time was in 1951.[5]
In the principle of operation, wind turbines convert the kinetic energy contained in wind into mechanical energy
in the form of a round by way of producing torque. The amount of kinetic energy generated depends on the air
density and wind speed. This is due to the energy contained in wind is in the form of kinetic energy.
V. LIFT AND STALL The reason that an aeroplane can fly is that the air sliding along the upper surface of the wing will move faster
than the air on the lower surface, such that the pressure will be lower on the upper surface. This creates the lift,
i.e. the force pulling upwards that enables the plane to fly. Lift is perpendicular to the direction of the wind.
If an aeroplane tilts backwards in an attempt to climb higher into the sky, the lift of the wing will increase at first
as the wing is tilted backwards, but with increasing angle the air flow on the upper surface will separate and
become turbulent. This means that the lift from the low pressure on the upper surface of the wing disappears –
this is stall. A wing will stall if the shape of the wing tapers too quickly; in this case it is not due to the wing
changing shape but the angle of the wing relative to the general direction of the airflow (angle of attack) is
increased.
Stall can be provoked if the surface is not completely even and smooth. A dent can be enough to start turbulence
on the back side of a rotor blade[7]
VI. POWER OUTPUT
The power output of the turbine is found using the following equation:-
Power Delivered = Cp x (swept area) x ½ x d x u3
where Cp is the power efficiency of the rotor, swept area = πr2 where r is the blade length, d is the density of the
air, and u is the wind speed.
The theoretical maximum for Cp is 0.59; this is the Betz limit. Ideally, a turbine which operates as close to this
limit as possible over a wide range of wind speeds would be best. This would make the power output
approximately proportional to u3. The power must be limited at high u to protect mechanical and electrical
components of the turbine from overloading – this is done by reducing Cp as the wind speed increases (as
described above).[6]
The power at which a turbine is rated will not be achieved most of the time. Wind in the UK is estimated to
blow at a high enough speed to achieve the rated power 30-40% of the time, so the installed capacity of a
turbine or farm will be multiplied by this percentage to find a “declared net capacity”, the expected amount of
power from the site. Power output of a turbine in general will depend on many things, including: the size of the
International Conference on Emerging Trends in Technology, Science and Upcoming Research in Computer Science
DAVIM, Faridabad, 25th April, 2015 ISBN: 978-81-931039-3-7
170 | P a g e
turbine; the shape and smoothness of the blades; the angle (pitch) and number of the blades; the wind speed; the
height of the tower; the terrain of the location; the arrangement of turbines in a wind farm situation (to shelter
each other as little as possible from the prevailing wind).[6]
VII. NUMBERS OF BLADE
The number of blades will affect the power output from the turbine. The optimum number of blades for a wind
turbine depends on the purpose of the turbine. Turbines for generating electricity need to operate at high speeds,
but do not need much torque – these turbines generally have two or three blades, since this gives enough torque
without adding the extra weight that can slow the turbine down. Wind pumps need a lot of torque but not much
speed, and so have many blades.[2]
Rotors with odd numbers of blades (and at least three) are more stable. Two-bladed rotors require a hinged
(teetering hub) rotor, since it needs to be able to tilt or bend in order to avoid excessive shocks to the turbine
under relatively strong winds.
The three-bladed rotor is the most popular model with a much smoother power output, more efficient and higher
energy yield, a balanced gyroscopic force and a much better mechanical system compared to the rotors with two
blades.[2]
Fig (1) Wind Turbine
VIII. INDUCTION MACHINE IN WIND ENERGY
Induction machine is widely used in power system as an electric motor, but not the induction machine is widely
used as electrical generators. Although it has simplicity in construction, induction motors do not like as much as
synchronous generators. This is mainly due to the output and absorption of active and reactive power that the
correlation is not good. However, induction generators provide useful damping torque is great as main
propulsion, making it suitable for applications in the fixed-speed wind turbines. Wind turbines that have a fixed
rate using a squirrel cage induction generator-type combined with large-scale power system through a
transformer. To overcome the differences in speed of operation of the wind turbine rotor and generator, the
gearbox used to match this speed. Slip of generators therefore varies slightly with the amount of power
generated and therefore not entirely constant.
International Conference on Emerging Trends in Technology, Science and Upcoming Research in Computer Science
DAVIM, Faridabad, 25th April, 2015 ISBN: 978-81-931039-3-7
171 | P a g e
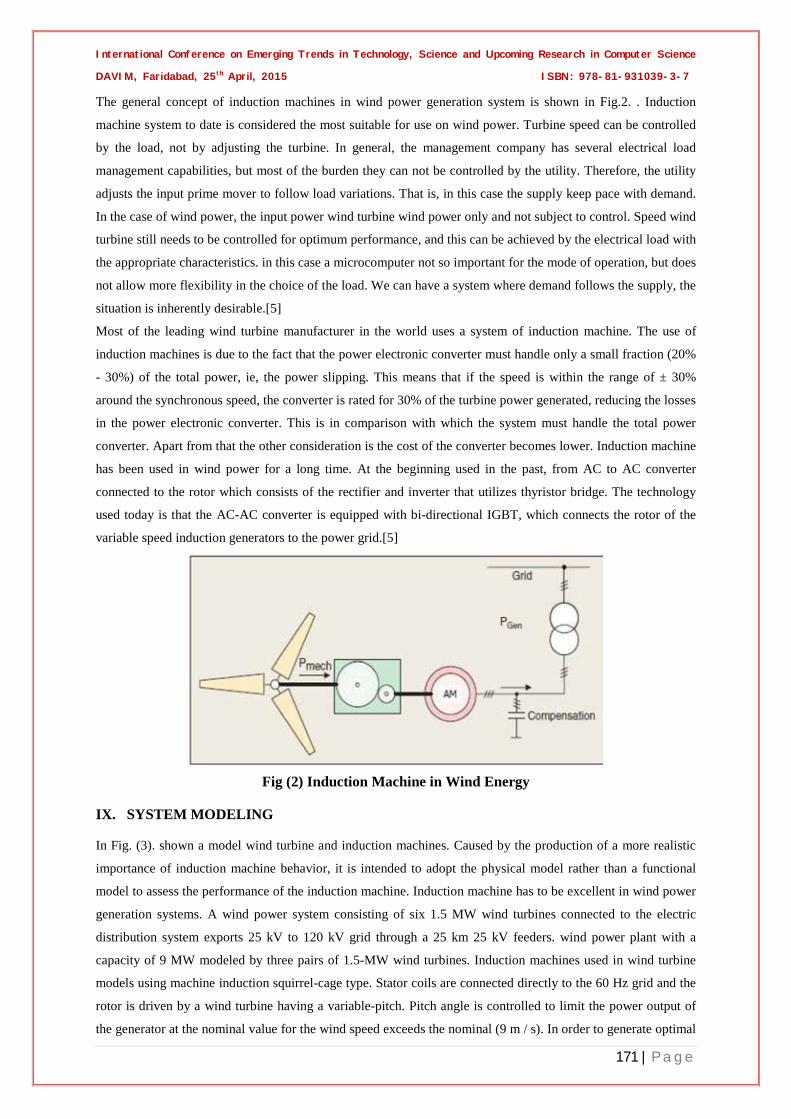
The general concept of induction machines in wind power generation system is shown in Fig.2. . Induction
machine system to date is considered the most suitable for use on wind power. Turbine speed can be controlled
by the load, not by adjusting the turbine. In general, the management company has several electrical load
management capabilities, but most of the burden they can not be controlled by the utility. Therefore, the utility
adjusts the input prime mover to follow load variations. That is, in this case the supply keep pace with demand.
In the case of wind power, the input power wind turbine wind power only and not subject to control. Speed wind
turbine still needs to be controlled for optimum performance, and this can be achieved by the electrical load with
the appropriate characteristics. in this case a microcomputer not so important for the mode of operation, but does
not allow more flexibility in the choice of the load. We can have a system where demand follows the supply, the
situation is inherently desirable.[5]
Most of the leading wind turbine manufacturer in the world uses a system of induction machine. The use of
induction machines is due to the fact that the power electronic converter must handle only a small fraction (20%
- 30%) of the total power, ie, the power slipping. This means that if the speed is within the range of ± 30%
around the synchronous speed, the converter is rated for 30% of the turbine power generated, reducing the losses
in the power electronic converter. This is in comparison with which the system must handle the total power
converter. Apart from that the other consideration is the cost of the converter becomes lower. Induction machine
has been used in wind power for a long time. At the beginning used in the past, from AC to AC converter
connected to the rotor which consists of the rectifier and inverter that utilizes thyristor bridge. The technology
used today is that the AC-AC converter is equipped with bi-directional IGBT, which connects the rotor of the
variable speed induction generators to the power grid.[5]
Fig (2) Induction Machine in Wind Energy
IX. SYSTEM MODELING
In Fig. (3). shown a model wind turbine and induction machines. Caused by the production of a more realistic
importance of induction machine behavior, it is intended to adopt the physical model rather than a functional
model to assess the performance of the induction machine. Induction machine has to be excellent in wind power
generation systems. A wind power system consisting of six 1.5 MW wind turbines connected to the electric
distribution system exports 25 kV to 120 kV grid through a 25 km 25 kV feeders. wind power plant with a
capacity of 9 MW modeled by three pairs of 1.5-MW wind turbines. Induction machines used in wind turbine
models using machine induction squirrel-cage type. Stator coils are connected directly to the 60 Hz grid and the
rotor is driven by a wind turbine having a variable-pitch. Pitch angle is controlled to limit the power output of
the generator at the nominal value for the wind speed exceeds the nominal (9 m / s). In order to generate optimal
International Conference on Emerging Trends in Technology, Science and Upcoming Research in Computer Science
DAVIM, Faridabad, 25th April, 2015 ISBN: 978-81-931039-3-7
172 | P a g e
induction engine, the engine speed should induski slightly above synchronous speed. In this simulation speed
varies between 1 pu no load and 1,005 p.u. at full load. Each wind turbine has a monitoring system voltage
protection, current and engine speed.[8]
Fig (3) System Modeling
X. SIMULATION IN WIND TURBINE
In order to analyse analyze the performance of wind turbine as a part of distributed generation in power
distribution system, the overall system is simulated using Matlab Simulink software. The simulation described
in this section illustrates the steady-state and dynamic performance of a 9 MW wind power generation system
connected to a distribution system. The wind power generation system consists of six 1.5 MW wind turbines
connected to a 25 kV distribution system exporting power to a 120 kV grid through a 30 km 25 kV feeder. In
this simulation, all of the system is observed during 20 s.
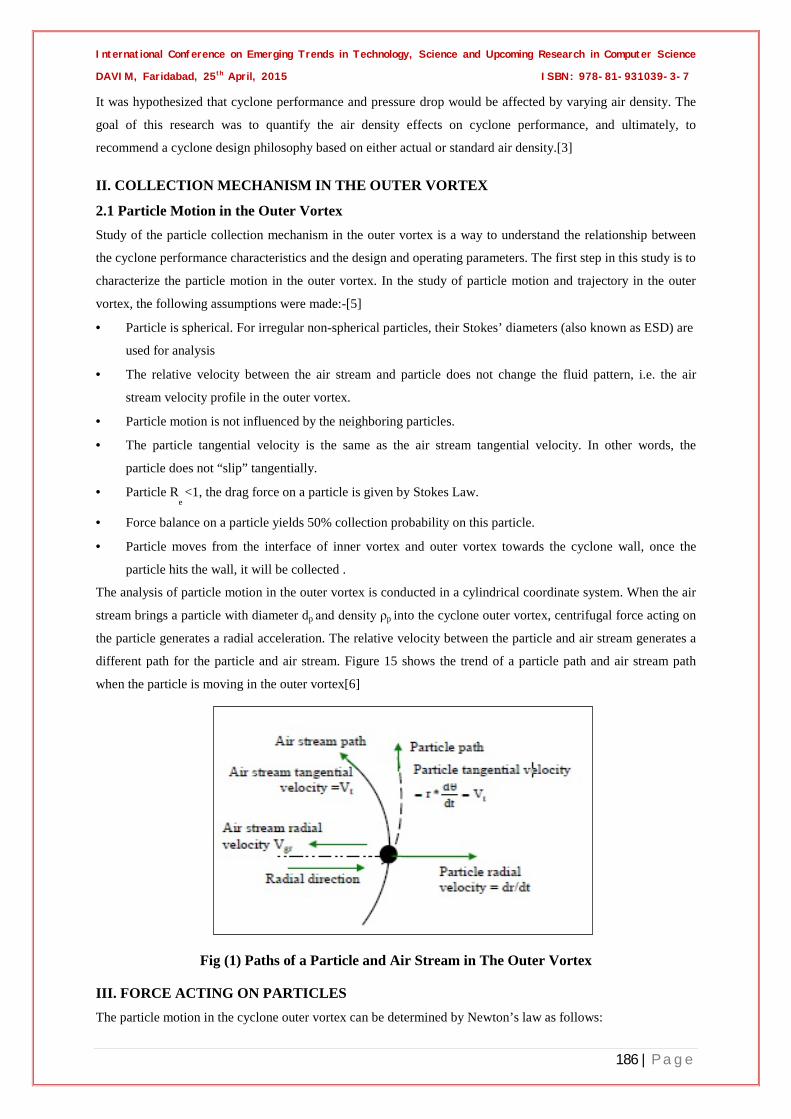
Fig. (4) shows the characteristics of the wind turbine with a pitch angle of 0 ▊糎8〩〸H糎H〩DLH糎I〩〢I糎I〩〦糎L〸C〥糎HE〦〦〥糎
will produce a variety of different turbines in the power output per unit of nominal mechanical power. Turbine
mechanical power is shown as a function of turbine speed to wind speed ranged between 4 m s to 10 m/s. In this
system it is assumed that the nominal wind speed produces a nominal mechanical power for base 1 p.u. = 3 MW
is 9 m/s. [5]
Fig (4) Wind Turbine Characteristics With Pitch Angle Of 0
10.1 Simulation under Normal condition In this part, we have simulated power distribution system including wind turbine as distributed generation under
normal condition. Simulation has started with monitoring both active and reactive powers, generator speed,
wind speed and pitch angle for each wind turbine.
International Conference on Emerging Trends in Technology, Science and Upcoming Research in Computer Science
DAVIM, Faridabad, 25th April, 2015 ISBN: 978-81-931039-3-7
173 | P a g e
Fig. (5) and Fig. (6) show the active and reactive power of wind turbine under normal condition, respectively.
That Figures illustrate each of the resulted both active and reactive power of three pairs of wind turbines.[5]
Fig (5) Active Power of Wind Turbine Fig (6) Reactive Power of Wind Turbine Under Normal Condition Under Normal Condition 10.2 Simulation under Fault Condition In this session, we have simulated power distribution system including wind turbines as distributed generation
under fault condition. At the time t = 15 s, three-phase fault is applied to the wind turbine 2 terminals, causing
the wind turbine to trip experience at t = 15.11 s. Once the turbine 2 has tripped, turbine 1 and 3 continued to
produce 3 MW each turbine.
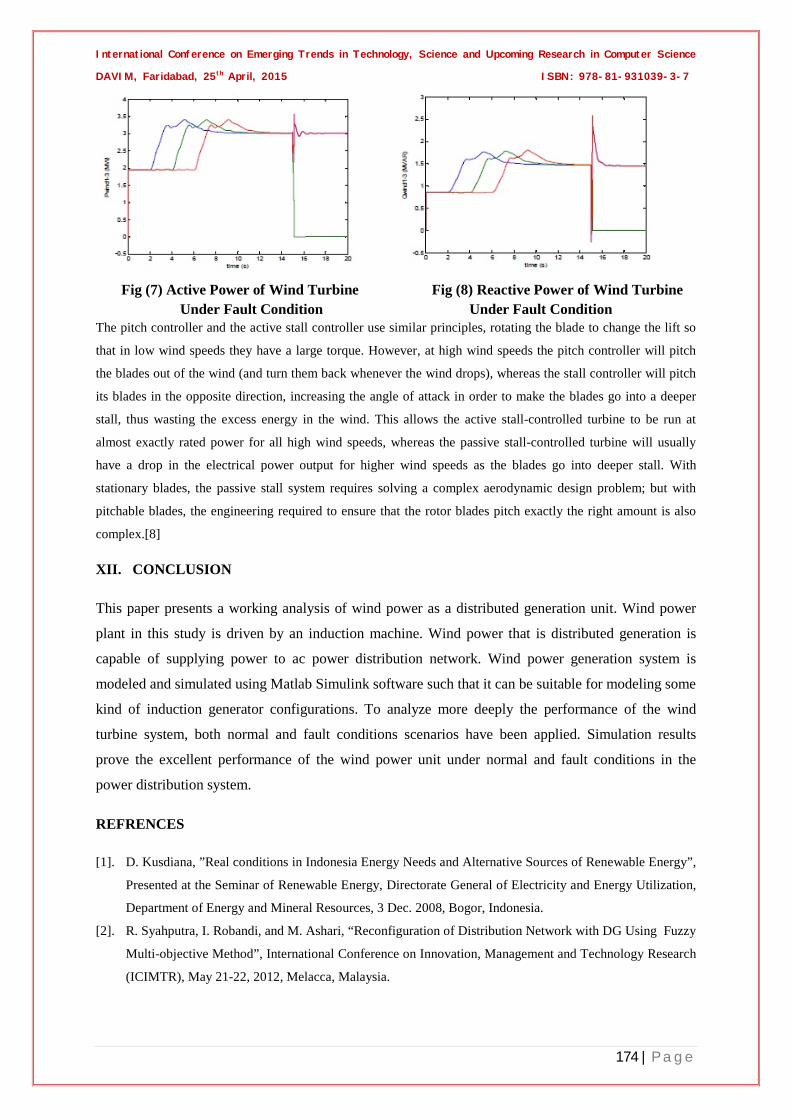
Fig. (7) and Fig. (8) show the active and reactive power of wind turbine under fault condition, respectively. The
Figures illustrate each of the resulted active and reactive power of three pairs of wind turbines. In Fig. 15, for
each pair of active power generating turbines began to rise in tandem with increasing wind speeds to achieve the
assessed value of 3 MW in about 8 s. During this period the wind turbine speed has increased from 1.0028 p.u.
to 1.0047 p.u. At first turbine blade pitch angle is zero degrees. When the output power exceeds the value of 3
MW, the pitch angle is increased from 0 to 8C[5]
XI. CONTROLLING OF WIND TURBINE
Wind turbines must not be run during wind speeds which are too high, since this may cause vibration that can
shake the turbine into pieces; because of this they have brakes, and also a way to decrease the lift given to the
blades. This can be done using a pitch-controller on the blades or a stall-controller (which can be active or
passive). The passive stall controller makes use of the shape of the blade, designing it so that at high wind
speeds it will stall gradually from the root of the blade. This occurs because as the actual wind speed in the area
increases, the angle of attack of the rotor blade will increase until it starts to stall.[6]
International Conference on Emerging Trends in Technology, Science and Upcoming Research in Computer Science
DAVIM, Faridabad, 25th April, 2015 ISBN: 978-81-931039-3-7
174 | P a g e
Fig (7) Active Power of Wind Turbine Fig (8) Reactive Power of Wind Turbine Under Fault Condition Under Fault Condition The pitch controller and the active stall controller use similar principles, rotating the blade to change the lift so
that in low wind speeds they have a large torque. However, at high wind speeds the pitch controller will pitch
the blades out of the wind (and turn them back whenever the wind drops), whereas the stall controller will pitch
its blades in the opposite direction, increasing the angle of attack in order to make the blades go into a deeper
stall, thus wasting the excess energy in the wind. This allows the active stall-controlled turbine to be run at
almost exactly rated power for all high wind speeds, whereas the passive stall-controlled turbine will usually
have a drop in the electrical power output for higher wind speeds as the blades go into deeper stall. With
stationary blades, the passive stall system requires solving a complex aerodynamic design problem; but with
pitchable blades, the engineering required to ensure that the rotor blades pitch exactly the right amount is also
complex.[8]
XII. CONCLUSION
This paper presents a working analysis of wind power as a distributed generation unit. Wind power
plant in this study is driven by an induction machine. Wind power that is distributed generation is
capable of supplying power to ac power distribution network. Wind power generation system is
modeled and simulated using Matlab Simulink software such that it can be suitable for modeling some
kind of induction generator configurations. To analyze more deeply the performance of the wind
turbine system, both normal and fault conditions scenarios have been applied. Simulation results
prove the excellent performance of the wind power unit under normal and fault conditions in the
power distribution system.
REFRENCES
[1]. D. Kusdiana, ”Real conditions in Indonesia Energy Needs and Alternative Sources of Renewable Energy”,
Presented at the Seminar of Renewable Energy, Directorate General of Electricity and Energy Utilization,
Department of Energy and Mineral Resources, 3 Dec. 2008, Bogor, Indonesia.
[2]. R. Syahputra, I. Robandi, and M. Ashari, “Reconfiguration of Distribution Network with DG Using Fuzzy
Multi-objective Method”, International Conference on Innovation, Management and Technology Research
(ICIMTR), May 21-22, 2012, Melacca, Malaysia.
International Conference on Emerging Trends in Technology, Science and Upcoming Research in Computer Science
DAVIM, Faridabad, 25th April, 2015 ISBN: 978-81-931039-3-7
175 | P a g e
[3]. R. Syahputra, “Fuzzy Multi-objective Approach for the Improvement of Distribution Network Efficiency
by Considering DG”, International Journal of Computer Science & Information Technology (IJCSIT) Vol
4, No 2, April 2012.
[4]. L. Mihet-Popa and F. Blaabrierg, “Wind Turbine Generator Modeling and Simulation Where Rotational
Speed is the Controlled Variable”, IEEE Transactions on Industry Applications, Vol. 40, No.1, Jan./Feb.
2004
[5]. J.G. Slootweg, S. W. H. Haan, H. Polinder, and W.L. Kling. “General Model for Representing Variable
Speed Wind Turbines in Power System Dynamics Simulations”. IEEE Trans. on Power Systems, Vol. 18,
No. 1, February, 2003
[6]. S. Kim and E. Kim, “PSCAD/EMTDC-based modeling and analysis of a gearless variable speed wind
turbine”, IEEE Trans Energy Conversion, Vol. 22, No. 2, pp. 421-430, 2007.
[7]. T. T. Chuong, “Voltage Stability Investigation of Grid Connected Wind Farm”, World Academy of
Science, Engineering and Technology, Vol. 42, pp. 532-536, 2008..
[8]. S. Müller,M. Deicke, and R. W.De Doncker, “Doubly-fed induction generator system for wind turbines”,
IEEE Industry Applications Magazine, May/June 2002.
International Conference on Emerging Trends in Technology, Science and Upcoming Research in Computer Science
DAVIM, Faridabad, 25th April, 2015 ISBN: 978-81-931039-3-7
176 | P a g e
PERFORMANCE ANALISIS AND FABRICATION OF
DOUBLE ACTING WINCH TYPE ELEVATOR Alok Agrawal1, Prakash Kumar Sen2, Shailendra Kumar Bohidar3
1Student of Mechanical Engineering, Kirodimal Institute of Technology, Chhattisgarh,(India) 2Student of M.Tech Manufacturing Management, BITS Pilani (India)
3Ph.D. Research Scholar, Kalinga University, Raipur (India)
ABSTRACT The growth of technologies requested higher performance machine in order to fulfill human needs and market.
This machine is implement to make human work easier besides can reduce the uses of human work easier and
can reduce the use of human power because of its potential application. The machine double acting winvh type
elevator can lift the two load or bucket using one motor at the same time. Earlier, winch type elevator can lift
one bucket at a time and while returning it does not give any useful work. So we this disadvantage by attaching
two bucket on the two winch operated by same motor. The machine is based on the principle of lifting machine.
But in this case when one bucket moves up the other bucket goes down due to the arrangement of its rope and
cylinder and this will utilize the power of the returning stroke.
Keywords: Bucket Elevator, Material Handling Equipment
I. INTRODUCTION
An elevator is a device used for lifting or lowering a load by means of a drum or lift-wheel around which rope
or chain wraps. It may be manually operated, electrically or pneumatically driven and may use chain, fiber or
wire rope as its lifting medium. The load is attached to the hoist by means of a lifting hook. The range of lifting
machines can be applied across all industry sectors; from healthcare to construction, most industries and
commercial activity will use some kind of lifting equipment. Technological progress has meant that innovative,
often complex and powerful lifting equipment is now available for use. The principal parts of load-lifting
machines are the frame, the lifting mechanism, and the carrying (grasping) system. Self-propelled machines are
equipped with a mechanism for movement; rotating types are equipped with a rotation mechanism. The load-
grasping mechanism, like the design of the machine itself, depends on the size, weight, and nature of the load to
be moved, as well as on the technical aspects of manufacturing process involved. For lifting and lowering
people the machine is equipped with cabins and cages; for moving piece goods it has hooks and various special
grips; and for bulk materials, it has buckets, dippers, or graders.
The principal parts of load-lifting machines are the frame, the lifting mechanism, and the carrying (grasping)
system. Self-propelled machines are equipped with a mechanism for movement; rotating types are equipped
with a rotation mechanism. The load-grasping mechanism, like the design of the machine itself, depends on the
size, weight, and nature of the load to be moved, as well as on the technical aspects of manufacturing process
involved. For lifting and lowering people the machine is equipped with cabins and cages; for moving piece
goods it has hooks and various special grips; and for bulk materials, it has buckets, dippers, or graders.
International Conference on Emerging Trends in Technology, Science and Upcoming Research in Computer Science
DAVIM, Faridabad, 25th April, 2015 ISBN: 978-81-931039-3-7
177 | P a g e
In double acting winch type elevator there are two bucket attached with a lever pulley and it connected with a
long rope through electric motor that’s why it is known as Double acting winch type elevator. The bucket
elevator is probably the oldest known form of conveyor, Its history can be traced back to the days of Babylon
where wicker baskets lined with a natural pitch and fastened to ropes operating over wooden sheaves turned by
slaves, were used for the elevating of water into irrigation ditches. [1]
It consists of:
• Buckets to contain the material;
• A belt to carry the buckets and transmit the pull;
• Means to drive the belt.
• Accessories for loading the buckets or picking up the material, for receiving the discharged material, for
maintaining the belt tension and for enclosing and protecting the elevator.
A bucket elevator can elevate a variety of bulk materials from light to heavy and from fine to large lumps. A
centrifugal discharge elevator may be vertical or inclined. Vertical elevators depend entirely on the action of
centrifugal force to get the material into the discharge chute and must be run at speeds relatively high.
II. LITERATURE REVIEW
Rudimentary elevators, or hoists, were in use during the middle ages and can be traced back to the third century
BC. They were operated by animal and human power or by water-driven mechanisms. The power elevator
debuted mid-19th century in the US as a simple freight hoist operating between just two floors in a New York
City building. In 1853, Elisha Graves Otis was at the New York Crystal Palace exposition, demonstrating an
elevator with a “safety” to break the cab’s fall in case of rope failure, a defining moment in elevator
development. By 1857, the country’s first Otis passenger elevator was in operation at a New York City
department store, and, ten years later, Elisha’s sons went on to found Otis Brothers and Company in Yonkers,
NY, eventually to achieve mass production of elevators in the thousands. Today, Otis is the world’s largest
elevator manufacturer. In 1889 came the direct-connected geared electric elevator, allowing for the building of
significantly taller structures. By 1903, this design had evolved into the gearless traction electric elevator,
allowing hundred-plus story buildings to become possible and forever changing the urban landscape. Multi-
speed motors replaced the original single-speed models to help with landing-leveling and smoother overall
The testing system was a pull system shown in fig (4). The blowers pull the air from the feeding mechanism
directly into a pipe and then to the cyclone. A collection hopper was connected to the bottom of the cyclone dust
outlet to store the dust collected by the cyclone. Cleaned air flowed out of the cyclone through the outlet-
International Conference on Emerging Trends in Technology, Science and Upcoming Research in Computer Science
DAVIM, Faridabad, 25th April, 2015 ISBN: 978-81-931039-3-7
190 | P a g e
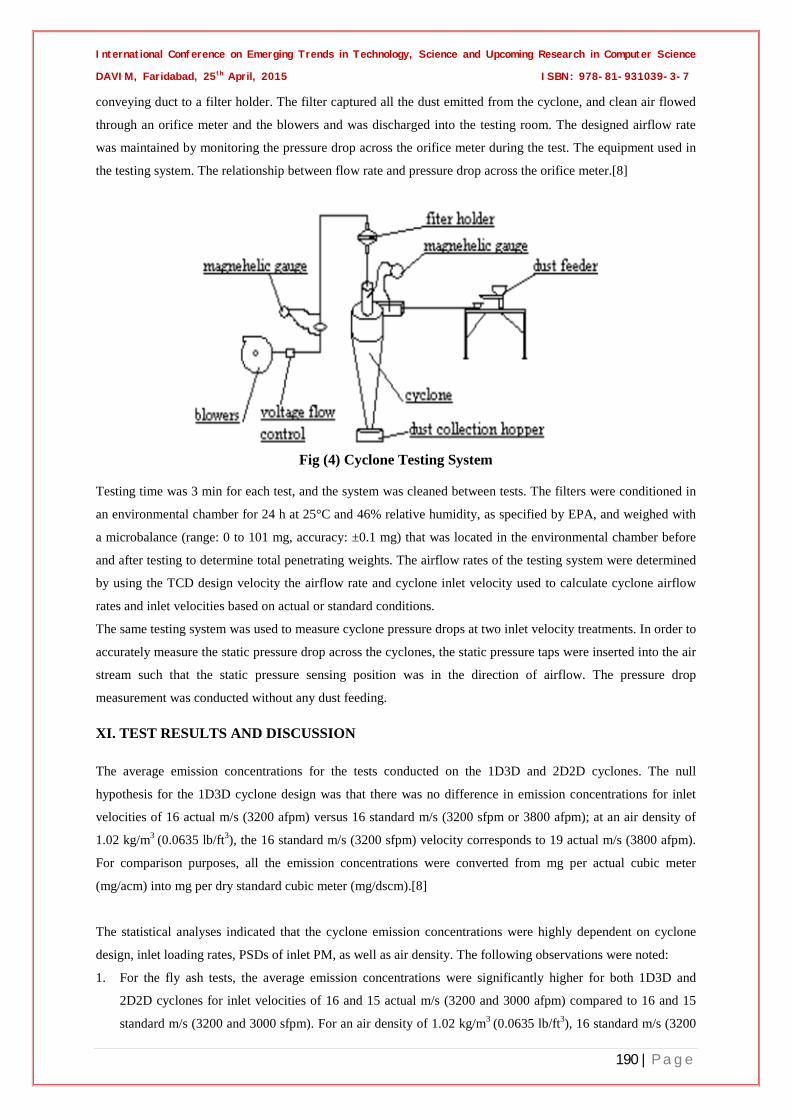
conveying duct to a filter holder. The filter captured all the dust emitted from the cyclone, and clean air flowed
through an orifice meter and the blowers and was discharged into the testing room. The designed airflow rate
was maintained by monitoring the pressure drop across the orifice meter during the test. The equipment used in
the testing system. The relationship between flow rate and pressure drop across the orifice meter.[8]
Fig (4) Cyclone Testing System
Testing time was 3 min for each test, and the system was cleaned between tests. The filters were conditioned in
an environmental chamber for 24 h at 25°C and 46% relative humidity, as specified by EPA, and weighed with
a microbalance (range: 0 to 101 mg, accuracy: ±0.1 mg) that was located in the environmental chamber before
and after testing to determine total penetrating weights. The airflow rates of the testing system were determined
by using the TCD design velocity the airflow rate and cyclone inlet velocity used to calculate cyclone airflow
rates and inlet velocities based on actual or standard conditions.
The same testing system was used to measure cyclone pressure drops at two inlet velocity treatments. In order to
accurately measure the static pressure drop across the cyclones, the static pressure taps were inserted into the air
stream such that the static pressure sensing position was in the direction of airflow. The pressure drop
measurement was conducted without any dust feeding.
XI. TEST RESULTS AND DISCUSSION
The average emission concentrations for the tests conducted on the 1D3D and 2D2D cyclones. The null
hypothesis for the 1D3D cyclone design was that there was no difference in emission concentrations for inlet
velocities of 16 actual m/s (3200 afpm) versus 16 standard m/s (3200 sfpm or 3800 afpm); at an air density of
1.02 kg/m3 (0.0635 lb/ft3), the 16 standard m/s (3200 sfpm) velocity corresponds to 19 actual m/s (3800 afpm).
For comparison purposes, all the emission concentrations were converted from mg per actual cubic meter
(mg/acm) into mg per dry standard cubic meter (mg/dscm).[8]
The statistical analyses indicated that the cyclone emission concentrations were highly dependent on cyclone
design, inlet loading rates, PSDs of inlet PM, as well as air density. The following observations were noted:
1. For the fly ash tests, the average emission concentrations were significantly higher for both 1D3D and
2D2D cyclones for inlet velocities of 16 and 15 actual m/s (3200 and 3000 afpm) compared to 16 and 15
standard m/s (3200 and 3000 sfpm). For an air density of 1.02 kg/m3 (0.0635 lb/ft3), 16 standard m/s (3200
International Conference on Emerging Trends in Technology, Science and Upcoming Research in Computer Science
DAVIM, Faridabad, 25th April, 2015 ISBN: 978-81-931039-3-7
191 | P a g e
sfpm) is equivalent to 19 actual m/s (3800 afpm), and 19 m/s (3800 afpm) is outside of the TCD ideal
design velocity range of 16 ±2 m/s (3200 ±400 fpm) for the 1D3D cyclones. One would assume that higher
emissions would occur at 19 m/s (3800 afpm). However, the measured data did not support this assumption.
Experimental results indicate that the optimum design velocity for the 1D3D cyclone is 16 standard m/s
(3200 sfpm), not 16 actual m/s (3200 afpm). The same observations were made for the 2D2D cyclone. With
an air density of 1.01 kg/m3 (0.063 lb/ft3), 15 standard m/s (3000 sfpm) inlet velocity is equivalent to 18
actual m/s (3600 afpm), and 18 actual m/s (3600 afpm) is also outside of the TCD ideal design velocity
range of 15 ±2 m/s (3000 ±400 fpm) for the 2D2D cyclones. Again, the experimental data indicate that the
optimum design velocity for the 2D2D cyclone should be 15 standard m/s (3000 sfpm), not 15 actual m/s
(3000 afpm).
2. For agricultural dust with larger MMD, such as cornstarch and manure dust, the trend of decreasing
emission concentration for 1D3D and 2D2D cyclones was observed when the inlet design velocity was
based on standard air density. However, the differences in the emission concentrations for inlet velocities
based on actual versus standard air densities were not statistically significant.
3. The results from both 1D3D and 2D2D cyclones also indicate that higher inlet loading rates increased the
differences in the emission concentration with different inlet velocity treatments. This implies that the effect
of air density is increased as cyclone inlet loadings increase.
XI. CONCLUSION
Particle motion in the cyclone outer vortex was analyzed in this paper to establish the force balance differential
equation. Barth’s “static particle” theory combined with the force balance equation was applied in the
theoretical analyses for the models of cyclone cut-point and collection probability distribution in the cyclone
outer vortex. Cyclone cut-points for different dusts were traced from measured cyclone overall collection
efficiencies and the theoretical model for the cyclone overall efficiency calculation. The theoretical predictions
of cut-points for 1D3D and 2D2D cyclones with fly ash are 4.85 μm and 5.25 μm. Based upon the theoretical
study in this chapter the following main observations are obtained:-
1. The traced cut-points indicate that cyclone cut-point is the function of dust PSD (MMD and GSD).
2. Theoretical d50 model (Barth model) needs to be corrected for PSD
3. The cut-point correction factors (K) for 1D3D and 2D2D cyclone were developed through regression fits
from theoretically traced cut-points and experimental cut-points.
4. The corrected d50 is more sensitive to GSD than to MMD.
5. The theoretical overall efficiency model developed in this research can be used for cyclone total efficiency
calculation with the corrected d50 and PSD. No fractional efficiency curves are needed for calculating total
efficiency
The performance of 1D3D and 2D2D cyclones is highly dependent on the inlet air velocity and air density.
Proposed cyclone design inlet velocities are:
• 16 m/s ± 2 m/s (3200 ft/min ± 400 ft/min) with air density at standard condition for 1D3D cyclones.
• 15 m/s ± 2 m/s (3000 ft/min ± 400 ft/min) with air density at standard condition for 2D2D cyclones.
• 12 m/s ± 2 m/s (2400 ft/min ± 400 ft/min) with air density at standard condition for 1D2D cyclones.
It is important to consider the air density effect on the cyclone performance in the design of cyclone abatement
systems. TCD ideal design velocity for 1D3D, 2D2D, and 1D2D cyclones should be the ideal inlet velocity of
International Conference on Emerging Trends in Technology, Science and Upcoming Research in Computer Science
DAVIM, Faridabad, 25th April, 2015 ISBN: 978-81-931039-3-7
192 | P a g e
standard air, not the ideal inlet velocity of actual air. In designing cyclone abatement systems, the proposed
design velocity should be the basis for sizing the cyclone and determining the cyclone pressure drop. The
recommended sizes for 1D3D, 2D2D, and 1D2D cyclones are reported in this paper.
REFERANCES
1. Alexander, R. M. K. ~1949!. ‘‘Fundamentals of cyclone design and operation.’’ Proc. Aust. Inst. Min. Met.
(New Ser.), 152/3, 202
2. Casal, J., and Martinez-Benet, J. M. ~1983!. ‘‘A better way to calculate cyclone pressure drop.’’ Chem.
Eng., 90~3!, 99–100.
3. Leith, D., and Licht, W. ~1972!. ‘‘The collection efficiency of cyclone type particle collectors.’’ AIChE
Symp. Ser., 68~126!, 196–206. Licht, William ~1988!. Air pollution control engineering, Marcel Dekker,
New York.
4. Economopoulou, A. A., and Economopoulos, A. P. ~2001!. ‘‘Method for estimating size-specific particulate
emission inventories.’’ J. Environ. Eng., 127~12! 1139–1148.
5. Mothes, H., and Loffler, M. ~1988!. ‘‘Prediction of particle removal in cyclone separators.’’ Int. Chem.
Eng., 28~2!, 231–240
6. Salcedo, R. L. ~1993!. ‘‘Collection efficiencies and particle size distributions from sampling cyclones—
Comparison of recent theories with experimental data.’’ Can. J. Chem. Eng., 71, 20–27.
7. Kalen, B., and Zenz, F. A. ~1974!. ‘‘Theoretical-empirical approach to saltation velocity in cyclone design.’’
AIChE Symp. Ser., 70~137!, 388. Koch, W. H., and Licht, W. ~1977!. ‘‘New design approach boosts
cyclone efficiency.’’ Chem. Eng., 84~24!, 80.
8. Shepherd, C. B., and Lapple, C. E. ~1939!. ‘‘Flow pattern and pressure drop in cyclone dust collectors.’’ Ind.
Eng. Chem., 31, 972
9. Koch, W. H., and Licht, W. ~1977!. ‘‘New design approach boosts cyclone efficiency.’’ Chem. Eng.,
84~24!, 80.
International Conference on Emerging Trends in Technology, Science and Upcoming Research in Computer Science
DAVIM, Faridabad, 25th April, 2015 ISBN: 978-81-931039-3-7
193 | P a g e
A REVIEW OF MAJOR NON-CONVENTIONAL
ENERGY SOURCES Prakash Kumar Sen1, Krishna Awtar2, Shailendra Kumar Bohidar3
1Student of M.Tech. Manufacturing Management, BITS Pilani (India) 2Student of Mechanical Engineering, Kirodimal Institute of Technology, Chhattisgarh, (India)
3Ph.D. Research Scholar, Kalinga University, Raipur (India)
ABSTRACT Energy is the key input to drive and improve the life cycle. Primarily, it is the gift of the nature to the mankind in
various forms. The consumption of the energy is directly proportional to the progress of the mankind. With ever
growing population, improvement in the living standard of the humanity, industrialization of the developing
countries, the global demand for energy is expected to increase rather significantly in the near future. The
primary source of energy is fossil fuel, however the finiteness of fossil fuel reserves and large scale
environmental degradation caused by their widespread use, particularly global warming, urban air pollution
and acid rain, strongly suggests that harnessing of non-conventional, renewable and environment friendly
energy resources is vital for steering the global energy supplies towards a sustainable path. This paper
describes in brief the non-conventional energy sources and their usage in India.
I. INTRODUCTION
The energy crisis which began in 1973 caused petroleum supplies to decrease and prices to rise exorbitantly.
This crisis forced developing countries to reduce or postpone important development programs, so they could
purchase petroleum to keep their economies operating. It created the urgent necessity to find and develop
alternative energy sources, such as other fossil fuels (coal, gas), nuclear energy, and renewable energy
resources. Coal is found primarily in industrialized countries, with Latin American and African reserves making
up less than 1 percent of the world total. Thus, it is unlikely that this part of the Third World will be able to use
large quantities of coal. The nuclear alternative is undesirable; the associated accident risks, waste disposal
difficulties, nuclear terrorism, and nuclear weapon proliferation are dangerous in themselves, and make this
form of energy excessively expensive (Brown et al, no date). Acquiring nuclear energy from the industrialized
world could, moreover, result in greater technological and economic dependence on developed countries. A
more feasible alternative to petroleum, coal, and nuclear reactors in developing countries is
the direct and indirect use of solar energy, which is renewable, abundant, decentralized and non-polluting.
Each day, the sun sends to earth many thousands of times more energy than we attain from other sources (the
equivalent of 200 times the energy consumed by the United States of America in one year). This energy can be
captured directly as radiation or - even more significantly - indirectly in waterfalls, wind, and green plants.
Countries in the humid tropics in particular contain enormous forest biomass resources, which, properly
managed, could significantly contribute to the solution of their energy problems, as well as provide wood for
other uses. Countries in the humid tropics also possess abundant water resources and high levels of solar
radiation, which show promise in generating electrical and thermal energy. To modify the running headings,
select View | Header and Footer. Click inside the text box to type the name of the journal the article is being
International Journal of Science, Technology & Management www.Ijstm.com
Volume No 04, Special Issue No. 01, April 2015 Issn (Online): 2394-1537
194 | P a g e
submitted to and the manuscript identification number. Click the forward arrow in the pop-up tool bar to modify
the header or footer on subsequent pages. The contemporary non-conventional sources of energy like wind, tidal,
solar etc. were the conventional sources until James Watt invented the steam engine in the eighteenth century.
In fact, the New World was explored by man using wind-powered ships only. The non-conventional sources are
available free of cost, are pollution-free and inexhaustible. Man has used these sources for many centuries in
propelling ships, driving windmills for grinding corn and pumping water, etc. Because of the poor technologies
then existing, the cost of harnessing energy from these sources was quite high. Also because of uncertainty of
period of availability and the difficulty of transporting this form of energy, to the place of its use are some of the
factors which came in the way of its adoption or development. The use of fossil fuels and nuclear energy
replaced totally the non-conventional methods because of inherent advantages of transportation and certainty of
availability; however these have polluted the atmosphere to a great extent. In fact, it is feared that nuclear
energy may prove to be quite hazardous in case it is not properly controlled.
II. ENERGY SCENARIO
India ranks sixth in the world in total energy consumption, whereas more than 70% of its primary energy needs
are being met through imports, mainly in the form of crude oil and natural gas. Coming to the power generation
in the country, India has increased installed power capacity from 1362 MW to over 112,058 MW since
independence and electrified more than 500,000 villages. This achievement is impressive but not sufficient. It is
a matter of concern that 44% of households do not have access to the electricity (Census 2001) and as many as
80,000 villages are yet to be electrified. The electricity supply is not even sufficient for those who have been
connected. The country still encounters peak and energy shortage of 7.7% and 12.3% respectively (Up to Aug
’05). The annual per capita consumption of 580Kwh is amongst the lowest in the world. The Ministry of Power
has now drawn a road map to ensure ‘power on demand’ by 2012. The anticipated demand as per 16th Electric
Power Survey requires an addition of 1, 00,000 MW. In other words, the achievements of more than five
decades need to be replicated in the next decade. This requires resources of Rs.8, 00,000 cores. The task is
daunting but not unachievable. India has a vast hydro potential of 150,000 MW out of which only 17% has been
tapped so far. Then there are coal reserves to last for more than 200 years along with other exploitable energy
reserves such as oil and gas etc. Even the potential of renewable is 82,000 MW. It is significant that the ministry
envisions adding 10,000MW up to 2012 through non-conventional energy sources alone. Till now, the total
installed capacity based on these sources is only about 6422 MW consisting of 3595 MW wind, 1705 MW small
hydro, 750 MW biomass, 264 KW solar, 66 MW gasifies and 42 MW from urban/industrial waste energy. This
constitutes only 7.8% of total installed capacity in the country. The MOP (Ministry of Power) has drafted New
and Renewable Energy Policy Statement 2005 issuing guidelines to indigenously develop new and renewable
energy technologies, products & services, at par with international standards, specifications, and performance
parameters for deployment in a manner so as to arrive at an optimal fuel-mix that most effectively meets the
overall concerns of the country. To ensure integrated development, a Coordination Committee for Power has
been constituted for close coordination amongst the concerned Ministries to deliberate on issues pertaining to
generation programmers, evacuation schemes, operational issues and grid related problems. India has pioneered
in the world in many administrative actions of renewable energy promotion, such as; ¾ Electricity regulatory
commission within liberalized market, 1991
¾ Mandatory environmental audits for power projects, 1992
International Journal of Science, Technology & Management www.Ijstm.com
Volume No 04, Special Issue No. 01, April 2015 Issn (Online): 2394-1537
195 | P a g e
¾ Energy conservation bill, 2000
¾ Renewable energy promotion bill, 2005.
Today, India is among the leaders in the world in utilization of several RE technologies.
Energy generated by using wind, tides, solar, geothermal heat, and biomass including farm and animal waste as
well as human excreta is known as non-conventional energy. All these sources are renewable or inexhaustible
and do not cause environmental pollution. More over them do not require heavy expenditure.
III. WIND ENERGY
The wind wheel, like the water wheel, has been used by man for a long time for grinding corn and pumping
water. Ancient seamen used wind power to sail their ships. With the development of the fossil fuelled and
hydro-electric plants, there was decline in the use of wind power due to the less cost involved in the new
methods. Another difficulty with wind power was the problem of energy storage. The energy could not be made
available, on demands, due to uncertainties of wind. Due to these two reasons, no further attempt was made to
develop wind power for large scale power generation.
In recent years, however, as a result of energy crisis in the world, it has been decided to investigate all possible
means of developing power, as alternatives to fuel fired plants. The wind could supply a significant portion of
the world’s energy demand. An estimate by an American Professor indicates the potentialities of wind power.
According to him about 350,000 wind mills each rated for about 1250 KW to 2200 KW could develop power of
the order of 190,000 MW. With the advancement in the knowledge of aero-dynamics it has been possible to
build larger and more efficient wind power plants. A typical example is the 1250 KW installation at Grandpa’s
Knol in U.S.A. Whereas some success has been achieved in developing small and medium size plants, the
prospects of large scale generation i.e., 1 MW or above are not, as yet very encouraging.
Fig;3- Wind Energy
Wind power is harnessed by setting up a windmill which is used for pumping water, grinding grain and
generating electricity. The gross wind power potential of India is estimated to be about 20,000 MW, wind power
projects of 970 MW capacities were installed till March. 1998. Areas with constantly high speed preferably
above 20 km per hour are well-suited for harnessing wind energy.
IV. TIDAL ENERGY Sea water keeps on rising and falling alternatively twice a day under the influence of gravitational pull of moon
and sun. This phenomenon is known as tides. It is estimated that India possesses 8000-9000 MW of tidal energy
International Journal of Science, Technology & Management www.Ijstm.com
Volume No 04, Special Issue No. 01, April 2015 Issn (Online): 2394-1537
196 | P a g e
potential. The Gulf of Kutch is best suited for tidal energy. Tidal or lunar energy as it is sometimes called, has
been known to mankind since time immemorial. Various devices, particularly the mills were operated using
tidal power. In the past water supply of London was pumped to a water tower by a mill operated by the tidal
power (which consisted of a large paddle wheel, mounted on a raft and fastened between two of the piers of old
London Bridge). The tidal power has been used to irrigate fields in Germany and to saw firewood in Canada. Tides are caused by the combined gravitational forces of Sun and Moon on the waters of the revolving Earth.
When the gravitational forces due to the Sun and the Moon add together, tides of maximum range, called spring
tides, are obtained. On the other hand, when the two forces oppose each other, tides of minimum range, called
neap tides, are obtained. In one year there are approximately 705 full tidal cycles.
Fig4;- Tidal Energy
V. SOLAR ENERGY
Sun is the source of all energy on the earth. It is most abundant, inexhaustible and universal source of energy.
AH other sources of energy draw their strength from the sun. India is blessed with plenty of solar energy
because most parts of the country receive bright sunshine throughout the year except a brief monsoon period.
India has developed technology to use solar energy for cooking, water heating, water dissimilation, space
heating, crop drying etc.
Fig5;- Solar Energy
VI. GEO-THERMAL ENERGY
Geothermal energy is a very clean source of power. It comes from radioactive decay in the core of the Earth,
which heats the Earth from the inside out and thus energy/power can be extracted owing to the temperature
difference between hot rock deep in the earth and relatively cool surface air and water. This requires that the hot
rock be relatively shallow, so it is site - specific and can only be applied in geologically active areas.
It can be used in two ways:
• Geothermal heating
• Geothermal electricity
As stated above, the geothermal energy from the core of the Earth is closer to the surface in some areas than in
International Journal of Science, Technology & Management www.Ijstm.com
Volume No 04, Special Issue No. 01, April 2015 Issn (Online): 2394-1537
197 | P a g e
others. Where hot underground steam or water can be tapped and brought to the surface it may be used directly
to heat and cool buildings or indirectly it can be used to generate electricity by running the steam/gas turbines.
Even otherwise, on most of the globe, the temperature of the crust a few feet below the surface is buffered to a
constant 7-14 degree Celsius, so a liquid can be pre-heated or pre-cooled in underground pipelines, providing
free cooling in the summer and heating in the winter by using a heat pump.
Geo-thermal energy is the heat of the earth's interior. This energy is manifested in the hot springs. India is not
very rich in this source,
Fig6:- Geo-Thermal Energy
6.1 Energy from Biomass Biomass refers to all plant material and animal excreta when considered as an energy source. Some important
kinds of biomass are inferior wood, urban waste, biogases, farm animal and human waste. Biogas is based upon
the use of dung to produce gas which is used as domestic fuel especially in the rural areas. This technique is
based on the decomposition of organic matter in the absence of air to yield gas consisting of methane (55%) and
carbon dioxide (45%) which can be used as a source of energy. This energy is piped for use as cooking and
lighting fuel in specially designed stoves and lamps respectively. It can also be used for replacing diesel oil in
dual fuel engines for generation of motive power and electricity. The left-over digested slurry serves as enriched
manure. Biogas technology is taking deep roots in rural India because of certain inherent advantages. Biogas
has higher thermal efficiency when compared with kerosene, firewood, dung and charcoal. It is observed that
the thermal efficiency of gobar gas is 60 per cent while dung, which is commonly used in villages for cooking,
has only 11 per cent thermal efficiency. Thus the use of gobar gas fuel is advantageous from the point of view
of not only fuel efficiency but also fuel saving.
International Journal of Science, Technology & Management www.Ijstm.com
Volume No 04, Special Issue No. 01, April 2015 Issn (Online): 2394-1537
198 | P a g e
Fig7:- Biomass Power
REFERENCES [1] Wikipedia Google search.
[2] G.D. RAI non conventional energy sources.
[3] K.S.Sidhu Director/Research, Punjab State Electricity Board, PEC Campus, Chandigarh
[4] S P Sukhatme, Solar Energy – Principles of thermal Collection & Storage – Tata McGraw Hill Publishing
company ltd., New Delhi
[5] NAVAL SINGH Department of Electrical Engineering National Institute of Technology Rourkela NON-
CONVENTIONAL ENERGY SOURCES.
[6] C.R Bhattacharjee, “Wanted an aggressive Outlook on Renewable Energy,” Electrical India, vol. 45 No 11,
pp. 147-150, Nov. 2005.
[7] Pradeep K Katti, Dr.Mohan K. Khedkar, “Photovoltaic and Wind Energy,” Electrical India, vol. 45 No 11,
pp. 151-155, Nov. 2005.
[8] Kadambini Sharma, “Renewable Energy: The way to Sustainable Development,” Electrical India, vol. 42
No 14, pp. 20-21, Jul. 2002.
[9] Sri Shali Habibulla M.Tech (Ref & A/c), Hons. C.H.E. M.I.S.T.E. Department of Rural Engineering
Technician Govt. Junior College, Non Conventional Energy sources.
[10]. S.P.Sukhatme, J.K.nayak. Solar Energy-Principle of Thermal energy collection and storage. Delhi: Tata
McGraw Hill Publishing Company Ltd., 2008.
[11] Peter Meisen “ Overview of sustainable renewableenergy potential in India “ GENI, Jan 2010.
International Conference on Emerging Trends in Technology, Science and Upcoming Research in Computer Science
DAVIM, Faridabad, 25th April, 2015 ISBN: 978-81-931039-3-7
1Student of M.Tech. Manufacturing Management, BITS Pilani (India) 2Student of Mechanical Engineering, Kirodamal Institute of Technology, Chhattisgarh, (India)
3Ph.D. Research Scholar, Kalinga University, Raipur(India)
ABSTRACT In present study, A spark ignition and a compression ignition engine with unfold valve scavenging of the
cylinder and a transfer valve in the piston crown have been described. A great disadvantage of two-stroke
engines is ports which are made in the cylinder bearing surface. Under the heat which is realised during the
combustion, the thermal extension of the range in proximity of the ports and other parts of the cylinder is
different and so the distortion of the geometry of the cylinder liner surface force the designer to make the
clearance between the piston and the cylinder liner bigger. This paper presents the critical review to study the
effect of fuel injection timing and scavenging using diesel on the combustion and emission characteristics of a
single cylinder, two stroke, air cooled direct injection diesel engine. It is well known that injection strategies
including the injection timing and pressure play the most important role in determining engine performance,
especially in scavenging emissions. However, the injection timing and pressure quantitatively affect the
performance of the diesel engine.
Keywords: Scavenging, Two Stroke Engine, Valve,
I. INTRODUCTION
In the Internal combustion engine, At the end of the expansion stroke the combustion of a two-stroke engine is
left full of product of combustion, this is because unlike four-stroke engine, this is no exhaust stroke available to
clear the cylinder of burnt gases , the process of clearing of cylinder, after the expansion stroke, is called
scavenging process, this must completed in a very short duration available between the end of the expansion
stroke end start of the charging process.
The efficiency of two stroke engine depend to a great degree on the effectiveness of the scavenging process,
since bad scavenging gives a low mean indicate pressure and hence, result in a high weight and high cost per
bhp for the engine. With insufficient scavenging the amount of oxygen available is low so that the consequent
incomplete combustion results in higher specific fuel consumption. Not only that, the lubricating oil becomes
more contaminated, so that its lubricating qualities are reduced and results in increased wear of system and
cylinder liners. Poor scavenging also leads to higher mean temperatures and grater heat stresses on the cylinder
walls.[1]
The NOx is produce data great extent, due to the high local temperatures found in Diesel engines which are
highly dependent on the initial rise of heat release. In addition, soot production and oxidation are both dependent
on the mixing rate and local flame temperatures [2]. The injection velocity is one of the most influent
parameters on the factors (which are mentioned before), since it controls both the mixing process and the rate of
heat release. This is the reason that injection system parameters and nozzle geometry have been extensively
International Conference on Emerging Trends in Technology, Science and Upcoming Research in Computer Science
DAVIM, Faridabad, 25th April, 2015 ISBN: 978-81-931039-3-7
200 | P a g e
studied due to their direct relation with the fuel injection rate and fuel velocity. To support this, it has been
recognized that the characteristics of the injection system are the most important fact or sin influencing
emissions and performance of CI engines.[3,4] II.THE SCAVENGING PROCESS
Before discussing the scavenging process, it is useful to describe the operation cycle of the two-stroke engine
with direct injection. For this purpose, an engine with scavenge and Exhaust ports instead valves will be
considered. At the beginning of the cycle, when fuel Injection and ignition have just taken place, the piston is at
the TDC (top dead center). The temperature and pressure rise and consequently the piston is driven down, Fig. II
(a) (note that the arrows indicate the direction of the piston). Along the power stroke, the exhaust ports are
uncovered (opened) and, consequently, the burnt gases begin to flow out, Fig. II (b). The piston continues down.
When the piston pasts over (and consequently opens) the scavenge ports, pressurized air enters and drives out
the remaining exhaust gases, Fig. II (c). This process of introducing air and expelling burnt gases is called
scavenging. The incoming air is used to clean out or scavenge the exhaust gases and then to fill or charge the
space with fresh air. After reaching BDC (bottom dead center), the piston moves upward on its return stroke.
The scavenge ports and then the exhaust ports are closed, Fig. II (d), and the air is then compressed as the piston
moves to the top of its stroke. Soon before the piston reaches TDC, the injectors spray the fuel, the spark plug
The function of electrostatic precipitator (ESP) is to collect the fly ash particles from the gases by electrostatic
principle. Electrostatic precipitators are particulate collection devices that utilize electrical energy directly to
assist in the removal of the particulate matter. They have been successfully used for removal of fine dusts from
all kinds of waste gases with very high efficiency. The principle on which this equipment operates when a gas
containing aerosols is passed between two electrodes that are electrically potential, aerosol particles precipitate
on low potential electrode[1]. An ESP is designed for a particular industrial application. Building an ESP is a
costly endeavor, so a great deal of time and effort is expended during the design stage. Manufacturers use
various methods to design ESPs. They also consider a variety of operating parameters that affect collection
efficiency including resistivity, electrical sectionalization, specific collection area, aspect ratio, gas flow
distribution, and corona power.
II.TYPES OF ELECTROSTATIC PRECIPITATORS
ESPs can be grouped, or classified, according to a number of distinguishing features in their design. These
features include the following:
1) The structural design and operation of the discharge electrodes (rigid-frame, wires or plate) and
collection electrodes (tubular or plate)
2) The method of charging (single-stage or two-stage)
International Conference on Emerging Trends in Technology, Science and Upcoming Research in Computer Science
DAVIM, Faridabad, 25th April, 2015 ISBN: 978-81-931039-3-7
205 | P a g e
3) The temperature of operation (cold-side or hot-side)
4) The method of particle removal from collection surfaces (wet or dry)
In this paper only described the types of Electrostatic precipitator based on structural design and operation of
discharge electrodes Tubular and Plate ESPs.
2.1 Tubular Tubular precipitators consist of cylindrical collection electrodes (tubes) with discharge electrodes (wires)
located in the center of the cylinder (Figure 1-10). Dirty gas flows into the tubes, where the particles are
charged. The charged particles are then collected on the inside walls of the tubes. Collected dust and/or liquid is
removed by washing the tubes with water sprays located directly above the tubes. The tubes may be formed as a
circular, square, or hexagonal honeycomb with gas flowing upward or downward. A tubular ESP is tightly
sealed to minimize leaks of collected material
.
Fig:-1. Gas flow through a tubular precipitator [2] Tube diameters typically vary from 0.15 to 0.31 m (0.5 to 1 ft), with lengths usually varying from 1.85 to 4.0m
(6 to 15 ft). Tubular precipitators are generally used for collecting mists or fogs, and are most commonly used
when collecting particles that are wet or sticky [2]. Tubular ESPs have been used to control particulate
emissions from sulfuric acid plants, coke oven byproduct gas cleaning (tar removal), and iron and steel sinter
plants.
2.2 Plate Plate electrostatic precipitators primarily collect dry particles and are used more often than tubular precipitators.
Plate ESPs can have wire, rigid-frame, or occasionally, plate discharge electrodes. Figure 1-11 shows a plate
ESP with wire discharge electrodes. Dirty gas flows into a chamber consisting of a series of discharge electrodes
that are equally spaced along the center line between adjacent collection plates. Charged particles are collected
on the plates as dust, which is periodically removed by rapping or water sprays. Discharge wire electrodes are
approximately 0.13 to 0.38 cm (0.05 to 0.15 in.) in diameter. Collection plates are usually between 6 and 12 m
(20 and 40 ft) high. For ESPs with wire discharge electrodes, the plates are usually spaced from 15 to 30 cm (6
to 12 in.) apart. For ESPs with rigid-frame or plate discharge electrodes, plates are typically spaced 30 to 38
cm(12 to 15 in.) apart and 8 to 12 m (30 to 40 ft) in height. Plate ESPs are typically used for collecting fly ash
from industrial and utility boilers as well as in many other industries including cement kilns, glass plants and
pulp and paper mills.[2]
International Conference on Emerging Trends in Technology, Science and Upcoming Research in Computer Science
DAVIM, Faridabad, 25th April, 2015 ISBN: 978-81-931039-3-7
206 | P a g e
Fig:-2. Gas flow through plate precipitator[2]
III.GENERAL REMARKS
Electrostatic precipitators are mainly used for particles >1 mm, with dust resistivity’s between approximately
104 and 1011 Ω cm. Particles with very high resistivity cause problems due to back corona effects, whereas
conductive particles may reverse their charge and thus do not adhere to the collecting electrode (reentrainment)
[H.J. White, Entstaubung; Industrieller Gase mit Elektrofiltern, VEB Verlag, 1969.]. When the gas contains
condensable components or liquid particles, clogging causes problems in all dry operating separators. As
alternative, wet electrostatic precipitators may be employed, which show outstanding collection efficiencies and
moderate power consumption. In this study, a wet tubular ESP is investigated. Tubular ESPs have the advantage
that scale-up is straightforward once the operational behaviour in one single tube has been investigated. various
methods to reduce soot particulate matter developed continually. In this case, negative collection efficiency,
where the number of particles of downstream is greater than that of upstream must be studied in an experimental
ESP [3], [4].
Fig:-3. Process involve in ESP [4]
High-collection-efficiency systems for carbon particles were achieved by using an ESP as an agglomerator [5],
[6],and and by mixing water mist with gases [7]. Mitchner and Self [8], Kobashi [9], Kildeso et al. [10], and
Laitinen et al. studied the effect of bipolar charging on the AC agglomeration efficiency of a parallel plate
agglomerator.
International Conference on Emerging Trends in Technology, Science and Upcoming Research in Computer Science
DAVIM, Faridabad, 25th April, 2015 ISBN: 978-81-931039-3-7
207 | P a g e
IV.PERFORMANCE OF ELECTROSTATIC PRECIPITATOR The performance of the electrostatic precipitator is described by a term called overall efficiency(ɳo) which is
expressed as
ɳo = Mass of particles retained by collector
Mass of all particles entering collectors
Dentsch has given a simple expression to calculate ɳo as given below
ɳo = 1-exp(-ACm0/Q)
where A = area of the plate(m2),
Q = flue gas volume flow rate for each plate,(m3/s)
Cm0= effective migration velocity of particles,(m/s)
= 2.95×10¹²K(E/s)2d
µ
K = 2.0
E = applied voltage(V)
s = distance between charging and collecting electrodes(m),
d = particle diameter(m)
µg = gas velocity,(kg/ms)
The performance of electrostatic precipitor is governed by corona characteristics resistivity of the particle,
rapping behavior, gas velocity, particle sizes and field strength.
Electrostatic precipitator is the most effective to remove very small particles like smoke, mist, and fly ash. Its
range of dust removal is sufficiently large (0.01µ to 1.00µ). The small dust particle below 10µ can not be
removed with the help of mechanical separation and wet scrubbers can not be used of sufficient water is not
available. Its efficiency is as high as 99.5%. The draught losses are also the least. [11]
V. SPECIFIC POWER ABSORPTION ON ESP EFFICIENCY
An indicator of improved particle collection efficiency in an ESP is an apparent increase in the power that is
used. Since the particle migration velocity is proportional to the voltage squared for field charged particles, it
follows for a given electrode configuration, which determines the voltage/current relationship, that the
efficiency is related to the specific power input (W/m3). It can be shown that the performance, or collection
efficiency.
Fig 4 Effect of Specific Power Absorption on ESP Efficiency and Effect of Gas Velocity on ESP
Efficiency[12]
International Conference on Emerging Trends in Technology, Science and Upcoming Research in Computer Science
DAVIM, Faridabad, 25th April, 2015 ISBN: 978-81-931039-3-7
208 | P a g e
VI. ADVANTAGES OF ELECTROSTATIC PRECIPITATORS
· Low maintenance and operating costs.
· High collection efficiency.
· Treatment time is negligible (0.1-10s).
· Low pressure drop (0.25-1.25 cm of water).
· Cleaning is easy by removing units of the precipitator from operation.
· Particles as small as 0.1 µ m can be removed.
· Satisfactory handling of large volume of high temperature gas
VII. APPLICATIONS OF INDUSTRIAL PRECIPITATORS
The important applications of electrostatic precipitators in industries is following
1. Steel plants
(a) cleaning blast furnace gas to use it as a fuel
(b) removing tars from coke oven gases
(c) cleaning open hearth and electric furnace gases
2. Chemical industry
(a) removing the dust from elemental phosphorus in the vapour state
(b) collection of sulphuric and phosphoric acid mist
(c) cleaning various types of gases such as hydrogen, CO2 and SO2
3. Cement factories
(a) cleaning the flue gases from cement kiln
(b) recovery of cement dust from kilns
4. Petroleum industry
(a) recovery of catalyst dust
5. Pulp and paper mills
(a) soda-fume recovery in Kraft pulp mills
6. Electric power industry
(a) collecting fly ash from coal-fired boilers
7. Non-ferrous metals industry
(a) recovering valuable material from flue gases.
(b) collecting acid mist.
8. Carbon black industry
(a) agglomeration and collection of carbon black.
VIII. CONCLUSION
All types of Electrostatic precipitators use electrostatic attraction to control particulate matter and can handle
large volume of gases at low pressure drops. In an ESP, pollutant particles are electrically charged and then
collected on collection electrodes. When the discharge and collection electrodes are rapped, the collected
particles fall into a hopper and are removed. In this paper we introduce the two types of electrostatic
precipitator, but all types of electrostatic precipitator are their own importance in their places. In modern world
International Conference on Emerging Trends in Technology, Science and Upcoming Research in Computer Science
DAVIM, Faridabad, 25th April, 2015 ISBN: 978-81-931039-3-7
209 | P a g e
world the pollution is a great problem which affect every body indirectly. To reduce the the pollution by dust
particles, the ESP is very effective dust collection device.
REFERENCES
[1] M N Rao, H V Rao, Air Pollution, Professor-in-Charge, Technical Teachers” Extension Centre,
Bangalore,ISBN 0-07-451871-8
[2] Beachler, D. S., J. A. Jahnke, G. T. Joseph andM.M. Peterson. 1983. Air Pollution Control Systems for
Selected Industries-Self-Instructional Guidebook. (APTI Course SI:431). EPA 450/2-82-006. U.S.
Environmental Protection Agency
[3] Ito, T., Kubota, T., Zukeran, A., Takeo, K. Shinkai, and Miyamoto, M. Collection 1995. Characteristics of
submicron particles on electrostatic precipitator, Journal of Inst. Elect. Install. Eng. Japan. 15(2): 113–120.
[4] Zukeran, A. Ito, T. Takahashi, T. and Kawakami, H. 1996. Effect of water on agglomeration and collection
efficiency in electrostatic precipitator, Journal of Inst. Elect. Install. Eng. Japan, 16(12): 1288–1296.
[5] Isahaya, N. 1967. Development on electrostatic pre-coagulator combined with after-cyclone dust collector, J.
Hitachi-Hyoron 49: 77.
[6] Masuda, S. Moon, J. D. and Aoi, K. 1980. AUT-AINER precipitator system-An effective control means for
1Ph.D. Research Scholar, Kalinga University, Raipur(India) 2Student of Mechanical Engineering, Kirodimal Institute of Technology, Chhattisgarh, (India)
3Student of M.Tech Manufacturing Management, BITS Pilani (India)
ABSTRACT
This system will be presented in this paper application are explain the steam jet refrigeration system the aim of
this paper is to develop the jet refrigerator and the test under the actual ambient condition in the word it is dri-
ven by low grade thermal energy .refrigerator can operated actual ambient condition cooling water produced-
chilling water from 10to 5about 1 parcet of water flowing through evaporator most be v porized analysis of re-
frigeration system .plant have a robust opretion and be easily manufactured at relatively low cost with off the
shelf components . This paper presents a plant concept of a solar-driven steam jet ejector chiller with latent heat
and cold storage. The concept will be realized in a first demonstration plant. The solar cooling plant will consist
of a solar collector field based on evacuated tube collectors with a thermal output of 200 kW, a double stage
steam jet ejector chiller with a cooling capacity of 80 kW and two thermal energy storage units, meaning a heat
storage unit using polyethylene as latent heat storage medium and a cold storage unit using a paraffin/water
dispersion as latent cold storage fluid. While designing the solar cooling plant some preliminary research works
have been accomplished with special regard to the development and integration of the heat and cold storage
units. The results of this research as well as the overall design of the system will be presented in this paper.
I. INTRODUCTION
The esteam jet refrigeration cycle is quite similar to more conventionl refrigeration cycle, with in evaporator, a
compression devices, a condenar and refrigretor as the basic system components .this system instead of mechan-
ical compression device characteristically employs a steam ejector booster to compress the refrigerant to the
condenser pressure level Suparsonic ejector may be seen
Jet refrigeration system, which is one of the heat-powered refrigeration cycles, is of current interest. The distinc-
tive point osuch cycle is that it is relatively simple to design, construct and operatecompared to the other types
of heat-powered refrigeration systems. In this cycle, the importantequipment known as an ejector is used as a
main driving part for the system. This is because an ejector isused to elevate refrigerant pressure similar to the
use of a mechanical compressor as a modern evalution of the injector invented by henry Giffard in 1858 and
used thereafter for feeding water to steam boilers (jet pump)or creating vacuum in rail brake system .in a refrige-
ration system the ejector may substitute the compressor and hence produce a heat driven machine with a boiler
,evaporator and condenser (fig.1)
International Conference on Emerging Trends in Technology, Science and Upcoming Research in Computer Science
DAVIM, Faridabad, 25th April, 2015 ISBN: 978-81-931039-3-7
211 | P a g e
Fig.1 Steam Jet Refrigeration Cycle High pressure vapor is produced in the genera (point G ) .flow through the primary nozzle of the ejector and ,as
it enters the mixing chamber .entrains the secondry fluid being drawn from the evaporator (point E).the com-
bined flow is then compressed as it flow through the diffuser section of the ejector into the condenser (point C)
the codenset (point A) is split into two stream ;one is expnded through a throttling valve and fed back to the
evaporator whilst the other is returned via a feed pump to the boiler to maintain the refrigerator leval .The sys-
tem COP .pump work usully modest ,is approximation given by:
CPO= =
Where is the entrainment ratio between secondry and primary mass flow rate .for a given fluid
,therefor the system performance is mainly by the entrainment ratio which in turn is a fuction;
pressure ratio = and = and and ,subscripts c,E and G referring to condenser
,evaporators and genretors while D and mixer and primary nozzle throats .hence the fundmentl problem when
designing an ejector chiller is the optimization of the internal flow occurring within the ejector chillers
,entrainment ratio reported in the literature.
Green house gas (GHG) emission that is generated during electricity generation is released increasingly to the
environment .this reflects the fect that refrigeration and air –conditioning systems are one of the high emitters of
GHGto the environment. To reduce the demand of electricity for refrigeration application, alternative refrigera-
tion system that can be opreted by using thermal energy,heat-powered refrigeration cycle, is introduced at
present time.
II. PRINCIPALE OF STEAM JET REFRIGERATION SYSTEM:-
Fig.2 Steam Jet Refrigeration System When external pressure on a liqud changes,its boiling point also changes. Normally, atmospheric pressure act on
International Conference on Emerging Trends in Technology, Science and Upcoming Research in Computer Science
DAVIM, Faridabad, 25th April, 2015 ISBN: 978-81-931039-3-7
212 | P a g e
the surface on liquid .howevere, if by some means this pressure is reduced then liquid wiil start boling at lower
temperature.this basic principal of boiling of liquid at low temperature dy reducing the pressure on it surface is
used in steam jet refrigeration system. The pure water boil at 100 C at standard pressure of 760mm of
Hg (1.013bar).it has been observed that water boils at 12 0C and 70C if the pressure on the surface of water are kept at
0.014bar and 0.01bar respectively.the very low pressure or high vacuum on the surface of the water can be main-
tained by throttling the steam through the jets or nozzles.
III. DESCRIPTION OF SYSTEM COMPONENTS
The component of steam jet refrigeration system is brifly described below:-
3.1 Evaporator The evaporator orflash chamber is a large vessel and is heavily insulated to avoid the rise in temperature of wa-
ter due to highy ambient temperature. It is fitted with perforated pipesfoor spraying water.the warm water com-
ing out of the refrigerator space is sprayed into flash water chamber where some of which is converted into va-
pour after absorbing the latent heat. Thereby cooling the rest of water.
3.2 Steam Jet Ejector High pressure steam from the boiler(generally colled primary fluid or motive steam/vapour) is admitted to the
steam chest and expanded in convergent –divergent nozzle to a very low pressure and the attains supersonic
velocities in the range of 1000m/s to 1350m/s the flash chamber is connected to the region of low pressure of
the ejector the water vepour from the flash chamber is entrained in the highy velocity jet of steam and both are
mixed in the mixing section at the constent pressure .the men velocity of mixture will be super sonic after the
completion of the mixing process. This supersonic steam get a normal shock in constent area throt of diffus-
er,resulting in rise of pressure and subsonic flow.the diverting portion of the diffuser velocity head is recovered
as pressure head and finaly high pressure steam is condensed in condenser.
International Conference on Emerging Trends in Technology, Science and Upcoming Research in Computer Science
DAVIM, Faridabad, 25th April, 2015 ISBN: 978-81-931039-3-7
213 | P a g e
Fig.3 The Significant Dimention of The Ejectior and Nozzel Used For Testing The Refrigerator.
3.3 Condenser It is employed because of its compact size and ability to be located anywhere including .inside the building in
this case steam consumption is higher and larger surface condenser and cooling water will be required ite is
used to advantage in those installation which do not have space limitation and whear it is economically feasible
to treat the evaporator and boiler water on a onece through basis.
3.4 Air Ejector The air or non condensable gas ejector typically employs two small steam powered ejector in series an inter and
after condenser is often employed to improve economy in a tight system ,an air ejector unit will have capacity of
0.05kg of air per tone of refrigerator.
IV. THE COFFICIENT OF PERFORMANCE WITH THE VARIATTON OF COOLING CA-
PACITY
In order to analyze the system performance of the jet refrigerator, the well known term ,the coefficient of per-
formance (COP), is necessary to know because it indicates the overall performance of the refrigerator .the coef-
ficient of performance of the jet refrigrerator can be defined by equation COP= Where is
the cooling load produced at the evaporator Is the heat supplied to the boiler The heat supplied to the boi-
ler can be calculated by equation (5)
- )
Where, is the saturated vapour enthalpy produced by boiler (kj/kg),
Liquid enthalpy at the condenser (kj/kg)
Is the primary fluid mass flow rate (kg/s)
In this case, the primary fluid mass flow rate produced by the boiler can be calculated by equation (6)
= (2/k+1) k+1/[2(k-1]
Where, A is the cross section area of the primary nozzle throat(m2 ) is the boiler pressure(kPa) is the boiler
tempreture(K) ,K is the specific heat ratio,R is the ideal gas constant (kj/kg,k)
International Conference on Emerging Trends in Technology, Science and Upcoming Research in Computer Science
DAVIM, Faridabad, 25th April, 2015 ISBN: 978-81-931039-3-7
214 | P a g e
Fig.4 Variation of The COP With A Cooling Capacity It can see from fig. that with a fixed boiler temperature the COP of the jet refrigeration is increased linearly with
an increase in the cooling capacity. The lowest COP for the test is of 0.03for the cooling capacity of
500W.Meanwhile, the highest COPof 0.45 is obtained at the cooling capacity of 3000W.an increase of COP with
cooling capacity is the result of in increase in cooling capacity while the heat supplied to the boiler is kept con-
stant due to fixed boiler temperature.therefore,COP of the jet refrigerature is increased with cooling capacity. It
comes together with an undersired cooling.temperature, due to increase in the evaporator temperature.
IV. DESIGN OF STEAM JET REFRIGERATION SYSTEM
According to the results gathered with the first two ejectors, an increase in the mixing zone and diffuser lengthcan be
favorable, as long as theimprovement in terms of momentum exchange between primary and secondary flow balances
the increased friction loss. Hence the third ejector was designed with length between the flanges increased from 740 to
950 mm. The shape is a scaled up and modified version of a CRMC profile designed by Ian Eames. The last part is
shaped as a straight cone with 4° half angle. The inlet has a fillet that allows a smooth transition from the cylindrical
pipe upstream. The primary nozzle, for the moment, was left unchanged. The number of pressure ports was increased
to 9. Extensive testing has been carried out on this ejector. Stable operation is obtained with saturation temperatures of
5°C at evaporator and 100°C at generator. Primary nozzle position has been optimized and the best results have been
obtained with a displacement of 8 mm to the right with reference to the position shown in. shows the COP as a func-
tion of condenser saturation temperature. In this condition the critical condenser temperature is around36.2°C. Fig. 8b
shows how the increase in condenser temperature and pressure modifies the static pressure along theejector. At low
condenser pressure (lower curve) the flow is still supersonic at the diffuser throat and hence reexpandsafterwards.
This produces a normal shock somewhere in the divergent part of the diffuser. At intermediatecondenser pressurethe
normal shock moves leftwards (intermediate curves) until, at still higher pressure the shockovercomes the throat and
the ejectorceases to be supersonic. This corresponds to the last point on the right of Fig.8a and indicates a highly un-
stable working condition.When evaporator temperature is raised to 10°C, the COP increases to 0.29. This result is
lower than that reportedby Eames et al. in , but they used an higher generator temperature (110°C) and a bigger area
ratio, whichincreases COP but lowers critical condenser temperature. On the other hand, the experimental results
given in terms of entrainment ratio by Scott et al. in , when converted to COP, indicate a lower performance.
International Conference on Emerging Trends in Technology, Science and Upcoming Research in Computer Science
DAVIM, Faridabad, 25th April, 2015 ISBN: 978-81-931039-3-7
215 | P a g e
V. CASE STUDY OF REFRIGERATION SYSTEM
There are vast quantities of cooling requirements around Tushan Cogeneration Company, a power plant in An-
hui province of China. The total cooling load of the company reaches the number of 69780kW while the amount
of surplus steam quantities up to 240 ton per hour. The pressure of the surplus steam is1.27Mpa and the tem-
perature is 304℃. We are going to design an absorption system and a combined cycle system respectively for
district cooling in the power plant and then compare the results obtained. In China's current industry standard,
the driving steam of the double-effect Li-Br absorption refrigerator can be saturated steam at the pressure of
0.4MPa, 0.6MPa and 0.8MPa. We call the pressure at which the steam entering the absorption refrigerator as the
mid-pressure, and we have to carry out the thermodynamic calculation of combined cycle systems with different
mid-pressures. In the calculation, the total cooling load is divided into 20 units so that the capacity of each re-
frigerator is reasonable. The design conditions in the thermodynamic calculationThe result of thermodynamic
calculation and the consumption of superheated steam under the designed working conditions are listed in ta-
ble.2.Synthetic refrigeration coefficient means the refrigeration coefficient of the whole system: it is a combined
action of absorption refrigerator and temperature and pressure reducer in an absorption system, while it is a
combined action of compression refrigerator, superheated steam saturator and absorption refrigerator in a com-
bined cycle system. It reflects the refrigeration capacity of the whole system. It can be observed that combined
cycle system with the midpressure of 0.8MPa has the strongest refrigeration capacity. As the transfer efficiency
can reach up to 0.8 in actual operation, the energy conservation potential of combined cycle system can be pre-
dicted.[10]
VI. HEAT STORAGE MATERIAL OF THE PLANT
The function of the heat storage unit in the system is to ensure the constant supply of motive steam tothe SJEC.
Furthermore, the space for the erection of the heat storage unit is limited due to the intendedinstallatiointo the
container, so that the volume of the heat storage unit should be as small as possible.This leads to the use of a
phase changematerial (PCM) to realize a latent heat storage unit. The PCM isused as storage material which
stores heat energy in form of latent heat of fusion during a phase transitionover a temperature shift. The latent
heat of fusion of a material is higher than the sensible heat capacity ofthe material so that the use of a PCM al-
lows increasing the heat density of a storage unit and therefore toreduce its volume.In a first approach the oper-
ating temperature of the heat storage unit was assigned to be in the rangefrom 120 °C to 150 °C. In view of this
temperature range the listed storage materials in Table 1 wereconsidered for the heat storage unit.
International Conference on Emerging Trends in Technology, Science and Upcoming Research in Computer Science
DAVIM, Faridabad, 25th April, 2015 ISBN: 978-81-931039-3-7
216 | P a g e
In some preliminary tests the heat of fusion and the thermal stability of the material were investigated.The pre-
liminary tests were conducted in an oven and include heating-up and afterwards cooling down thematerial. This
procedure wasconducted 30 times, with constant measuring of the temperatures of theoven and the material. The
maximum temperature was 180 °C. Especially polyethylene shows a highspecific heat of fusion in combination
with a good thermal stability and market availability so thatpolyethylene was chosen as PCM for the heat stor-
age unit. The temperature curves and additionaldifferential scanning calorimetry (DSC) measurements before
and after the tests indicate no change of thetemperature range and the specific heat of fusion. But as depicted in
a visual change of the materialcan is observed so that it was decided to limit the maximum temperature of the
heat storage unit of the SJEC plant to 145 °C.[11]
VII. CONCLUSIONS
It is found that the prototype steam jet refrigerator can completely be operated with variousrange of the operat-
ing-condition and primary nozzle used which is suitable for air-conditioning system(chilled water produced by
refrigerator between 5°C and 17°C). The refrigerator can provide themaximum COP of 0.45 at the cooling ca-
pacity of 3000W, evaporator temperature of 17°C and boiler temperature of 110°C.
REFERENCES
[1]. R.K.Rajput.M.E.Hons Gold Medalist.grad M.I.E.(india) M.S.E.S.I.Refrigeration and air conditioning
.Stem jet refrigera tion system 2008(288-305)
[2]. .K.Chunnanond, S.Aphornratana; Ejectors ;application in refrigeration technology. J.Renewable and sus-
tainable energy Reviews, Vol.8,2004,pp,129-155
[3]. Da-Wen sun, solar powered combined ejector-vapour compression cycle for air conditioning and refrigera-
tion.J. energy Conversion and Managment,vol.38,No.5,1997,pp.479-491
[4]. Litvion F.L. Q.Lain and A.L. Kapelevich ,asymmetric modified gear drive reduction of noise Localization
of contact simula
[5]. R.K.Rajput.M.E.Hons Gold Medalist.grad M.I.E.(india) M.S.E.S.I.Refrigeration and air conditioning
.Stem jet refrigeration system 2008(288-305)
[6]. Eames IW., Aphornratana S., Haider H.; A theoretical and experimental study of a small-scale steam jet
refrigerator. J. International Journal of Refrigeration, Vol. 18, No.6, 1995, pp. 378-386.
[7]. Eames IW, Ablwaifa AE, Petrenko V. Results of an experimental study of an advanced jet-pump refrigera-
tor eraing with R245fa. Applied Thermal Engineering 2007; 27: 2833–2840
[9]. Scott D, Aidoun Z, Ouzzane M. An experimental investigation of an ejector for validating numerical