39
SEMI-ANNUAL REPORT J ANUARY 31, 2005 Davis New York Venture Fund
| Date post: | 14-Jul-2015 |
| Category: |
Economy & Finance |
| Upload: | freddy56 |
| View: | 1,828 times |
| Download: | 0 times |
SE
MI-
AN
NU
AL
RE
PO
RT
JAN UA RY 31, 2005
Davis New York Venture Fund
Table of Contents
Shareholder Letter....................................................................................................2
Management's Discussion and Analysis...............................................................3
Expense Example .....................................................................................................6
Fund Overview..........................................................................................................8
Schedule of Investments..........................................................................................9
Statement of Assets and Liabilities .....................................................................15
Statement of Operations........................................................................................17
Statements of Changes in Net Assets.................................................................18
Notes to Financial Statements..............................................................................19
Financial Highlights ................................................................................................27
Fund Information....................................................................................................32
Directors and Officers............................................................................................33
2
DAVIS NEW YORK VENTURE FUND2949 East Elvira Road, Suite 101Tucson, Arizona 85706
Dear Fellow Shareholder,
As stewards of our customers’ savings, the management team and Directors of the Davis New York VentureFund recognize the importance of candid, thorough, and regular communication with our shareholders. In ourannual and semi-annual reports, we include all of the required quantitative information, such as financialstatements, detailed footnotes, performance reports, fund holdings, and performance attribution.
In addition, we produce a Quarterly Review. In this Review, we give a more qualitative perspective on fundperformance, discuss our thoughts on individual holdings, and share our investment outlook. You may obtain acopy of the current Quarterly Review either at our website, www.davisfunds.com, or by calling 1-800-279-0279.
Sincerely,
Christopher C. DavisPresident
March 1, 2005
3
DAVIS NEW YORK VENTURE FUND2949 East Elvira Road, Suite 101Tucson, Arizona 85706
Management's Discussion and Analysis
Market Environment
During the six-month period ended January 31, 2005, the stock market, as measured by the Standard & Poor’s500® Index1, returned 8.15%. U.S. economic activity, as measured by the gross domestic product, fell sharply inthe third quarter then slowly increased through the fourth quarter of 2004. Interest rates, as measured by the 10-year Treasury bond, slowly declined from July through October of 2004, then slowly rose through January2005.
Performance Overview
Davis New York Venture Fund’s Class A shares delivered a total return on net asset value of 10.72% for thesix-month period ended January 31, 20052. Over the same time period the Standard & Poor’s 500®
Index1returned 8.15%. The Fund’s investment strategy is to seek out companies with expanding earnings thatcan be purchased at value prices and held for the long-term. Typically, the Fund invests the majority of itsassets in equity securities issued by large companies with market capitalizations of at least $10 billion.
The Fund’s largest holdings over the six-month period were in financial service companies, banks and savings& loan companies, and energy companies. The Fund’s holdings in all three sectors out-performed the S&P 500®
Index and contributed to the Fund’s performance.
Important contributors3 among the Fund’s energy holdings included ConocoPhillips4 and Devon Energy.ConocoPhillips increased by 18.49% and Devon Energy increased by 17.37%, over the six-month period endedJanuary 31, 2005.
Important contributors among the Fund’s bank and savings & loan holdings included Golden West Financial andHSBC Holdings. Golden West Financial increased by 21.12% and HSBC Holdings, after adjusting for exchangerates, increased by 14.73%, over the six-month period ended January 31, 2005. Another bank and savings &loan holding, Fifth Third Bancorp, was down 4.54% over the same time period, detracting from the Fund’sperformance.
Important contributors among the Fund’s financial service holdings included Citigroup, Loews, and AmericanExpress. Over the six-month period ended January 31, 2005, Citigroup increased by 12.26% and Loewsincreased by 20.66%. Over the same time period, American Express, the Fund’s largest holding, trailed the S&P500® Index, but still increased by 6.64%.
Altria Group, a consumer products company, merits special mention. The Fund’s large investment in thecompany coupled with its performance, up 37.73%, over the six-month period ended January 31, 2005, madeAltria Group the single largest contributor to the Fund’s performance. Other companies contributing toperformance included Tyco International, a diversified manufacturing company, and Costco, a discount retailcompany. Over the six-month period, Tyco International increased by 16.95% and Costco increased by 16.44%.
4
DAVIS NEW YORK VENTURE FUND2949 East Elvira Road, Suite 101Tucson, Arizona 85706
Management's Discussion and Analysis – Continued
Performance Overview – Continued
Individual companies detracting from performance included: American International Group, a multi-lineinsurance company, Marsh & McLennan, an insurance brokerage company, Iron Mountain, a business servicescompany, and two health care companies, Eli Lilly and Pfizer. Over the six-month period ended January 31,2005, American International Group decreased by 5.96%, Marsh & McLennan decreased by 26.23%, and EliLilly decreased by 13.85%. Iron Mountain decreased by 15.82% since being purchased in September 2004.Pfizer decreased by 17.87% before being sold in December 2004.
The Fund’s portfolio managers have identified a number of investment opportunities in foreign companies. TheFund had 12.95% of its portfolio invested in foreign companies at January 31, 2005. The Fund benefited fromthese foreign companies as they accounted for approximately 18% of the Fund’s gross performance over the six-month period ended January 31, 2005. The foreign companies that contributed most to the performance were:Julius Baer, an investment firm, and HSBC Holdings, mentioned above. Julius Baer increased by 30.06%, afteradjusting for exchange rates, over the six-month period ended January 31, 2005. Takefuji, a financial servicescompany, decreased by 1.76% over the same six-month period, and detracted from the Fund’s performance._________________________________________
This Semi-Annual Report is authorized for use by existing shareholders. Prospective shareholders must receive acurrent Davis New York Venture Fund prospectus, which contains more information about investmentstrategies, risks, charges, and expenses. Please read the prospectus carefully before investing or sending money.
Davis New York Venture Fund’s investment objective is long-term growth of capital. There can be no assurancethat the Fund will achieve its objective. The primary risks of an investment in Davis New York Venture Fundare: (1) market risk, (2) company risk, (3) foreign country risk, (4) financial services risk, (5) headline risk, and(6) selection risk. See the prospectus for a full description of each risk.
1 The S&P 500® Index is an unmanaged index of 500 selected common stocks, most of which are listed onthe New York Stock Exchange. The Index is adjusted for dividends, weighted towards stocks with large marketcapitalizations, and represents approximately two-thirds of the total market value of all domestic commonstocks. Investments cannot be made directly in the index.
5
DAVIS NEW YORK VENTURE FUND2949 East Elvira Road, Suite 101Tucson, Arizona 85706
Management's Discussion and Analysis – Continued
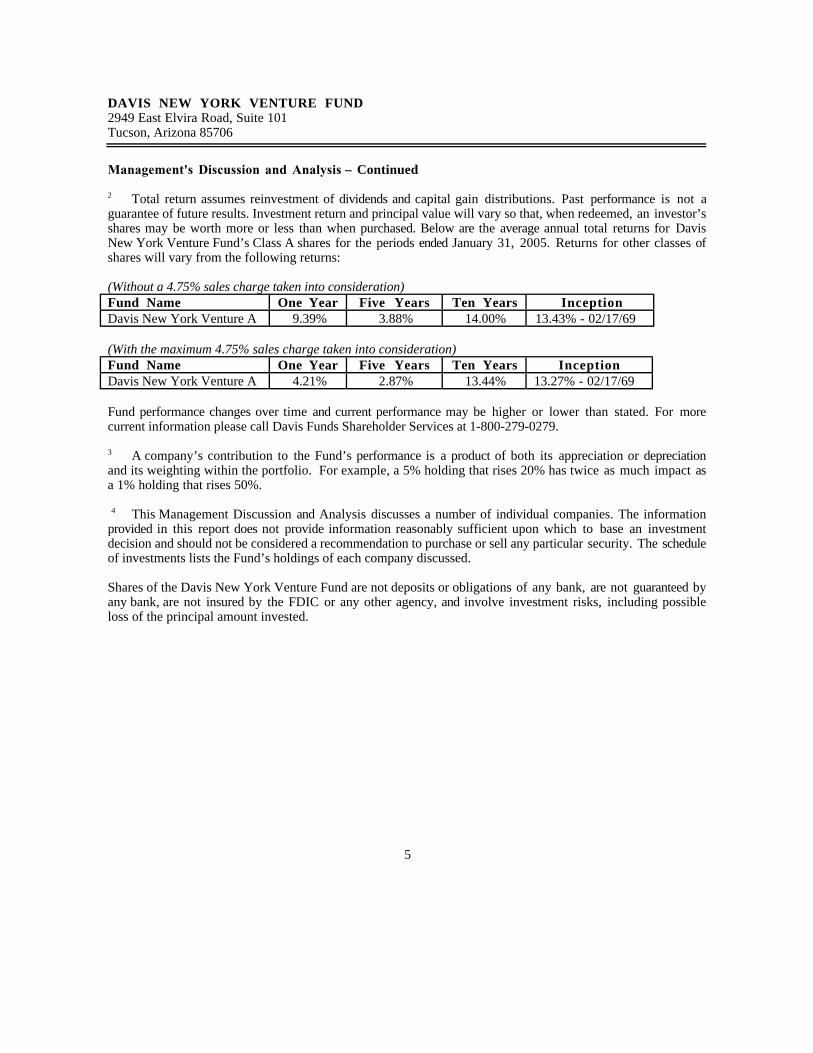
2 Total return assumes reinvestment of dividends and capital gain distributions. Past performance is not aguarantee of future results. Investment return and principal value will vary so that, when redeemed, an investor’sshares may be worth more or less than when purchased. Below are the average annual total returns for DavisNew York Venture Fund’s Class A shares for the periods ended January 31, 2005. Returns for other classes ofshares will vary from the following returns:
(Without a 4.75% sales charge taken into consideration)Fund Name One Year Five Years Ten Years InceptionDavis New York Venture A 9.39% 3.88% 14.00% 13.43% - 02/17/69
(With the maximum 4.75% sales charge taken into consideration)Fund Name One Year Five Years Ten Years InceptionDavis New York Venture A 4.21% 2.87% 13.44% 13.27% - 02/17/69
Fund performance changes over time and current performance may be higher or lower than stated. For morecurrent information please call Davis Funds Shareholder Services at 1-800-279-0279.
3 A company’s contribution to the Fund’s performance is a product of both its appreciation or depreciationand its weighting within the portfolio. For example, a 5% holding that rises 20% has twice as much impact asa 1% holding that rises 50%.
4 This Management Discussion and Analysis discusses a number of individual companies. The informationprovided in this report does not provide information reasonably sufficient upon which to base an investmentdecision and should not be considered a recommendation to purchase or sell any particular security. The scheduleof investments lists the Fund’s holdings of each company discussed.
Shares of the Davis New York Venture Fund are not deposits or obligations of any bank, are not guaranteed byany bank, are not insured by the FDIC or any other agency, and involve investment risks, including possibleloss of the principal amount invested.
6
DAVIS NEW YORK VENTURE FUNDExpense Example (Unaudited)
Beginning Ending Expenses PaidAccount Value Account Value During Period*
(08/01/04) (01/31/05) (08/01/04-01/31/05)Class A
Actual........................................... $1,000.00 $1,107.24 $4.73Hypothetical .................................. $1,000.00 $1,020.72 $4.53
Class BActual........................................... $1,000.00 $1,102.29 $9.01Hypothetical .................................. $1,000.00 $1,016.64 $8.64
Class CActual........................................... $1,000.00 $1,102.61 $8.96Hypothetical .................................. $1,000.00 $1,016.69 $8.59
Class RActual........................................... $1,000.00 $1,105.87 $6.00Hypothetical .................................. $1,000.00 $1,019.51 $5.75
Class YActual........................................... $1,000.00 $1,108.71 $3.14Hypothetical .................................. $1,000.00 $1,022.23 $3.01
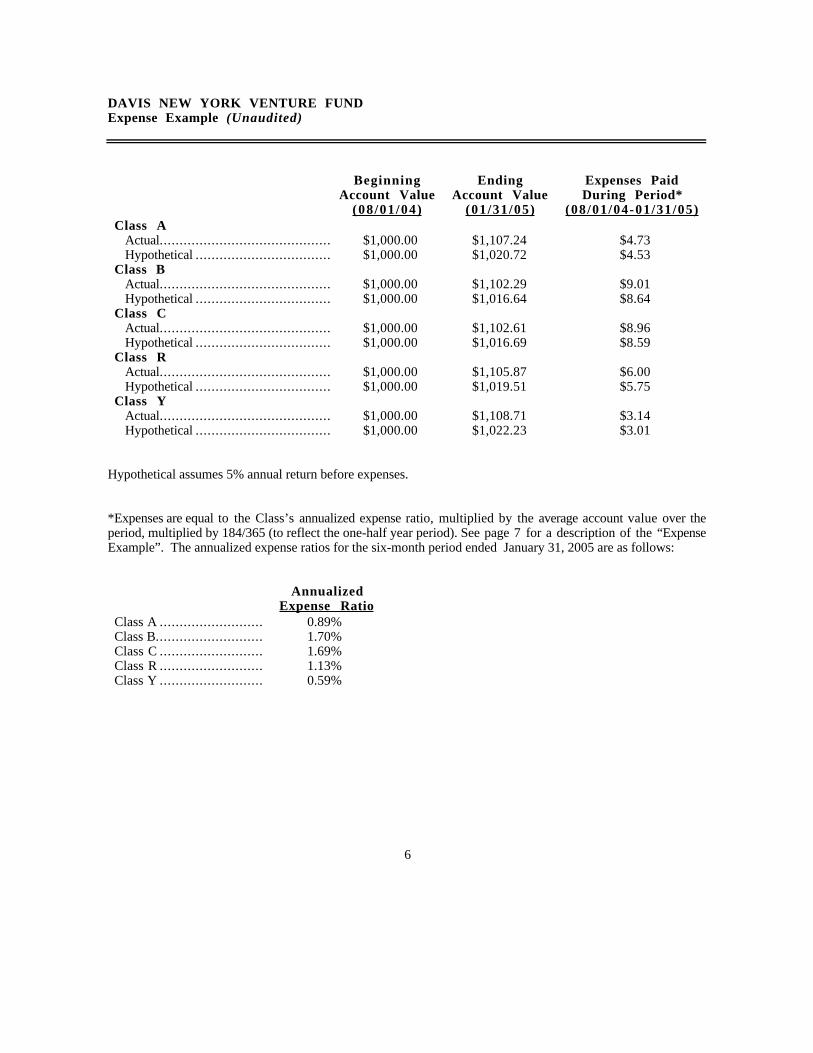
Hypothetical assumes 5% annual return before expenses.
*Expenses are equal to the Class’s annualized expense ratio, multiplied by the average account value over theperiod, multiplied by 184/365 (to reflect the one-half year period). See page 7 for a description of the “ExpenseExample”. The annualized expense ratios for the six-month period ended January 31, 2005 are as follows:
AnnualizedExpense Ratio
Class A .......................... 0.89%Class B........................... 1.70%Class C .......................... 1.69%Class R .......................... 1.13%Class Y .......................... 0.59%
7
DAVIS NEW YORK VENTURE FUNDExpense Example (Unaudited) – Continued
The following disclosure provides important information regarding the Fund’s ExpenseExample. Please refer to this information when reviewing the Expense Example for eachclass .
Example
As a shareholder of the Fund, you incur two types of costs: (1) transaction costs, including sales charges (loads)on purchases; and (2) ongoing costs, including advisory and administrative fees, distribution and/or service(12b-1) fees, and other Fund expenses. The Expense Example is intended to help you understand your ongoingcosts (in dollars) of investing in the Fund and to compare these costs with the ongoing costs of investing inother mutual funds. The Expense Example is based on an investment of $1,000 invested at the beginning ofthe period and held for the entire period indicated, which for each class is from 08/01/04 to 01/31/05. Pleasenote that the Expense Example is general and does not reflect certain transaction or account specific costs, whichmay increase your total costs of investing in the Fund. If these transaction or account specific costs wereincluded in the Expense Example, the expenses would have been higher.
Actual Expenses
The information represented in the row entitled “Actual” provides information about actual account values andactual expenses. You may use the information in this row, together with the amount you invested, to estimatethe expenses that you paid over the period. Simply divide your account value by $1,000 (for example, an$8,600 account value divided by $1,000 = 8.6), then multiply the result by the number under the heading“Expenses Paid During Period” to estimate the expenses you paid for on your account during this period.
Hypothetical Example for Comparison Purposes
The information represented in the row entitled “Hypothetical (5% return before expenses)” provides informationabout hypothetical account values and hypothetical expenses based on the Fund’s actual expense ratio and anassumed rate of return of 5% per year before expenses, which is not the Fund’s actual return. The hypotheticalaccount values and expenses may not be used to estimate the actual ending account balance or expenses you paidfor the period. You may use this information to compare the ongoing costs of investing in the Fund and otherfunds. To do so, compare this 5% hypothetical example with the 5% hypothetical examples that appear in theshareholder reports of the other funds.
Please note that the expenses shown in the table are meant to highlight your ongoing costs only and do notreflect any transactional costs, such as sales charges (loads). Therefore, the information in the row entitled“Hypothetical (5% return before expenses)” is useful in comparing ongoing costs only, and will not help youdetermine the relative total costs of owning different funds. In addition, if these transactional costs wereincluded, your costs would have been higher.
8
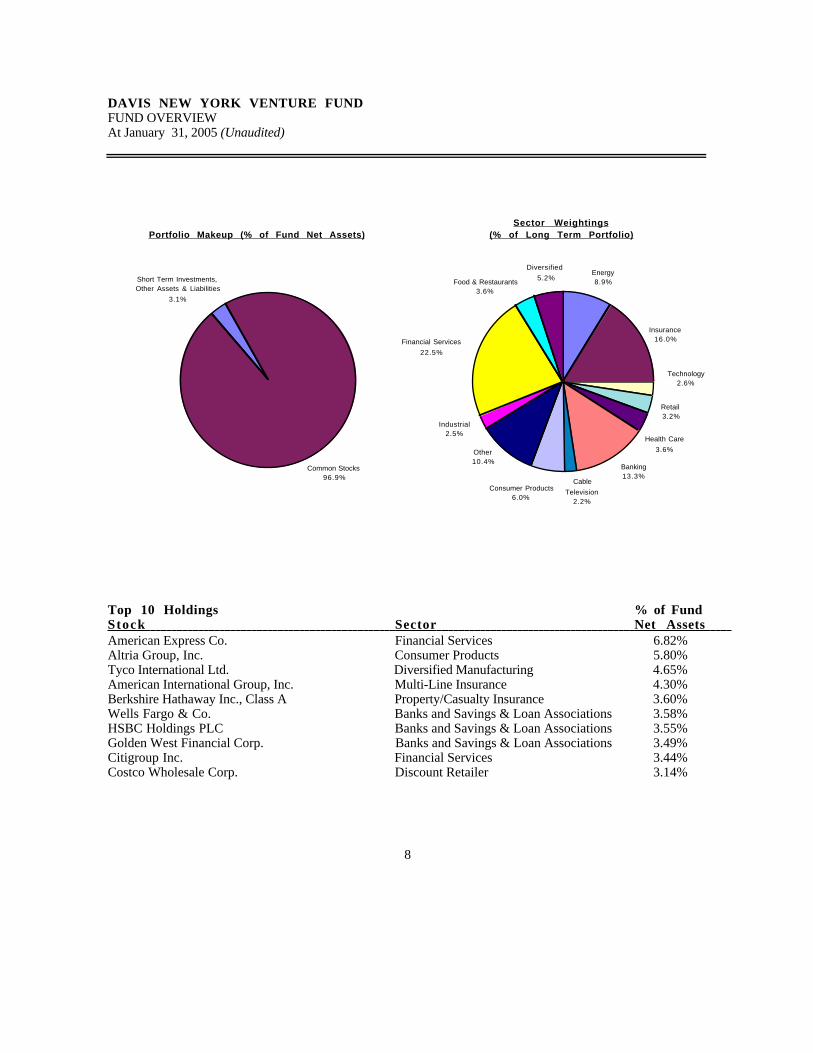
DAVIS NEW YORK VENTURE FUNDFUND OVERVIEWAt January 31, 2005 (Unaudited)
Portfolio Makeup (% of Fund Net Assets)
Short Term Investments, Other Assets & Liabilities
3.1%
Common Stocks96.9%
Sector Weightings(% of Long Term Portfolio)
Cable
Television2.2%
Banking13.3%
Energy8.9%Food & Restaurants
3.6%
Financial Services
22.5%
Insurance16.0%
Technology2.6%
Retail3.2%
Health Care
3.6%
Industrial2.5%
Other10.4%
Consumer Products6.0%
Diversified
5.2%
Top 10 Holdings % of FundStock Sector Net Assets American Express Co. Financial Services 6.82%Altria Group, Inc. Consumer Products 5.80%Tyco International Ltd. Diversified Manufacturing 4.65%American International Group, Inc. Multi-Line Insurance 4.30%Berkshire Hathaway Inc., Class A Property/Casualty Insurance 3.60%Wells Fargo & Co. Banks and Savings & Loan Associations 3.58%HSBC Holdings PLC Banks and Savings & Loan Associations 3.55%Golden West Financial Corp. Banks and Savings & Loan Associations 3.49%Citigroup Inc. Financial Services 3.44%Costco Wholesale Corp. Discount Retailer 3.14%
9
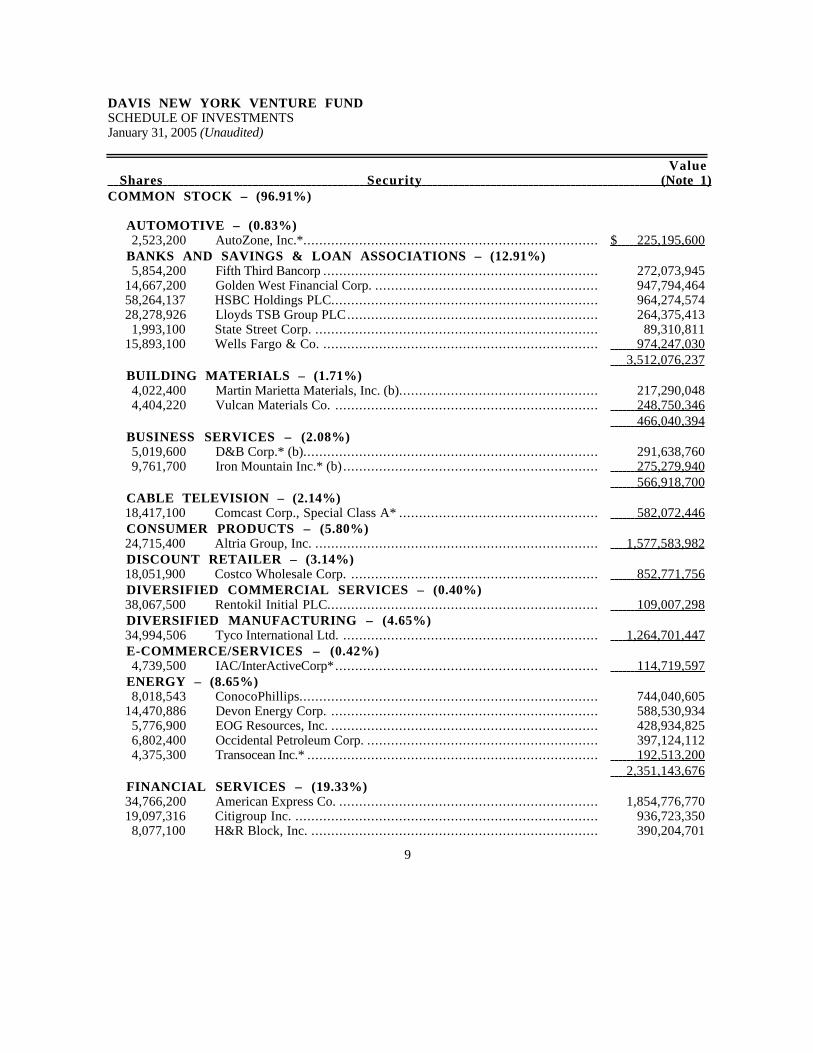
DAVIS NEW YORK VENTURE FUNDSCHEDULE OF INVESTMENTSJanuary 31, 2005 (Unaudited)
Value Shares Security (Note 1) COMMON STOCK – (96.91%)
AUTOMOTIVE – (0.83%)2,523,200 AutoZone, Inc.*.......................................................................... $ 225,195,600
BANKS AND SAVINGS & LOAN ASSOCIATIONS – (12.91%)5,854,200 Fifth Third Bancorp ..................................................................... 272,073,945
14,667,200 Golden West Financial Corp. ........................................................ 947,794,46458,264,137 HSBC Holdings PLC................................................................... 964,274,57428,278,926 Lloyds TSB Group PLC............................................................... 264,375,4131,993,100 State Street Corp. ....................................................................... 89,310,811
15,893,100 Wells Fargo & Co. ..................................................................... 974,247,030 3,512,076,237
BUILDING MATERIALS – (1.71%)4,022,400 Martin Marietta Materials, Inc. (b).................................................. 217,290,0484,404,220 Vulcan Materials Co. .................................................................. 248,750,346
466,040,394BUSINESS SERVICES – (2.08%)5,019,600 D&B Corp.* (b).......................................................................... 291,638,7609,761,700 Iron Mountain Inc.* (b) ................................................................ 275,279,940
566,918,700CABLE TELEVISION – (2.14%)18,417,100 Comcast Corp., Special Class A* .................................................. 582,072,446 CONSUMER PRODUCTS – (5.80%)24,715,400 Altria Group, Inc. ....................................................................... 1,577,583,982DISCOUNT RETAILER – (3.14%)18,051,900 Costco Wholesale Corp. .............................................................. 852,771,756 DIVERSIFIED COMMERCIAL SERVICES – (0.40%)38,067,500 Rentokil Initial PLC.................................................................... 109,007,298 DIVERSIFIED MANUFACTURING – (4.65%)34,994,506 Tyco International Ltd. ................................................................ 1,264,701,447 E-COMMERCE/SERVICES – (0.42%)4,739,500 IAC/InterActiveCorp*.................................................................. 114,719,597
ENERGY – (8.65%)8,018,543 ConocoPhillips........................................................................... 744,040,605
14,470,886 Devon Energy Corp. ................................................................... 588,530,9345,776,900 EOG Resources, Inc. ................................................................... 428,934,8256,802,400 Occidental Petroleum Corp. .......................................................... 397,124,1124,375,300 Transocean Inc.* ......................................................................... 192,513,200
2,351,143,676FINANCIAL SERVICES – (19.33%)34,766,200 American Express Co. ................................................................. 1,854,776,77019,097,316 Citigroup Inc. ............................................................................ 936,723,3508,077,100 H&R Block, Inc. ........................................................................ 390,204,701
10
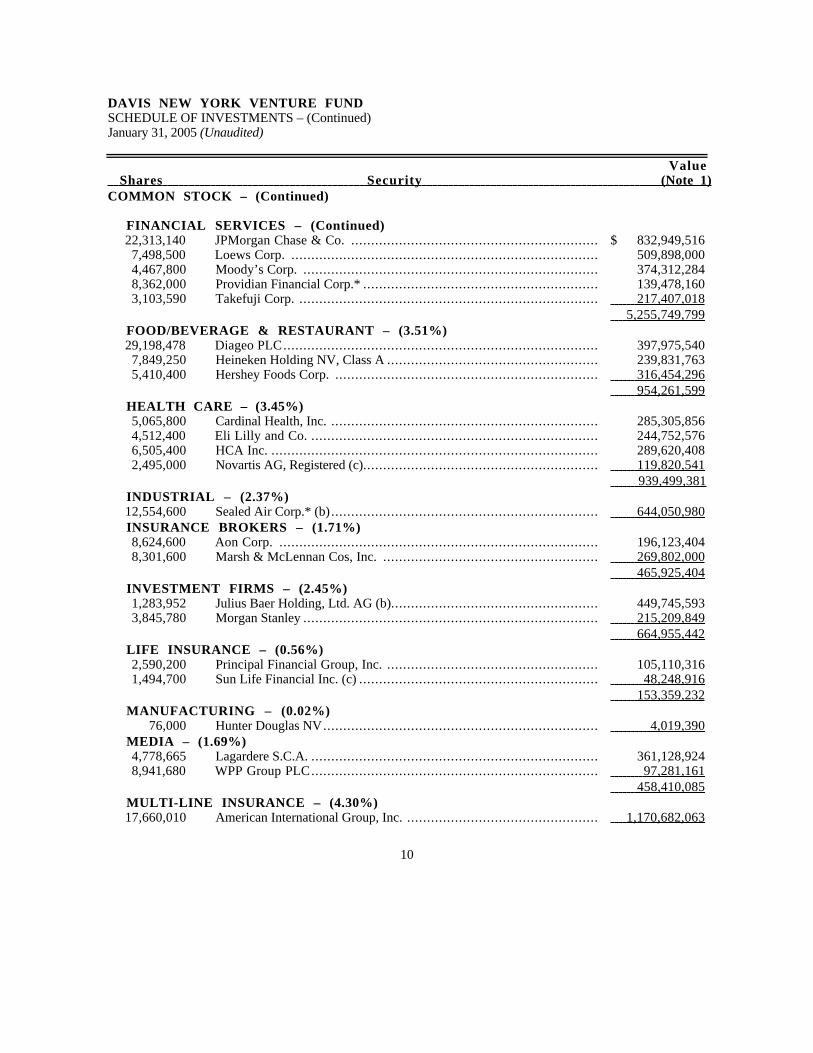
DAVIS NEW YORK VENTURE FUNDSCHEDULE OF INVESTMENTS – (Continued)January 31, 2005 (Unaudited)
Value Shares Security (Note 1) COMMON STOCK – (Continued)
FINANCIAL SERVICES – (Continued)22,313,140 JPMorgan Chase & Co. .............................................................. $ 832,949,5167,498,500 Loews Corp. ............................................................................. 509,898,0004,467,800 Moody’s Corp. .......................................................................... 374,312,2848,362,000 Providian Financial Corp.* ........................................................... 139,478,1603,103,590 Takefuji Corp. ........................................................................... 217,407,018
5,255,749,799 FOOD/BEVERAGE & RESTAURANT – (3.51%)29,198,478 Diageo PLC............................................................................... 397,975,5407,849,250 Heineken Holding NV, Class A ..................................................... 239,831,7635,410,400 Hershey Foods Corp. .................................................................. 316,454,296
954,261,599 HEALTH CARE – (3.45%)5,065,800 Cardinal Health, Inc. ................................................................... 285,305,8564,512,400 Eli Lilly and Co. ........................................................................ 244,752,5766,505,400 HCA Inc. .................................................................................. 289,620,4082,495,000 Novartis AG, Registered (c)........................................................... 119,820,541
939,499,381 INDUSTRIAL – (2.37%)12,554,600 Sealed Air Corp.* (b) ................................................................... 644,050,980 INSURANCE BROKERS – (1.71%)8,624,600 Aon Corp. ................................................................................ 196,123,4048,301,600 Marsh & McLennan Cos, Inc. ...................................................... 269,802,000
465,925,404 INVESTMENT FIRMS – (2.45%)1,283,952 Julius Baer Holding, Ltd. AG (b).................................................... 449,745,5933,845,780 Morgan Stanley .......................................................................... 215,209,849
664,955,442 LIFE INSURANCE – (0.56%)2,590,200 Principal Financial Group, Inc. ..................................................... 105,110,3161,494,700 Sun Life Financial Inc. (c) ............................................................ 48,248,916
153,359,232MANUFACTURING – (0.02%)
76,000 Hunter Douglas NV..................................................................... 4,019,390 MEDIA – (1.69%)4,778,665 Lagardere S.C.A. ........................................................................ 361,128,9248,941,680 WPP Group PLC........................................................................ 97,281,161
458,410,085 MULTI-LINE INSURANCE – (4.30%)17,660,010 American International Group, Inc. ................................................ 1,170,682,063
11
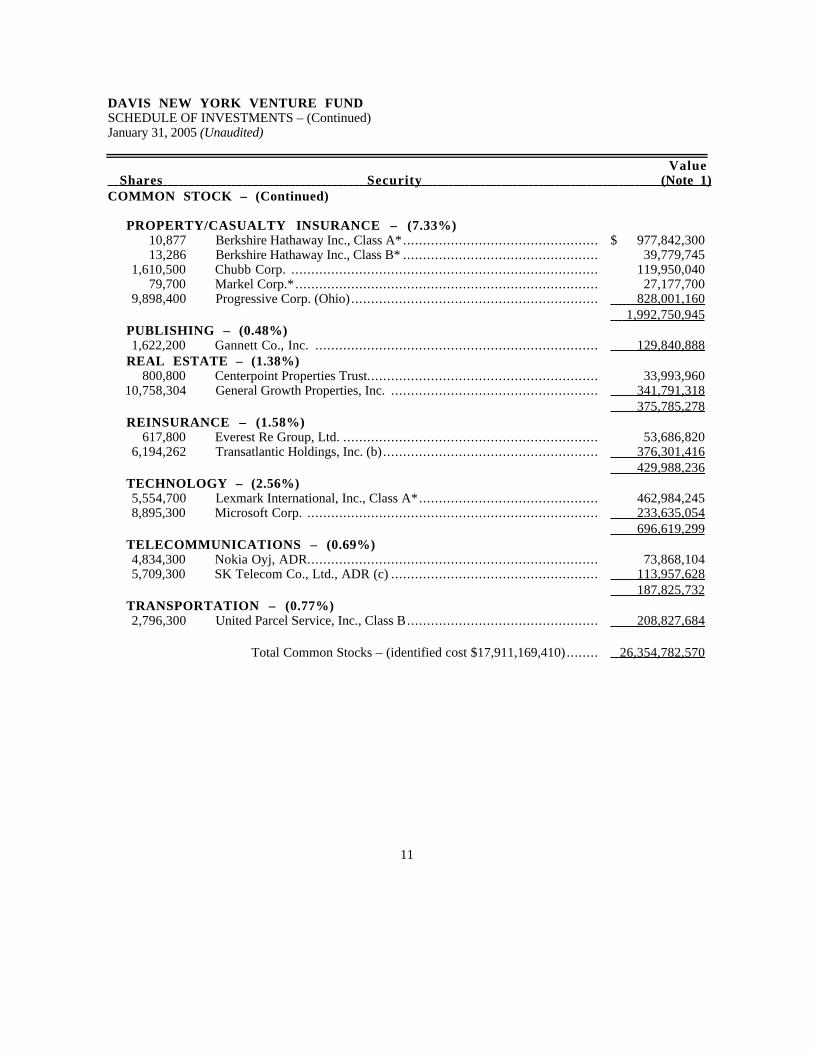
DAVIS NEW YORK VENTURE FUNDSCHEDULE OF INVESTMENTS – (Continued)January 31, 2005 (Unaudited)
Value Shares Security (Note 1) COMMON STOCK – (Continued)
PROPERTY/CASUALTY INSURANCE – (7.33%)10,877 Berkshire Hathaway Inc., Class A*................................................. $ 977,842,30013,286 Berkshire Hathaway Inc., Class B* ................................................. 39,779,745
1,610,500 Chubb Corp. ............................................................................. 119,950,04079,700 Markel Corp.*............................................................................ 27,177,700
9,898,400 Progressive Corp. (Ohio) .............................................................. 828,001,160 1,992,750,945
PUBLISHING – (0.48%)1,622,200 Gannett Co., Inc. ....................................................................... 129,840,888
REAL ESTATE – (1.38%)800,800 Centerpoint Properties Trust.......................................................... 33,993,960
10,758,304 General Growth Properties, Inc. .................................................... 341,791,318 375,785,278
REINSURANCE – (1.58%)617,800 Everest Re Group, Ltd. ................................................................ 53,686,820
6,194,262 Transatlantic Holdings, Inc. (b) ...................................................... 376,301,416 429,988,236
TECHNOLOGY – (2.56%)5,554,700 Lexmark International, Inc., Class A*............................................. 462,984,2458,895,300 Microsoft Corp. ......................................................................... 233,635,054
696,619,299TELECOMMUNICATIONS – (0.69%)4,834,300 Nokia Oyj, ADR......................................................................... 73,868,1045,709,300 SK Telecom Co., Ltd., ADR (c) .................................................... 113,957,628
187,825,732TRANSPORTATION – (0.77%)2,796,300 United Parcel Service, Inc., Class B................................................ 208,827,684
Total Common Stocks – (identified cost $17,911,169,410)........ 26,354,782,570
12
DAVIS NEW YORK VENTURE FUNDSCHEDULE OF INVESTMENTS – (Continued)January 31, 2005 (Unaudited)
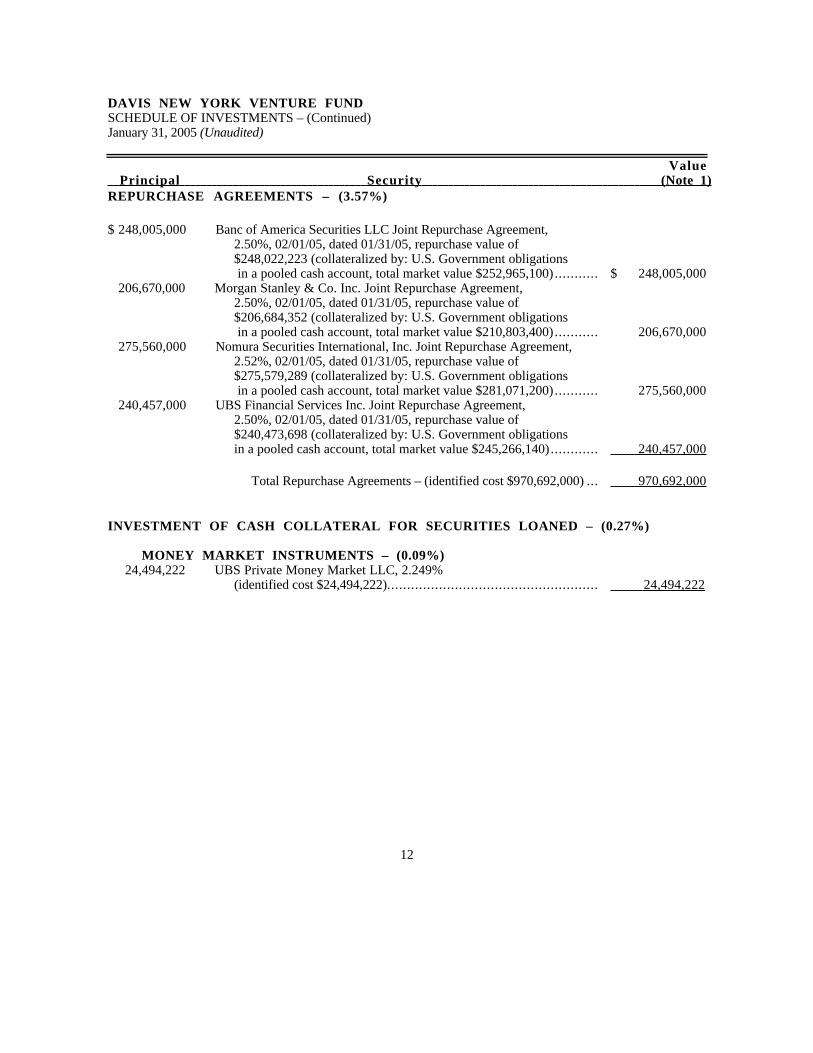
Value Principal Security (Note 1) REPURCHASE AGREEMENTS – (3.57%)
$ 248,005,000 Banc of America Securities LLC Joint Repurchase Agreement,2.50%, 02/01/05, dated 01/31/05, repurchase value of$248,022,223 (collateralized by: U.S. Government obligations in a pooled cash account, total market value $252,965,100)........... $ 248,005,000
206,670,000 Morgan Stanley & Co. Inc. Joint Repurchase Agreement,2.50%, 02/01/05, dated 01/31/05, repurchase value of$206,684,352 (collateralized by: U.S. Government obligations in a pooled cash account, total market value $210,803,400)........... 206,670,000
275,560,000 Nomura Securities International, Inc. Joint Repurchase Agreement,2.52%, 02/01/05, dated 01/31/05, repurchase value of$275,579,289 (collateralized by: U.S. Government obligations in a pooled cash account, total market value $281,071,200)........... 275,560,000
240,457,000 UBS Financial Services Inc. Joint Repurchase Agreement,2.50%, 02/01/05, dated 01/31/05, repurchase value of$240,473,698 (collateralized by: U.S. Government obligationsin a pooled cash account, total market value $245,266,140)............ 240,457,000
Total Repurchase Agreements – (identified cost $970,692,000) ... 970,692,000
INVESTMENT OF CASH COLLATERAL FOR SECURITIES LOANED – (0.27%)
MONEY MARKET INSTRUMENTS – (0.09%)24,494,222 UBS Private Money Market LLC, 2.249%
(identified cost $24,494,222)..................................................... 24,494,222
13
DAVIS NEW YORK VENTURE FUNDSCHEDULE OF INVESTMENTS – (Continued)January 31, 2005 (Unaudited)
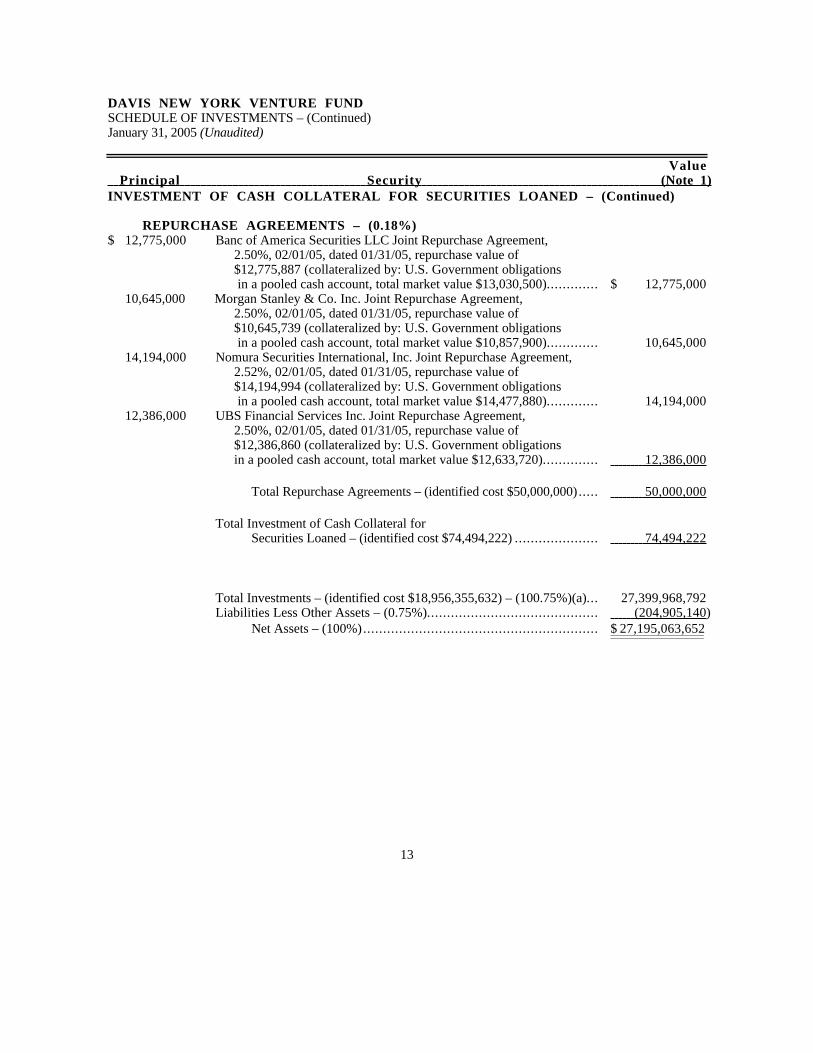
Value Principal Security (Note 1) INVESTMENT OF CASH COLLATERAL FOR SECURITIES LOANED – (Continued)
REPURCHASE AGREEMENTS – (0.18%)$ 12,775,000 Banc of America Securities LLC Joint Repurchase Agreement,
2.50%, 02/01/05, dated 01/31/05, repurchase value of$12,775,887 (collateralized by: U.S. Government obligations in a pooled cash account, total market value $13,030,500)............. $ 12,775,000
10,645,000 Morgan Stanley & Co. Inc. Joint Repurchase Agreement,2.50%, 02/01/05, dated 01/31/05, repurchase value of$10,645,739 (collateralized by: U.S. Government obligations in a pooled cash account, total market value $10,857,900)............. 10,645,000
14,194,000 Nomura Securities International, Inc. Joint Repurchase Agreement,2.52%, 02/01/05, dated 01/31/05, repurchase value of$14,194,994 (collateralized by: U.S. Government obligations in a pooled cash account, total market value $14,477,880)............. 14,194,000
12,386,000 UBS Financial Services Inc. Joint Repurchase Agreement,2.50%, 02/01/05, dated 01/31/05, repurchase value of$12,386,860 (collateralized by: U.S. Government obligationsin a pooled cash account, total market value $12,633,720).............. 12,386,000
Total Repurchase Agreements – (identified cost $50,000,000)..... 50,000,000
Total Investment of Cash Collateral forSecurities Loaned – (identified cost $74,494,222) ..................... 74,494,222
Total Investments – (identified cost $18,956,355,632) – (100.75%)(a)... 27,399,968,792Liabilities Less Other Assets – (0.75%)........................................... (204,905,140 )
Net Assets – (100%)........................................................... $ 27,195,063,652
14
DAVIS NEW YORK VENTURE FUNDSCHEDULE OF INVESTMENTS – (Continued)January 31, 2005 (Unaudited)
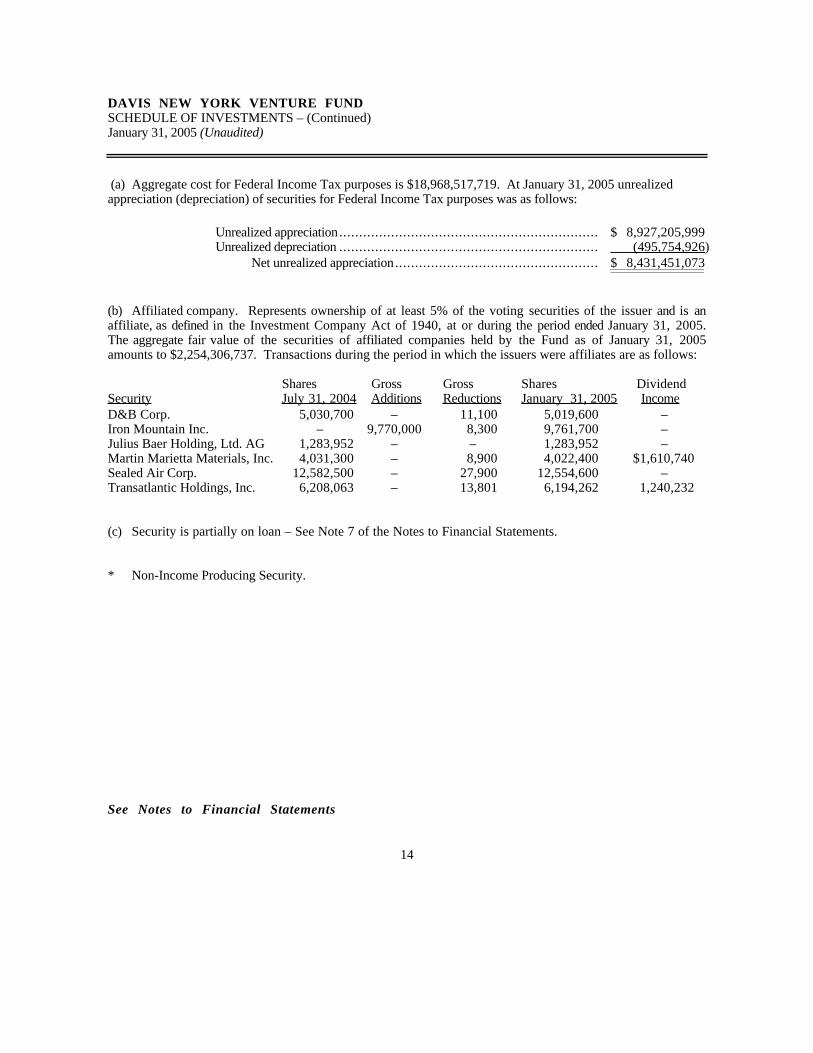
(a) Aggregate cost for Federal Income Tax purposes is $18,968,517,719. At January 31, 2005 unrealizedappreciation (depreciation) of securities for Federal Income Tax purposes was as follows:
Unrealized appreciation................................................................. $ 8,927,205,999Unrealized depreciation ................................................................. (495,754,926 )
Net unrealized appreciation................................................... $ 8,431,451,073
(b) Affiliated company. Represents ownership of at least 5% of the voting securities of the issuer and is anaffiliate, as defined in the Investment Company Act of 1940, at or during the period ended January 31, 2005.The aggregate fair value of the securities of affiliated companies held by the Fund as of January 31, 2005amounts to $2,254,306,737. Transactions during the period in which the issuers were affiliates are as follows:
Shares Gross Gross Shares DividendSecurity July 31, 2004 Additions Reductions January 31, 2005 Income D&B Corp. 5,030,700 – 11,100 5,019,600 –Iron Mountain Inc. – 9,770,000 8,300 9,761,700 –Julius Baer Holding, Ltd. AG 1,283,952 – – 1,283,952 –Martin Marietta Materials, Inc. 4,031,300 – 8,900 4,022,400 $1,610,740Sealed Air Corp. 12,582,500 – 27,900 12,554,600 –Transatlantic Holdings, Inc. 6,208,063 – 13,801 6,194,262 1,240,232
(c) Security is partially on loan – See Note 7 of the Notes to Financial Statements.
* Non-Income Producing Security.
See Notes to Financial Statements
15
DAVIS NEW YORK VENTURE FUNDSTATEMENT OF ASSETS AND LIABILITIESAt January 31, 2005 (Unaudited)
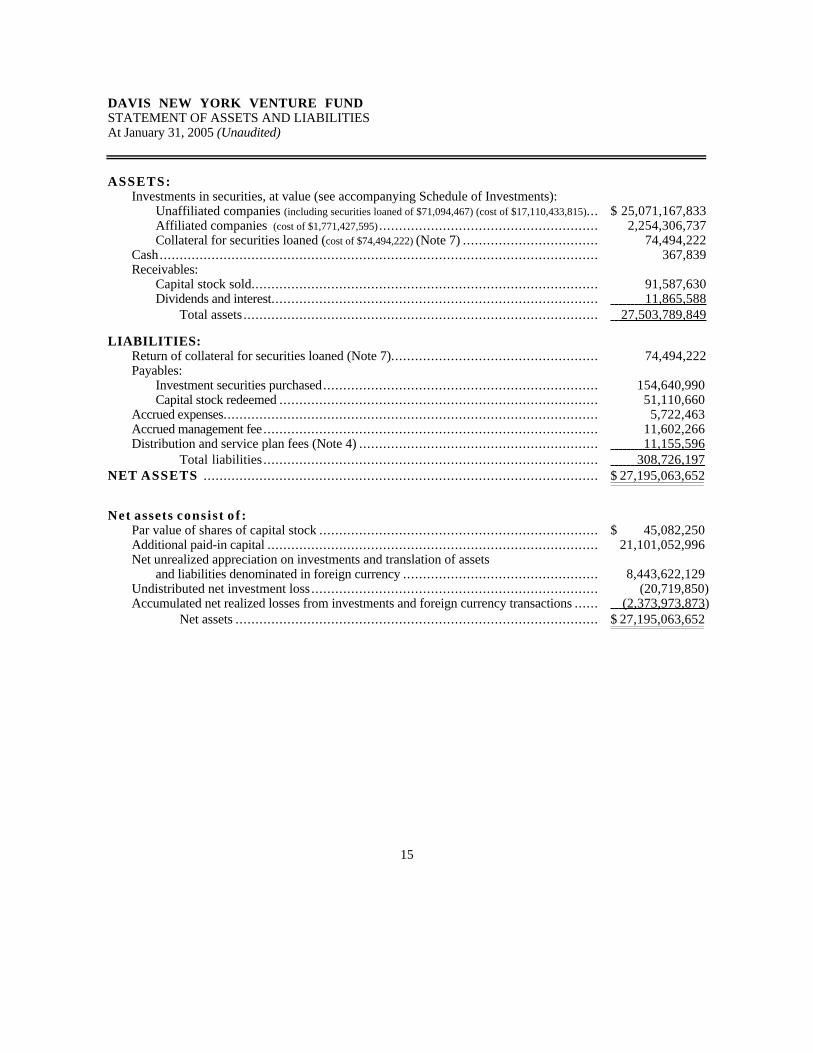
ASSETS:Investments in securities, at value (see accompanying Schedule of Investments):
Unaffiliated companies (including securities loaned of $71,094,467) (cost of $17,110,433,815)... $ 25,071,167,833Affiliated companies (cost of $1,771,427,595) ....................................................... 2,254,306,737Collateral for securities loaned (cost of $74,494,222) (Note 7) .................................. 74,494,222
Cash.............................................................................................................. 367,839Receivables:
Capital stock sold....................................................................................... 91,587,630Dividends and interest.................................................................................. 11,865,588
Total assets ......................................................................................... 27,503,789,849
LIABILITIES:Return of collateral for securities loaned (Note 7).................................................... 74,494,222Payables:
Investment securities purchased..................................................................... 154,640,990Capital stock redeemed ................................................................................ 51,110,660
Accrued expenses.............................................................................................. 5,722,463Accrued management fee.................................................................................... 11,602,266Distribution and service plan fees (Note 4) ............................................................ 11,155,596
Total liabilities .................................................................................... 308,726,197 NET ASSETS ................................................................................................... $ 27,195,063,652
Net assets consist o f :Par value of shares of capital stock ...................................................................... $ 45,082,250Additional paid-in capital ................................................................................... 21,101,052,996Net unrealized appreciation on investments and translation of assets
and liabilities denominated in foreign currency ................................................. 8,443,622,129Undistributed net investment loss........................................................................ (20,719,850)Accumulated net realized losses from investments and foreign currency transactions ...... (2,373,973,873 )
Net assets ........................................................................................... $ 27,195,063,652
16
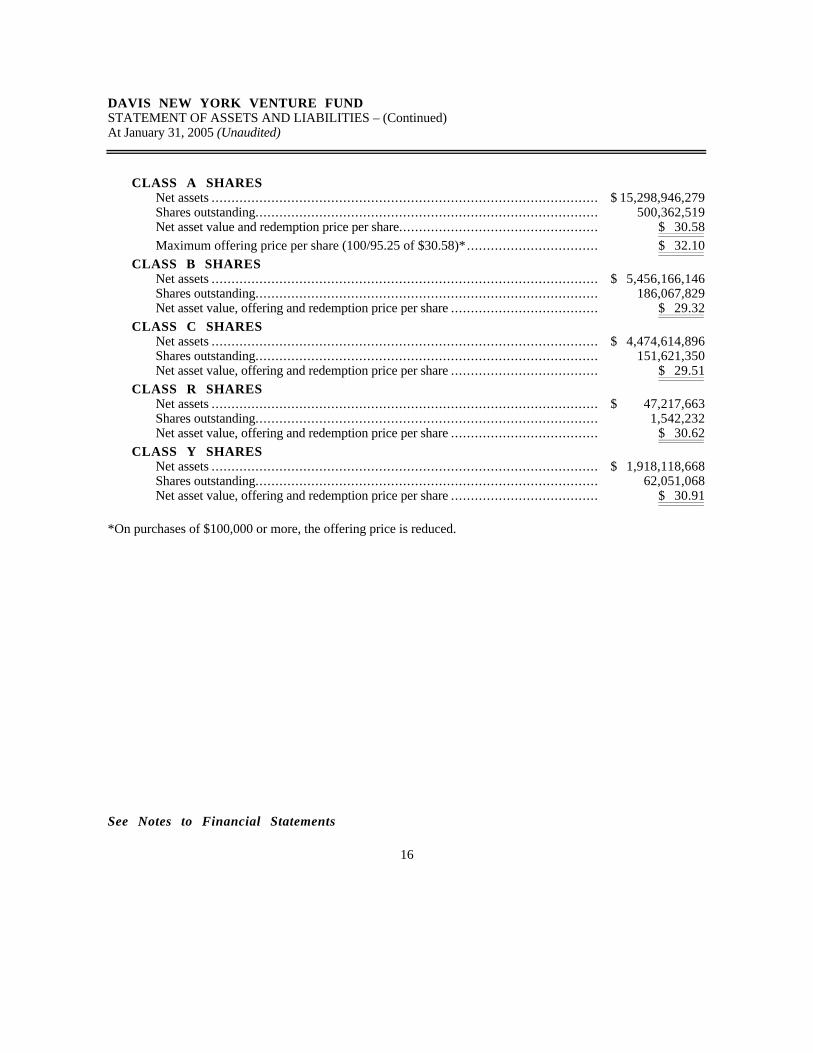
DAVIS NEW YORK VENTURE FUNDSTATEMENT OF ASSETS AND LIABILITIES – (Continued)At January 31, 2005 (Unaudited)
CLASS A SHARESNet assets ................................................................................................. $ 15,298,946,279Shares outstanding...................................................................................... 500,362,519Net asset value and redemption price per share.................................................. $ 30.58
Maximum offering price per share (100/95.25 of $30.58)*................................. $ 32.10
CLASS B SHARESNet assets ................................................................................................. $ 5,456,166,146Shares outstanding...................................................................................... 186,067,829Net asset value, offering and redemption price per share ..................................... $ 29.32
CLASS C SHARESNet assets ................................................................................................. $ 4,474,614,896Shares outstanding...................................................................................... 151,621,350Net asset value, offering and redemption price per share ..................................... $ 29.51
CLASS R SHARESNet assets ................................................................................................. $ 47,217,663Shares outstanding...................................................................................... 1,542,232Net asset value, offering and redemption price per share ..................................... $ 30.62
CLASS Y SHARESNet assets ................................................................................................. $ 1,918,118,668Shares outstanding...................................................................................... 62,051,068Net asset value, offering and redemption price per share ..................................... $ 30.91
*On purchases of $100,000 or more, the offering price is reduced.
See Notes to Financial Statements
17
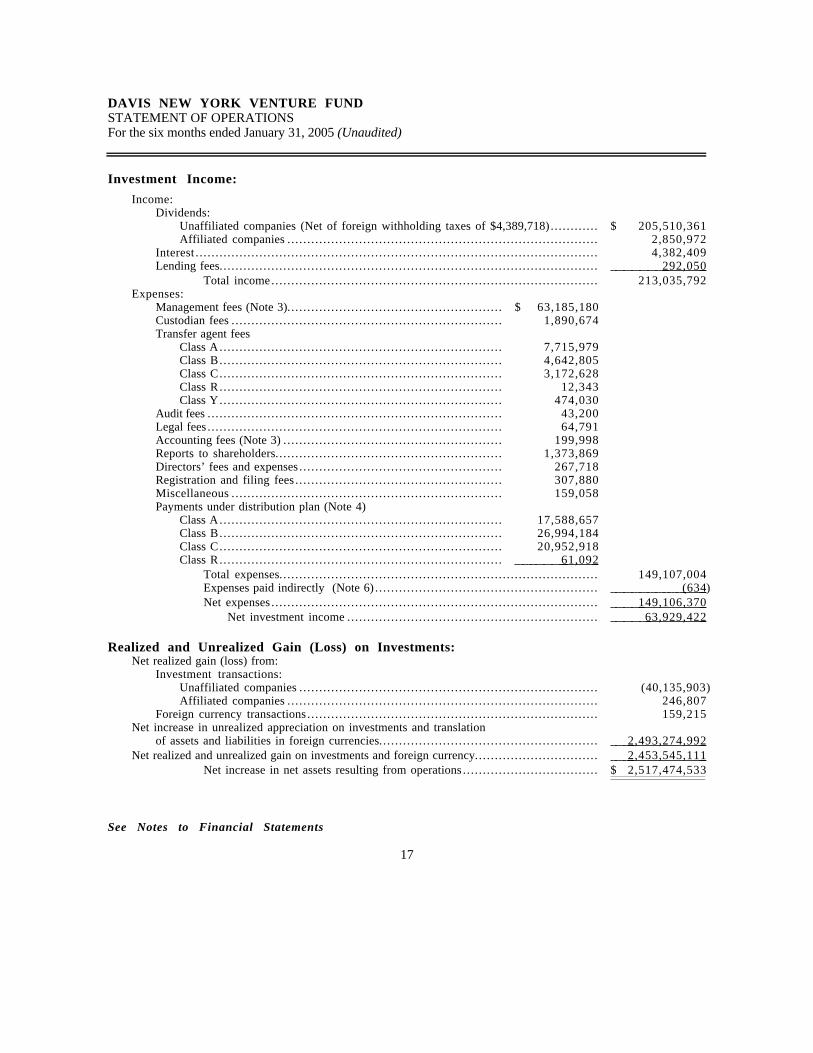
DAVIS NEW YORK VENTURE FUNDSTATEMENT OF OPERATIONSFor the six months ended January 31, 2005 (Unaudited)
Investment Income:
Income:Dividends:
Unaffiliated companies (Net of foreign withholding taxes of $4,389,718) .. . . . . . . . . . . $ 205,510,361Affiliated companies .. . . . . . . . . . . . . . . . . . . . . . . . . . . . . . . . . . . . . . . . . . . . . . . . . . . . . . . . . . . . . . . . . . . . . . . . . . . . . 2,850,972
Interest . . . . . . . . . . . . . . . . . . . . . . . . . . . . . . . . . . . . . . . . . . . . . . . . . . . . . . . . . . . . . . . . . . . . . . . . . . . . . . . . . . . . . . . . . . . . . . . . . . . . . 4,382,409Lending fees.. . . . . . . . . . . . . . . . . . . . . . . . . . . . . . . . . . . . . . . . . . . . . . . . . . . . . . . . . . . . . . . . . . . . . . . . . . . . . . . . . . . . . . . . . . . . . . 292,050
Total income... . . . . . . . . . . . . . . . . . . . . . . . . . . . . . . . . . . . . . . . . . . . . . . . . . . . . . . . . . . . . . . . . . . . . . . . . . . . . . . . 213,035,792Expenses:
Management fees (Note 3).. . . . . . . . . . . . . . . . . . . . . . . . . . . . . . . . . . . . . . . . . . . . . . . . . . . . . $ 63,185,180Custodian fees .. . . . . . . . . . . . . . . . . . . . . . . . . . . . . . . . . . . . . . . . . . . . . . . . . . . . . . . . . . . . . . . . . . . 1,890,674Transfer agent fees
Class A... . . . . . . . . . . . . . . . . . . . . . . . . . . . . . . . . . . . . . . . . . . . . . . . . . . . . . . . . . . . . . . . . . . . . 7,715,979Class B... . . . . . . . . . . . . . . . . . . . . . . . . . . . . . . . . . . . . . . . . . . . . . . . . . . . . . . . . . . . . . . . . . . . . 4,642,805Class C... . . . . . . . . . . . . . . . . . . . . . . . . . . . . . . . . . . . . . . . . . . . . . . . . . . . . . . . . . . . . . . . . . . . . 3,172,628Class R... . . . . . . . . . . . . . . . . . . . . . . . . . . . . . . . . . . . . . . . . . . . . . . . . . . . . . . . . . . . . . . . . . . . . 12,343Class Y... . . . . . . . . . . . . . . . . . . . . . . . . . . . . . . . . . . . . . . . . . . . . . . . . . . . . . . . . . . . . . . . . . . . . 474,030
Audit fees .. . . . . . . . . . . . . . . . . . . . . . . . . . . . . . . . . . . . . . . . . . . . . . . . . . . . . . . . . . . . . . . . . . . . . . . . . 43,200Legal fees .. . . . . . . . . . . . . . . . . . . . . . . . . . . . . . . . . . . . . . . . . . . . . . . . . . . . . . . . . . . . . . . . . . . . . . . . . 64,791Accounting fees (Note 3) .. . . . . . . . . . . . . . . . . . . . . . . . . . . . . . . . . . . . . . . . . . . . . . . . . . . . . . 199,998Reports to shareholders.. . . . . . . . . . . . . . . . . . . . . . . . . . . . . . . . . . . . . . . . . . . . . . . . . . . . . . . . 1,373,869Directors’ fees and expenses .. . . . . . . . . . . . . . . . . . . . . . . . . . . . . . . . . . . . . . . . . . . . . . . . . . 267,718Registration and filing fees .. . . . . . . . . . . . . . . . . . . . . . . . . . . . . . . . . . . . . . . . . . . . . . . . . . . 307,880Miscellaneous .. . . . . . . . . . . . . . . . . . . . . . . . . . . . . . . . . . . . . . . . . . . . . . . . . . . . . . . . . . . . . . . . . . . 159,058Payments under distribution plan (Note 4)
Class A... . . . . . . . . . . . . . . . . . . . . . . . . . . . . . . . . . . . . . . . . . . . . . . . . . . . . . . . . . . . . . . . . . . . . 17,588,657Class B... . . . . . . . . . . . . . . . . . . . . . . . . . . . . . . . . . . . . . . . . . . . . . . . . . . . . . . . . . . . . . . . . . . . . 26,994,184Class C... . . . . . . . . . . . . . . . . . . . . . . . . . . . . . . . . . . . . . . . . . . . . . . . . . . . . . . . . . . . . . . . . . . . . 20,952,918Class R... . . . . . . . . . . . . . . . . . . . . . . . . . . . . . . . . . . . . . . . . . . . . . . . . . . . . . . . . . . . . . . . . . . . . 61,092
Total expenses.. . . . . . . . . . . . . . . . . . . . . . . . . . . . . . . . . . . . . . . . . . . . . . . . . . . . . . . . . . . . . . . . . . . . . . . . . . . . . . . 149,107,004Expenses paid indirectly (Note 6) .. . . . . . . . . . . . . . . . . . . . . . . . . . . . . . . . . . . . . . . . . . . . . . . . . . . . . . . (634 )Net expenses .. . . . . . . . . . . . . . . . . . . . . . . . . . . . . . . . . . . . . . . . . . . . . . . . . . . . . . . . . . . . . . . . . . . . . . . . . . . . . . . . . 149,106,370
Net investment income ... . . . . . . . . . . . . . . . . . . . . . . . . . . . . . . . . . . . . . . . . . . . . . . . . . . . . . . . . . . . . 63,929,422
Realized and Unrealized Gain (Loss) on Investments:Net realized gain (loss) from:
Investment transactions:Unaffiliated companies .. . . . . . . . . . . . . . . . . . . . . . . . . . . . . . . . . . . . . . . . . . . . . . . . . . . . . . . . . . . . . . . . . . . . . . . . . . (40,135,903)Affiliated companies .. . . . . . . . . . . . . . . . . . . . . . . . . . . . . . . . . . . . . . . . . . . . . . . . . . . . . . . . . . . . . . . . . . . . . . . . . . . . . 246,807
Foreign currency transactions .. . . . . . . . . . . . . . . . . . . . . . . . . . . . . . . . . . . . . . . . . . . . . . . . . . . . . . . . . . . . . . . . . . . . . . . . 159,215Net increase in unrealized appreciation on investments and translation
of assets and liabilities in foreign currencies.. . . . . . . . . . . . . . . . . . . . . . . . . . . . . . . . . . . . . . . . . . . . . . . . . . . . . . 2,493,274,992 Net realized and unrealized gain on investments and foreign currency... . . . . . . . . . . . . . . . . . . . . . . . . . . . . 2,453,545,111
Net increase in net assets resulting from operations .. . . . . . . . . . . . . . . . . . . . . . . . . . . . . . . . . $ 2,517,474,533
See Notes to Financial Statements
18
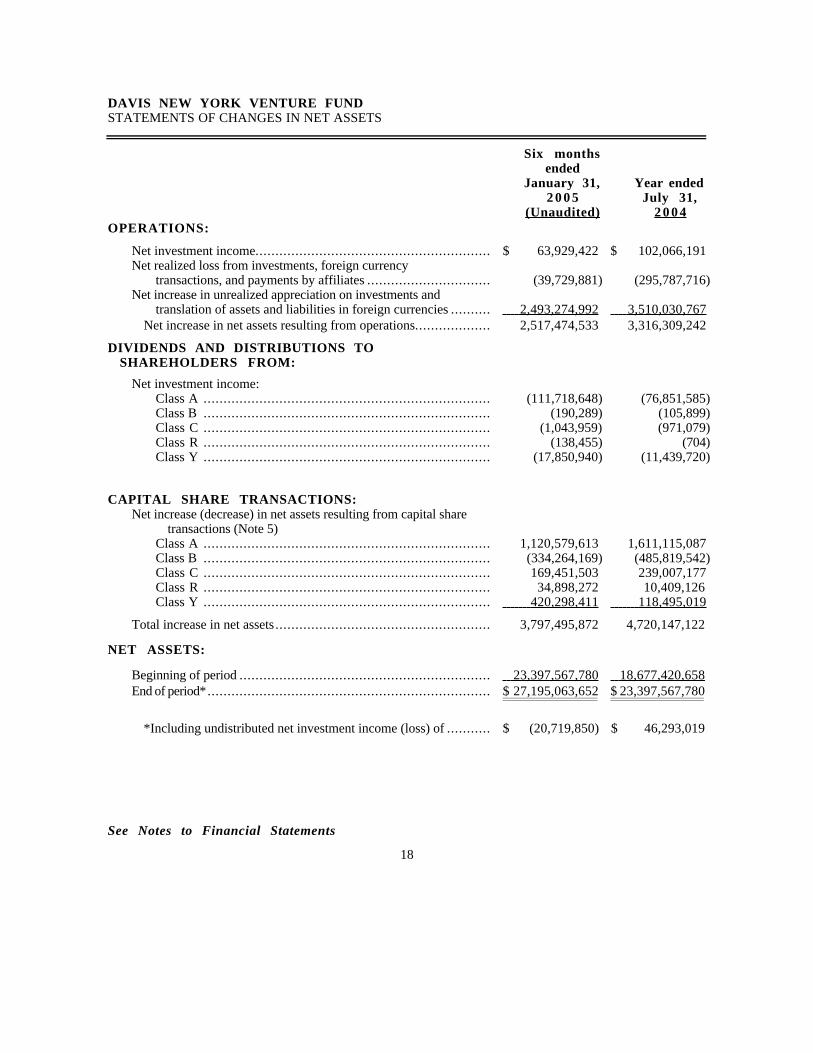
DAVIS NEW YORK VENTURE FUNDSTATEMENTS OF CHANGES IN NET ASSETS
Six monthsended
January 31, Year ended2 0 0 5 July 31,
(Unaudited) 2 0 0 4OPERATIONS:
Net investment income........................................................... $ 63,929,422 $ 102,066,191Net realized loss from investments, foreign currency
transactions, and payments by affiliates ............................... (39,729,881) (295,787,716)Net increase in unrealized appreciation on investments and
translation of assets and liabilities in foreign currencies .......... 2,493,274,992 3,510,030,767 Net increase in net assets resulting from operations................... 2,517,474,533 3,316,309,242
DIVIDENDS AND DISTRIBUTIONS TOSHAREHOLDERS FROM:
Net investment income:Class A ........................................................................ (111,718,648) (76,851,585)Class B ........................................................................ (190,289) (105,899)Class C ........................................................................ (1,043,959) (971,079)Class R ........................................................................ (138,455) (704)Class Y ........................................................................ (17,850,940) (11,439,720)
CAPITAL SHARE TRANSACTIONS:Net increase (decrease) in net assets resulting from capital share
transactions (Note 5)Class A ........................................................................ 1,120,579,613 1,611,115,087Class B ........................................................................ (334,264,169) (485,819,542)Class C ........................................................................ 169,451,503 239,007,177Class R ........................................................................ 34,898,272 10,409,126Class Y ........................................................................ 420,298,411 118,495,019
Total increase in net assets ...................................................... 3,797,495,872 4,720,147,122
NET ASSETS:
Beginning of period ............................................................... 23,397,567,780 18,677,420,658 End of period*....................................................................... $ 27,195,063,652 $ 23,397,567,780
*Including undistributed net investment income (loss) of ........... $ (20,719,850) $ 46,293,019
See Notes to Financial Statements
19
DAVIS NEW YORK VENTURE FUNDNOTES TO FINANCIAL STATEMENTSJanuary 31, 2005 (Unaudited)
NOTE 1 – SUMMARY OF SIGNIFICANT ACCOUNTING POLICIES
The Fund is a separate series of Davis New York Venture Fund, Inc., which is registered under theInvestment Company Act of 1940, as amended, as a diversified, open-end management investment company.The Fund's investment objective is growth of capital. The Fund offers shares in five classes, Class A, Class B,Class C, Class R, and Class Y. The Class A shares are sold with a front-end sales charge and the Class B andClass C shares are sold at net asset value and may be subject to a contingent deferred sales charge uponredemption. Class R and Class Y shares are sold at net asset value and are not subject to any contingent deferredsales charge. Class R shares generally are available only to retirement and benefit plans. Class Y shares areonly available to certain qualified investors. Income, expenses (other than those attributable to a specific class),and gains and losses are allocated daily to each class of shares based upon the relative proportion of net assetsrepresented by each class. Operating expenses directly attributable to a specific class, such as distribution andtransfer agent fees, are charged against the operations of that class. All classes have identical rights with respectto voting (exclusive of each Class's distribution arrangement), liquidation, and distributions. The following is asummary of significant accounting policies followed by the Fund in the preparation of its financial statements.
Security Valuation – Portfolio securities listed on national securities exchanges are valued at the lastreported sales price on the day of valuation. Securities traded in the over the counter market and listed securitiesfor which no sale was reported on that date are stated at the average of closing bid and asked prices. Securitiesfor which market quotations are not readily available, or whose values have been affected by a significant eventoccurring after the close of their primary markets, are valued at fair value as determined in good faith by theBoard of Directors. Short-term obligations are valued at amortized cost, which approximates fair value. Thevaluation procedures are reviewed and subject to approval by the Board of Directors.
Master Repurchase Agreements – The Fund, along with other affiliated funds, may transfer uninvestedcash balances into one or more master repurchase agreement accounts. These balances are invested in one ormore repurchase agreements, secured by U.S. government securities. Securities pledged as collateral forrepurchase agreements are held by a custodian bank until the agreements mature. Each agreement requires thatthe market value of the collateral be sufficient to cover payments of interest and principal; however, in the eventof default by the other party to the agreement, retention of the collateral may be subject to legal proceedings.
Currency Translation – The market values of all assets and liabilities denominated in foreign currencies arerecorded in the financial statements after translation to the U.S. dollar based upon the mean between the bid andoffered quotations of the currencies against U.S. dollars on the date of valuation. The cost basis of such assetsand liabilities is determined based upon historical exchange rates. Income and expenses are translated at averageexchange rates in effect as accrued or incurred.
Foreign Currency – The Fund may enter into forward purchases or sales of foreign currencies to hedgecertain foreign currency denominated assets and liabilities against declines in market value relative to the U.S.dollar. Forward currency contracts are marked-to-market daily and the change in market value is recorded by theFund as an unrealized gain or loss. When the forward currency contract is closed, the Fund records a realizedgain or loss equal to the difference between the value of the forward currency contract at the time it was openedand value at the time it was closed. Investments in forward currency contracts may expose the Fund to risksresulting from unanticipated movements in foreign currency exchange rates or failure of the counter-party to theagreement to perform in accordance with the terms of the contract.
20
DAVIS NEW YORK VENTURE FUNDNOTES TO FINANCIAL STATEMENTS – (Continued)January 31, 2005 (Unaudited)
NOTE 1 – SUMMARY OF SIGNIFICANT ACCOUNTING POLICIES – (Continued)
Reported net realized foreign exchange gains or losses arise from sales and maturities of investments, salesof foreign currencies, currency gains or losses realized between the trade and settlement dates on securitiestransactions, the difference between the amounts of dividends, interest and foreign withholding taxes recorded onthe Fund’s books, and the U.S. dollar equivalent of the amounts actually received or paid. Net unrealizedforeign exchange gains and losses arise from changes in the value of assets and liabilities other than investmentsin securities at fiscal year end, resulting from changes in the exchange rate. The Fund includes foreign currencygains and losses realized on the sale of investments together with market gains and losses on such investmentsin the statement of operations.
Federal Income Taxes – It is the Fund's policy to comply with the requirements of the Internal RevenueCode applicable to regulated investment companies and to distribute substantially all of its taxable income,including any net realized gains on investments not offset by loss carryovers, to shareholders. Therefore, noprovision for federal income or excise tax is required. At January 31, 2005, the Fund had available for Federalincome tax purposes unused capital loss carryovers of $2,041,249,000 of which $4,237,000 expires in 2009,$458,003,000 expires in 2010, $1,141,176,000 expires in 2011, and $437,833,000 expires in 2012. Inaddition, at January 31, 2005, the Fund had approximately $280,833,000 of post October 2003 losses availableto offset future capital gains, if any, which expire in 2013.
Securities Transactions and Related Investment Income – Securities transactions are accounted foron the trade date (date the order to buy or sell is executed) with realized gain or loss on the sale of securitiesbeing determined based upon identified cost. Dividend income is recorded on the ex-dividend date. Interestincome, which includes accretion of discount and amortization of premium, is accrued as earned.
Dividends and Distributions to Shareholders – Dividends and distributions to shareholders are recordedon the ex-dividend date. Net investment income (loss), net realized gains (losses) and net unrealized appreciation(depreciation) of investments may differ for financial statement and tax purposes primarily because of therecognition of certain foreign currency gains (losses) as ordinary income (loss) for tax purposes and the taxdeferral of losses on “wash sale” transactions. The character of dividends and distributions made during the fiscalyear from net investment income and net realized securities gains may differ from their ultimate characterizationfor Federal income tax purposes. Also, due to the timing of dividends and distributions, the fiscal year in whichamounts are distributed may differ from the fiscal year in which income or realized gain was recorded by theFund. The Fund adjusts the classification of distributions to shareholders to reflect the differences betweenfinancial statement amounts and distributions determined in accordance with income tax regulations.
21
DAVIS NEW YORK VENTURE FUNDNOTES TO FINANCIAL STATEMENTS – (Continued)January 31, 2005 (Unaudited)
NOTE 1 – SUMMARY OF SIGNIFICANT ACCOUNTING POLICIES – (Continued)
Use of Estimates in Financial Statements – In preparing financial statements in conformity withaccounting principles generally accepted in the United States of America, management makes estimates andassumptions that affect the reported amounts of assets and liabilities and disclosure of contingent assets andliabilities at the date of the financial statements, as well as the reported amounts of income and expenses duringthe reporting period. Actual results may differ from these estimates.
NOTE 2 – PURCHASES AND SALES OF SECURITIES
Purchases and sales of investment securities (excluding short-term securities) for the six months endedJanuary 31, 2005, were $1,018,574,562 and $466,146,310, respectively.
NOTE 3 – INVESTMENT ADVISORY FEES AND OTHER TRANSACTIONS WITHAFFILIATES
Advisory fees are paid monthly to Davis Advisors (the “Adviser”), the Fund’s investment adviser. Theannual rate is 0.75% of the average net assets for the first $250 million, 0.65% of the average net assets on thenext $250 million, 0.55% of the average net assets on the next $2.5 billion, 0.54% of the average net assets onthe next $1 billion, 0.53% of the average net assets on the next $1 billion, 0.52% of the average net assets onthe next $1 billion, 0.51% of the average net assets on the next $1 billion, and 0.50% of the average net assetson the next $3 billion, 0.485% of the average net assets on the next $8 billion and 0.47% of the average netassets in excess of $18 billion. Management fees paid during the six months ended January 31, 2005,approximated 0.50% of average net assets.
State Street Bank & Trust Co. (“State Street Bank”) is the Fund’s primary transfer agent. The Adviser isalso paid for certain transfer agent services. The fee for these services for the six months ended January 31,2005, amounted to $1,100,088. State Street Bank is the Fund’s primary accounting provider. Fees for suchservices are included in the custodian fee as State Street Bank also serves as the Fund’s custodian. The Adviseris also paid for certain accounting services. The fee amounted to $199,998 for the six months ended January 31,2005. Certain directors and the officers of the Fund are also directors and officers of the general partner of theAdviser.
Davis Selected Advisers-NY, Inc. (“DSA-NY”), a wholly-owned subsidiary of the Adviser, acts as sub-adviser to the Fund. DSA-NY performs research and portfolio management services for the Fund under a Sub-Advisory Agreement with the Adviser. The Fund pays no fees directly to DSA-NY.
22
DAVIS NEW YORK VENTURE FUNDNOTES TO FINANCIAL STATEMENTS – (Continued)January 31, 2005 (Unaudited)
NOTE 4 — DISTRIBUTION AND UNDERWRITING FEES
CLASS A SHARES
Class A shares of the Fund are sold at net asset value plus a sales charge and are redeemed at net asset value.
During the six months ended January 31, 2005, Davis Distributors, LLC, the Fund’s Underwriter (the“Underwriter” or “Distributor”) received $8,563,844 from commissions earned on sales of Class A shares of theFund, of which $1,312,942 was retained by the Underwriter and the remaining $7,250,902 was reallowed toinvestment dealers. The Underwriter paid the costs of prospectuses in excess of those required to be filed as partof the Fund's registration statement, sales literature and other expenses assumed or incurred by it in connectionwith such sales.
The Underwriter is reimbursed for amounts paid to dealers as a service fee or commissions with respect toClass A shares sold by dealers which remain outstanding during the period. The service fee is paid at an annualrate up to 1/4 of 1% of the average net assets maintained by the responsible dealers. The Underwriter is notreimbursed for accounts for which the Underwriter pays no service fees to other firms. The service fee for ClassA shares of the Fund for the six months ended January 31, 2005, was $17,588,657.
CLASS B SHARES
Class B shares of the Fund are sold at net asset value and are redeemed at net asset value less a contingentdeferred sales charge if redeemed within six years of purchase.
The Fund pays a distribution fee to reimburse the Distributor for commission advances on the sale of theFund's Class B shares. Payments under the Class B Distribution Plan are limited to an annual rate of equal tothe lesser of 1.25% of the average daily net asset value of the Class B shares or the maximum amount providedby applicable rule or regulation of the National Association of Securities Dealers, Inc., ("NASD"), whichcurrently is 1.00%. Therefore, the effective rate of the Class B Distribution Plan is currently 1%, of which0.75% may be used to pay distribution expenses and 0.25% may be used to pay shareholder service fees. TheNASD rule also limits the aggregate amount the Fund may pay for distribution to 6.25% of gross Fund salessince inception of the Rule 12b-1 plan, plus interest, at 1% over the prime rate on unpaid amounts. TheDistributor intends to seek full payment (plus interest at prime plus 1%) of distribution charges that exceed the1% annual limit in some future period or periods when the plan limits have not been reached.
During the six months ended January 31, 2005, Class B shares of the Fund made distribution planpayments which included distribution fees of $20,271,050 and service fees of $6,723,134.
Commission advances by the Distributor during the six months ended January 31, 2005 on the sale ofClass B shares of the Fund amounted to $4,791,657, all of which was reallowed to qualified selling dealers.
The Distributor intends to seek payment from Class B shares of the Fund in the amount of $319,554,932representing the cumulative commission advances by the Distributor on the sale of the Fund's Class B shares,plus interest, reduced by cumulative distribution fees paid by the Fund and cumulative contingent deferred salescharges paid by redeeming shareholders. The Fund has no contractual obligation to pay any such distributioncharges and the amount, if any, timing and condition of such payment are solely within the discretion of theDirectors who are not interested persons of the Fund or the Distributor.
23
DAVIS NEW YORK VENTURE FUNDNOTES TO FINANCIAL STATEMENTS – (Continued)January 31, 2005 (Unaudited)
NOTE 4 – DISTRIBUTION AND UNDERWRITING FEES – (Continued)
CLASS B SHARES – (Continued)
A contingent deferred sales charge is imposed upon redemption of certain Class B shares of the Fund withinsix years of the original purchase. The charge is a declining percentage starting at 4% of the lesser of net assetvalue of the shares redeemed or the total cost of such shares. During the six months ended January 31, 2005 theDistributor received $2,963,147 in contingent deferred sales charges from Class B shares of the Fund.
CLASS C SHARES
Class C shares of the Fund are sold at net asset value and are redeemed at net asset value less a contingentdeferred sales charge of 1% if redeemed within one year of purchase. Payments under the Class C DistributionPlan are limited to an annual rate of equal to the lesser of 1.25% of the average daily net asset value of the ClassC shares or the maximum amount provided by applicable rule or regulation of the National Association ofSecurities Dealers, Inc., ("NASD"), which currently is 1.00%. Therefore, the effective rate of the Class CDistribution Plan is currently 1%, of which 0.75% may be used to pay distribution expenses and 0.25% may beused to pay shareholder service fees. Class C shares are subject to the same 6.25% and 1% limitationsapplicable to the Class B Distribution Plan.
During the six months ended January 31, 2005, Class C shares of the Fund made distribution planpayments which included distribution fees of $15,714,689 and service fees of $5,238,229. During the sixmonths ended January 31, 2005, the Distributor received $159,940 in contingent deferred sales charges fromClass C shares of the Fund.
CLASS R SHARES
Class R shares of the Fund are sold and redeemed at net asset value. Payments under the Class RDistribution Plan are limited to an annual rate of 0.75% of the average daily net asset value of the Class Rshares or the maximum amount provided by applicable rule or regulation of the National Association ofSecurities Dealers, Inc., ("NASD"), which currently is 1.00%. The effective rate of the Class R DistributionPlan is currently 0.50%, of which 0.25% may be used to pay distribution expenses and 0.25% may be used topay shareholder service fees. Class R shares are subject to the same 6.25% and 1% limitations applicable to theClass B Distribution Plan.
During the six months ended January 31, 2005, Class R shares of the Fund made distribution planpayments which included distribution fees and service fees of $30,546 for each.
24
DAVIS NEW YORK VENTURE FUNDNOTES TO FINANCIAL STATEMENTS – (Continued)January 31, 2005 (Unaudited)
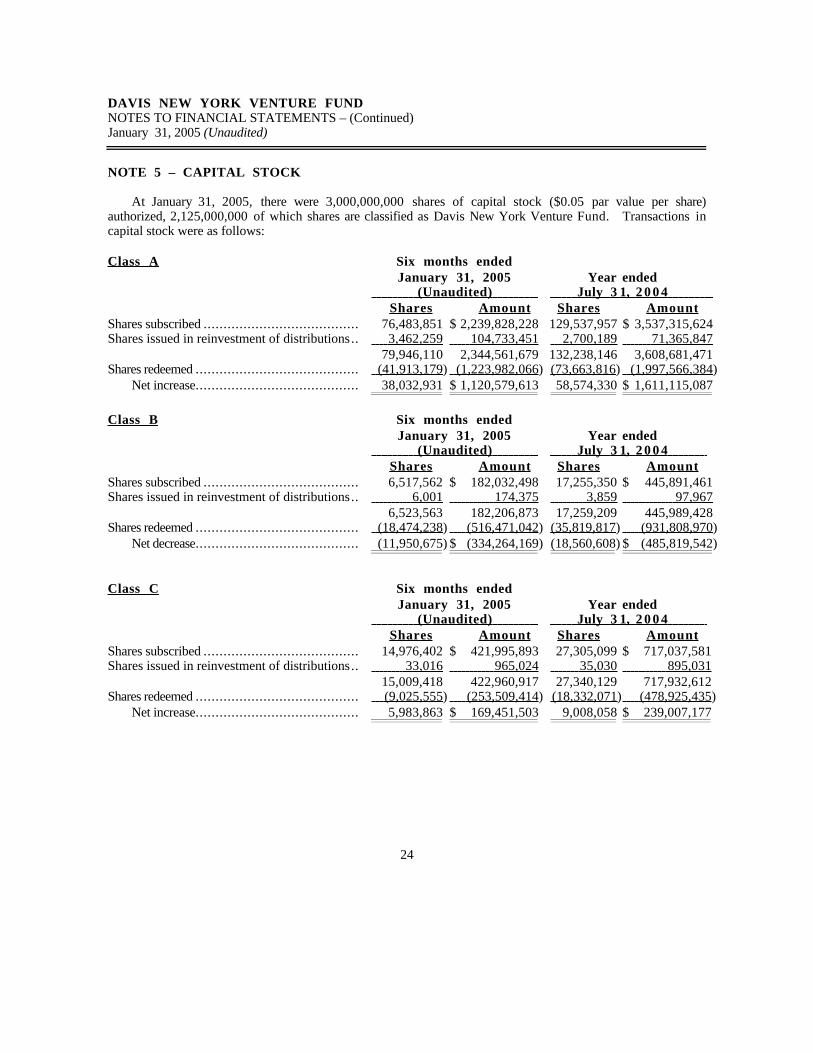
NOTE 5 – CAPITAL STOCK
At January 31, 2005, there were 3,000,000,000 shares of capital stock ($0.05 par value per share)authorized, 2,125,000,000 of which shares are classified as Davis New York Venture Fund. Transactions incapital stock were as follows:
Class A Six months endedJanuary 31, 2005 Year ended
(Unaudited) July 3 1 , 2 0 0 4 Shares Amount Shares Amount
Shares subscribed ....................................... 76,483,851 $ 2,239,828,228 129,537,957 $ 3,537,315,624Shares issued in reinvestment of distributions.. 3,462,259 104,733,451 2,700,189 71,365,847
79,946,110 2,344,561,679 132,238,146 3,608,681,471Shares redeemed ......................................... (41,913,179 ) (1,223,982,066 ) (73,663,816 ) (1,997,566,384 )
Net increase......................................... 38,032,931 $ 1,120,579,613 58,574,330 $ 1,611,115,087
Class B Six months endedJanuary 31, 2005 Year ended
(Unaudited) July 3 1 , 2 0 0 4 Shares Amount Shares Amount
Shares subscribed ....................................... 6,517,562 $ 182,032,498 17,255,350 $ 445,891,461Shares issued in reinvestment of distributions.. 6,001 174,375 3,859 97,967
6,523,563 182,206,873 17,259,209 445,989,428Shares redeemed ......................................... (18,474,238 ) (516,471,042 ) (35,819,817 ) (931,808,970 )
Net decrease......................................... (11,950,675 ) $ (334,264,169 ) (18,560,608 ) $ (485,819,542 )
Class C Six months endedJanuary 31, 2005 Year ended
(Unaudited) July 3 1 , 2 0 0 4 Shares Amount Shares Amount
Shares subscribed ....................................... 14,976,402 $ 421,995,893 27,305,099 $ 717,037,581Shares issued in reinvestment of distributions.. 33,016 965,024 35,030 895,031
15,009,418 422,960,917 27,340,129 717,932,612Shares redeemed ......................................... (9,025,555 ) (253,509,414 ) (18,332,071 ) (478,925,435 )
Net increase......................................... 5,983,863 $ 169,451,503 9,008,058 $ 239,007,177
25
DAVIS NEW YORK VENTURE FUNDNOTES TO FINANCIAL STATEMENTS – (Continued)January 31, 2005 (Unaudited)
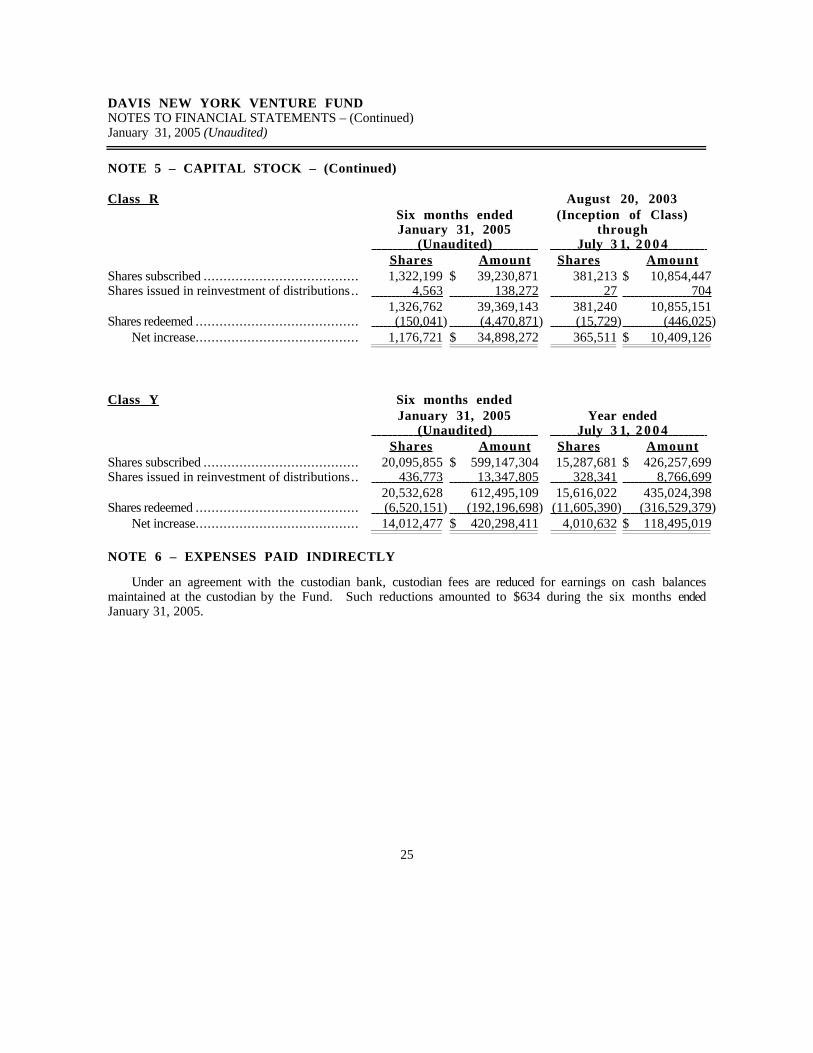
NOTE 5 – CAPITAL STOCK – (Continued)
Class R August 20, 2003Six months ended (Inception of Class)January 31, 2005 through
(Unaudited) July 3 1 , 2 0 0 4 Shares Amount Shares Amount
Shares subscribed ....................................... 1,322,199 $ 39,230,871 381,213 $ 10,854,447Shares issued in reinvestment of distributions.. 4,563 138,272 27 704
1,326,762 39,369,143 381,240 10,855,151Shares redeemed ......................................... (150,041 ) (4,470,871 ) (15,729 ) (446,025 )
Net increase......................................... 1,176,721 $ 34,898,272 365,511 $ 10,409,126
Class Y Six months endedJanuary 31, 2005 Year ended
(Unaudited) July 3 1 , 2 0 0 4 Shares Amount Shares Amount
Shares subscribed ....................................... 20,095,855 $ 599,147,304 15,287,681 $ 426,257,699Shares issued in reinvestment of distributions.. 436,773 13,347,805 328,341 8,766,699
20,532,628 612,495,109 15,616,022 435,024,398Shares redeemed ......................................... (6,520 ,151 ) (192,196,698 ) (11,605,390 ) (316,529,379 )
Net increase......................................... 14,012,477 $ 420,298,411 4,010,632 $ 118,495,019
NOTE 6 – EXPENSES PAID INDIRECTLY
Under an agreement with the custodian bank, custodian fees are reduced for earnings on cash balancesmaintained at the custodian by the Fund. Such reductions amounted to $634 during the six months endedJanuary 31, 2005.
26
DAVIS NEW YORK VENTURE FUNDNOTES TO FINANCIAL STATEMENTS – (Continued)January 31, 2005 (Unaudited)
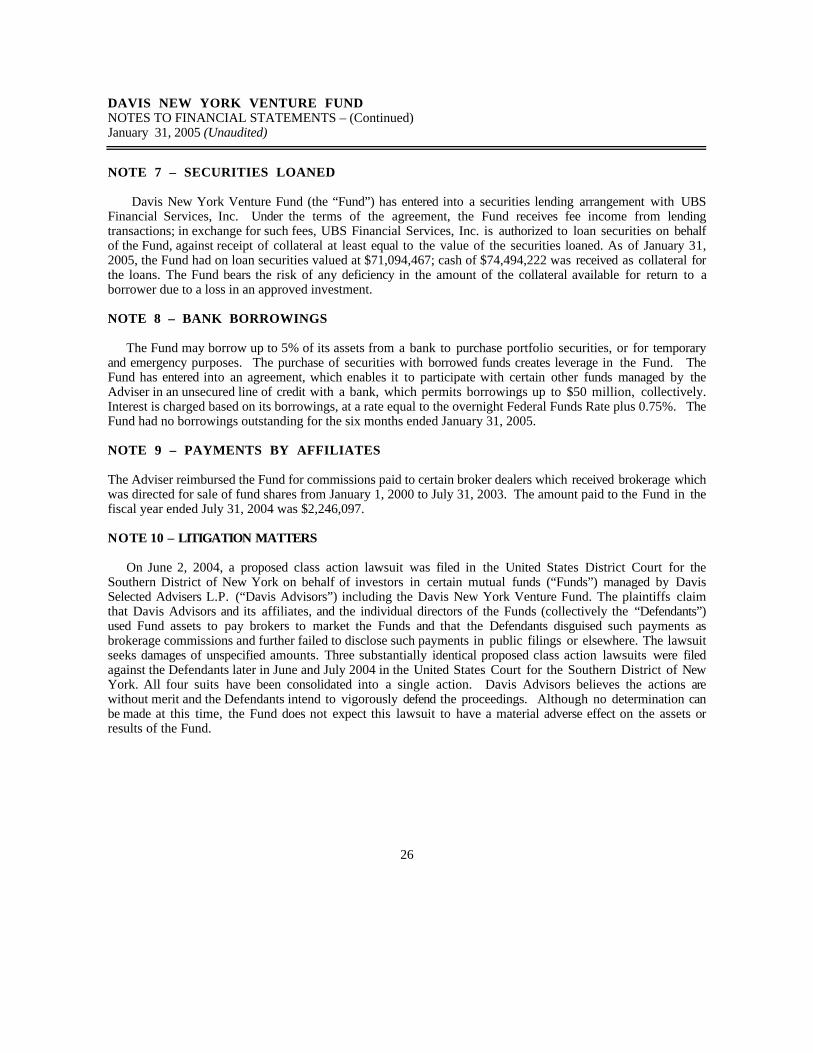
NOTE 7 – SECURITIES LOANED
Davis New York Venture Fund (the “Fund”) has entered into a securities lending arrangement with UBSFinancial Services, Inc. Under the terms of the agreement, the Fund receives fee income from lendingtransactions; in exchange for such fees, UBS Financial Services, Inc. is authorized to loan securities on behalfof the Fund, against receipt of collateral at least equal to the value of the securities loaned. As of January 31,2005, the Fund had on loan securities valued at $71,094,467; cash of $74,494,222 was received as collateral forthe loans. The Fund bears the risk of any deficiency in the amount of the collateral available for return to aborrower due to a loss in an approved investment.
NOTE 8 – BANK BORROWINGS
The Fund may borrow up to 5% of its assets from a bank to purchase portfolio securities, or for temporaryand emergency purposes. The purchase of securities with borrowed funds creates leverage in the Fund. TheFund has entered into an agreement, which enables it to participate with certain other funds managed by theAdviser in an unsecured line of credit with a bank, which permits borrowings up to $50 million, collectively.Interest is charged based on its borrowings, at a rate equal to the overnight Federal Funds Rate plus 0.75%. TheFund had no borrowings outstanding for the six months ended January 31, 2005.
NOTE 9 – PAYMENTS BY AFFILIATES
The Adviser reimbursed the Fund for commissions paid to certain broker dealers which received brokerage whichwas directed for sale of fund shares from January 1, 2000 to July 31, 2003. The amount paid to the Fund in thefiscal year ended July 31, 2004 was $2,246,097.
NOTE 10 – LITIGATION MATTERS
On June 2, 2004, a proposed class action lawsuit was filed in the United States District Court for theSouthern District of New York on behalf of investors in certain mutual funds (“Funds”) managed by DavisSelected Advisers L.P. (“Davis Advisors”) including the Davis New York Venture Fund. The plaintiffs claimthat Davis Advisors and its affiliates, and the individual directors of the Funds (collectively the “Defendants”)used Fund assets to pay brokers to market the Funds and that the Defendants disguised such payments asbrokerage commissions and further failed to disclose such payments in public filings or elsewhere. The lawsuitseeks damages of unspecified amounts. Three substantially identical proposed class action lawsuits were filedagainst the Defendants later in June and July 2004 in the United States Court for the Southern District of NewYork. All four suits have been consolidated into a single action. Davis Advisors believes the actions arewithout merit and the Defendants intend to vigorously defend the proceedings. Although no determination canbe made at this time, the Fund does not expect this lawsuit to have a material adverse effect on the assets orresults of the Fund.
27
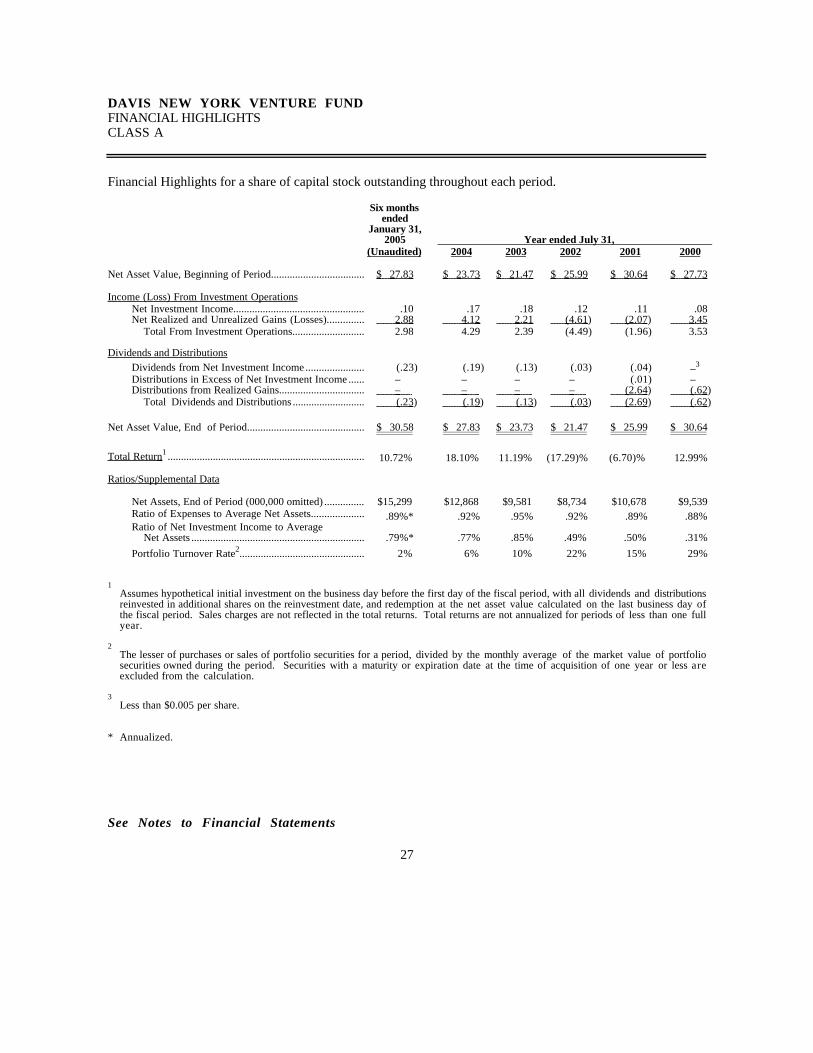
DAVIS NEW YORK VENTURE FUNDFINANCIAL HIGHLIGHTSCLASS A
Financial Highlights for a share of capital stock outstanding throughout each period.
Six monthsended
January 31,2005 Year ended July 31,
(Unaudited) 2004 2003 2002 2001 2000
Net Asset Value, Beginning of Period................................... $ 27.83 $ 23.73 $ 21.47 $ 25.99 $ 30.64 $ 27.73
Income (Loss) From Investment OperationsNet Investment Income................................................. .10 .17 .18 .12 .11 .08Net Realized and Unrealized Gains (Losses).............. 2.88 4.12 2.21 (4.61 ) (2.07 ) 3.45
Total From Investment Operations........................... 2.98 4.29 2.39 (4.49) (1.96) 3.53
Dividends and DistributionsDividends from Net Investment Income ...................... (.23) (.19) (.13) (.03) (.04) –3
Distributions in Excess of Net Investment Income ...... – – – – (.01) –Distributions from Realized Gains................................ – – – – (2.64 ) (.62 )
Total Dividends and Distributions ........................... (.23 ) (.19 ) (.13 ) (.03 ) (2.69 ) (.62 )
Net Asset Value, End of Period............................................ $ 30.58 $ 27.83 $ 23.73 $ 21.47 $ 25.99 $ 30.64
Total Return 1 ..........................................................................
10.72%
18.10%
11.19%
(17.29)%
(6.70)%
12.99%
Ratios/Supplemental Data
Net Assets, End of Period (000,000 omitted) ............... $15,299 $12,868 $9,581 $8,734 $10,678 $9,539Ratio of Expenses to Average Net Assets.................... .89%*2 .92%2 .95%2 .92%2 .89%2 .88%2
Ratio of Net Investment Income to Average Net Assets ................................................................. .79%* .77% .85% .49% .50% .31%
Portfolio Turnover Rate2............................................... 2% 6% 10% 22% 15% 29%
1 Assumes hypothetical initial investment on the business day before the first day of the fiscal period, with all dividends and distributions
reinvested in additional shares on the reinvestment date, and redemption at the net asset value calculated on the last business day ofthe fiscal period. Sales charges are not reflected in the total returns. Total returns are not annualized for periods of less than one fullyear.
2The lesser of purchases or sales of portfolio securities for a period, divided by the monthly average of the market value of portfoliosecurities owned during the period. Securities with a maturity or expiration date at the time of acquisition of one year or less areexcluded from the calculation.
3Less than $0.005 per share.
* Annualized.
See Notes to Financial Statements
28
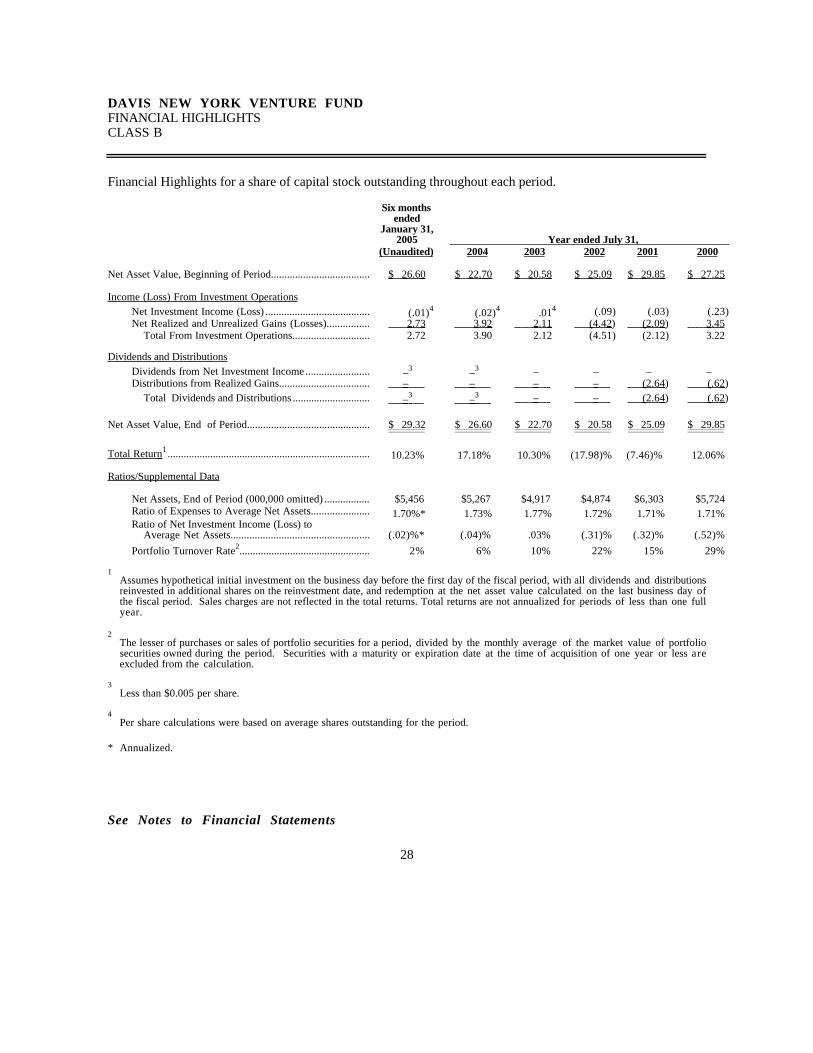
DAVIS NEW YORK VENTURE FUNDFINANCIAL HIGHLIGHTSCLASS B
Financial Highlights for a share of capital stock outstanding throughout each period.
Six monthsended
January 31,2005 Year ended July 31,
(Unaudited) 2004 2003 2002 2001 2000
Net Asset Value, Beginning of Period..................................... $ 26.60 $ 22. 70 $ 20.58 $ 25.09 $ 29.85 $ 27.25
Income (Loss) From Investment OperationsNet Investment Income (Loss) ....................................... (.01)4 (.02)4 .014 (.09) (.03) (.23)Net Realized and Unrealized Gains (Losses)................ 2.73 3.92 2.11 (4.42 ) (2.09 ) 3.45
Total From Investment Operations............................. 2.72 3.90 2.12 (4.51) (2.12) 3.22
Dividends and DistributionsDividends from Net Investment Income ........................ –3 –3 – – – –Distributions from Realized Gains.................................. – – – – (2.64 ) (.62 )
Total Dividends and Distributions ............................. – 3 – 3 – – (2.64 ) (.62 )
Net Asset Value, End of Period.............................................. $ 29.32 $ 26.60 $ 22.70 $ 20.58 $ 25.09 $ 29.85
Total Return 1 ............................................................................
10.23%
17.18%
10.30%
(17.98)%
(7.46)%
12.06%
Ratios/Supplemental Data
Net Assets, End of Period (000,000 omitted) ................. $5,456 $5,267 $4,917 $4,874 $6,303 $5,724Ratio of Expenses to Average Net Assets...................... 1.70%*2 1.73%2 1.77%2 1.72%2 1.71%2 1.71%2
Ratio of Net Investment Income (Loss) to Average Net Assets.................................................... (.02)%* (.04)% .03% (.31)% (.32)% (.52)%
Portfolio Turnover Rate2................................................. 2% 6% 10% 22% 15% 29%
1 Assumes hypothetical initial investment on the business day before the first day of the fiscal period, with all dividends and distributions
reinvested in additional shares on the reinvestment date, and redemption at the net asset value calculated on the last business day ofthe fiscal period. Sales charges are not reflected in the total returns. Total returns are not annualized for periods of less than one fullyear.
2The lesser of purchases or sales of portfolio securities for a period, divided by the monthly average of the market value of portfoliosecurities owned during the period. Securities with a maturity or expiration date at the time of acquisition of one year or less areexcluded from the calculation.
3Less than $0.005 per share.
4Per share calculations were based on average shares outstanding for the period.
* Annualized.
See Notes to Financial Statements
29
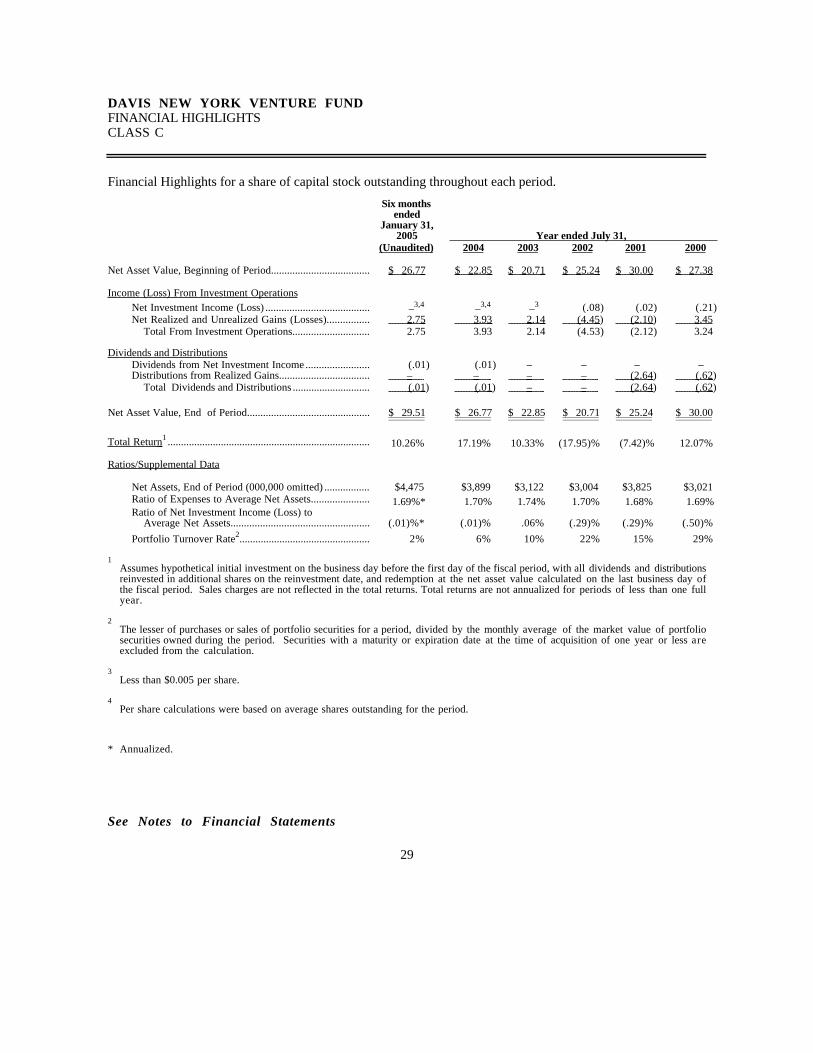
DAVIS NEW YORK VENTURE FUNDFINANCIAL HIGHLIGHTSCLASS C
Financial Highlights for a share of capital stock outstanding throughout each period.
Six monthsended
January 31,2005 Year ended July 31,
(Unaudited) 2004 2003 2002 2001 2000
Net Asset Value, Beginning of Period..................................... $ 26.77 $ 22.85 $ 20.71 $ 25.24 $ 30.00 $ 27.38
Income (Loss) From Investment OperationsNet Investment Income (Loss) ....................................... –3,4 –3,4 –3 (.08) (.02) (.21)Net Realized and Unrealized Gains (Losses)................ 2.75 3.93 2.14 (4.45 ) (2.10 ) 3.45
Total From Investment Operations............................. 2.75 3.93 2.14 (4.53) (2.12) 3.24
Dividends and DistributionsDividends from Net Investment Income ........................ (.01) (.01) – – – –Distributions from Realized Gains.................................. – – – – (2.64 ) (.62 )
Total Dividends and Distributions ............................. (.01 ) (.01 ) – – (2.64 ) (.62 )
Net Asset Value, End of Period.............................................. $ 29.51 $ 26.77 $ 22.85 $ 20.71 $ 25.24 $ 30.00
Total Return 1 ............................................................................
10.26%
17.19%
10.33%
(17.95)%
(7.42)%
12.07%
Ratios/Supplemental Data
Net Assets, End of Period (000,000 omitted) ................. $4,475 $3,899 $3,122 $3,004 $3,825 $3,021Ratio of Expenses to Average Net Assets...................... 1.69%*2 1.70%2 1.74%2 1.70%2 1.68%2 1.69%2
Ratio of Net Investment Income (Loss) to Average Net Assets.................................................... (.01)%* (.01)% .06% (.29)% (.29)% (.50)%
Portfolio Turnover Rate2................................................. 2% 6% 10% 22% 15% 29%
1 Assumes hypothetical initial investment on the business day before the first day of the fiscal period, with all dividends and distributions
reinvested in additional shares on the reinvestment date, and redemption at the net asset value calculated on the last business day ofthe fiscal period. Sales charges are not reflected in the total returns. Total returns are not annualized for periods of less than one fullyear.
2The lesser of purchases or sales of portfolio securities for a period, divided by the monthly average of the market value of portfoliosecurities owned during the period. Securities with a maturity or expiration date at the time of acquisition of one year or less areexcluded from the calculation.
3Less than $0.005 per share.
4Per share calculations were based on average shares outstanding for the period.
* Annualized.
See Notes to Financial Statements
30
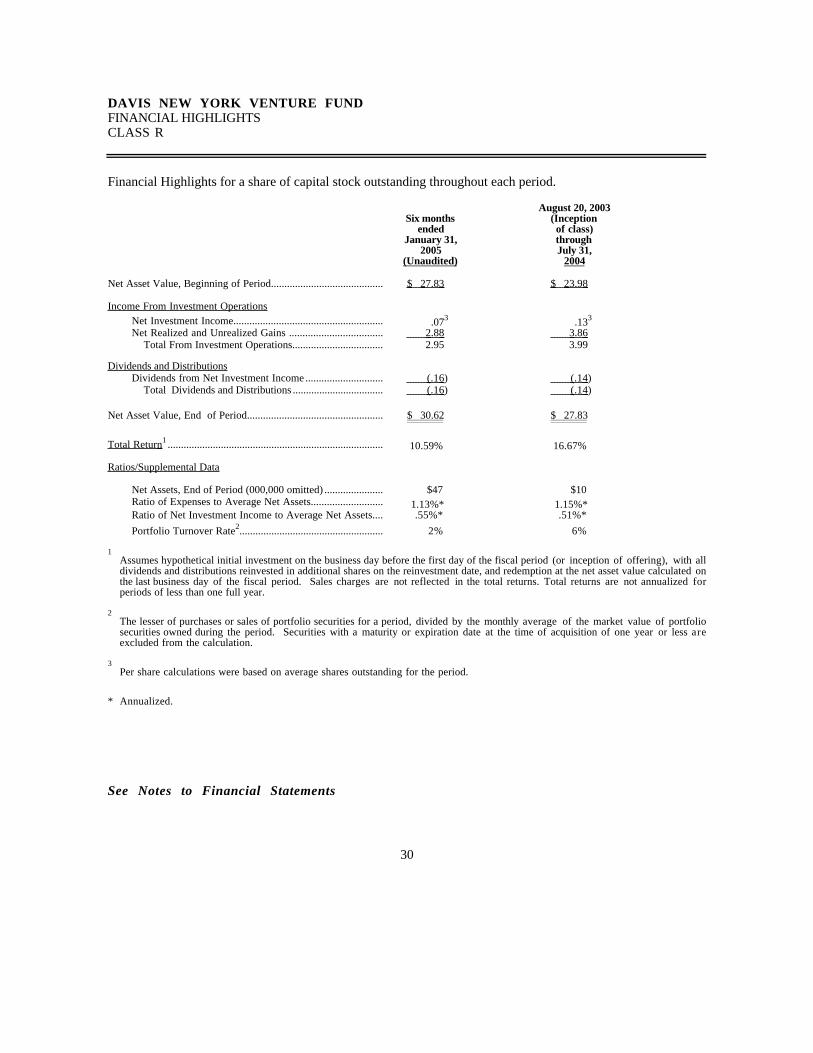
DAVIS NEW YORK VENTURE FUNDFINANCIAL HIGHLIGHTSCLASS R
Financial Highlights for a share of capital stock outstanding throughout each period.
August 20, 2003Six months (Inception
ended of class)January 31, through
2005 July 31,(Unaudited) 2004
Net Asset Value, Beginning of Period.......................................... $ 27.83 $ 23.98
Income From Investment OperationsNet Investment Income........................................................ .073 .133
Net Realized and Unrealized Gains ................................... 2.88 3.86 Total From Investment Operations.................................. 2.95 3.99
Dividends and DistributionsDividends from Net Investment Income ............................. (.16 ) (.14 )
Total Dividends and Distributions .................................. (.16 ) (.14 )
Net Asset Value, End of Period................................................... $ 30.62 $ 27.83
Total Return 1 .................................................................................
10.59%
16.67%
Ratios/Supplemental Data
Net Assets, End of Period (000,000 omitted) ...................... $47 $10Ratio of Expenses to Average Net Assets........................... 1.13%*2 1.15%*2
Ratio of Net Investment Income to Average Net Assets.... .55%* .51%*
Portfolio Turnover Rate2...................................................... 2% 6%
1 Assumes hypothetical initial investment on the business day before the first day of the fiscal period (or inception of offering), with all
dividends and distributions reinvested in additional shares on the reinvestment date, and redemption at the net asset value calculated onthe last business day of the fiscal period. Sales charges are not reflected in the total returns. Total returns are not annualized forperiods of less than one full year.
2The lesser of purchases or sales of portfolio securities for a period, divided by the monthly average of the market value of portfoliosecurities owned during the period. Securities with a maturity or expiration date at the time of acquisition of one year or less areexcluded from the calculation.
3Per share calculations were based on average shares outstanding for the period.
* Annualized.
See Notes to Financial Statements
31
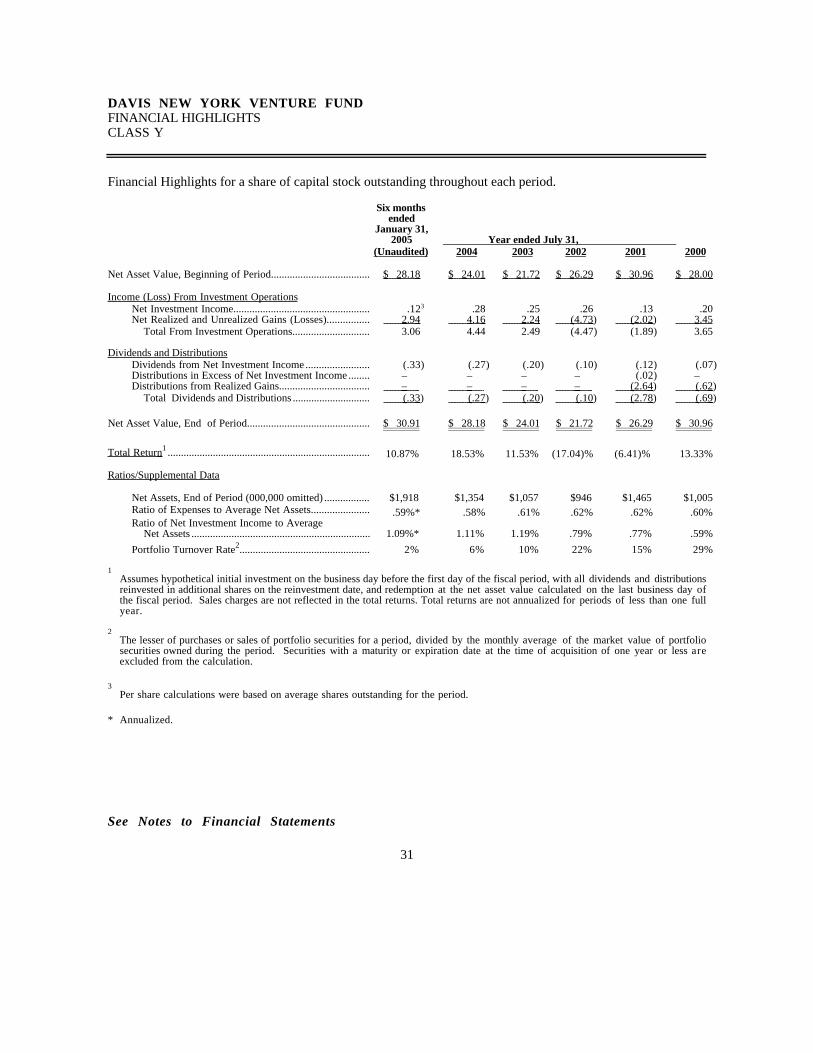
DAVIS NEW YORK VENTURE FUNDFINANCIAL HIGHLIGHTSCLASS Y
Financial Highlights for a share of capital stock outstanding throughout each period.
Six monthsended
January 31,2005 Year ended July 31,
(Unaudited) 2004 2003 2002 2001 2000
Net Asset Value, Beginning of Period..................................... $ 28.18 $ 24.01 $ 21.72 $ 26.29 $ 30.96 $ 28.00
Income (Loss) From Investment OperationsNet Investment Income................................................... .123 .28 .25 .26 .13 .20Net Realized and Unrealized Gains (Losses)................ 2.94 4.16 2.24 (4.73 ) (2.02 ) 3.45
Total From Investment Operations............................. 3.06 4.44 2.49 (4.47) (1.89) 3.65
Dividends and DistributionsDividends from Net Investment Income ........................ (.33) (.27) (.20) (.10) (.12) (.07)Distributions in Excess of Net Investment Income ........ – – – – (.02) –Distributions from Realized Gains.................................. – – – – (2.64 ) (.62 )
Total Dividends and Distributions ............................. (.33 ) (.27 ) (.20 ) (.10 ) (2.78 ) (.69 )
Net Asset Value, End of Period.............................................. $ 30.91 $ 28.18 $ 24.01 $ 21.72 $ 26.29 $ 30.96
Total Return 1 ............................................................................
10.87%
18.53%
11.53%
(17.04)%
(6.41)%
13.33%
Ratios/Supplemental Data
Net Assets, End of Period (000,000 omitted) ................. $1,918 $1,354 $1,057 $946 $1,465 $1,005Ratio of Expenses to Average Net Assets...................... .59%*2 .58%2 .61%2 .62%2 .62%2 .60%2
Ratio of Net Investment Income to Average Net Assets ................................................................... 1.09%* 1.11% 1.19% .79% .77% .59%
Portfolio Turnover Rate2................................................. 2% 6% 10% 22% 15% 29%
1 Assumes hypothetical initial investment on the business day before the first day of the fiscal period, with all dividends and distributions
reinvested in additional shares on the reinvestment date, and redemption at the net asset value calculated on the last business day ofthe fiscal period. Sales charges are not reflected in the total returns. Total returns are not annualized for periods of less than one fullyear.
2The lesser of purchases or sales of portfolio securities for a period, divided by the monthly average of the market value of portfoliosecurities owned during the period. Securities with a maturity or expiration date at the time of acquisition of one year or less areexcluded from the calculation.
3Per share calculations were based on average shares outstanding for the period.
* Annualized.
See Notes to Financial Statements
32
DAVIS NEW YORK VENTURE FUNDFund Information
Portfolio Proxy Voting Policies and Procedures
The Fund has adopted Portfolio Proxy Voting Policies and Procedures under which the Fund votes proxiesrelating to securities held by the Fund. A description of the Fund’s Portfolio Proxy Voting Policies andProcedures is available (i) without charge, upon request, by calling the Fund toll-free at 1-800-279-2279, (ii) onthe Fund’s website at www.davisfunds.com, and (iii) on the SEC’s website at www.sec.gov.
In addition, the Fund is required to file Form N-PX, with its complete proxy voting record for the 12months ended June 30th, no later than August 31st of each year. The Fund’s Form N-PX filing is available (i)without charge, upon request, by calling the Fund toll-free at 1-800-279-2279, (ii) on the Fund’s website atwww.davisfunds.com, and (iii) on the SEC’s website at www.sec.gov.
Form N–Q
The Fund files its complete schedule of portfolio holdings with the SEC for the first and third quarters ofeach fiscal year on Form N-Q. The Fund’s Form N-Q is available without charge upon request by calling 1-800-279-2279 or on the fund’s website at www.davisfunds.com or on the SEC’s website at www.sec.gov. TheFund’s Form N-Q may be reviewed and copied at the SEC’s Public Reference Room in Washington, DC, andthat information on the operation of the Public Reference Room may be obtained by calling 1-800-SEC-0330.
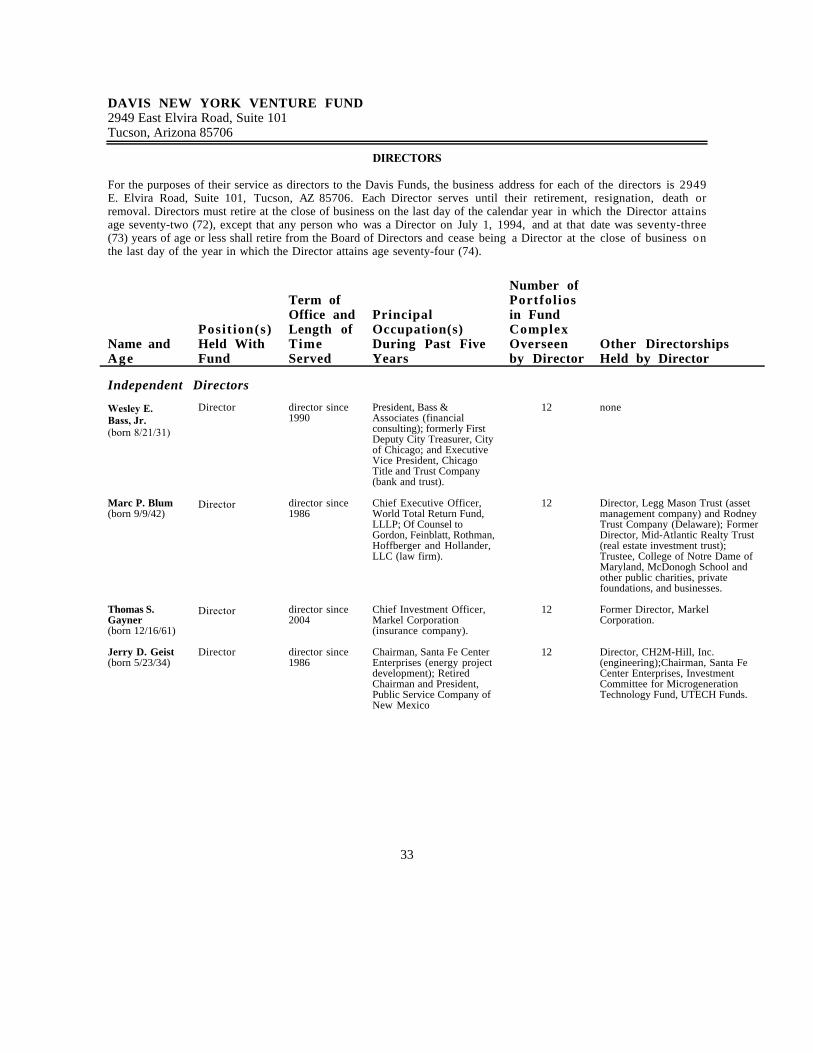
33
DAVIS NEW YORK VENTURE FUND2949 East Elvira Road, Suite 101Tucson, Arizona 85706
DIRECTORS
For the purposes of their service as directors to the Davis Funds, the business address for each of the directors is 2949E. Elvira Road, Suite 101, Tucson, AZ 85706. Each Director serves until their retirement, resignation, death orremoval. Directors must retire at the close of business on the last day of the calendar year in which the Director attainsage seventy-two (72), except that any person who was a Director on July 1, 1994, and at that date was seventy-three(73) years of age or less shall retire from the Board of Directors and cease being a Director at the close of business onthe last day of the year in which the Director attains age seventy-four (74).
Name andAge
Posit ion(s)Held WithFund
Term ofOffice andLength ofTimeServed
PrincipalOccupation(s)During Past FiveYears
Number ofPortfoliosin FundComplexOverseenby Director
Other DirectorshipsHeld by Director
Independent Directors
Wesley E.Bass, Jr.(born 8/21/31)
Director director since1990
President, Bass &Associates (financialconsulting); formerly FirstDeputy City Treasurer, Cityof Chicago; and ExecutiveVice President, ChicagoTitle and Trust Company(bank and trust).
12 none
Marc P. Blum(born 9/9/42)
Director director since1986
Chief Executive Officer,World Total Return Fund,LLLP; Of Counsel toGordon, Feinblatt, Rothman,Hoffberger and Hollander,LLC (law firm).
12 Director, Legg Mason Trust (assetmanagement company) and RodneyTrust Company (Delaware); FormerDirector, Mid-Atlantic Realty Trust(real estate investment trust);Trustee, College of Notre Dame ofMaryland, McDonogh School andother public charities, privatefoundations, and businesses.
Thomas S.Gayner(born 12/16/61)
Director director since2004
Chief Investment Officer,Markel Corporation(insurance company).
12 Former Director, MarkelCorporation.
Jerry D. Geist(born 5/23/34)
Director director since1986
Chairman, Santa Fe CenterEnterprises (energy projectdevelopment); RetiredChairman and President,Public Service Company ofNew Mexico
12 Director, CH2M-Hill, Inc.(engineering);Chairman, Santa FeCenter Enterprises, InvestmentCommittee for MicrogenerationTechnology Fund, UTECH Funds.
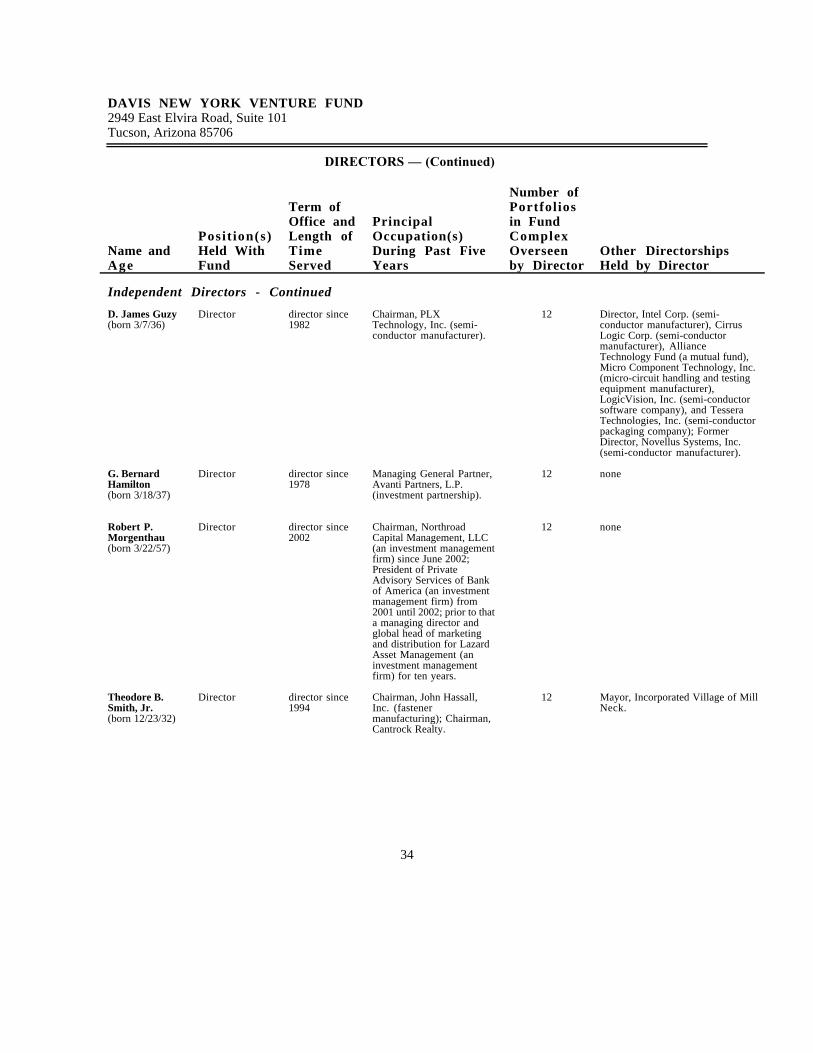
34
DAVIS NEW YORK VENTURE FUND2949 East Elvira Road, Suite 101Tucson, Arizona 85706
DIRECTORS — (Continued)
Name andAge
Posit ion(s)Held WithFund
Term ofOffice andLength ofTimeServed
PrincipalOccupation(s)During Past FiveYears
Number ofPortfoliosin FundComplexOverseenby Director
Other DirectorshipsHeld by Director
Independent Directors - Continued
D. James Guzy(born 3/7/36)
Director director since1982
Chairman, PLXTechnology, Inc. (semi-conductor manufacturer).
12 Director, Intel Corp. (semi-conductor manufacturer), CirrusLogic Corp. (semi-conductormanufacturer), AllianceTechnology Fund (a mutual fund),Micro Component Technology, Inc.(micro-circuit handling and testingequipment manufacturer),LogicVision, Inc. (semi-conductorsoftware company), and TesseraTechnologies, Inc. (semi-conductorpackaging company); FormerDirector, Novellus Systems, Inc.(semi-conductor manufacturer).
G. BernardHamilton(born 3/18/37)
Director director since1978
Managing General Partner,Avanti Partners, L.P.(investment partnership).
12 none
Robert P.Morgenthau(born 3/22/57)
Director director since2002
Chairman, NorthroadCapital Management, LLC(an investment managementfirm) since June 2002;President of PrivateAdvisory Services of Bankof America (an investmentmanagement firm) from2001 until 2002; prior to thata managing director andglobal head of marketingand distribution for LazardAsset Management (aninvestment managementfirm) for ten years.
12 none
Theodore B.Smith, Jr.(born 12/23/32)
Director director since1994
Chairman, John Hassall,Inc. (fastenermanufacturing); Chairman,Cantrock Realty.
12 Mayor, Incorporated Village of MillNeck.
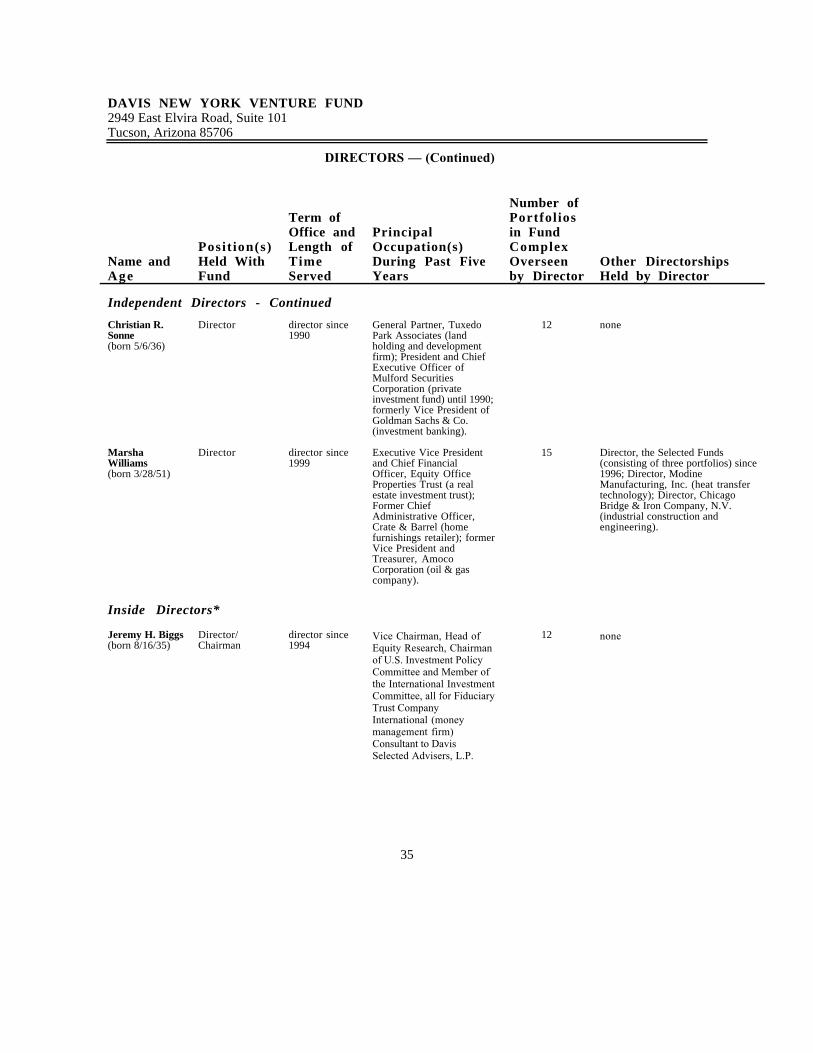
35
DAVIS NEW YORK VENTURE FUND2949 East Elvira Road, Suite 101Tucson, Arizona 85706
DIRECTORS — (Continued)
Name andAge
Posit ion(s)Held WithFund
Term ofOffice andLength ofTimeServed
PrincipalOccupation(s)During Past FiveYears
Number ofPortfoliosin FundComplexOverseenby Director
Other DirectorshipsHeld by Director
Independent Directors - Continued
Christian R.Sonne(born 5/6/36)
Director director since1990
General Partner, TuxedoPark Associates (landholding and developmentfirm); President and ChiefExecutive Officer ofMulford SecuritiesCorporation (privateinvestment fund) until 1990;formerly Vice President ofGoldman Sachs & Co.(investment banking).
12 none
MarshaWilliams(born 3/28/51)
Director director since1999
Executive Vice Presidentand Chief FinancialOfficer, Equity OfficeProperties Trust (a realestate investment trust);Former ChiefAdministrative Officer,Crate & Barrel (homefurnishings retailer); formerVice President andTreasurer, AmocoCorporation (oil & gascompany).
15 Director, the Selected Funds(consisting of three portfolios) since1996; Director, ModineManufacturing, Inc. (heat transfertechnology); Director, ChicagoBridge & Iron Company, N.V.(industrial construction andengineering).
Inside Directors*
Jeremy H. Biggs(born 8/16/35)
Director/Chairman
director since1994
Vice Chairman, Head ofEquity Research, Chairmanof U.S. Investment PolicyCommittee and Member ofthe International InvestmentCommittee, all for FiduciaryTrust CompanyInternational (moneymanagement firm)Consultant to DavisSelected Advisers, L.P.
12 none
36
DAVIS NEW YORK VENTURE FUND2949 East Elvira Road, Suite 101Tucson, Arizona 85706
DIRECTORS — (Continued)
Name andAge
Posit ion(s)Held WithFund
Term ofOffice andLength ofTimeServed
PrincipalOccupation(s)During Past FiveYears
Number ofPortfoliosin FundComplexOverseenby Director
Other DirectorshipsHeld by Director
Inside Directors* - Continued
Andrew A.Davis(born 6/25/63)
Director director since1997
President or Vice Presidentof each Davis Fund andSelected Fund; President,Davis Selected Advisers,L.P., and also serves as anexecutive officer in certaincompanies affiliated withthe Adviser.
15 Director, the Selected Funds(consisting of three portfolios) since1998.
Christopher C.Davis(born 7/13/65)
Director director since1997
Chief Executive Officer,President or Vice Presidentof each Davis Fund andSelected Fund; Chairmanand Chief ExecutiveOfficer, Davis SelectedAdvisers, L.P., and alsoserves as an executiveofficer in certaincompanies affiliated withthe Adviser, including solemember of the Adviser'sgeneral partner, DavisInvestments, LLC;Employee of Shelby CullomDavis & Co. (registeredbroker/dealer).
15 Director, the Selected Funds(consisting of three portfolios) since1998.
* Jeremy H. Biggs, Andrew A. Davis and Christopher C. Davis own partnership units (directly, indirectly or both) of the Adviser and areconsidered to be “interested persons” of the Funds as defined in the Investment Company Act of 1940. Andrew A. Davis and Christopher C.Davis are brothers.
37
DAVIS NEW YORK VENTURE FUND2949 East Elvira Road, Tucson, Arizona 85706
Directors Off icersWesley E. Bass, Jr. Jeremy H. BiggsJeremy H. Biggs ChairmanMarc P. Blum Christopher C. DavisAndrew A. Davis PresidentChristopher C. Davis Andrew A. DavisThomas S. Gayner Vice PresidentJerry D. Geist Kenneth C. EichD. James Guzy Executive Vice President & G. Bernard Hamilton Principal Executive Officer Robert P. Morgenthau Sharra L. ReedTheodore B. Smith, Jr. Vice President & Chief Compliance OfficerChristian R. Sonne Douglas A. HainesMarsha Williams Vice President
& Principal Accounting OfficerThomas D. Tays
Vice President & Secretary
Investment AdviserDavis Selected Advisers, L.P. (doing business as "Davis Advisors")2949 East Elvira Road, Suite 101Tucson, Arizona 85706(800) 279-0279
DistributorDavis Distributors, LLC2949 East Elvira Road, Suite 101Tucson, Arizona 85706
Transfer Agent & CustodianState Street Bank and Trust Companyc/o The Davis FundsP. O. Box 8406Boston, Massachusetts 02266-8406
CounselSeyfarth Shaw LLP55 East Monroe Street, Suite 4200Chicago, Illinois 60603-5803
AuditorsKPMG LLP707 Seventeenth StreetSuite 2700Denver, Colorado 80202
For m o r e i n f o r m a t i o n about Davis New York Venture Fund, I n c . i n c l u d i n g m a n a g e m e n t f e e ,charges, and expenses, see the current prospectus, which must precede or accompany t h i sreport. The Fund’s Statement of Additional Information contains additional i n f o r m a t i o nabout the Fund’s Directors and is available without charge upon request by c a l l i n g 1-800-279-0279. Quarterly Fact sheets are available on the Fund’s website a tw w w . d a v i s f u n d s . c o m .

Davis Advisors 2949 East Elvira RoadSuite 101Tucson, AZ 857061-800-279-0279davisfunds.com


