121
Exploring Solutions A N N U A L R E P O R T 2 0 1 1
E x p l o r i n g Solutions
A N N U A L R E P O R T 2 0 1 1

The quest for success must never endand in order to prevail, one must exploreand develop all possible opportunities withthe firm faith that every problem has asolution.
The challenging environment in the textilesector is an opportunity for us to identifynew areas for entry and growth. As weexplore the externa l economicenvironment, we view an opportunity todeliver Profitability in a manner that canalso benefit the People associated withus as well as the Planet we occupy. Wefeel that sustainable development throughuse of alternative energy resources e.g.wind, solar etc. is the solution to buildinga brighter and cleaner future for ourchildren, without putting any furtherpressure on the country’s alreadydiminishing natural resources.
It is our strategic intent to play a leadingrole in the development of the renewableenergy sector of the country as we firmlybelieve that this is a critical yet overlookedarea of economic development as well asthe right legacy to leave for our futuregenerations.
E x p l o r i n g Solutions

2 Vision and Mission Statement
5 Company Information
6 Operating Highlights
8 Notice of Annual General Meeting
12 Directors' Report
20 Statement of Ethics and Business Practices
22 Statement of Compliance with the Code of Corporate Governance
24 Review Report to the Members on theCode of Corporate Governance
25 Financial Statements
66 Consolidated Financial Statements
113 Pattern of Shareholding
Form of Proxy
Contents

VisionTo pursue sustained growth through adiversified business portfolio forenhancing stakeholder value
MissionTo be a responsible corporate citizenwith respect for the society
To achieve a safe and healthy businessenvironment
To provide an excellent workingenvironment and growth potential foremployees
To strive for excellence throughcommitment, integrity, honesty andteamwork
To make honest and ethical behavior away of life
To improve quality of life for ouremployees

E x p l o r i n g Solutions
During 2011, the Company continued its efforts to counterthe challenging textile business environment, acceleratethe progress of the Wind Power Project and exploreopportunities in the alternative energy sector.

Dawood Lawrencepur Limited was formedin 2004 by the amalgamation ofLawrencepur Woolen and Textile MillsLimited, Dawood Cotton Mills Limited,Burewala Textile Mills Limited and DilonLimited. For the past half century, thesecompanies have embodied tradition andquality, a common thread that now bindsthem together for the collective benefit ofall customers, shareholders, employeesand other stakeholders.
In 2008, we acquired a Wind Power Projectwhich is progressing satisfactorily and is afirst step towards establishing theCompany�s presence in the alternativeenergy domain.

Company InformationBoard of DirectorsShahid H. Pracha (Chairman)Inam ur Rahman (Chief Executive)Shafiq AhmedS.M. AsgharA. Samad DawoodShahzada DawoodHaroon MahentiSulaiman S. MehdiMir Muhammad NasirSarfaraz Ahmed Rehman
Board Audit CommitteeS.M. Asghar (Chairman)Sulaiman S. MehdiHaroon MahentiShafiq Ahmed
CFO and Company SecretaryHafsa Shamsie
AuditorsM. Yousuf Adil Saleem & Co.(Chartered Accountants)
BankersBank Al-Habib LimitedHabib Bank LimitedNational Bank of PakistanMCB Bank Limited
Legal AdvisorZia Law Associates17-Second Floor,Shah Chiragh Chambers,The Mall, Lahore.
Share RegistrarC&K Management Associates (Pvt.) Ltd.404-Trade Tower, Abdullah Haroon Road,Near Metropole Hotel, Karachi-75530
Registered / Head Office3rd Floor, Dawood Centre,M. T. Khan Road,Karachi-75530Ph#: 021-35686001-16Fax#: 021- 35633970E-mail: [email protected]: www.dawoodlawrencepur.com
MillsLandhiLandhi Industrial Area,Karachi.Ph#: 021-35018476, 35018751Fax#: 021- 35018463, 35024520
DawoodabadDistrict Vehari.Ph#: 067- 3353347, 3353145, 3353246Fax#: 067- 3354679
DawoodpurDistrict Attock.Ph#: 0597-2641074-6Fax#: 0597-2641073

06
Operating Highlights
PARTICULARS UNIT December 2011 December 2010 December 2009 (Six months period)
Continuing Discontinued Total Continuing Discontinued Total Continuing Discontinued Totaloperations operations operations operations operations operations
A) INCOME STATEMENT
1 Sales Value Rs. In (000) 374,667 7,465 382,132 380,862 11,502 392,364 193,365 24,388 217,753
2 Gross Profit / (Loss) Rs. In (000) 35,106 1,737 36,843 50,656 1,276 51,932 52,924 3,621 56,545
3 Operating Profit / (Loss) Rs. In (000) (44,747) (46,436) (91,183) (13,316) (38,874) (52,190) 30,602 (24,552) 6,050
4 Profit / (Loss) Before Taxation Rs. In (000) 55,089 (30,535) 24,554 124,017 (40,452) 83,565 (84,337) (22,639) (106,976)
5 Profit / (Loss) After Taxation Rs. In (000) 46,793 (30,535) 16,258 99,956 (40,452) 59,504 (85,426) (22,639) (108,065)
B) DIVIDEND
1 Cash Dividend % 10 - 10 5 - 5 - - -
2 Stock Dividend % - - - 15 - 15 - - -
C) BALANCE SHEET
1 Total Assets Employed Rs. In (000) 1,540,995 188,675 1,729,670 1,512,696 195,272 1,707,968 975,148 708,993 1,684,141
2 Current Assets Rs. In (000) 1,133,714 - 1,133,714 1,262,848 - 1,262,848 549,450 - 549,450
3 Current Liabilities Rs. In (000) 130,910 - 130,910 133,907 - 133,907 148,741 - 148,741
4 Paid Up Capital Rs. In (000) 590,578 - 590,578 513,547 - 513,547 513,547 - 513,547
5 Shareholders Equity Rs. In (000) 1,539,875 - 1,539,875 1,525,504 - 1,525,504 1,490,705 - 1,490,705
6 No. of Ordinary Shares In (000) 59,058 - 59,058 59,058 - 59,058 59,058 - 59,058
D) RATIO ANALYSIS
1 Gross Profit / (Loss) % 9.36 23.26 9.64 13.30 11.09 13.24 27.36 14.84 25.97
2 Earning Per Share Rs. 0.79 (0.52) 0.27 1.69 (0.68) 1.01 (1.44) (0.38) (1.82)
3 Dividend Yield % - - 3 - - 5 - - -
4 Return on Equity % - - 1 - - 3.90 - - (7.25)
5 Break-up Value of Shares Rs. - - 26.07 - - 25.80 - - 25.24
6 Market Value of Shares Rs. - - 31.46 - - 43.47 - - 59.02
7 Price Earning Ratio Rs. - - 116.52 - - 43.04 - - (32.42)
8 Dividend Payout Ratio % - - 363 - - 198 - - -
E) PRODUCTION
1 Capacity
Polyester Yarn Kgs In (000) - - - - - - - 700 700
Yarn Kgs In (000) 358 - 358 358 - 358 179 12,581 12,760
Cloth Mtrs In (000) 754 - 754 754 - 754 377 2,153 2,530
2 Actual Production
Polyester Yarn Kgs In (000) - - - - - - - - -
Yarn Kgs Kgs In (000) 136 - 136 170 - 170 93 - 93
Cloth Mtrs. Mtrs In (000) 541 - 541 664 - 664 307 - 307
3 Capacity Utilization - Yarn % 38 - 38 47.49 - 47.49 51.96 - 51.96
- Cloth % 72 - 72 88.06 - 88.06 81.43 - 81.43
F) OTHERS
1 Employees Nos. 617 154 771 649 166 815 612 23 635
2 Capital Expenditures Rs. In (000) 3,207 - 3,207 8,725 - 8,725 3,986 - 3,986
Note:The earning per share, break-up value of shares, price earning ratio and dividend payout ratio for prior years have been restated to take into account theissue of bonus shares in 2007, 2008 & 2010.

June 2009 June 2008 June 2007 (Restated)
Continuing Discontinued Total Continuing Discontinued Total Continuing Discontinued Total operations operations operations operations operations operations
350,372 29,847 380,219 368,294 321,544 689,838 1,221,322 408,277 1,629,599
76,512 996 77,508 73,921 (240,918) (166,997) 60,884 (43,275) 17,609
35,389 (91,111) (55,722) 29,190 (292,087) (262,897) (39,056) (67,849) (106,905)
(94,956) (92,328) (187,284) 113,784 (300,826) (187,042) 92,456 (72,349) 20,107
(104,156) (92,179) (196,335) 105,308 (302,433) (197,125) 94,202 (74,390) 19,812
- - - - - - - - -
- - - 10 - 10 10 - 10
940,985 729,759 1,670,744 1,032,729 758,367 1,791,096 2,036,424 376,699 2,413,123
467,189 - 467,189 440,796 - 440,796 807,564 - 807,564
142,657 - 142,657 170,566 - 170,566 303,431 - 303,431
513,547 - 513,547 466,861 - 466,861 424,419 - 424,419
1,486,466 - 1,486,466 1,582,791 - 1,582,791 2,003,436 - 2,003,436
59,058 - 59,058 59,058 - 59,058 59,058 - 59,058
21.84 3.34 20.38 20.07 (74.93) (24.21) 4.99 (10.60) 1.08
(1.76) (1.56) (3.32) 1.78 (5.12) (3.34) 1.59 (1.25) 0.34
- - - 0.71 - 0.71 1.22 - 1.22
- - (13.21) - - (12.45) - - 0.99
- - 25.17 - - 26.80 - - 33.94
- - 34.68 - - 141.63 - - 82.00
- - (10.44) - - (42.40) - - 241.17
- - - - - (29.95) - - 298.09
- - 1,400 - - 1,400 - - 1,400
- - 25,519 - - 25,619 - - 25,619
- - 5,060 - - 5,060 - - 5,060
- - - - - - - - 538
- - 229 - - 885 - - 10,341
- - 796 - - 805 - - 1,063
- - 0.89 - - 3.28 - - 40.26
- - 15.73 - - 15.91 - - 21.01
604 23 627 548 174 722 1,182 868 2,050
164,515 - 164,515 3,037 - 3,037 32,358 - 32,358
Annual Report 2011 07

Notice of Annual General Meeting
Notice is hereby given that the Sixty Second Annual General Meeting of Dawood Lawrencepur Limitedwill be held at Karachi Marriott Hotel, 9, Abdullah Haroon Road, Karachi at 1130 hours on Monday,April 23, 2012, to transact the following business after recitation from the Holy Quran:
Ordinary Business
1. To receive, consider and adopt the Audited Accounts of the Company for the year ended December31, 2011 together with the Auditors' and Directors' Reports thereon.
2. To consider and, if thought fit, approve payment of final cash dividend at the rate of Rs. 1/- perordinary share of Rs. 10/- each (10%) for the year ended December 31, 2011 as recommendedby the Board of Directors.
3. To appoint the Auditors for the year ending December 31, 2012 and to fix their remuneration. Theretiring Auditors, Messrs M. Yousuf Adil Saleem & Company, being eligible, offer themselves forre-appointment.
Special Business
To consider and if thought fit, pass with or without modification(s) the following resolutions as specialresolutions for alteration of the Object Clause III of the Memorandum of Association of the Company:
≈RESOLVED that subject to the confirmation by the Securities and Exchange Commission ofPakistan (the "SECP"), the Clause III of the Memorandum of Association of the Company be andis hereby altered as under:
(i) The existing sub-clause (22) and sub-clause (57) be omitted and replaced with the followingnew sub-clause:
(22) To invest any of the moneys and funds of the Company from time to time in governmentsecurities or in securities guaranteed by any government or in debentures or other securitiesguaranteed by any government or in debentures or other securities for money issued by oron behalf of any municipal body or of any corporate body or in any shares or securities of anycompany (including any associate company(ies), subsidiaries or undertaking with whom thiscompany has relationship or assistance) as may from time to time be determined by thedirectors or in the mortgage of immovable properties whether freehold or leasehold or of anyother tenure or on the pledge of movable property as the directors may from time to timedetermine in their fixed deposits or by way of loans, on interest in any bank or with any firms,companies, or banks, including the (Agents of the Company) or in such other securities asmay from time to time be determined by the directors and from time to time sell or vary all suchinvestments as to execute all assignments, transfer receipts and documents that may benecessary in that behalf.
(57) To enter into any partnerships or into any arrangement to acquire majority or minorityequity stake or management control of any company doing any business or trade which is (a)compatible with the objectives of the Company; or (b) related to alternative / renewable energy,which alternative / renewable energy business shall include but not be limited to (i) representinginternational brands, carrying out manufacturing, sales and distribution of alternative / renewable
08

energy products; (ii) entering into partnerships or joint ventures with international firms, localmanufacturers and technology providers with group companies or other sales / distributioncompanies; (iii) providing after sales and other services in respect of alternative / renewableenergy products; and (iv) exploring any potential investments with private equity / venturecapital funds for the purposes of making investment in local and / or international alternative /renewable energy ventures. The Company shall be free to enter into the businesses mentionedherein through negotiation, bargaining, auction, stock exchange transaction or participationin Government Privatization program etc. and take all necessary or proper steps with theapproval of the Government of Pakistan where required, with any provincial government or anyforeign government or public authority, local municipal or otherwise or with any corporationor private persons or all or any of these purposes of directly or indirectly, for sharing profits,union of interests, co-operation, joint ventures, reciprocal concessions, or otherwise with anyindividual, form, co-operative or other company, associate, affiliate, association, corporatebody, research and education institutions, affiliates, Government or local authority or other legalentity whether national or not as may be necessary or expedient for the purposes of carryingon the business of the Company.
(ii) A new sub-clause (59) be added:
(59) Subject to applicable law, the Company may (a) lend and advance money or give creditto any person or company (including its subsidiaries and affiliates); (b) issue/obtain the guaranteeof repayment of any finance or debt or performance of any contract, obligation or promise orstand surety in respect thereof for any associated company, subsidiary or undertaking withwhom this Company has relationship or assistance for mutual advantage and benefit andwhich may be conducive and/or incidental to the promotion or advancement of the businessand operation of the Company; (c) guarantee and give guarantees or indemnities or othersimilar commitments for the payment of money or the performance of contracts or obligationsby any person or company (including its subsidiaries and affiliate companies); (d) secure orundertake the repayment of money lent or advanced to or the liabilities incurred by any personor company; (e) issue corporate guarantees in favour of associated companies or subsidiariesor create any mortgage, hypothecation or floating charge or lien on all or any of the assets andproperties of the Company for the purposes of securing obligations of any person includingits associated companies or subsidiaries; and (f) otherwise assist any person or company.
(iii) After the existing sub-clause (16), the following new sub-clause (16A) is added:
(16A) To enter into any arrangements or contracts with any government or authority, supreme,municipal, local, international or otherwise, that may seem conducive to the Company's objectsor any one of them, and to obtain from such institution, loans, credit and financial facilities inlocal and/or foreign currency from banks and other financial institutions operating in Pakistanand abroad, and subject to necessary approval from the Government of Pakistan, to secureforeign equity and technical collaboration financing from international sources, proceeds ofwhich are to be used for the development, ownership and construction, operation andmaintenance, any rights, authority, privileges and options, concessions and licenses, and tocarry out, exercise or comply with any such arrangements, agreements, rights, privileges,concessions and licenses, and to procure the Company to be registered or recognized in anypart of the world.
Annual Report 2011 09

10
FURTHER RESOLVED that a petition be filed with the SECP under Section 21 of the CompaniesOrdinance, 1984 and the Chief Executive Officer and the Company Secretary be and arehereby jointly and severally authorized to undertake all such actions and to do all such thingsfor and on behalf of the Company including all requisite legal and corporate formalities foreffectuating the alteration of the Memorandum of Association.Δ
For and on behalf of the Board
Karachi Hafsa ShamsieMarch 1, 2012 Company Secretary
Notes:
1. The register of members of the Company will remain closed and no transfer of shares will beaccepted for registration from Monday, April 16, 2012 to Monday, April 23, 2012 (both daysinclusive). Transfers received in order at the office of the Company's Share Registrar, M/s. C & KManagement Associates (Private) Limited, 404-Trade Tower, Abdullah Haroon Road, Near MetropoleHotel, Karachi by the close of business (1600 hours) on Friday, April 13, 2012 will be treated intime for the purpose of attending the Annual General Meeting.
2. All Members of the Company are entitled to attend the Meeting and vote there at in person orthrough Proxy. A Proxy, duly appointed, shall have such rights in respect to speaking and votingat the Meeting as are available to a Member. The proxies shall produce their original CNICs ororiginal Passport at the time of the Meeting.
3. A Member of the Company may appoint another Member as his/her Proxy to attend and voteinstead of him/her. A Corporation being a Member may appoint any person, whether or not aMember of the Company, as its Proxy. In the case of corporate entities, the Board of Directors'Resolution / Power of Attorney with specimen signature of the person nominated to represent andvote on behalf of the corporate entity, unless provided earlier, shall be submitted to the Companyalong with the Proxy Form.
4. Members who have deposited their shares into Central Depository Company of Pakistan Limited(≈CDCΔ) will further have to follow the under mentioned guidelines as laid down by the Securitiesand Exchange Commission of Pakistan.
A. For Attending the Meeting
a. In case of Individuals, the account holder and/or sub-account holder whose registrationdetails are uploaded as per the CDC Regulations, shall authenticate his/her identity byshowing his/her original CNIC or, original Passport at the time of attending the Meeting.

Annual Report 2011 11
b. In case of corporate entity, the Board's Resolution / Power of attorney with specimensignature of the nominee shall be produced (unless it has been provided earlier) at thetime of the Meeting.
B. For Appointing Proxies
a. In case of individuals, the account holder and/or sub-account holder whose registrationdetails are uploaded as per the CDC Regulations, shall submit the Proxy Form as perabove requirements.
b. The proxy form shall be witnessed by two persons, whose names, addresses and CNICnumbers shall be mentioned on the form.
c. Attested copies of the CNIC or the passport of beneficial owners and the proxy shall befurnished with the Proxy Form.
d. The proxy shall produce his / her original CNIC or original passport at the time of theMeeting.
e. In case of corporate entity, the Board's Resolution / Power of Attorney with specimensignature shall be furnished (unless it has been provided earlier) along with Proxy Formto the Company.
5. In order to be effective, Proxy Forms, duly filled and signed, must be received at the Company'sRegistered Office, not less than forty eight (48) hours before the Meeting. A blank Proxy Form isattached herewith.
STATEMENT OF MATERIAL FACTS UNDER SECTION 160(1)(b) OF THE COMPANIES ORDINANCE,1984 RELATING TO THE SPECIAL BUSINESS TO BE TRANSACTED AT THE ANNUAL GENERALMEETING SCHEDULED TO BE HELD ON APRIL 23, 2012
Alteration of Memorandum of Association
The Board of Directors of the Company has approved and recommended alteration in the ObjectClause III of the Memorandum of Association of the Company to include therein the provision ofsecurity support and guarantees on behalf of associated companies and subsidiaries, to enlargethe scope of sub-clauses empowering the Company to invest funds in securities of associatedcompanies and subsidiaries and to make investments in renewable energy projects as minorityor majority partners etc. The proposed amendments will enlarge the scope of the object clauseby allowing the Company to carry on the business not being the business specified in its existingMemorandum of Association.
The directors have no direct or indirect interest in the above said special business save theirshareholding in the Company.
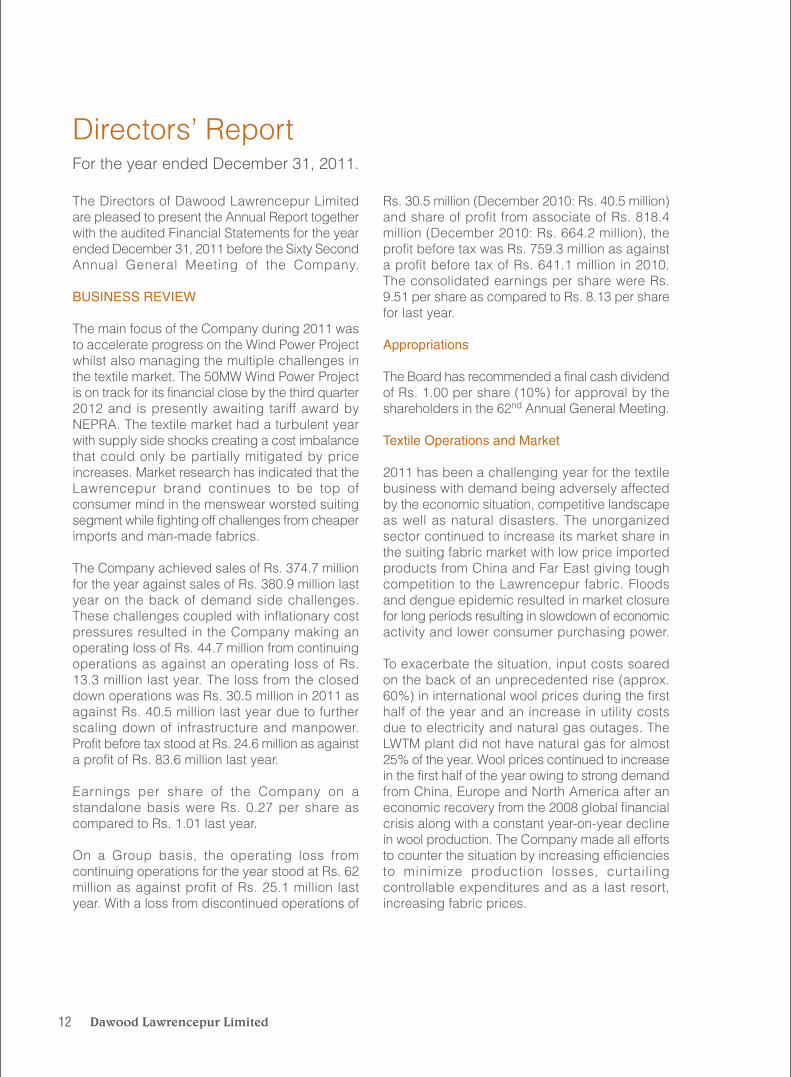
For the year ended December 31, 2011.
The Directors of Dawood Lawrencepur Limitedare pleased to present the Annual Report togetherwith the audited Financial Statements for the yearended December 31, 2011 before the Sixty SecondAnnual General Meeting of the Company.
BUSINESS REVIEW
The main focus of the Company during 2011 wasto accelerate progress on the Wind Power Projectwhilst also managing the multiple challenges inthe textile market. The 50MW Wind Power Projectis on track for its financial close by the third quarter2012 and is presently awaiting tariff award byNEPRA. The textile market had a turbulent yearwith supply side shocks creating a cost imbalancethat could only be partially mitigated by priceincreases. Market research has indicated that theLawrencepur brand continues to be top ofconsumer mind in the menswear worsted suitingsegment while fighting off challenges from cheaperimports and man-made fabrics.
The Company achieved sales of Rs. 374.7 millionfor the year against sales of Rs. 380.9 million lastyear on the back of demand side challenges.These challenges coupled with inflationary costpressures resulted in the Company making anoperating loss of Rs. 44.7 million from continuingoperations as against an operating loss of Rs.13.3 million last year. The loss from the closeddown operations was Rs. 30.5 million in 2011 asagainst Rs. 40.5 million last year due to furtherscaling down of infrastructure and manpower.Profit before tax stood at Rs. 24.6 million as againsta profit of Rs. 83.6 million last year.
Earnings per share of the Company on astandalone basis were Rs. 0.27 per share ascompared to Rs. 1.01 last year.
On a Group basis, the operating loss fromcontinuing operations for the year stood at Rs. 62million as against profit of Rs. 25.1 million lastyear. With a loss from discontinued operations of
Rs. 30.5 million (December 2010: Rs. 40.5 million)and share of profit from associate of Rs. 818.4million (December 2010: Rs. 664.2 million), theprofit before tax was Rs. 759.3 million as againsta profit before tax of Rs. 641.1 million in 2010.The consolidated earnings per share were Rs.9.51 per share as compared to Rs. 8.13 per sharefor last year.
Appropriations
The Board has recommended a final cash dividendof Rs. 1.00 per share (10%) for approval by theshareholders in the 62nd Annual General Meeting.
Textile Operations and Market
2011 has been a challenging year for the textilebusiness with demand being adversely affectedby the economic situation, competitive landscapeas well as natural disasters. The unorganizedsector continued to increase its market share inthe suiting fabric market with low price importedproducts from China and Far East giving toughcompetition to the Lawrencepur fabric. Floodsand dengue epidemic resulted in market closurefor long periods resulting in slowdown of economicactivity and lower consumer purchasing power.
To exacerbate the situation, input costs soaredon the back of an unprecedented rise (approx.60%) in international wool prices during the firsthalf of the year and an increase in utility costsdue to electricity and natural gas outages. TheLWTM plant did not have natural gas for almost25% of the year. Wool prices continued to increasein the first half of the year owing to strong demandfrom China, Europe and North America after aneconomic recovery from the 2008 global financialcrisis along with a constant year-on-year declinein wool production. The Company made all effortsto counter the situation by increasing efficienciesto minimize production losses, curtailingcontrollable expenditures and as a last resort,increasing fabric prices.
12
Directors» Report

E x p l o r i n g Solutions
The Lawrencepur brand remains very strong andhas top of the mind recall amongst formal suitingcustomers.
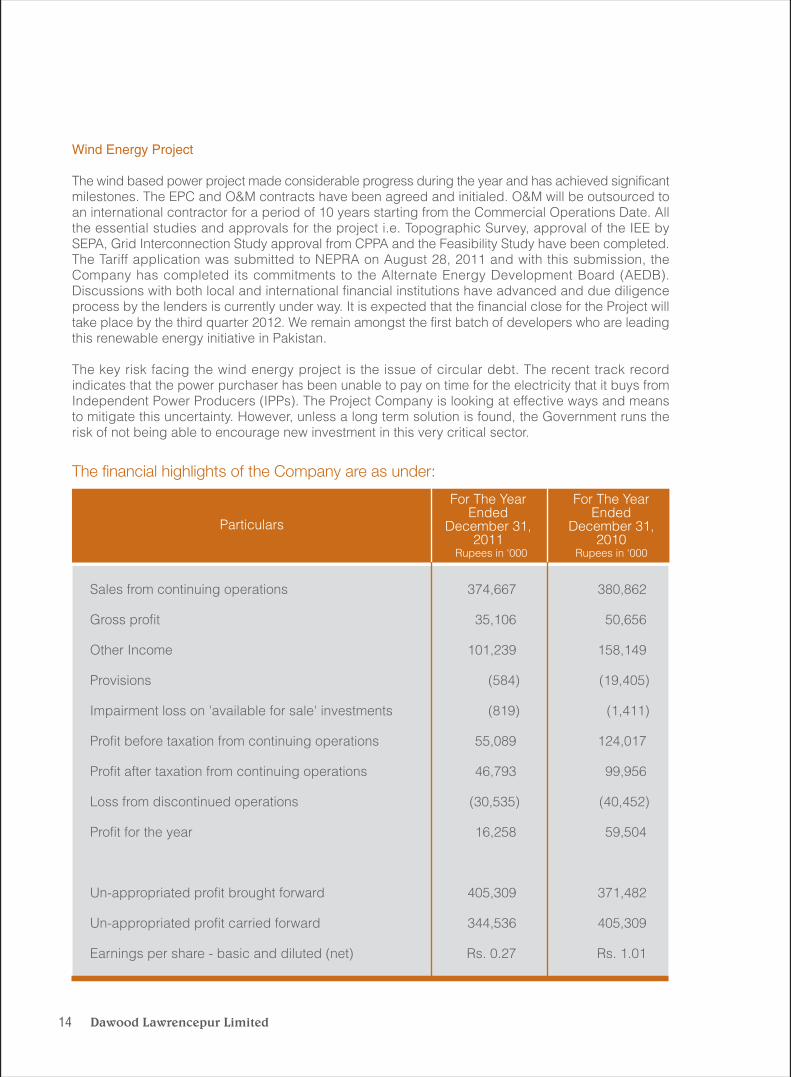
Wind Energy Project
The wind based power project made considerable progress during the year and has achieved significantmilestones. The EPC and O&M contracts have been agreed and initialed. O&M will be outsourced toan international contractor for a period of 10 years starting from the Commercial Operations Date. Allthe essential studies and approvals for the project i.e. Topographic Survey, approval of the IEE bySEPA, Grid Interconnection Study approval from CPPA and the Feasibility Study have been completed.The Tariff application was submitted to NEPRA on August 28, 2011 and with this submission, theCompany has completed its commitments to the Alternate Energy Development Board (AEDB).Discussions with both local and international financial institutions have advanced and due diligenceprocess by the lenders is currently under way. It is expected that the financial close for the Project willtake place by the third quarter 2012. We remain amongst the first batch of developers who are leadingthis renewable energy initiative in Pakistan.
The key risk facing the wind energy project is the issue of circular debt. The recent track recordindicates that the power purchaser has been unable to pay on time for the electricity that it buys fromIndependent Power Producers (IPPs). The Project Company is looking at effective ways and meansto mitigate this uncertainty. However, unless a long term solution is found, the Government runs therisk of not being able to encourage new investment in this very critical sector.
14
The financial highlights of the Company are as under:
Sales from continuing operations 374,667 380,862
Gross profit 35,106 50,656
Other Income 101,239 158,149
Provisions (584) (19,405)
Impairment loss on 'available for sale' investments (819) (1,411)
Profit before taxation from continuing operations 55,089 124,017
Profit after taxation from continuing operations 46,793 99,956
Loss from discontinued operations (30,535) (40,452)
Profit for the year 16,258 59,504
Un-appropriated profit brought forward 405,309 371,482
Un-appropriated profit carried forward 344,536 405,309
Earnings per share - basic and diluted (net) Rs. 0.27 Rs. 1.01
For The YearEnded
December 31,2011
For The YearEnded
December 31,2010
Rupees in «000 Rupees in «000
Particulars

Annual Report 2011 15
Asset Disposal Program
During the year, the Directors recommended thesale of all assets including land, building/civil-works, plant, machinery etc. of the Company'sdiscontinued units i.e. Burewala Textile Mills,Dawood Cotton Mills and Dilon Mills. Subsequentto the year end, the shareholders approved theplanned sale in an Extraordinary General Meetingheld on January 25, 2012 and the Company isworking towards timely completion of this activity.In line with the Company's strategic intent, theCompany will utilize the sales proceeds towardsestablishing its position in the renewable energysector.
CORPORATE GOVERNANCE
The management of the Company is committedto good corporate governance and complyingwith best practices. The requirements of the Code
of Corporate Governance set out by the KarachiStock Exchange and Lahore Stock Exchange intheir Listing Regulations have been duly compliedwith. A Statement to this effect is annexed withthe Report.
STATEMENT OF ETHICS AND BUSINESSPRACTICES
The Board has adopted the Statement of Ethicsand Business Practices and all employees areaware of and have signed off on this Statement.The Code of Ethics and Business Practices isrigorously followed throughout the organizationas all employees observe the rules of businessconduct laid down therein.
VISION AND MISSION
The statement reflecting the Vision and Missionof the Company is annexed to the Report.

The wind based power project made considerableprogress during the year and we remain among thefirst batch of developers leading the renewableenergy initiative in Pakistan.

E x p l o r i n g Solutions

18
CORPORATE AND FINANCIAL REPORTINGFRAMEWORK
It is certified that:
(i) The financial statements together with notesthereon have been drawn up by managementin conformity with the Companies Ordinance,1984. These statements present fairly theCompany's state of affairs, the result of itsoperations, cash flows and changes in equity.
(ii) The Company has maintained proper booksof accounts.
(iii) Appropriate accounting policies have beenconsistently applied in the preparation offinancial statements, and accountingestimates are based on reasonable andprudent judgment.
(iv) International Financial Reporting Standards,as applicable in Pakistan, have been followedin the preparation of financial statements andthere has been no departure there from.
(v) The system of internal control is sound indesign and has been effectively implementedand monitored.
(vi) The annual audited financial statements arecirculated within four months of the close ofthe financial year.
(vii) There are no significant doubts about theCompany's ability to continue as a goingconcern.
(viii) There has been no material departure fromthe best practices of corporate governance,as detailed in the Stock Exchange ListingRegulations.
BOARD AUDIT COMMITTEE
The Board of Directors has established an AuditCommittee, in compliance with the Code ofCorporate Governance, which oversees internalcontrols and compliance and has been workingefficiently since its inception. The Audit Committeereviewed the quarterly, half-yearly and annualfinancial statements before submission to theBoard and their publication. The Audit Committeehad detailed discussions with the external auditorson various issues, including their letter to themanagement. The Audit Committee also reviewedinternal auditors' findings and held separatemeetings with internal and external auditors as
required under the Code of CorporateGovernance.
PATTERN OF SHAREHOLDING
The statement reflecting the pattern ofshareholding is annexed to the Report.
KEY OPERATING AND FINANCIAL DATA
Summary of key operating and financial data forthe last six financial years is attached to the Report.
STATUTORY PAYMENTS
As on the date of closing, no government taxes,duties, levies and charges were outstanding oroverdue except for routine payments of variouslevies and amounts in dispute pending decisionin various appellate forums and the same havebeen disclosed in the financial statements.
VALUE OF INVESTMENTS OF GRATUITY FUNDAND PROVIDENT FUND
The face value of the investments of the Gratuityand Provident Fund of the management cadrestaff was 11.65 million on the closing date.
TRADING IN COMPANY SHARES
The Directors, CEO, CFO and Company Secretaryhave not traded in Company shares during theyear except Mr. A. Samad Dawood who purchased169,943 shares of the company.
BOARD MEETINGS
During the year ended December 31, 2011, atotal of ten meetings of the Board of Directorswere held. The position of attendance duringrespective tenure was as follows:
MeetingsName of Director Held Attended
Mr. Shahid Hamid Pracha 10 10Mr. Inam ur Rahman 10 10Mr. Isar Ahmad (Resigned) 9 9Mr. Shahzada Dawood 10 3Mr. A Samad Dawood 10 9Mr. S. M. Asghar 10 6Mr. Haroon Mahenti 10 6Mr. Shafiq Ahmed 10 10Mr. Mir Muhammad Nasir 10 6Mr. Sulaiman Sadruddin Mehdi 10 9Mr. Sarfaraz Ahmed Rehman 1 1

Annual Report 2011 19
During the year Mr. Isar Ahmad resigned from theBoard on December 14, 2011 and Mr. SarfarazAhmed Rehman was appointed as Director in hisplace on December 21, 2011. The Board wouldlike to record its appreciation for the distinctiveand valuable contribution made by Mr. Isar Ahmadas Director and Chairman of the Board andwelcomes Mr. Sarfaraz Rehman to the Board.
Mr. Shahid Hamid Pracha was appointed asChairman of the Board on December 21, 2011 inplace of Mr. Isar Ahmad.
CERTIFICATE OF RELATED PARTYTRANSACTIONS
It is confirmed that the transactions entered intowith related parties have been ratified by the AuditCommittee and the Board and the Report providesinformation about the amounts due from all relatedparties at the Balance Sheet date.
FUTURE OUTLOOK
The Lawrencepur brand remains very strong andhas top of the mind recall amongst formal suitingcustomers. Whilst overall economic recoveryappears to be a challenge in the short term, theretail economy has begun showing some signsof improved activity at the start of 2012.TheCompany expects inflationary pressures to persiston account of rising utility costs and a weakeningRupee however, it anticipates the overall inputcost rise to be tempered by a relatively stablewool market. The changing competitive landscapein the woolen textiles market has led the Companyto reassess its operational strategy and the focusin the upcoming year will be upon rationalizingproduction costs, investing in human resources,building strategic alliances for a broader retailpresence, powerful advertising, and redefiningthe sourcing strategy, in a bid to create the bestvalue possible for the business going forward.
The 50 MW Wind Power Project being managedby Tenaga Generasi Limited has successfully metall pre-requisite milestones to date and post tariffapproval by NEPRA, expects to achieve financialclose by third quarter 2012 and commencementof construction thereafter.
The energy gap in the country continues toincrease and the cost of energy has risen nearly21% in 2011. Renewable energy, consideredexpensive and capital intensive a few years ago,is now cheaper than furnace oil driven thermal
plants. All over the world, renewable energy isbecoming an increasing proportion of the overallenergy mix. The Company remains strategicallycommitted to establishing its presence in therenewable energy sector and is working towardsidentifying and developing business opportunitiesin this sector which is so critical for the economicprosperity of the Country.
AUDITORS
The present auditors, M/s. Yousuf Adil Saleem &Co., Chartered Accountants, whose tenure finishedon 31st December 2011, being eligible haveoffered themselves for reappointment. The AuditCommittee has recommended the appointmentof M/s. Yousuf Adil Saleem & Co., CharteredAccountants as the statutory auditors of theCompany for the year ending December 31, 2012.
ACKNOWLEDGEMENT
The Directors acknowledge the contribution ofeach and every employee of the Company andwould like to express their thanks to the customersfor the trust shown in the Company's products.We are also grateful to our shareholders for theirsupport and confidence in our management.
Shahid Hamid Pracha Inam Ur Rahman Chairman Chief Executive KarachiMarch 1, 2012

The Company strongly believes in conducting and growing its business on the principles of integrity,fairness and high ethical standards. The Company takes pride in adherence to its principles and shallcontinue to serve its customers, stakeholders and society on the basis of the following Business Codeof Conduct:
1. The Company believes in ethical and fair business practices and open competitive markets.Developing any association within the segment, industry or with competitors to distort pricing andavailability is contradictory to our business code of conduct.
2. The Company's financial policies for conducting business shall be based on transparency andintegrity, and will follow the principles of accounting and finance as approved by regulations andcontemporary accounting codes.
3. The Company will ensure compliance with the laws of Pakistan.
4. The Company will ensure protection of Intellectual Property rights and comply with related legislationregarding protection of copyright, trade secrets, patents, etc. We expect our employees to complywith the Company policy on Information Protection and neither solicit confidential information fromothers nor disclose the Company's trade secrets, or any confidential information that may comeinto their knowledge during the course of their employment to any unauthorized person or party.
5. The Company as a responsible corporate citizen shall strongly adhere to the principles of corporategovernance and comply with regulatory obligations enforced by regulatory bodies for improvingcorporate performance.
6. The Company expects employees to demonstrate integrity and honesty in doing business for theCompany and dealing with people. Any unfair or corrupt practices either to solicit business forthe Company or for personal gain of the employee is fundamentally inconsistent with the Company'sBusiness Code of Conduct. Employees must avoid situations in which personal interest conflictswith or interferes with their duty to be loyal to the Company.
7. The Company's funds shall not be used, directly or indirectly, for the purpose of any unlawfulpayments.
8. The Company believes in making charitable contributions and community development withoutpolitical affiliations and without demand or expectation of any business return. The Companyshall contribute its resources with an unprejudiced approach for the betterment of society andthe environment.
9. The Company does not encourage giving or receiving gifts and entertainment. However, whererequired for sound business reasons, any gifts or entertainment exchanged shall be in accordancewith the Company's Gift and Entertainment policy.
10. Agreements with agents or consultants must be in writing and must clearly and accurately setforth the services to be performed, the basis for earning the commission or fee involved, and theapplicable rate or fee. Any such payments must be reasonable in amount, not excessive in lightof the practice in the trade, and commensurate with the value of the services rendered. Theagent, or consultant must be advised that the agreement may be publically disclosed and mustagree to such public disclosure.
11. All assets of the Company must be accounted for carefully and properly.
Statement of Ethics and Business Practices
20
Annual Report 2011 21
12. Falsification of records for any reason shall not be tolerated. Employees shall not make false orfraudulent entries in records, expense statements or any other documents nor alter them.
13. The Company's internal and external auditors shall be given access to information necessary forthem to conduct audits properly.
14. All employees, including managers, are expected to treat all other employees and subordinateswith respect and fairness. Employees are encouraged to report incidents of violence or aggressivebehaviour and managers are expected to investigate so that such incidents are not repeated.
15. The Company will not tolerate harassment of any sort. The Company and its employees shallcomply with local legislation on preventing harassment at the workplace.
16. Only an authorized spokesperson shall be entitled to speak on behalf of the Company in frontof public gatherings and media.
17. The Company will not allow improper use of email and internet. The employees are expected toread and comply with the Company policy on email and computer network use.
18. The Company will ensure its recruitment and selection process is of a high standard, based onmerit and free from discrimination.
19. Employees need to ensure that they manage their time and resources efficiently and effectivelyand keep the tools and equipment provided to them by the Company in safe and good workingcondition.
20. The behavior of employees reflects the image of the Company. Employees are expected to actprofessionally and abide by the Companies policies, rules, regulations and code of conduct. Anyviolations must be reported to HR or the Chief Executive of the Company, who will ensure thatany reported violations are investigated and upon being proven, proper action is taken.

Statement of Compliance with the Code ofCorporate GovernanceThe statement is being presented to comply with the Code of Corporate Governance contained in thelisting regulations of Karachi and Lahore Stock Exchanges for the purpose of establishing a frameworkof good governance, whereby a listed company is managed in compliance with the best practicesof corporate governance.
The Company has applied the principles contained in the Code in the following manner:
1. The Board comprises of ten Directors including the Chief Executive Officer (CEO). The Companyencourages representation of independent non-executive Directors. At present, except CEO, allDirectors on the Board are non-executive.
2. The Directors have confirmed that none of them is serving as a Director in more than ten listedcompanies, including this Company.
3. All the Directors of the Company are registered as taxpayers and none of them has defaulted inpayment of any loan to a Banking Company, a Development Finance Institution or a Non-BankingFinancial Company or, being a member of a Stock Exchange, has been declared as a defaulterby that Stock Exchange.
4. A casual vacancy occurred on the Board during the year on December 14, 2011, which was filledup within 30 days thereof.
5. The Company has prepared a ≈Statement of Ethics and Business PracticesΔ, which has beensigned by all the Directors and employees of the Company.
6. The Board has developed a vision/mission statement, which is annexed with the Report. Significantpolicies of the Company are revised and updated as and when deemed appropriate.
7. All the powers of the Board have been duly exercised and decisions on material transactions,including appointment and determination of remuneration and terms and conditions of employmentof the CEO and other Executive Directors, have been taken by the Board.
8. The meetings of the Board were presided over by the Chairman, and the Board met at least onceevery quarter. Written notices of the Board meetings, along with agenda and working papers,were normally circulated at least seven days before the meetings. The minutes of the meetingswere appropriately recorded and circulated.
9. All material information as required under relevant rules has been provided to the stock exchangesand to the Securities & Exchange Commission of Pakistan within the prescribed time limit.
10. The Board encourages the participation of its Directors and Executives in the orientation coursesto apprise them of their duties and responsibilities.
11. The Board has approved appointment of Chief Financial Officer (CFO) and Company Secretary,including their remuneration and terms and conditions of employment as determined by the CEO.
12. The Directors' report for this year has been prepared in compliance with the requirements of theCode and fully describes the salient matters required to be disclosed.
22
13. The financial statements of the Company were duly endorsed by the CEO and CFO before approvalof the Board.
14. The Directors, CEO and Executives do not hold any interest in the shares of the Company otherthan that disclosed in the pattern of shareholdings.
15. The Company has complied with all the corporate and financial reporting requirements of theCode.
16. The Board has formed an Audit Committee. It comprises of four members, who are non-executiveDirectors.
17. The meetings of the Audit Committee were held at least once every quarter as required by theCode, prior to approval of interim and final results of the Company. The term of reference of theCommittee have been formed and advised to the Committee for compliance.
18. The Board has set up an effective internal audit function.The personnel working in internal auditfunction are considered suitably qualified and experienced for the purpose and are conversantwith the policies and procedures of the Company and they are involved in the internal auditfunction on a full time basis.
19. The statutory auditors of the Company have confirmed that they have been given a satisfactoryrating under the Quality Control Review Program of the Institute of Chartered Accountants ofPakistan, that they or any of their partners in the firm, their spouses and minor children do nothold shares of the Company and that the firm and all its partners are in compliance with theInternational Federation of Accountants (IFAC) guidelines and Code of Ethics as adopted byInstitute of Chartered Accountants of Pakistan.
20. All related party transactions entered during the year were on arm's length basis and these havebeen placed before the Audit Committee and Board of Directors. These transactions are dulyreviewed and approved by the Audit Committee and Board of Directors.
21. The statutory auditors or the persons associated with them have not been appointed to provideother services except in accordance with the listing regulations and the auditors have confirmedthat they have observed IFAC guidelines in this regard.
22. We confirm that all other material principles contained in the Code have been complied with.
KarachiMarch 01, 2012
Annual Report 2011 23
Inam Ur RahmanChief Executive
Shahid Hamid Pracha Chairman

24
We have reviewed the Statement of Compliance with the best practices contained in the Code ofCorporate Governance prepared by the Board of Directors of Dawood Lawrencepur Limited to complywith the Listing Regulations No. 35 (Chapter XI) of the Karachi and Lahore Stock Exchanges, wherethe Company is listed.
The responsibility for compliance with the Code of Corporate Governance is that of the Board ofDirectors of the Company. Our responsibility is to review, to the extent where such compliance canbe objectively verified, whether the Statement of Compliance reflects the status of the Company'scompliance with the provisions of the Code of Corporate Governance and report if it does not. A reviewis limited primarily to inquiries of the Company's personnel and review of various documents preparedby the Company to comply with the Code.
As part of our audit of financial statements we are required to obtain an understanding of the accountingand internal control systems sufficient to plan the audit and develop an effective audit approach. Wehave not carried out any special review of the internal control system to enable us to express an opinionas to whether the Board's statement on the internal control covers all controls and the effectivenessof such internal controls.
The Listing Regulations of the Karachi and Lahore Stock Exchanges requires Board of Directors toapprove related party transactions bifurcating between transactions carried out on terms equivalentto those that prevail in arm's length transactions and transactions which are not executed at arm'slength price. In this connection we are only required and have ensured compliance of requirement tothe extent of Board of Directors approving the related party transactions in the aforesaid manner. Wehave not carried out any procedures to enable us to express an opinion as to whether the related partytransactions were carried out at arm's length price.
Based on our review, nothing has come to our attention which causes us to believe that the Statementof Compliance does not appropriately reflect the Company's compliance, in all material respects, withthe best practices contained in the Code of Corporate Governance as applicable to the Company forthe year ended December 31, 2011.
M. Yousuf Adil Saleem & Co.Chartered Accountants
KarachiDate: March 01, 2012
Review Report to the Members on Statementof Compliance with Best Practices of Code ofCorporate Governance

Financial Statements
26 Auditors» Report to the Members
28 Balance Sheet
29 Profit and Loss Account
30 Statement of Comprehensive Income
31 Cash Flow Statement
33 Statement of Changes in Equity
34 Notes to the Financial Statements
Contents

We have audited the annexed balance sheet of Dawood Lawrencepur Limited (the Company) as atDecember 31, 2011 and the related profit and loss account, statement of comprehensive income, cashflow statement and statement of changes in equity together with the notes forming part thereof, for theyear then ended and we state that we have obtained all the information and explanations which, tothe best of our knowledge and belief, were necessary for the purposes of our audit.
It is the responsibility of the Company»s management to establish and maintain a system of internalcontrol, and prepare and present the above said statements in conformity with the approved accountingstandards and the requirements of the Companies Ordinance, 1984. Our responsibility is to expressan opinion on these statements based on our audit.
We conducted our audit in accordance with the auditing standards as applicable in Pakistan. Thesestandards require that we plan and perform the audit to obtain reasonable assurance about whetherthe above said statements are free of any material misstatement. An audit includes examining, on atest basis, evidence supporting the amounts and disclosures in the above said statements. An auditalso includes assessing the accounting policies and significant estimates made by management, aswell as, evaluating the overall presentation of the above said statements. We believe that our auditprovides a reasonable basis for our opinion and, after due verification, we report that:
a. in our opinion, proper books of account have been kept by the Company as required by theCompanies Ordinance, 1984,
b. in our opinion :
i. the balance sheet and profit and loss account together with the notes thereon have been drawnup in conformity with the Companies Ordinance, 1984, and are in agreement with the booksof accounts and are further in accordance with accounting policies consistently applied;
ii. the expenditure incurred during the year was for the purpose of the Company’s business; and
iii. the business conducted, investments made and the expenditure incurred during the year werein accordance with the objects of the Company;
c. in our opinion and to the best of our information and according to the explanations given to us,the balance sheet, profit and loss account, statement of comprehensive income, cash flow statementand statement of changes in equity together with the notes forming part thereof conform withapproved accounting standards as applicable in Pakistan, and, give the information required bythe Companies Ordinance, 1984, in the manner so required and respectively give a true and fairview of the state of the Company»s affairs as at December 31, 2011 and of the profit, comprehensiveincome, its cash flows and changes in equity for the year then ended; and,
d. in our opinion Zakat deductible at source under the Zakat and Ushr Ordinance, 1980 (XVIII of1980), was deducted by the Company and deposited in the Central Zakat Fund establishmentunder section 7 of that Ordinance.
M. Yousuf Adil Saleem & Co.Chartered Accountants
Engagement PartnerMushtaq Ali Hirani
KarachiDated: March 01, 2012
Auditors' Report to the Members
26

E x p l o r i n g Solutions

28
z
Balance SheetAs at December 31, 2011
Note 2011 2010Rupees in ‘000
ASSETS
Non-current assetsProperty, plant and equipment 4 55,336 63,172 Intangible assets 5 384 741 Long term investments 6 341,017 175,391 Long term deposits 7 10,544 10,544
407,281 249,848 Current assetsStores and spares 8 45,206 49,119 Stock-in-trade 9 319,688 201,103 Trade debts 10 82,643 69,763 Loans and advances 11 12,948 14,398 Deposits, prepayments and other receivables 12 69,268 149,504 Short term investments 13 574,691 754,487 Cash and bank balances 14 29,270 24,474
1,133,714 1,262,848
Assets classified as ‘held for sale’ 15 188,675 195,272
1,729,670 1,707,968 SHARE CAPITAL AND RESERVES
Share capital 16 590,578 513,547 Reserves 604,761 606,648 Unappropriated profit 344,536 405,309
1,539,875 1,525,504
LIABILITIES
Non-current liabilitiesDeferred liabilities 17 58,885 48,557
Current liabilities Trade and other payables 18 123,104 120,365 Provision for taxation 7,806 13,542
130,910 133,907
1,729,670 1,707,968 CONTINGENCIES & COMMITMENTS 19
The annexed notes from 1 to 38 form an integral part of these financial statements.
SHAHID HAMID PRACHAChairman
INAM UR RAHMANChief Executive
29Annual Report 2011
z
Profit and Loss AccountFor the year ended December 31, 2011
2011 2010Note Rupees in ‘000
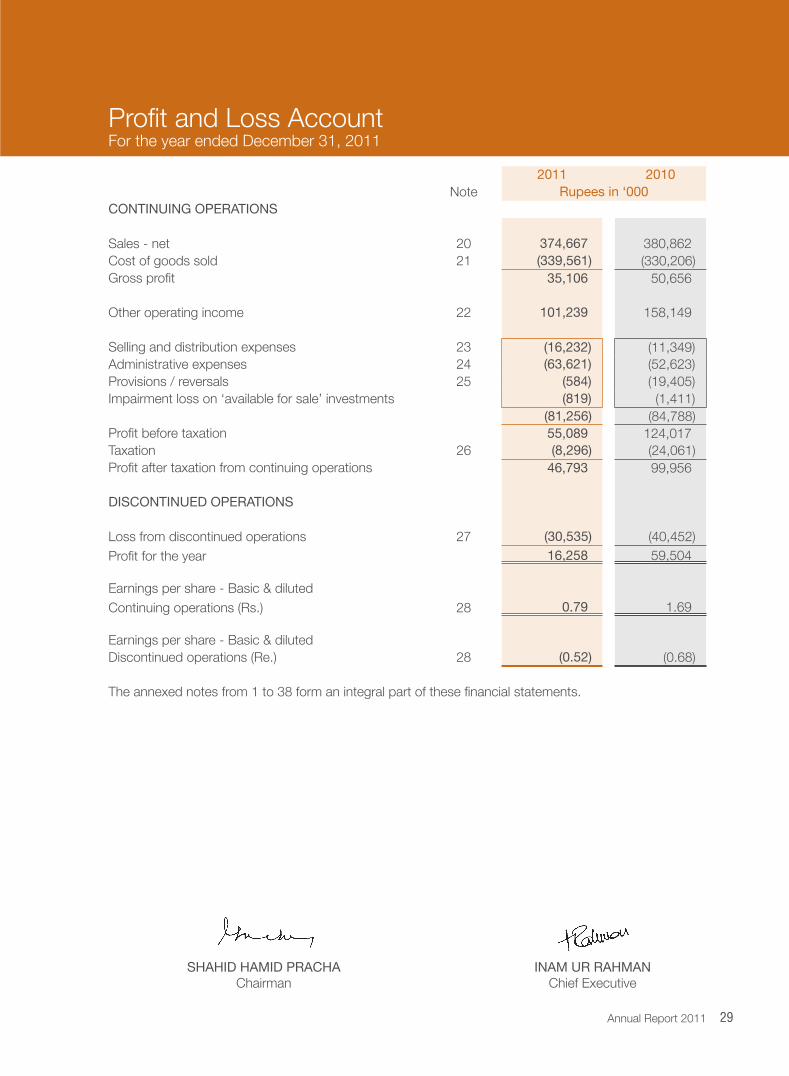
CONTINUING OPERATIONS
Sales - net 20 374,667 380,862 Cost of goods sold 21 (339,561) (330,206)Gross profit 35,106 50,656
Other operating income 22 101,239 158,149
Selling and distribution expenses 23 (16,232) (11,349)Administrative expenses 24 (63,621) (52,623)Provisions / reversals 25 (584) (19,405)Impairment loss on ‘available for sale’ investments (819) (1,411)
(81,256) (84,788)Profit before taxation 55,089 124,017 Taxation 26 (8,296) (24,061)Profit after taxation from continuing operations 46,793 99,956
DISCONTINUED OPERATIONS
Loss from discontinued operations 27 (30,535) (40,452)Profit for the year 16,258 59,504
Earnings per share - Basic & dilutedContinuing operations (Rs.) 28 0.79 1.69
Earnings per share - Basic & dilutedDiscontinued operations (Re.) 28 (0.52) (0.68)
The annexed notes from 1 to 38 form an integral part of these financial statements.
SHAHID HAMID PRACHAChairman
INAM UR RAHMANChief Executive
30
SHAHID HAMID PRACHAChairman
INAM UR RAHMANChief Executive
Statement of Comprehensive IncomeFor the year ended December 31, 2011
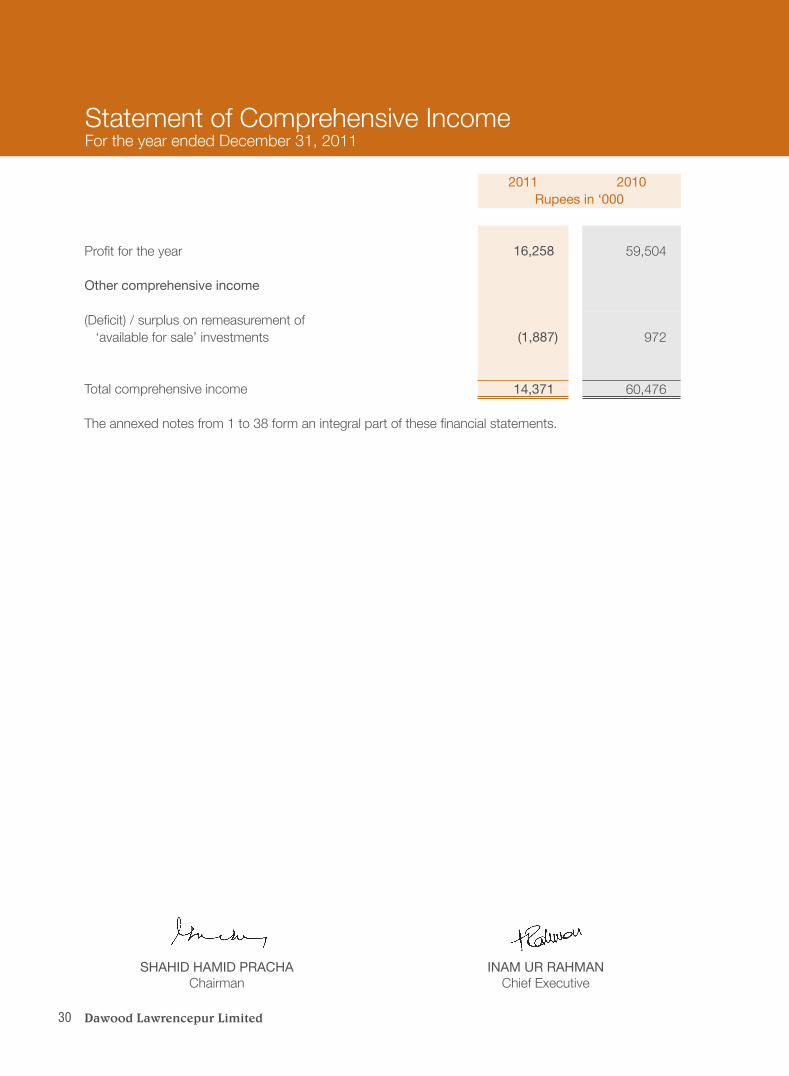
2011 2010Rupees in ‘000
Profit for the year 16,258 59,504
Other comprehensive income
(Deficit) / surplus on remeasurement of ‘available for sale’ investments (1,887) 972
Total comprehensive income 14,371 60,476
The annexed notes from 1 to 38 form an integral part of these financial statements.

31Annual Report 2011
Cash Flow StatementFor the year ended December 31, 2011
For the year ended December 31, 2011 For the year ended December 31, 2010
Continuing operations
Discontinued operations Total Continuing
operations Discontinued operations Total
R u p e e s i n ‘ 0 0 0
A. CASH FLOWS FROM OPERATING ACTIVITIES
Prof it / (loss) before taxation 55,089 (30,535) 24,554 124,017 (40,452) 83,565
Adjustments for:
Depreciation 6,419 2,486 8,905 6,192 3,008 9,200
Amortization 123 248 371 124 247 371
Provision for gratuity 20,677 751 21,428 9,363 582 9,945
Provision against stock in trade - - - 4,688 2,619 7,307
Provision against stores and spares 1,177 - 1,177 13,904 1,447 15,351
Provision against sales tax refundable - - - - 8,128 8,128
(Reversal) / provision against trade debts (593) - (593) 812 2,534 3,346
Gain on disposal of property, plant and equipment (101) (801) (902) (201) (1,162) (1,363)
Gain on disposal of assets classified as held for sale - - - - (15) (15)
Impairment loss on ‘available for sale investments’ 819 - 819 1,411 - 1,411
Dividend income (20,283) - (20,283) (96,177) - (96,177)
Insurance claim against ‘held for sale assets’ - - - - (5,600) (5,600)
Gain on sale of long-term investments (722) - (722) (22,335) - (22,335)
Gain on sale of short-term investments (33,406) - (33,406) (6,425) - (6,425)
Unrealized gain on short-term investments (44,797) - (44,797) (28,269) - (28,269)
Operating (loss) / prof it before working capital changes (15,598) (27,851) (43,449) 7,104 (28,664) (21,560)
Increase / (decrease) in current assets
Stores and spares 2,736 869 3,605 (14,148) 23,860 9,712
Stock in trade (118,585) 5,728 (112,857) 10,522 10,226 20,748
Trade debts (12,801) 515 (12,286) (30,000) 641 (29,359)
Loans and advances (2,154) (406) (2,560) (141) (404) (545)
Deposits, prepayments and other receivables (7,140) 86,130 78,990 (6,242) (78,068) (84,310)
Increase / (decrease) in current liabilities
Trade and other payables 3,900 (1,134) 2,766 (11,139) (7,186) (18,325)
(134,044) 91,702 (42,342) (51,148) (50,931) (102,079)
Cash (used in) / generated from operations (149,642) 63,851 (85,791) (44,044) (79,595) (123,639)
Gratuity paid (10,412) (688) (11,100) (6,083) - (6,083)
Tax paid (8,778) - (8,778) 8,929 (22,195) (13,266)
Net cash (used in) / generated from operating activities (168,832) 63,163 (105,669) (41,198) (101,790) (142,988)

32
For the year ended December 31, 2011 For the year ended December 31, 2010
Continuing operations
Discontinued operations Total
Continuing operations
Discontinued operations Total
------------------------------------------ R u p e e s i n ‘ 0 0 0 -----------------------------------------
B. CASH FLOWS FROM INVESTING ACTIVITIES
Purchase of property, plant and equipment (3,207) - (3,207) (8,485) (240) (8,725)
Sale proceeds from disposal of
property, plant and equipment 1,458 1,582 3,040 930 1,391 2,321
Purchase of intangible asset (14) - (14) - - -
Sale proceeds from disposal of
assets classified as ‘held for sale’ - - - - 475,583 475,583
Proceeds from insurance claim - - - - 5,600 5,600
Investment in subsidiary - (170,000) (170,000) (30,410) - (30,410)
Purchase of short-term investments (155,000) - (155,000) (857,000) - (857,000)
Sale proceed from disposal of short-term investments 413,000 - 413,000 259,000 - 259,000
Fund transfer from operations - - - 381,231 (381,231) -
Sale proceeds from disposal of investments - 2,390 2,390 227,493 - 227,493
Dividend received - 20,283 20,283 96,177 - 96,177
Long term deposits - - - (262) (879) (1,141)
Net cash generated from / (used in) investing activities 256,237 (145,745) 110,492 68,674 100,224 168,898
C. CASH FLOWS FROM FINANCING ACTIVITIES
Payment of dividend (27) - (27) (25,317) - (25,317)
Net cash used in financing activities (27) - (27) (25,317) - (25,317)
Net increase / (decrease) in cash and cash equivalent (A+B+C) 87,378 (82,582) 4,796 2,159 (1,566) 593
Cash and cash equivalents at beginning 23,061 1,413 24,474 20,902 2,979 23,881
Cash and cash equivalents at end 110,439 (81,169) 29,270 23,061 1,413 24,474
The annexed notes from 1 to 38 form an integral part of these financial statements.
Cash Flow StatementFor the year ended December 31, 2011
SHAHID HAMID PRACHAChairman
INAM UR RAHMANChief Executive
33Annual Report 2011
Ordinary Shares
Capital Reserves
General Reserve
Unappropri-ated Prof it
Unrealized gain / (loss)
on remeasure-ment of available for sale
investments
Total Merger Reserve
Share Premium
Capital Reserve
Capital Redemption
Reserve Fund
----------------------------------------------------------------- R u p e e s i n ‘ 0 0 0 ----------------------------------------------------------------
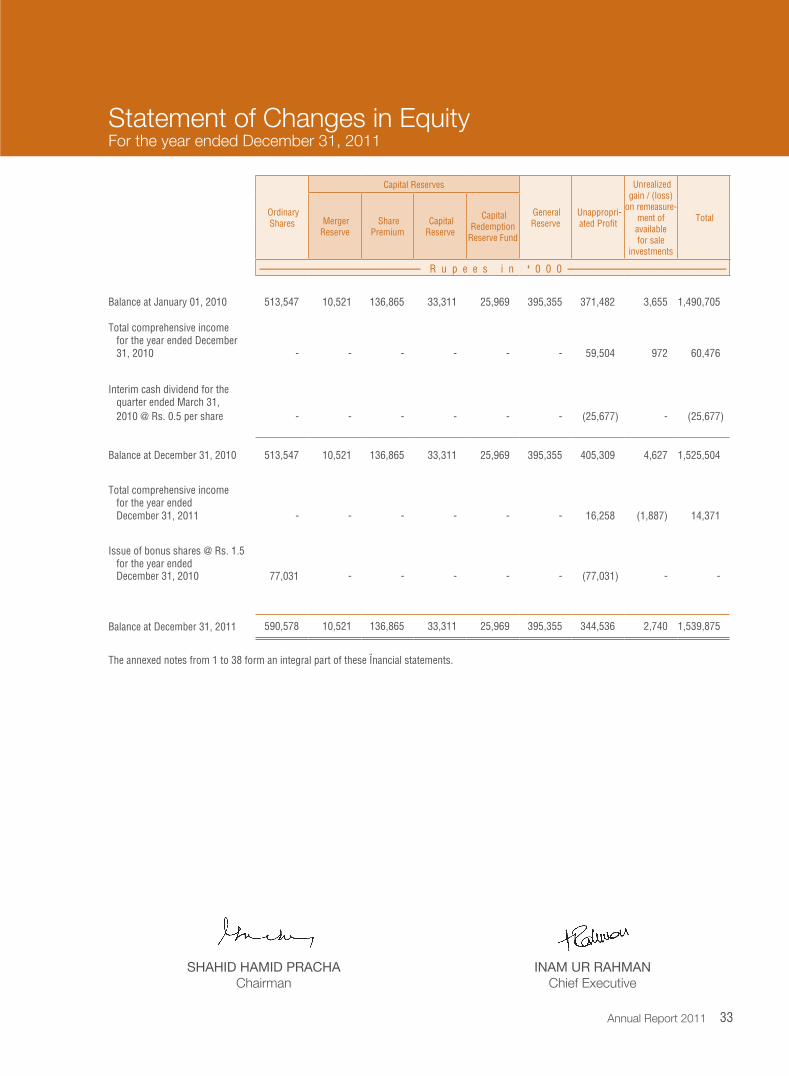
Balance at January 01, 2010 513,547 10,521 136,865 33,311 25,969 395,355 371,482 3,655
1,490,705
Total comprehensive income for the year ended December 31, 2010 - - - - - - 59,504 972 60,476
Interim cash dividend for the quarter ended March 31, 2010 @ Rs. 0.5 per share - - - - - - (25,677) - (25,677)
Balance at December 31, 2010 513,547 10,521 136,865 33,311 25,969 395,355 405,309 4,627
1,525,504
Total comprehensive income for the year ended December 31, 2011 - - - - - - 16,258 (1,887) 14,371
Issue of bonus shares @ Rs. 1.5 for the year ended December 31, 2010 77,031 - - - - - (77,031) - -
Balance at December 31, 2011 590,578 10,521 136,865 33,311 25,969 395,355 344,536 2,740 1,539,875
The annexed notes from 1 to 38 form an integral part of these financial statements.
SHAHID HAMID PRACHAChairman
INAM UR RAHMANChief Executive
Statement of Changes in EquityFor the year ended December 31, 2011

34
1. GENERAL INFORMATION
1.1 Dawood Lawrencepur Limited, “the Company” was incorporated in Pakistan in 2004 as a public listed Company formed as a result of a Scheme of Arrangement for Amalgamation in terms of the provisions of the Companies Ordinance, 1984 between Dawood Cotton Mills Limited, Dilon Limited, Burewala Textile Mills Limited and Lawrencepur Woolen and Textile Mills Limited. The shares of the Company are listed on the Karachi and Lahore Stock Exchanges. The Company is principally engaged in the business of manufacture and sale of yarn and fabrics made from natural and man-made fibers and blends thereof. The registered office of the Company is situated at 3rd Floor, Dawood Centre, M.T. Khan Road, Karachi.
1.2 The Company in the year 2008 suspended its manufacturing operations located at Burewala, District Vehari and closed down the mill in 2009. The assets (plant, machinery and current assets) relating to the closed down unit have been classified as discontinued operations, and are accounted for as per the requirement of IFRS - 5 ‘non-current assets held for sale and discontinued operations’.
2. BASIS OF PREPARATION
2.1 Basis of measurement These financial statements have been prepared under the historical cost convention, except
that obligations under certain staff retirement benefits have been measured at present value and certain investments which have been measured at fair market value.
2.2 Statement of compliance
These financial statements have been prepared in accordance with approved accounting standards as applicable in Pakistan. Approved accounting standards comprise of such International Financial Reporting Standards (IFRS) issued by the International Accounting Standards Board as are notified under the provisions of and directives issued under the Companies Ordinance 1984. In case requirements differ, the provisions or directives of the Companies Ordinance, 1984 shall prevail.
2.3 Functional and presentation currency
These financial statements are presented in Pakistani Rupees which is the functional and presentation currency of the Company and figures are stated to the nearest thousand rupees.
2.4 Critical accounting estimates and judgments
The preparation of financial statements in conformity with approved accounting standards requires management to make estimates, assumptions and use judgments that affect the application of policies and reported amounts of assets, liabilities, income and expenses. Estimates, assumptions and judgments are continually evaluated and are based on historical experience and other factors, including reasonable expectations of future events. Revisions to accounting estimates, if any, are recognized prospectively commencing from the period of revision.
Judgments and estimates made by the management that may have a significant risk of material adjustments to the financial statements in the subsequent years are as follows:
Notes to the Financial StatementsFor the year ended December 31, 2011

35Annual Report 2011
Notes to the Financial StatementsFor the year ended December 31, 2011
Useful life and depreciation rate of: - Property, plant and equipment - Intangible assets Provision against stock in trade and stores and spares Employee benefits Taxation Impairment loss of ‘available for sale’ investments
2.5 Adoption of new standards, amendments and interpretations to the published approved accounting standards
During the year, the following standards, amendments to standards and interpretations
including amendments to interpretations became effective, however, the application of these amendments and interpretations did not have a material impact on the financial statements of the Company:
Standards/Amendments/Interpretations Effective date (accounting period
beginning on or after)
Amendment to IAS 1 - Presentation of Financial Statements January 01, 2011IAS 24 (as revised in 2009) - Related Party Disclosures January 01, 2011Amendment to IAS 27 (2008) - Consolidated and Separate Financial Statements July 01,2010Amendments to IAS 32 - Financial Instruments – Presentation February 01, 2010Amendment to IAS 34 - Interim Financial Reporting January 01, 2011Amendments to IFRS 7 - Financial Instruments – Disclosures July 01,2010Amendments to IFRS 3 (2008) - Business Combinations July 01,2010Amendments to IFRS 7 - Financial Instruments – Disclosures January 01, 2011IFRIC 19 - Extinguishing Financial Liabilities with Equity Instruments July 01,2010Amendment to IFRIC 13 - Customer Loyalty Programmes January 01, 2011Amendment to IFRIC 14 - Prepayments of a Minimum Funding Requirement January 01, 2011
2.6 Standards, interpretations and amendments to the published approved accounting
standards not yet effective
The following standards, amendments and interpretations are effective for accounting periods, beginning on or after the date mentioned against each of them. These standards, interpretations and amendments are either not relevant to the Company’s operations or are not expected to have a significant impact on the Company’s financial statements other than certain additional disclosures.
Standards/Amendments/Interpretations Effective date (accounting period beginning on or after)
Amendments to IAS 1 - Presentation of Financial Statements July 01, 2012Amendments to IAS 12 - Income Taxes January 01, 2012Amendments to IAS 19 - Employee Benefits January 01, 2013Amendment to IFRS 7 - Enhanced Derecognition Disclosure Requirements July 01, 2011IFRIC 20 - Stripping Costs in the Production Phase of a Surface Mine January 01, 2013

36
Other than the aforesaid standards, interpretations and amendments, the International Accounting Standards Board (IASB) has also issued the following standards which have not been considered by the Company as the standards and their relevant amendments have not been adopted locally by the Securities and Exchange Commission of Pakistan:
IFRS 1 – First Time Adoption of International Financial Reporting Standards IFRS 9 – Financial Instruments IFRS 10 – Consolidated Financial Statements IFRS 11 – Joint Arrangements IFRS 12 – Disclosure of Interests in Other Entities IFRS 13 – Fair Value Measurement IAS 27 (Revised 2011) – Separate Financial Statements due to non-adoption of IFRS 10 and IFRS 11 IAS 28 (Revised 2011) – Investments in Associates and Joint Ventures due to non-adoption of IFRS 10 and IFRS 11
3. SIGNIFICANT ACCOUNTING POLICIES
The principal accounting policies applied in the preparation of these financial statements are set out below. These policies have been consistently applied to all the years presented.
3.1 Property, plant and equipment and capital work in progress 3.1.1 Recognition & measurement
Property, plant and equipment, except for free hold land, are stated at cost less accumulated depreciation and accumulated impairment losses, if any. Cost includes expenditure that is directly attributable to the acquisition of the asset. Capital work-in-progress is stated at cost.
Disposal of assets is recognized when significant risks and rewards incidental to ownership have been transferred to the buyer. Gains and losses on disposal of an item of property, plant and equipment are determined by comparing the proceeds from disposal with the carrying amount of property, plant and equipment and are recognized in profit and loss.
3.1.2 Subsequent costs
The cost of replacing part of an item of property, plant and equipment is recognized at the carrying amount of the item, if it is probable that the future economic benefits embodied within the part will flow to the Company and its cost can be measured reliably. The carrying amount of the replaced part is derecognized. The costs of the day to day servicing of property, plant and equipment are recognized in profit or loss as they are incurred.
3.1.3 Assetssubjecttofinancelease
Lease in terms of which the Company assumes substantially all the risks and rewards of ownership, are classified as finance lease. Upon initial recognition, the leased asset is measured at an amount equal to the lower of its fair value and present value of minimum lease payments. Subsequent to initial recognition, the asset is accounted for in
Notes to the Financial StatementsFor the year ended December 31, 2011

37Annual Report 2011
accordance with the accounting policy applicable to that asset. Outstanding obligations under the lease less finance cost allocated to future periods are shown as a liability. Finance cost under lease agreements are allocated to the periods during the lease term so as to produce a constant periodic rate of markup on the remaining balance of principal liability for each period.
3.1.4 Depreciation
Depreciation is charged to profit and loss account applying reducing balance method, whereby the cost of an asset is written off over its estimated useful life. Depreciation on additions is charged from the date on which the asset is available for use and on disposals up to the date of deletion. Freehold land is not depreciated. The residual value, depreciation method and the useful lives of each part of property, plant and equipment that is significant in relation to the total cost of the asset are reviewed, and adjusted if appropriate, at each reporting date.
3.1.5 Impairment
Assets that have an indefinite useful life, for example goodwill, are not subject to amortisation and are tested annually for impairment. Assets that are subject to amortisation are reviewed for impairment whenever events or changes in circumstances indicate that the carrying amount may not be recoverable. An impairment loss is recognised for the amount by which the asset’s carrying amount exceeds its recoverable amount. The recoverable amount is the higher of an asset’s fair value less costs to sell and value in use. For the purposes of assessing impairment, assets are grouped at the lowest levels for which there are separately identifiable cash flows (cash-generating units).
3.2 Intangible assets
3.2.1 Softwares
Acquired computer software licenses are capitalized on the basis of the costs incurred to acquire and bring to use the specific software. Software is stated at cost less accumulated amortization and accumulated impairment losses, if any. These are amortized using the ‘Straight Line Method’ from the month the software is available for use upto the month of its disposal at the rate mentioned in note 5.1. The residual values, useful lives and amortization method are reviewed and adjusted, if appropriate, at each balance sheet date.
3.3 Financial instruments
All financial assets and liabilities are recognized at the time when the Company becomes a
party to the contractual provisions of the instrument. Financial assets include trade debts, other receivables, loans, advances and deposits. These are recognized initially at cost plus directly attributable transaction costs, if any, and subsequently measured at fair value or amortized cost using effective interest rate method as the case may be less provision for impairment, if any. Exchange gains and losses arising in respect of financial assets or liabilities in foreign currency are added to the respective carrying amounts.
Notes to the Financial StatementsFor the year ended December 31, 2011

38
3.4 Investments
The Company recognizes an investment when it becomes a party to the contractual provisions of the instrument. A regular way purchase of financial assets is recognised using trade date accounting. From this date any gains and losses arising from changes in fair value of the financial assets or financial liabilities are recorded. Financial liabilities are not recognized unless one of the parties has performed its part of the contract or the contract is a derivative contract.
3.4.1 Investments in subsidiaries and associated companies
Investments in subsidiaries where control exists and associates where significant influence can be established are initially stated at cost. Subsequently, the recoverable amount is estimated to determine the extent of impairment losses, if any, and carrying amounts are adjusted accordingly. Impairment losses are recognized as expense in the profit and loss account. Where impairment losses subsequently reverse, the carrying amounts of the investments are increased to the revised recoverable amounts but limited to the extent of initial cost of investments. A reversal of impairment loss is recognized in the profit and loss account adjusted for impairment, if any, in the recoverable amounts of such investments.
3.4.2 Investments available for sale
Investments ‘available for sale’ are initially recognized at fair value, plus attributable transactions cost. Subsequent to initial recognition these are measured at fair value. Gains or losses on available-for-sale investments resulting from changes in fair value are recognized directly in equity until the investments are sold or disposed off, or until the investments are determined to be impaired, at that time cumulative gain or loss previously reported in equity is included in the current year’s profit and loss account.
All other investments in unquoted securities are stated at cost, less provision for impairment, if any.
3.4.3 Held-to-maturity investments
Held-to-maturity investments are financial assets with fixed or determinable payments and fixed maturities that the management has the positive intention and ability to hold to maturity. These are recorded at amortized cost using the effective interest rate method, less any amount written off to reflect impairment.
3.4.4 Loans and receivables
Loans and receivables are non-derivative financial assets with fixed or determinable payments that are not quoted in an active market, other than those classified by the Company as fair value through profit or loss or available-for-sale. This includes receivable against sale of investments and other receivables.
3.4.5 Financialassetsatfairvaluethroughprofitorloss
An instrument is classified as ‘fair value through profit or loss’ if it is held for trading or is designated as such upon initial recognition. Financial instruments are designated at fair value through profit or loss if the Company manages such investments and makes
Notes to the Financial StatementsFor the year ended December 31, 2011

39Annual Report 2011
purchase and sales decisions based on their fair values. Upon initial recognition, attributable transaction costs are recognized in the profit and loss account when incurred. Financial instruments at fair value through profit or loss are measured at fair value, and changes therein are recognized in the profit and loss account. Purchases and sales of investments are accounted for at trade date, i.e., the date that the Company commits itself to purchase or sell the investment.
3.4.6 Impairment
A financial asset is assessed at each reporting date to determine whether there is any objective evidence that it is impaired. A financial asset is considered to be impaired if objective evidence indicates that one or more events have had a negative effect on the estimated future cash flows of that asset. Individually significant financial assets are tested for impairment on an individual basis. The remaining financial assets are assessed collectively in groups that share similar credit risk characteristics.
For available-for-sale financial investments, the Company assesses at each balance sheet date whether there is objective evidence that an investment or a group of investments is impaired. In the case of equity investments classified as available-for-sale, objective evidence would include a significant or prolonged decline in the fair value of the investment below its cost. Where there is evidence of impairment, the cumulative loss, measured as the difference between the acquisition cost and the current fair value, less any impairment loss on that investment previously recognized in the income statement, is removed from equity and recognized in the profit and loss account. Impairment losses on equity investments are not reversed through the income statement. Increases in their fair value after impairment are recognized directly in equity.
3.4.7 Derecognition
The Company derecognizes a financial asset when the contractual rights to the cash flows from the financial asset expire or it transfers the financial asset and the transfer qualifies for derecognition in accordance with International Accounting Standard 39: Financial Instruments; Recognition and Measurement.
A financial liability is derecognized when the obligation specified in the contract is discharged, cancelled or expired.
3.5 Stores, spares and loose tools
Stores, spares and loose tools are valued at weighted average cost except for items in transit, which are stated at cost incurred up to the balance sheet date. For items which are slow moving and / or identified as surplus to the Company’s requirements, adequate provision is made for any excess book value over estimated realizable value and for this, the Company reviews the carrying amount of stores and spares on a regular basis and accordingly a provision is made for obsolescence.
3.6 Stock-in-trade Stock-in-trade is valued at the lower of cost and net realizable value. Cost is determined using
weighted average method except for raw material in transit, which is stated at cost. Cost
Notes to the Financial StatementsFor the year ended December 31, 2011

40
includes applicable purchase cost and manufacturing expenses. The cost of work in process includes material and proportionate conversion costs.
Net realizable value represents the estimated selling price for inventories less all estimated costs of completion and costs necessary to make the sale.
3.7 Provisions
Provisions are recognized when the Company has a legal or constructive obligation as a result of past events and it is probable that an outflow of resources embodying economic benefits will be required to settle the obligation and a reliable estimate of the amount can be made. Provisions are reviewed at each balance sheet date and adjusted to reflect current best estimate.
3.8 Cash and cash equivalents
Cash and cash equivalents comprise of cash in hand, deposits held with banks and highly liquid investments with less than three months maturity from the date of acquisition. Running finance facilities availed by the Company, if any, which are repayable on demand and form an integral part of the Company’s cash management are included as part of cash and cash equivalents for the purpose of the statement of cash flows.
3.9 Non-current assets held for sale and discontinued operations 3.9.1 Non-current assets held for sale
Non-current assets that are expected to be recovered primarily through sale rather than through continuing use are classified as held for sale. The assets (or disposal group) are measured at lower of their carrying amount and fair value less cost to sell. Impairment losses on initial classification as held for sale and subsequent gains or losses on re-measurement are recognized in profit or loss. Non-current assets classified as held for sale are not depreciated or amortized.
3.9.2 Discontinued operations
A discontinued operation is a component of the Company’s business that represents a separate major line of business or geographical area of operations that has been disposed of or is being held for sale, or is a subsidiary acquired exclusively with a view of resale. Classification as a discontinued operation occurs upon disposal or when the operation meets the criteria to be classified as held for sale, whichever occurs earlier. When an operation is classified as a discontinued operation, the comparative profit and loss account is re-presented as if the operation had been discontinued from the start of the comparative period.
3.10 Employees’retirementbenefits 3.10.1 Definedcontributionplan
A defined contribution plan is a post – employment benefit plan under which the
Company pays fixed contribution into a separate entity and will have no legal or constructive obligation to pay further amounts. Obligations for contributions to defined contribution plans are recognized as an employee benefit expense in profit or loss
Notes to the Financial StatementsFor the year ended December 31, 2011

41Annual Report 2011
when they are due. The Company operates defined contribution provident fund for the permanent employees of its Burewala Unit. Monthly contributions are made both by the Company and employees to the fund at the rate of 8.33% of basic salary.
3.10.2 Definedbenefitplan
A defined benefit plan is a post-employment benefit plan other than a defined contribution plan. The Company’s net obligation in respect of defined benefit plan is calculated by estimating the amount of future benefit that employees have earned in return for their service in current and prior periods, that benefit is discounted to determine its present value. The calculation is performed at least once annually, by a qualified actuary using the projected unit credit method. The Company operates a Defined Benefit ‘Gratuity’ Plan, for its regular permanent employees who have completed qualifying period of service. A funded Gratuity scheme is in place for the Management employees of the Company’s ‘Lawrencepur Woolen and Textile Mills Unit’ and an unfunded gratuity scheme is followed for other employees.
Provisions are made in the financial statements to cover obligations under the scheme. The provisions require assumptions to be made of future outcome which mainly include increase in remuneration, expected return on plan assets and the discount rate used to convert future cash flows to current values. As per the actuarial valuation carried out as at December 31, 2011, following significant assumptions were used for determining the gratuity liability.
Discount rate 12.5%
Expected rate of salary increase 11.5% Expected rate of return on plan assets 13% Average expected remaining life of employees 9 years
Actuarial gains or losses in excess of the corridor limit of 10% of the difference between
fair value of assets and present value of obligation are recognized over the estimated remaining service life of the employees.
3.10.3 Compensated absences
The Company provides for compensated absences of its employees on unavailed balance of leave in the period in which the leave is earned.
3.11 Taxation Income tax expense comprises current and deferred tax. Income tax expense is recognized in
profit and loss except to the extent that it relates to items recognized directly in equity, in which case it is also directly recognized in equity.
3.11.1 Current
Provision for current taxation is based on income streams chargeable at current rate of taxation under the normal tax regime after taking into account tax credits and tax rebates available, if any. The charge for current tax include adjustments to charge for prior years, if any.
Notes to the Financial StatementsFor the year ended December 31, 2011

42
3.11.2 Deferred
Deferred tax is provided using the balance sheet liability method, providing for temporary differences between the carrying amounts of assets and liabilities for financial reporting purposes and the amounts used for taxation purposes. The amount of deferred tax provided is measured at the tax rates that are expected to apply to the period when the asset is realized or the liability is settled, based on tax rates and the tax laws that have been enacted or substantively enacted by the balance sheet date.
Deferred tax liabilities are recognized for all taxable temporary differences. Deferred tax
asset is recognized only when it is probable that future taxable profits will be available against which the deductible temporary differences can be utilized. Deferred tax assets are reduced to the extent that it is no longer probable that the related tax benefit will be realized.
3.12 Revenue recognition
Revenue is recognized to the extent that it is probable that the economic benefits will flow to the Company and the revenue can be reliably measured. Revenue is measured at the fair value of the consideration received or receivable in the normal course of business. Revenue is recognized net of brokerages, commission and trade discounts.
3.12.1 Sale of goods
Revenue from the sale of goods is recognized when the significant risks and rewards of ownership of the goods have passed to the buyer, usually on delivery of the goods.
3.12.2 Interest income Income from investments and deposits is recognized on accrual basis.
3.12.3 Dividend income
Dividend income is recognized when the Company’s right to receive the dividend is established.
3.12.4 Capital gain
Capital gains / losses arising on sale of investments are included in the income on the date at which the transaction takes place.
3.13 Borrowing costs
Borrowing costs are recognized as an expense in the period in which they are incurred except, to the extent of borrowing costs that are directly attributable to the acquisition, construction or production of a qualifying asset. Such borrowing costs, if any, are capitalized as part of the cost of such asset.
3.14 Foreign currency translation
Transactions in foreign currencies are accounted for in Pakistani Rupees at the exchange rates
Notes to the Financial StatementsFor the year ended December 31, 2011

43Annual Report 2011
prevailing at the date of the transactions. Monetary assets and liabilities in foreign currencies are translated into Pakistani Rupees at rates of exchange prevailing at the balance sheet date. Foreign exchange differences are recognized in the profit and loss account.
3.15 Earnings per share
The Company presents basic and diluted earnings per share (EPS) data for its ordinary shares. Basic EPS is calculated by dividing the profit or loss attributable to ordinary shareholders of the Company by the weighted average number of ordinary shares outstanding during the period. Diluted EPS is determined by adjusting the profit or loss attributable to ordinary share holders and the weighted average number of ordinary shares outstanding for the effects of all dilutive potential ordinary shares.
3.16 Off-settingoffinancialassetsandfinancialliabilities
Financial assets and financial liabilities are offset and the net amount is reported in the balance sheet when there is a legally enforceable right to set-off the recognized amounts and the Company intends either to settle on a net basis, or to realize the asset and settle the liability simultaneously.
4.Property, plant and equipment
Particulars Cost
at January 01, 2011
Additions/ (disposals)
Cost at December
31, 2011
Accumulated depreciation at January 01, 2011
Depreciation/ (Disposals)
for the year
Accumulated depreciation at December
31, 2011
Carrying value at
December 31, 2011
Annual rate of
depreciation %
----------------------------------------------- R u p e e s i n ‘ 0 0 0 -----------------------------------------------
Freehold land 3,157 - 3,157 - - - 3,157 -
Leasehold land 1,081 - 1,081 481 6 487 594 1
Building on freehold land 70,557 - 70,557 61,267 758 62,025 8,532 5-10
Building on leasehold land 54,414 - 54,414 40,110 1,430 41,540 12,874 10
Plant and machinery 283,358 418 283,776 270,467 2,628 273,095 10,681 20
Furniture, fixtures and office equipment 25,959 210 26,121 17,668 866 18,518 7,603 10
(48) (16)
Computer equipment 4,887 659 5,546 2,628 896 3,524 2,022 33
Vehicles 28,526 1,920 25,895 16,146 2,321 16,022 9,873 20 (4,551) (2,445)
471,939 3,207 470,547 408,767 8,905 415,211 55,336 (4,599) (2,461)
The above includes carrying value of freehold land, leasehold land, building on freehold land and building on leasehold land amounting to Rs. 3.10 million, Rs. 0.60 million, Rs. 4.89 million and Rs. 12.87 million respectively, aggregated to Rs. 21.46 million (2010: Rs. 24.07 million) held as idle assets which relates to discontinued units. On January 25, 2012 in the Extra Ordinary General Meeting, a resolution has been passed for authorizing the Board of Directors of the Company to dispose off these idle assets.
Notes to the Financial StatementsFor the year ended December 31, 2011

44
2011 2010Note Rupees in ‘000
4.1 Depreciation for the year has been allocated as under: Cost of goods sold 21 4,489 4,395 Selling and distribution expenses 23 320 584 Administrative expenses 24 4,096 4,221
8,905 9,200
4.2 The following assets were disposed off during the year:
Description CostAccumulated depreciation
Carrying value
Sale proceed Mode of disposalParticulars of
buyer
---------------------------------------------------------------------- R u p e e s i n ‘ 0 0 0 ----------------------------------------------------------------------
Office equipment 19 6 13 5 Negotiation Mr. Altaf Moon
Office equipment 4 1 3 3 Company policyDawood Corporation (Pvt.) Limited
Office equipment 25 9 16 16 Transfer to subsidiary TGL
Vehicle 616 432 184 184 Company policy Mr. Zubair Abdullah
Vehicle 1,371 909 462 1,250 Tender Car Corporation
Vehicle 90 86 4 13 Company policyMr. Muhammad Aslam Choudhary
Vehicle 285 195 90 190 Tender Adil & Tahir Traders
Vehicle 1,695 464 1,231 1,231 Company policyDawood Corporation (Pvt.) Limited
Vehicle 494 359 135 149 Company policy Mr. Aleem Baig
2011 4,599 2,461 2,138 3,040
2010 3,808 2,850 958 2,321
For comparative year
Particulars Cost
at January 01, 2010
Additions/ (disposals)
Cost at
December 31, 2010
Accumulated depreciation at January 01, 2010
Depreciation/ (Disposals)
for the year
Accumulated depreciation at December
31, 2010
Carrying value at
December 31, 2010
Annual rate of
depreciation %
----------------------------------------------- R u p e e s i n ‘ 0 0 0 -----------------------------------------------
Freehold land 3,157 - 3,157 - - - 3,157 -
Leasehold land 1,081 - 1,081 475 6 481 600 1
Building on freehold land
70,557 - 70,557 60,435 832 61,267 9,290 5-10
Building on leasehold land
54,414 - 54,414 38,556 1,554 40,110 14,304 10
Plant and machinery 284,794 90 283,358 268,091 3,346 270,467 12,891 20 (1,526) (970)
Furniture, fixtures and office equipment
25,808 151 25,959 16,672 996 17,668 8,291 10
Computer equipment 3,393 1,599 4,887 2,015 669 2,628 2,259 33 (105) (56)
Vehicles 23,818 6,885 28,526 16,173 1,797 16,146 12,380 20 (2,177) (1,824)
2010 467,022 8,725 471,939 402,417 9,200 408,767 63,172 (3,808) (2,850)
Notes to the Financial StatementsFor the year ended December 31, 2011

45Annual Report 2011
2011 2010Note Rupees in ‘000
5. INTANGIBLE ASSETS Computer software 5.1 384 741
5.1 Computer softwareCost
Balance as on January 1 2,380 2,380Charge for the year 14 -Balance as on December 31 2,394 2,380
Amortization @ 33.33%Balance as on January 1 1,639 1,268During the year 371 371Balance as on December 31 2,010 1,639
Carrying amount 384 741
6. LONG TERM INVESTMENTS
Investment in related parties at cost 6.1 335,822 165,822Other investments 6.2 5,195 9,569
341,017 175,391
6.1 Investment in related parties at costWholly owned subsidiary - unquoted Tenaga Generasi LimitedPercentage holding 100% (December 31, 2010: 100%)24,600,000 (December 31, 2010: 7,600,000) fully paid ordinary shares of Rs. 10/- each 270,528 100,528 Associated Company - quotedDawood Hercules Corporation Limited Percentage holding 16.19% (December 31, 2010: 16.19%)77,931,896 (December 31, 2010: 19,482,974) fully paid ordinary shares of Rs. 10/- each 65,294 65,294Market value Rs. 3,273 million (December 31, 2010: 3,864 million)Chief Executive Officer: Mr. Shahid Hamid Pracha 335,822 165,822
Notes to the Financial StatementsFor the year ended December 31, 2011

46
2011 2010Rupees in ‘000
6.2 Other investmentsAvailable for sale investments
2011 2010 Name of InvesteeNo. of Shares / Units Listed Securities
200,000 200,000 National Investment Trust Limited 5,180 6,284 - 801,900 Southern Electric Power Company Ltd. - 1,788 - 69,137 Sui Southern Gas Company Limited - 1,481
5,180 9,553Un-Listed Securities
795,000 795,000 Karnaphuli Paper Mills Limited - - 100 100 Mianwali Central Co-operative Bank Ltd. - 1 1,500 1,500 Asian Co-operative Society Limited 15 15
15 165,195 9,569
6.3Reconciliationbetweenfairvalueandcostofinvestmentsclassifiedas‘availableforsale’
2011 2010Note Rupees in ‘000
Fair value of investments 5,195 9,569
Surplus on remeasurement of investment recognized in equity (2,740) (4,627)Impairment loss charged to profit and loss account - for the year - 1,411 - in prior years - 10,713
(2,740) 7,497Cost of investments 2,455 17,066
7. LONG TERM DEPOSITS
Electricity and gas deposits 9,019 9,019Others 1,525 1,525
10,544 10,5448. STORES AND SPARES
Stores 34,957 36,200Spares 29,297 32,053
64,254 68,253 Stores in transit 1,263 -
65,517 68,253 Provision for slow moving and obsolete items 8.1 (20,311) (19,134)
45,206 49,119
Notes to the Financial StatementsFor the year ended December 31, 2011

47Annual Report 2011
2011 2010
Note Rupees in ‘0008.1 Movement in provision for stores and spares
Opening balance 19,134 5,230 Provision made during the year 1,177 13,904 Closing balance 20,311 19,134
9. STOCK IN TRADE
Raw material 56,764 11,566Work in process 101,500 86,861Finished goods 134,173 105,393Waste 2,412 1,513
294,849 205,333Raw material in transit 39,833 10,764
334,682 216,097Provision for slow moving and obsolete items 9.1 (14,994) (14,994)
319,688 201,1039.1 Provision for slow moving and obsolete items
Raw material 4,915 4,915Work in process 3,259 3,259Finished goods 6,820 6,820
14,994 14,994
10. TRADE DEBTS
UnsecuredConsidered good 82,643 69,763Considered doubtful 22,467 23,060
105,110 92,823Provision against doubtful receivables 10.1 (22,467) (23,060)
82,643 69,76310.1 Movement in provision for doubtful debt
Opening balance 23,060 19,714Provision made during the year - 3,346 Reversal during the year (593) -Closing balance 22,467 23,060
Notes to the Financial StatementsFor the year ended December 31, 2011

48
2011 2010Rupees in ‘000
11. LOANS AND ADVANCES
UnsecuredConsidered good
Advance tax 8,730 12,740Loans and advances to employees 1,730 813Advances to suppliers 1,365 594Others 1,123 251
12,948 14,398
12. DEPOSITS, PREPAYMENTS AND OTHER RECEIVABLES
Income tax refundable 12.1 55,039 56,285Security deposits 921 386Prepayments 3,120 1,912Letters of credit 3,163 1,053Receivable against disposal of ‘held for sale’ assets - 86,500Sales tax 12.2 1,382 3,324Others 12.3 5,643 44
69,268 149,50412.1 Income tax refundable
Advance 76,548 77,794Provision against doubtful receivable (21,509) (21,509)
55,039 56,28512.2 Sales tax
Sales tax 9,510 11,452Provision against doubtful receivable (8,128) (8,128)
1,382 3,324
12.3 The amount due and maximum aggregate amount from related parties at the end of any month during the year / period is as follows:-
Notes to the Financial StatementsFor the year ended December 31, 2011
10.2 The amount due and maximum aggregate amount from related parties at the end of any month during the year / period is as follows:-
Amount Outstanding
Maximum month end
balanceNote Rupees in ‘000
December 31, 2011Sach International (Private) Limited 18,114 22,686
December 31, 2010 Sach International (Private) Limited 6,788 17,492

49Annual Report 2011
Amount Outstanding
Maximum month end
balanceNote Rupees in ‘000
December 31, 2011Sach International (Private) Limited 4,872 4,872Tenaga Generasi Limited 762 1,304Cyan Limited 9 376
December 31, 2010Dawood Hercules Corporation Limited 5 5,033Tenaga Generasi Limited 39 804
2011 2010Rupees in ‘000
13. SHORT TERM INVESTMENTS
Held for trading at fair value through Profit or Loss 13.1 574,691 754,487
2011 2010 Name of Investee No. of Units3,560,143 4,906,434 Meezan Cash Fund 178,506 245,5181,680,961 2,690,456 UBL Liquidity Plus Fund 168,911 269,5751,746,133 2,342,233 MCB Cash Management Optimizer 179,652 239,3944,675,740 - NAFA Government Securities Liquid Fund 47,622 -
574,691 754,487
13.1 Reconciliation between fair value and cost ofinvestmentsclassifiedas‘heldfortradingatfairvaluethroughprofitorloss’
Fair value of investments 574,691 754,487
Unrealized gain on remeasurement of investments
recognised in profit or loss account- for the year 44,797 28,269- in prior years 30,063 1,794
(74,860) (30,063)Cost of investments 499,831 724,424
14. CASH AND BANK BALANCES
Cash in hand 764 1,103
Cash at banks 11,624 6,757 In current accounts 14.1 16, 882 16,614 In deposit accounts 28,506 23,371
29,270 24,474
Notes to the Financial StatementsFor the year ended December 31, 2011

50
15.1 Plant and equipments
Particulars
Cost at January 01, 2011
Disposals Cost
at December 31, 2011
Accumulated depreciation at January 01, 2011
Depreciation adjusted for the year
Accumulated depreciation at December
31, 2011
Carrying value at
December 31, 2011
----------------------------------------------------- R u p e e s i n ‘0 0 0 ------------------------------------------------------
Plant and machinery 379,520 - 379,520 212,447 - 212,447 167,073
Electric installations 35,663 - 35,663 30,720 - 30,720 4,943
Tools and equipment 2,893 - 2,893 2,147 - 2,147 746
2011 418,076 - 418,076 245,314 - 245,314 172,762
For comparative year
Particulars
Cost at January 01, 2010
Disposals Cost
at December 31, 2010
Accumulated depreciation at January 01, 2010
Depreciation adjusted for the year
Accumulated depreciation at December
31, 2010
Carrying value at
December 31, 2010
----------------------------------------------------- R u p e e s i n ‘0 0 0 ------------------------------------------------------
Plant and machinery 1,296,452
(916,932) 379,520 654,001 (441,554) 212,447 167,073
Furniture, fixtures and office equipment 1,169 (1,169) - 1,063 (1,063) - -
Electric installations 36,712 (1,049) 35,663 31,685 (965) 30,720 4,943
Tools and equipment 2,893 - 2,893 2,147 - 2,147 746
2010 1,337,226 (919,150) 418,076 688,896 (443,582) 245,314 172,762
Notes to the Financial StatementsFor the year ended December 31, 2011
14.1 These represent deposits with commercial banks and carry profit at the rate of 5% (December 31, 2010: 5%) per annum.
2011 2010
Note Rupees in ‘000
15. ASSETS CLASSIFIED AS HELD FOR SALE
Plant and equipment 15.1 172,762 172,762Stock-in-trade 6,218 11,946Stores and spares 15,578 16,447
194,558 201,155
Provision for slow moving / obsolescence on stock in trade and stores & spares 15.2 (5,883) (5,883)
188,675 195,272
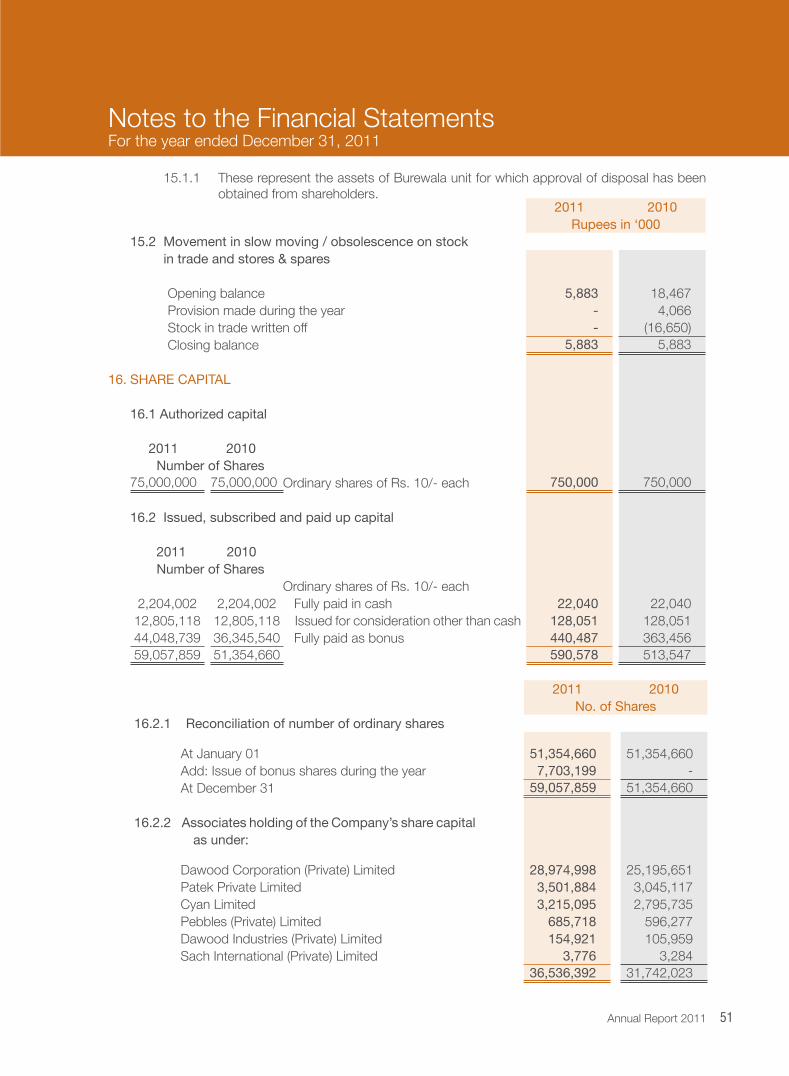
51Annual Report 2011
2011 2010Rupees in ‘000
15.2 Movement in slow moving / obsolescence on stock in trade and stores & spares
Opening balance 5,883 18,467Provision made during the year - 4,066Stock in trade written off - (16,650)Closing balance 5,883 5,883
16. SHARE CAPITAL
16.1 Authorized capital
2011 2010Number of Shares
75,000,000 75,000,000 Ordinary shares of Rs. 10/- each 750,000 750,000
16.2 Issued, subscribed and paid up capital
2011 2010Number of Shares
Ordinary shares of Rs. 10/- each2,204,002 2,204,002 Fully paid in cash 22,040 22,040
12,805,118 12,805,118 Issued for consideration other than cash 128,051 128,05144,048,739 36,345,540 Fully paid as bonus 440,487 363,45659,057,859 51,354,660 590,578 513,547
2011 2010No. of Shares
16.2.1 Reconciliation of number of ordinary shares
At January 01 51,354,660 51,354,660Add: Issue of bonus shares during the year 7,703,199 -At December 31 59,057,859 51,354,660
16.2.2 Associates holding of the Company’s share capital as under:
Dawood Corporation (Private) Limited 28,974,998 25,195,651Patek Private Limited 3,501,884 3,045,117Cyan Limited 3,215,095 2,795,735Pebbles (Private) Limited 685,718 596,277Dawood Industries (Private) Limited 154,921 105,959Sach International (Private) Limited 3,776 3,284
36,536,392 31,742,023
15.1.1 These represent the assets of Burewala unit for which approval of disposal has been obtained from shareholders.
Notes to the Financial StatementsFor the year ended December 31, 2011

52
17.1.1Chargefordefinedbenefitplan
Current service cost 5,060 4,078 Interest cost 6,583 6,127 Return on plan assets (271) (260)Past service cost 17.1.3 10,055 -
21,428 9,945 17.1.2 Reconciliation
Present value of defined benefit obligation 68,269 50,644 Fair value of plan assets (2,132) (2,082)Actuarial losses to be recognized in later periods
(7,252) (5)
58,885 48,557
December 2011
December 2010
December 2009
June 2009
June 2008
------------------------ R u p e e s i n ‘0 0 0 ------------------------
Present value of defined benefit obligation 68,269 50,644 51,059 47,107 29,616
Fair value of plan assets (2,132) (2,082) (2,163) (2,163) (2,163)Surplus in the plan 66,137 48,562 48,896 44,944 27,453 Unrecognized actuarial (loss) / gain (7,252) (5) (4,201) (3,323) 10,287 Liability in balance sheet 58,885 48,557 44,695 41,621 37,740
Experience adjustment arising on plan liabilities losses / (gain) 7,026 (4,537) 749 12,580 4,054
Experience adjustment arising on plan assets losses (221) (341) (130) (216) (216)
16.2.3 The Company has one class of ordinary shares which carry no right to fixed income. The holders are entitled to receive dividends as declared from time to time and are entitled to one vote per share at meetings of the Company. All shares rank equally with regard to the Company’s residual assets.
2011 2010Note Rupees in ‘000
17. DEFERRED LIABILITIES
Gratuity 17.1 58,885 48,557Deferred taxation 17.2 - -
58,885 48,557
17.1 Movement in liability recognized in the balance sheet
Opening balance 48,557 44,695 Net charge for the year 7.1.1 21,428 9,945
69,985 54,640 Payments made during the year (11,100) (6,083)Closing balance 58,885 48,557
Notes to the Financial StatementsFor the year ended December 31, 2011

53Annual Report 2011
17.1.3 During the year, the Company has made an amendment in the plan according to which gratuity obligation will be based on gross salary instead of basic salary of the entitled employees.
17.2 Deferred taxation
Deferred tax asset is Rs. 180.27 million (Dec. 2010: Rs. 135.43 million). However, it is likely that
the income of the Company will be taxable based on tunrover tax and under final tax regime in future, as a matter of prudence, deferred tax asset is not recognized.
Note 2011 2010Rupees in ‘000
18. TRADE AND OTHER PAYABLES
Creditors 18,004 22,400 Accrued expenses 32,819 30,410 Gratuity to ex staff 295 6,104 Advances from customers and others 10,777 3,770 Unclaimed dividend 21,031 21,058 Due to Islamic Development Bank 18.1 25,969 25,969 Deposits 18.2 1,115 719 Workers’ welfare fund 2,423 1,705 Withholding tax 142 93 Advance against scrap sales 10,529 7,690Others 18.3 - 447
123,104 120,365
18.3 These include amount due to the following related parties:2011 2010
Rupees in ‘000
Sach International (Private) Limited - 275 Dawood Corporation (Private) Limited - 155 The Dawood Foundation - 9 Cyan Limited - 8
18.1 This represents amount payable against the preference shares issued before the amalgamation in the year 2004 by one of the merged entity to Islamic Development Bank with a right to redeem. The merged entity had served notice to the Bank for redemption before the scheme of amalgamation and redemption reserve has been created.
18.2 All deposits are interest free and re-payable on demand.
19. CONTINGENCIES AND COMMITMENTS
19.1 Contingencies
a) The Taxation Officer while framing assessment for the tax year 2003 made errors in allowing expenses relating to gratuity, lease rentals, employee perquisites, utilities amounting to Rs. 29.34 million, and for tax years 2004 to 2005 had made
Notes to the Financial StatementsFor the year ended December 31, 2011

54
2011 2010Rupees in ‘000
20. SALES
Fabric 377,807 387,208 Yarn 9,642 6,055 Waste - 3,805
387,449 397,068Less: brokerage, commission and discount (5,317) (4,704)
382,132 392,364 Related to discontinued operations
Fabric (7,465) (11,502) 374,667 380,862
additions on account of allocation of expenses between the normal and presumptive income of the Company amounting to Rs. 136.10 million and had disallowed Rs. 20.62 million as adjustment of brought forward losses of the Company. During the year, Appellate Tribunal Inland Revenue (ATIR) has decided the issue of brought forward losses against the Company, however, the Company has filed an appeal before the High Court and a decision is awaited. The remaining issues have been set aside by the said Tribunal and remanded to the taxation officer for reconsideration. The tax impact of all cases amounts to Rs. 65.12 million.
b) The Company is contingently liable against the guarantees and the counter guarantees amounting to Rs 11.91 million (December 31, 2010: Rs. 64.37 million). These are secured against margins.
19.2 Commitments
The Company has commitments against letters of credit for purchases amounting to Rs. 28.6 (December, 31, 2010: Rs. 42.44 million).
The Company has a commitment to supply fabric to a customer amounting to Rs. 9.8 million (December 31, 2010: Rs. 16.79 million).
Notes to the Financial StatementsFor the year ended December 31, 2011

55Annual Report 2011
Note 2011 2010Rupees in ‘000
21. COST OF GOODS SOLD
Raw material consumed 21.1 168,388 122,362 Salaries, wages and allowances 21.2 105,893 96,171 Electricity, gas and water 72,145 61,869 Stores and spares consumed 21.3 24,710 24,289 Depreciation 4,489 4,395 Insurance 1,635 1,532 Repairs and maintenance 726 305 Workers’ canteen 1,247 1,251 Travelling and conveyance 2,822 2,078 Postage and telephone 327 339 Other manufacturing overheads 1,497 1,139
383,879 315,730Work in process
Opening balance 88,374 101,853 Closing balance (103,912) (88,374)
(15,538) 13,479Cost of goods manufactured 368,341 329,209 Finished goods
Opening balance 117,268 128,491 Closing balance (140,320) (117,268)
(23,052) 11,223 Cost of goods sold 345,289 340,432 Related to discontinued operations (5,728) (10,226)
339,561 330,206
21.1 Raw material consumed
At January 01 11,637 7,638Purchases and related expenses 213,586 126,361
225,223 133,999At December, 31 (56,835) (11,637)
168,388 122,362
21.2StaffsalariesandbenefitsincludeRs.11.6million(December31,2010:Rs.5.3million)inrespectofstaffretirementbenefits.
21.3 Stores and spares consumed2011 2010
Rupees in ‘000
At January 01 68,253 54,105Purchases and related expenses 20,711 38,437
88,964 92,542At December 31 (64,254) (68,253)
24,710 24,289
Notes to the Financial StatementsFor the year ended December 31, 2011

56
Incomefromnonfinancialassets
Profit on sale of property, plant and equipment 902 1,363 Profit on sale of assets classified as held for sale - 15 Interest on security deposits 344 344 Sundry sales and receipts 367 2,789 Insurance claim - 5,600 Profit on short term loan to subsidiary 303 -Other income 1,284 1,450 Storage income 12,961 4,882Liabilities written back - 328
16,161 16,771 117,140 171,298
Related to discontinued operations (15,901) (13,149) 101,239 158,149
23. SELLING AND DISTRIBUTION EXPENSES
Salaries and allowances 23.1 10,905 6,319 Sales promotion 1,788 1,517 Storage and forwarding 1,100 932 Depreciation 320 584 Conveyance and travelling 614 500 Rent, rates and taxes 389 401 Printing and stationery 103 395 Repair and maintenance 160 153 Freight and insurance 354 147 Advertisement 197 136 Postage and telephone 165 111 Entertainment 72 88 Electricity and gas 64 62 Miscellaneous 1 4
16,232 11,349
Notes to the Financial StatementsFor the year ended December 31, 2011
Note 2011 2010Rupees in ‘000
22. OTHER OPERATING INCOME
IncomefromfinancialassetsDividend Income
Dawood Hercules Corporation Limited 19,483 95,644 National Investment Trust Limited 800 450 Sui Southern Gas Company Limited - 83
20,283 96,177 Profit on deposits 1,771 1,321 Capital gain on sale of investments
- available for sale 722 22,335 - held for trading 33,406 6,425
Unrealized gain on short term investments 44,797 28,269 80,696 58,350 100,979 154,527

57Annual Report 2011
24.1 Staff salaries and benefits include Rs. 7.4 million (December 31, 2010 : Rs. 2.9 million) in respect of staff retirement benefits.
2011 2010Rupees in ‘000
24.2 Auditors’ remunerationAnnual audit fee 330 300Audit fee of consolidated financial statements 40 40Half yearly review and other certification fee 140 126
510 466
25. PROVISIONS / (REVERSALS)
Stores and spares 1,177 15,351 Stock in trade - 7,307 Debtors - 3,346 Sales tax refundable - 8,128 Reversal of provision for doubtful debts (593) -
584 34,132 Related to discontinued operations - (14,727)
584 19,405
Notes to the Financial StatementsFor the year ended December 31, 2011
23.1 This includes staff retirement benefits of Rs. 2.4 million (December 31, 2010: Rs. 1.1 million)
Note 2011 2010Rupees in ‘000
24. ADMINISTRATIVE EXPENSES
Salaries and allowances 24.1 71,589 53,524 Printing and stationery 2,561 1,636 Rent, rates and taxes 8,625 6,006 Electricity and gas 6,886 6,220 Conveyance and travelling 2,429 3,028 Postage and telephone 1,994 2,053 Insurance 2,173 2,741 Repairs and maintenance 2,046 1,241 Legal and professional 2,303 3,497 Auditors’ remuneration 24.2 510 466 Fees and subscription 3,425 2,753 Entertainment 604 623 Workers’ welfare fund 718 1,705 Depreciation 4,096 4,221 Amortization 371 371 Bank charges and zakat 541 1,694Miscellaneous 923 994
111,794 92,773Related to discontinued operations (48,173) (40,150)
63,621 52,623

58
Note 2011 2010Rupees in ‘000
27. LOSS FROM DISCONTINUED OPERATIONS
Sales - net 7,465 11,502 Cost of goods sold 27.1 (5,728) (10,226)Gross profit 1,737 1,276 Other income 22 15,901 13,149 Administrative expenses (48,173) (40,150)Provisions - (14,727)Net loss from discontinued operations (30,535) (40,452)
27.1 Cost of good sold
Raw materialOpening inventory 71 71 Less: closing inventory (71) (71)
Raw materials consumed - - Add: opening inventory of finished goods 11,875 22,101Less: closing inventory of finished goods (6,147) (11,875)Cost of goods sold 5,728 10,226
28. EARNINGS PER SHARE
- Basic & diluted
There is no dilutive effect on the basic earnings per share of the Company which is based on:-
28.1 Continuing operations
Profit after taxation 46,793 99,956 Weighted average number of ordinary shares outstanding during the year 59,058 59,058 Earnings per share (Rs.) 0.79 1.69
28.2 Discontinued operations
Loss after taxation (30,535) (40,452)Weighted average number of ordinary shares outstanding during the year 59,058 59,058 Earnings per share (Re.) (0.52) (0.68)
Notes to the Financial StatementsFor the year ended December 31, 2011
2011 2010Rupees in ‘000
26. TAXATIONCurrent year 7,806 13,542 Prior years 490 10,519
8,296 24,061
26.1 Relationshipbetweentaxexpenseandaccountingprofit
The relationship between tax expense and accounting profit has not been presented in these financial statements as the total income falls under: (a) turnover tax provided under section 113; (b) and income that are separately taxed under respective section of the Income Tax Ordinance, 2001.

59Annual Report 2011
29. REMUNERATION OF CHIEF EXECUTIVE AND EXECUTIVES
2011 2010
Chief Executive Executives Chief
Executive Executives
----------------------- R u p e e s i n ‘0 0 0 -----------------------
Remuneration 1,421 7,376 1,669 5,553 House rent allowance 710 2,722 835 1,681 Utilities 355 535 417 482 Retirement benefits 78 435 348 120 Other allowance 1,410 4,546 778 2,104
3,974 15,614 4,047 9,940
No. of person(s) 1 8 1 6
Chief executive and executives of the Company are entitled to use of Company maintained vehicle.
30. TRANSACTIONS WITH RELATED PARTIES Related parties comprise of a subsidiary company, associated companies, directors and key
management personnel. The Company in the normal course of business carries out transactions with various related parties. Amounts due from and to related parties, directors and key management personnel are shown under respective notes of receivables and payables. Remuneration of directors and key management personnel is disclosed in note 29. Other significant transactions with related parties are as follows:
2011 2010Rupees in ‘000
Relationship Nature of transaction
a. Subsidiary company
Tenaga Generasi Limited Subscription of ordinary shares 170,000 30,409
Short term loan paid 25,000 -
Short term loan recovered 25,000 -
Markup on short term loan 303 -
Purchase of office equipment 16 -
Reimbursement of expenses 8,682 4,390
b. Associated companies
Dawood Hercules Corporation Ltd Dividend income 19,483 95,644
Reimbursement of expenses 823 -
Sach International (Private) Limited Sale of fabric 49,309 28,968
Reimbursement of expenses 5,529 -
Notes to the Financial StatementsFor the year ended December 31, 2011
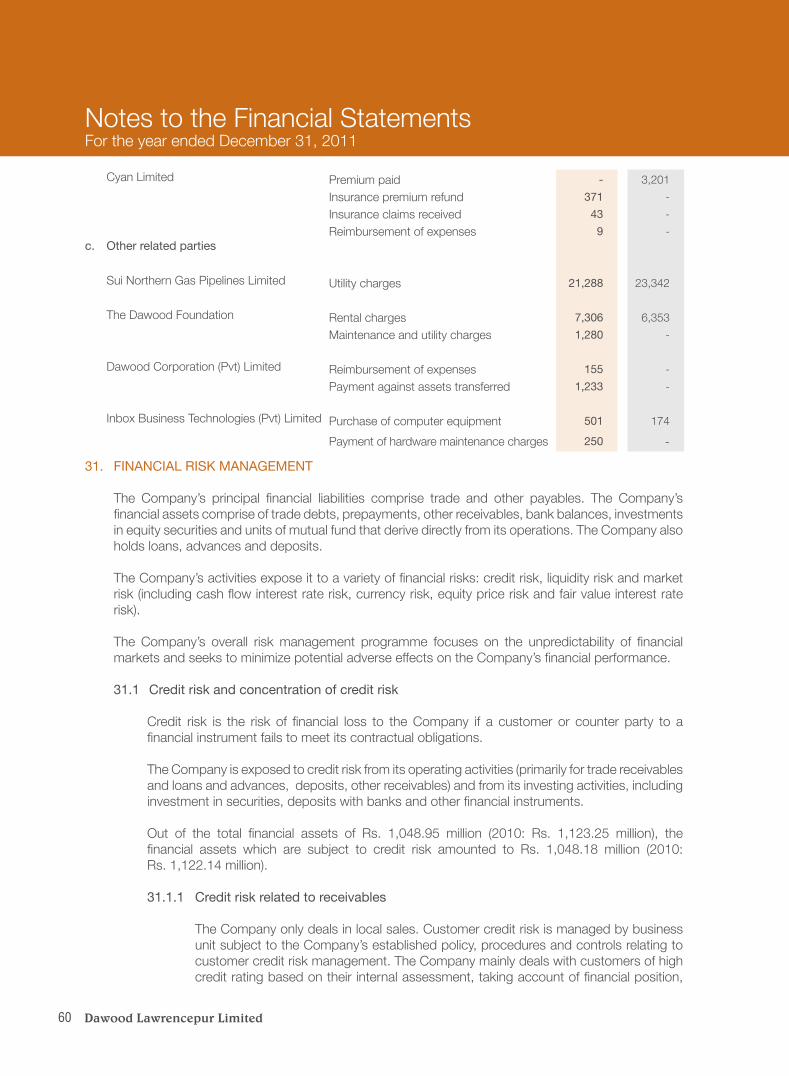
60
31. FINANCIAL RISK MANAGEMENT
The Company’s principal financial liabilities comprise trade and other payables. The Company’s financial assets comprise of trade debts, prepayments, other receivables, bank balances, investments in equity securities and units of mutual fund that derive directly from its operations. The Company also holds loans, advances and deposits.
The Company’s activities expose it to a variety of financial risks: credit risk, liquidity risk and market risk (including cash flow interest rate risk, currency risk, equity price risk and fair value interest rate risk).
The Company’s overall risk management programme focuses on the unpredictability of financial markets and seeks to minimize potential adverse effects on the Company’s financial performance.
31.1 Credit risk and concentration of credit risk
Credit risk is the risk of financial loss to the Company if a customer or counter party to a financial instrument fails to meet its contractual obligations.
The Company is exposed to credit risk from its operating activities (primarily for trade receivables and loans and advances, deposits, other receivables) and from its investing activities, including investment in securities, deposits with banks and other financial instruments.
Out of the total financial assets of Rs. 1,048.95 million (2010: Rs. 1,123.25 million), the financial assets which are subject to credit risk amounted to Rs. 1,048.18 million (2010: Rs. 1,122.14 million).
31.1.1 Credit risk related to receivables
The Company only deals in local sales. Customer credit risk is managed by business unit subject to the Company’s established policy, procedures and controls relating to customer credit risk management. The Company mainly deals with customers of high credit rating based on their internal assessment, taking account of financial position,
Notes to the Financial StatementsFor the year ended December 31, 2011
Cyan Limited Premium paid - 3,201
Insurance premium refund 371 -
Insurance claims received 43 -
Reimbursement of expenses 9 - c. Other related parties
Sui Northern Gas Pipelines Limited Utility charges 21,288 23,342
The Dawood Foundation Rental charges 7,306 6,353
Maintenance and utility charges 1,280 -
Dawood Corporation (Pvt) Limited Reimbursement of expenses 155 -
Payment against assets transferred 1,233 -
Inbox Business Technologies (Pvt) Limited Purchase of computer equipment 501 174
Payment of hardware maintenance charges 250 -

61Annual Report 2011
31.2 Liquidity risk
Prudent liquidity risk management implies maintaining sufficient cash and the availability of funding through an adequate amount of committed credit facilities.
The Company is equity financed and is not required to enter into any borrowing to support its financing requirement, therefore Company is not materially exposed to liquidity risk as it is already surplus in funds. The contractual obligations to the Company mainly through trade and other payable amounts to Rs. 123.10 million (2010: Rs. 120.4 million) having adequate liquidity backup against the currents assets of Rs. 697.39 million (2010: Rs. 937.3 million).
31.3 Market risk management
Market risk is the risk that changes in market prices, such as interest rates and equity prices will affect the Company’s income or the value of its holdings of financial instruments. The objective of market risk management is to manage and control market risk exposures within acceptable parameters while optimising returns.
31.3.1 Interest rate risk management
As the Company has no significant interest-bearing assets, the Company’s income and operating cash flows are substantially independent of changes in market interest rates. However, the Company has short term investments in units of money market mutual funds, the value of which will have direct impact due to change in interest rate. (Refer note 13).
Name of bank Rating agencyCredit rating
Short-term Long-term
Bank Al Habib Limited PACRA A1+ AA+
Habib Bank Limited JCR-VIS A-1+ AA+
Notes to the Financial StatementsFor the year ended December 31, 2011
past experience and other factors. In addition, outstanding customer receivables are regularly monitored and appropriate actions are taken to minimize risk of bad debts.
At December 31, 2011, the Company had approximately 150 customers (2010: 186 customers) that owed Rs. 82.64 million (2010: Rs. 69.76 million). There were 4 customers (2010: 3 customers) with balances greater than Rs. 5 million covering over 44% (2010: 34%) of trade debts.
31.1.2 Creditriskrelatedtofinancialinstrumentsandcashdeposits
Credit risk from balances with banks and financial institutions is managed by chief executive officer and chief financial officer in accordance with the Company’s policy.
The credit risk on liquid funds (cash and bank balances) is limited because the counter parties are banks with a reasonably high credit rating. The names and credit rating of major banks as at December 31, 2011, where the Company maintains its major bank balances are as follows:

62
31.3.2 Foreign exchange risk management
Foreign currency risk is the risk that the fair value or future cash flows of a financial instrument will fluctuate because of changes in foreign exchange rates. The Company’s exposure to the risk of changes in foreign exchange rates relates primarily to the Company’s operating activities which mainly include payable to foreign suppliers of goods in foreign currency. The Company deals completely in local sales and does not have any foreign currency exports against foreign debtors.
At December 31, 2011, considering the total outstanding exposure in foreign currency, if the Rupee had weakened / strengthened by 5% against the US dollar with all other variables held constant, profit for the year would have been higher / lower by Rs. 0.0435 million (2010: Rs. 1.10 million), mainly as a result of foreign exchange gains / losses on translation of foreign currency import loans.
31.3.3 Equity price risk management
The Company has investments in top listed and unlisted equity securities. These securities are susceptible to market price risk arising from uncertainties about future values of the investment securities. The Company manages the equity price risk through diversification and proper review of individual and total equity investments. Reports on the equity portfolio are submitted to the Company’s senior management on a regular basis.
a) InvestmentsatFairValuethroughprofitorloss-listedunitsofMutualFunds
At the balance sheet date, the exposure to listed units of mutual funds at fair value is Rs. 574.69 million (2010: Rs. 754.49 million). A decrease / increase of 5% in the net asset value per unit would have an impact of approximately Rs. 2.24 million (2010: Rs. 1.41 million) on the income of the Company, depending on whether or not the decline is significant and prolonged.
b) Investment at ‘Available for sale’ - Equity securities
At the balance sheet date, the exposure to listed equity securities at fair value
is Rs. 5.18 million (2010: Rs. 9.55 million). A decrease / increase of 5% on the KSE market index would have an impact of approximately Rs. 0.0943 million (2010: Rs. 0.0486 million) on the other comprehensive income of the Company, depending on whether or not the decline is significant and prolonged .
c) Investment in subsidiary and associated companies
The Company has exposure of Rs. 270.5 million (2010: Rs. 100.53 million) to unlisted equity securities in a wholly owned subsidiary and in listed equity securities carried at cost as investment in associate of Rs. 65.29 million (2010: Rs. 65.29 million) having fair value of Rs. 3,273 million (2010: Rs. 3,864 million) are held for strategic rather than trading purpose. The Company does not actively trade in these securities. A decrease / increase of 5% on the KSE market index would have an impact of approximately Rs .163.65 million (2010: Rs. 193.20 million) on the fair value of these listed equity securities, there will be no financial impact as such, as these are carried at cost.
Notes to the Financial StatementsFor the year ended December 31, 2011

63Annual Report 2011
Loan & advances
Available for sale
Fair value through prof it or loss Total
--------------------------------------------- R u p e e s i n ‘0 0 0 ---------------------------------------------
Assets as per balance sheet - December 31, 2011
Long term investments - 341,017 - 341,017 Long term deposits 10,544 - - 10,544 Trade debts - net 82,643 - - 82,643 Loans and advances 4,218 - - 4,218Deposits, other receivables 6,564 - - 6,564Short term investments - - 574,691 574,691 Cash and bank balances 29,270 - - 29,270
133,239 341,017 574,691 1,048,947
At amortized cost Total
Rupees in ‘000
Liabilities as per balance sheet - December 31, 2011
Trade and other payables 123,104 123,104
123,104 123,104
Notes to the Financial StatementsFor the year ended December 31, 2011
31.4 Determination of fair values
31.4.1 Fairvalueoffinancialinstruments
Fair value is the amount for which an asset could be exchanged, or a liability settled, between knowledgeable willing parties in an arms length transaction other than in a forced or liquidation sale.
The carrying values of all financial assets and liabilities reflected in the financial statements approximate their fair values.
31.5 Financial instruments by category
The accounting policies for financial instruments have been applied for line items below:

64
Level 1 Level 2 Level 3 Total------------------------------ R u p e e s i n ‘0 0 0 ------------------------------
Financial assets at fair value throughprofitorloss
Short term investments 574,691 - - 574,691
Available for sale
Long term investments 70,489 270,528 - 341,017
31.6 Fair value hierarchy
The table below analyzes financial instruments carried at fair value, by valuation method. The different levels have been defined as follows:
Level 1: Quoted prices (unadjusted) in active markets for identical assets or liabilities.
Level 2: Inputs other than quoted prices included within Level 1 that are observable for the asset or liability, either directly (i.e., as prices) or indirectly (i.e., derived from prices).
Level 3: Inputs for the asset or liability that are not based on observable market data (unobservable inputs).
At amortized cost Total
Rupees in ‘000Liabilities as per balance sheet - December 31, 2010
Trade and other payables 120,365 120,365 120,365 120,365
Loan & advances
Available for sale
Fair value through prof it or loss Total
--------------------------------- R u p e e s i n ‘0 0 0 ---------------------------------
Assets as per balance sheet - December 31, 2010
Long term investments - 175,391 - 175,391 Long term deposits 10,544 - - 10,544 Trade debts - net 69,763 - - 69,763 Loans and advances 1,658 - - 1,658 Deposits, other receivables 86,930 - - 86,930Short term investments - - 754,487 754,487Cash and bank balances 24,474 - - 24,474
193,369 175,391 754,487 1,123,247
Notes to the Financial StatementsFor the year ended December 31, 2011
32. CAPITAL RISK MANAGEMENT The Company manages its capital to ensure that it will be able to continue as a going concern while
maximizing the return to stakeholders through optimization of the debt and equity balance.
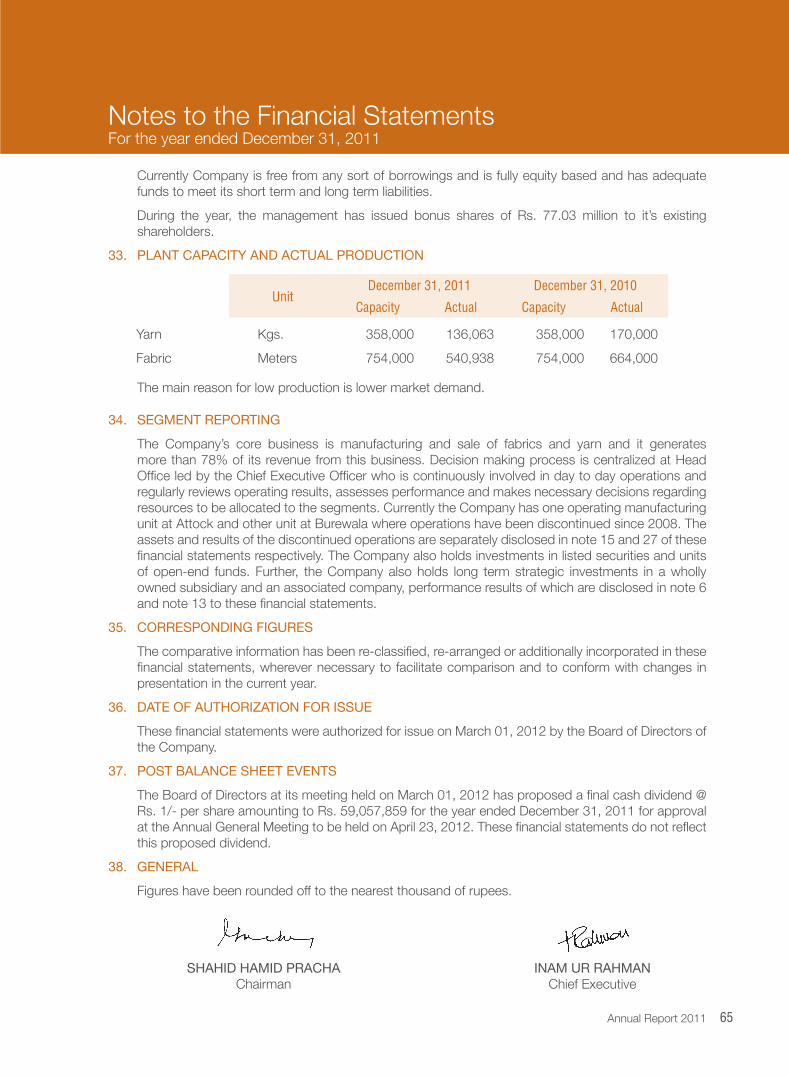
65Annual Report 2011
Currently Company is free from any sort of borrowings and is fully equity based and has adequate funds to meet its short term and long term liabilities.
During the year, the management has issued bonus shares of Rs. 77.03 million to it’s existing
shareholders. 33. PLANT CAPACITY AND ACTUAL PRODUCTION
The main reason for low production is lower market demand.
UnitDecember 31, 2011 December 31, 2010
Capacity Actual Capacity Actual
Yarn
Fabric
Kgs.
Meters
358,000
754,000
136,063
540,938
358,000
754,000
170,000
664,000
34. SEGMENT REPORTING The Company’s core business is manufacturing and sale of fabrics and yarn and it generates
more than 78% of its revenue from this business. Decision making process is centralized at Head Office led by the Chief Executive Officer who is continuously involved in day to day operations and regularly reviews operating results, assesses performance and makes necessary decisions regarding resources to be allocated to the segments. Currently the Company has one operating manufacturing unit at Attock and other unit at Burewala where operations have been discontinued since 2008. The assets and results of the discontinued operations are separately disclosed in note 15 and 27 of these financial statements respectively. The Company also holds investments in listed securities and units of open-end funds. Further, the Company also holds long term strategic investments in a wholly owned subsidiary and an associated company, performance results of which are disclosed in note 6 and note 13 to these financial statements.
35. CORRESPONDING FIGURES The comparative information has been re-classified, re-arranged or additionally incorporated in these
financial statements, wherever necessary to facilitate comparison and to conform with changes in presentation in the current year.
36. DATE OF AUTHORIZATION FOR ISSUE These financial statements were authorized for issue on March 01, 2012 by the Board of Directors of
the Company. 37. POST BALANCE SHEET EVENTS
The Board of Directors at its meeting held on March 01, 2012 has proposed a final cash dividend @ Rs. 1/- per share amounting to Rs. 59,057,859 for the year ended December 31, 2011 for approval at the Annual General Meeting to be held on April 23, 2012. These financial statements do not reflect this proposed dividend.
38. GENERAL
Figures have been rounded off to the nearest thousand of rupees.
Notes to the Financial StatementsFor the year ended December 31, 2011
SHAHID HAMID PRACHAChairman
INAM UR RAHMANChief Executive

66
67 Auditors’ Report to the Members
68 Balance Sheet
69 Profit and Loss Account
70 Statement of Comprehensive Income
71 Cash Flow Statement
73 Statement of Changes in Equity
74 Notes to the Financial Statements
Contents
Consolidated Financial Statements

67Annual Report 2011
Auditors’ Report to the Members
We have audited the annexed consolidated financial statements comprising consolidated balance sheet of Dawood Lawrencepur Limited (the Holding Company) and its subsidiary company, (the Group) as at December 31, 2011 and the related consolidated profit and loss account, consolidated statement of comprehensive income, consolidated cash flow statement and consolidated statement of changes in equity together with the notes forming part thereof, for the year then ended. We have also expressed separate opinions on the financial statements of Dawood Lawrencepur Limited and its subsidiary company. These consolidated financial statements are the responsibility of the Holding Company’s management. Our responsibility is to express an opinion on these consolidated financial statements based on our audit.
Our audit was conducted in accordance with the auditing standards as applicable in Pakistan and accordingly included such tests of accounting records and such other auditing procedures as we considered necessary in the circumstances.
In our opinion the consolidated financial statements present fairly, in all material respects, the financial position of the Group as at December 31, 2011 and the results of their operations, cash flows and changes in equity for the year then ended in accordance with approved accounting standards as applicable in Pakistan.
M. Yousuf Adil Saleem & Co.Chartered Accountants
Engagement PartnerMushtaq Ali Hirani
KarachiDated: March 01, 2012

68
Consolidated Balance SheetAs at December 31, 2011
Restated Restated2011 2010 2009
Note Rupees in ‘000ASSETS
Non-current assetsProperty, plant and equipment 4 188,524 119,959 105,925 Intangible assets 5 23,218 23,575 23,945
211,742 143,534 129,870 Long term investments 6 4,083,174 3,597,367 3,297,128 Long term deposits 7 10,544 10,544 9,403
4,305,460 3,751,445 3,436,401
Current assetsStores and spares 8 45,206 49,119 48,875 Stock-in-trade 9 319,688 201,103 216,313 Trade debts 10 82,643 69,763 43,750 Loans and advances 11 13,080 14,463 78,564 Deposits, prepayments and other receivables 12 69,901 149,686 17,235 Short term investments 13 654,837 761,362 121,794 Cash and bank balances 14 52,314 26,633 24,052
1,237,669 1,272,129 550,583 Assets classified as held for sale 15 188,675 195,272 708,993
5,731,804 5,218,846 4,695,977
SHARE CAPITAL AND RESERVES
Share capital 16 590,578 513,547 513,547 Reserves 580,393 644,932 569,726 Unappropriated profit 4,357,199 3,872,669 3,418,223
5,528,170 5,031,148 4,501,496 LIABILITIES
Non-current liabilitiesDeferred liabilities 17 59,674 48,557 44,695
Current liabilities Trade and other payables 18 135,419 125,550 139,375 Provision for taxation 8,541 13,591 10,411
143,960 139,141 149,786 5,731,804 5,218,846 4,695,977
CONTINGENCIES & COMMITMENTS 19
The annexed notes from 1 to 38 form an integral part of these financial statements.
SHAHID HAMID PRACHAChairman
INAM UR RAHMANChief Executive
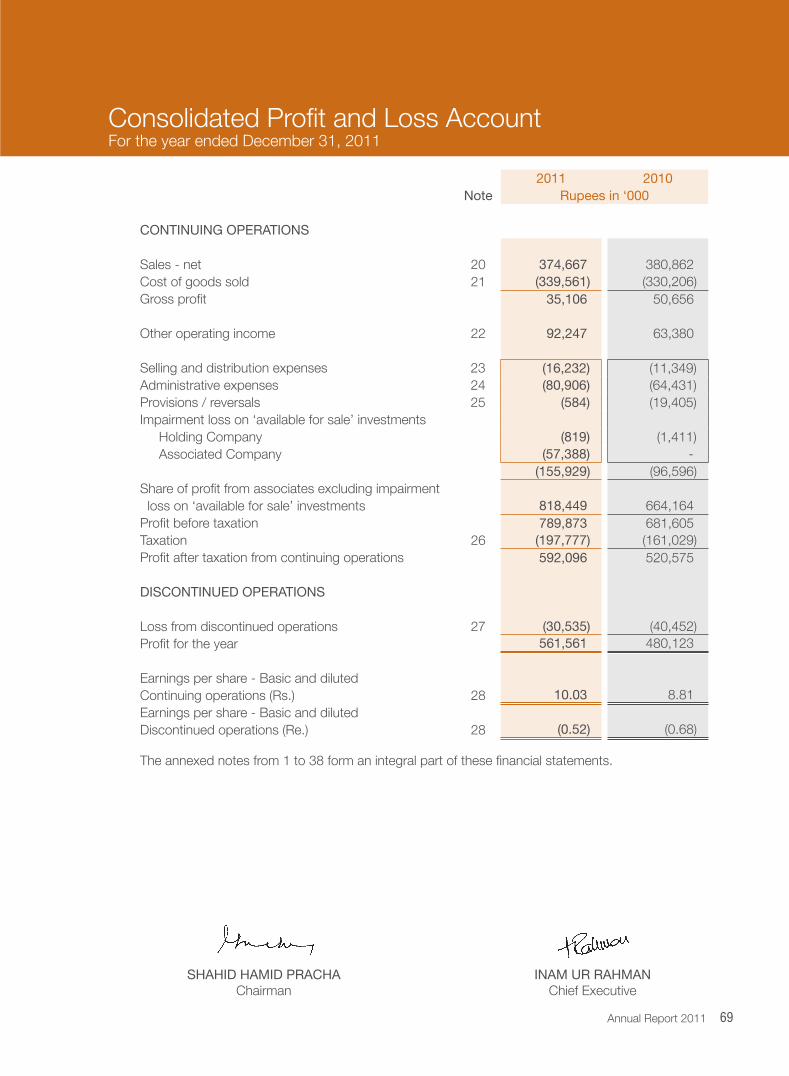
69Annual Report 2011
Consolidated Profit and Loss AccountFor the year ended December 31, 2011
2011 2010Note Rupees in ‘000
CONTINUING OPERATIONS
Sales - net 20 374,667 380,862 Cost of goods sold 21 (339,561) (330,206)Gross profit 35,106 50,656
Other operating income 22 92,247 63,380
Selling and distribution expenses 23 (16,232) (11,349)Administrative expenses 24 (80,906) (64,431)Provisions / reversals 25 (584) (19,405)Impairment loss on ‘available for sale’ investments
Holding Company (819) (1,411)Associated Company (57,388) -
(155,929) (96,596)Share of profit from associates excluding impairment loss on ‘available for sale’ investments 818,449 664,164 Profit before taxation 789,873 681,605 Taxation 26 (197,777) (161,029)Profit after taxation from continuing operations 592,096 520,575
DISCONTINUED OPERATIONS
Loss from discontinued operations 27 (30,535) (40,452)Profit for the year 561,561 480,123
Earnings per share - Basic and dilutedContinuing operations (Rs.) 28 10.03 8.81 Earnings per share - Basic and dilutedDiscontinued operations (Re.) 28 (0.52) (0.68)
The annexed notes from 1 to 38 form an integral part of these financial statements.
SHAHID HAMID PRACHAChairman
INAM UR RAHMANChief Executive

70
Restated2011 2010
Rupees in ‘000
Profit after taxation 561,561 480,123
Other comprehensive income
(Deficit) / Surplus on remeasurement of ‘available for sale investments’- Holding Company (1,887) 972
Share of other comprehensive income of Associated Company
(62,652) 74,234
(64,539) 75,206
Total comprehensive income 497,022 555,329
The annexed notes from 1 to 38 form an integral part of these financial statements.
Consolidated Statement of Comprehensive IncomeFor the year ended December 31, 2011
SHAHID HAMID PRACHAChairman
INAM UR RAHMANChief Executive

71Annual Report 2011
Consolidated Cash Flow StatementFor the year ended December 31, 2011
For the year ended December 31, 2011 For the year ended December 31, 2010
Continuing operations
Discontinued operations Total
Continuing operations
Discontinued operations Total
R u p e e s i n ‘ 0 0 0
A. CASH FLOWS FROM OPERATING ACTIVITIES
Prof it / (loss) before taxation 789,873 (30,535) 759,338 681,605 (40,452) 641,152
Adjustments for:
Depreciation 7,066 2,486 9,552 6,829 3,008 9,837
Amortization 123 248 371 124 247 371
Provision for gratuity 21,466 751 22,217 9,363 582 9,945
Provision against stock-in-trade - - - 4,688 2,619 7,307
Provision against stores and spares 1,177 - 1,177 13,904 1,447 15,351
Provision against sales tax refundable - - - - 8,128 8,128
(Reversal) / provision against trade debts (593) - (593) 812 2,534 3,346
Gain on disposal of property, plant and equipment (101) (801) (902) (201) (1,162) (1,363)
Gain on disposal of assets classif ied
as held for sale - - - - (15) (15)
Impairment loss on ‘available for sale investments’ 819 - 819 1,411 - 1,411
Impairment loss on ‘available for sale investments’
in associate 57,388 - 57,388 - - -
Share of prof it from associate (818,449) - (818,449) (664,164) - (664,164)
Dividend income (800) - (800) (533) - (533)
Interest income (2,024) - (2,024) - - -
Insurance claim against held for sale assets - - - - (5,600) (5,600)
Gain on sale of long-term investments (722) - (722) (22,335) - (22,335)
Gain on sale of short-term investments (35,837) - (35,837) (6,918) - (6,918)
Unrealized gain on short-term investments (51,137) - (51,137) (28,651) - (28,651)
Operating loss before working capital changes (31,751) (27,851) (59,602) (4,066) (28,664) (32,731)
(Increase) / decrease in current assets
Stores and spares 2,736 869 3,605 (14,148) 23,860 9,712
Stock in trade (118,585) 5,728 (112,857) 10,522 10,226 20,748
Trade debts (12,801) 515 (12,286) (30,000) 641 (29,359)
Loans and advances (2,156) (406) (2,562) 551 (404) 147
Deposits, prepayments and other receivables (6,544) 86,130 79,586 (6,227) (78,068) (84,295)
Increase / (decrease) in current liabilities
Trade and other payables 11,016 (1,134) 9,882 (7,000) (7,186) (14,186)
(126,334) 91,702 (34,632) (46,302) (50,931) (97,233)
Cash (used in) / generated from operations (158,085) 63,851 (94,234) (50,368) (79,595) (129,964)
Gratuity paid (10,412) (688) (11,100) (6,083) - (6,083)
Tax paid (8,911) - (8,911) 8,870 (22,195) (13,325)
Net cash (used in) / generated from operating activities (177,408) 63,163 (114,245) (47,581) (101,790) (149,372)

72
For the year ended December 31, 2011 For the year ended December 31, 2010
Continuing operations
Discontinued operations Total
Continuing operations
Discontinued operations Total
R u p e e s i n ‘ 0 0 0
B. CASH FLOWS FROM INVESTING ACTIVITIES
Purchase of property, plant and equipment (4,279) - (4,279) (8,558) (240) (8,798)
Capital work in progress (75,959) - (75,959) (15,965) - (15,965)
Purchase of intangible asset (14) - (14) - - -
Sale proceeds from disposal of
property, plant and equipment 1,458 1,582 3,040 930 1,391 2,321
Sale proceeds from disposal of
assets classified as held for sale - - - - 475,583 475,583
Proceeds from insurance claim - - - - 5,600 5,600
Purchase of short-term investments (219,500) - (219,500) (863,000) - (86,3000)
Sales proceed from disposal of short-term
investments 413,000 - 413,000 259,000 - 259,000
Fund transfer from operations - - - 381,231 (381,231) -
Sale proceeds from disposal of investments - 2,390 2,390 227,493 - 227,493
Dividend received from associate 19,483 - 19,483 95,644 - 95,644
Dividend received 800 - 800 533 - 533
Interest received 992 - 992 - - -
Long term deposits - - - (262) (879) (1,141)
Net cash generated from investing activities 135,981 3,972 139,953 77,046 100,224 177,270
C. CASH FLOWS FROM FINANCING ACTIVITIES
Payment of dividend (27) - (27) (25,317) - (25,317)
Net cash used in f inancing activities (27) - (27) (25,317) - (25,317)
Net (decrease) / increase in cash and cash equivalent (A+B+C) (41,454) 67,135 25,681 4,148 (1,566) 2,581
Cash and cash equivalent at beginning 25,220 1,413 26,633 21,073 2,979 24,052
Cash and cash equivalent at end (16,234) 68,548 52,314 25,221 1,413 26,633
The annexed notes from 1 to 38 form an integral part of these f inancial statements.
Consolidated Cash Flow StatementFor the year ended December 31, 2011
SHAHID HAMID PRACHAChairman
INAM UR RAHMANChief Executive

73Annual Report 2011
Statement of Changes in EquityFor the year ended December 31, 2011
Consolidated Statement of Changes in EquityFor the year ended December 31, 2011
Ordinary Shares
Capital Reserves
General Reserve
Unappropri-ated Prof it
Unrealized gain /
(loss) on remeasure-
ment of available for sale
investments
Share of other comprehensive
income of associatedCompany
Total Merger Reserve
Share Premium
Capital Reserve
Capital Redemption
Reserve Fund
----------------------------------------------------------------- R u p e e s i n ‘ 0 0 0 -----------------------------------------------------------------
Balance at January 01, 2010 513,547 10,521 136,865 33,311 25,969 395,355 3,418,223 3,655 - 4,537,446
Effect of prior year adjustment (note 6.1) (35,950) (35,950)
Balance at January 1, 2010 - restated 513,547 10,521 136,865 33,311 25,969 395,355 3,418,223 3,655 (35,950) 4,501,496
Total comprehensive income for
the year ended December 31, 2010 - - - - - - 480,123 972 74,234 555,329
Interim cash dividend for the quarter ended March 31, 2010 @ Rs. 0.5 per share
- - - - - - (25,677) - (25,677)
Balance at December 31, 2010 - restated 513,547 10,521 136,865 33,311 25,969 395,355 3,872,669 4,627 38,284 5,031,148
Total comprehensive income for
the year ended December 31, 2011 - - - - - - 561,561 (1,887) (62,652) 497,022
Issue of bonus shares @
Rs. 1.5 for the year ended December 31, 2010 77,031 - - - - - (77,031) - - -
Balance at December 31, 2011 590,578 10,521 136,865 33,311 25,969 395,355 4,357,199 2,740 (24,368) 5,528,170
The annexed notes from 1 to 38 form an integral part of these f inancial statements.
SHAHID HAMID PRACHAChairman
INAM UR RAHMANChief Executive

74
Notes to the Consolidated Financial StatementsFor the year ended December 31, 2011
1. GENERAL INFORMATION
1.1 Dawood Lawrencepur Limited, “the Holding Company” was incorporated in Pakistan in the year 2004 as a public limited company formed as a result of a Scheme of Arrangement for Amalgamation in terms of the provisions of the Companies Ordinance, 1984 between Dawood Cotton Mills Limited, Dilon Limited, Burewala Textile Mills Limited and Lawrencepur Woolen and Textile Mills Limited. The shares of the Holding Company are listed on the Karachi and Lahore Stock Exchanges. The Holding Company is principally engaged in the business of manufacture and sale of yarn and fabrics made from natural and man-made fibers and blends thereof. The registered office of the Holding Company is situated at 3rd Floor, Dawood Centre, M.T. Khan Road, Karachi.
1.2 The Holding Company in the year 2008 suspended its manufacturing unit operations located at Dawoodabad, Burewala, District Vehari, and closed down the mill in 2009. The assets (plant, machinery and current assets) relating to the closed down unit have been classified as discontinued operations and are accounted for as per the requirements of IFRS-5 ‘non-current assets held for sale and discontinued operations’.
1.3 The Holding Company has a wholly owned subsidiary namely Tenaga Generasi Limited “the Subsidiary Company”. The Subsidiary Company was incorporated in 2005 as an unlisted public limited company under the Companies Ordinance, 1984 to primarily carry out the business of power generation as an independent power producer of wind power and other alternative energy sources. The Subsidiary Company is in the process of setting up a wind energy project at Mirpur Sakro, District Thatta, Sind. The registered office of the Subsidiary Company is situated at Dawood Centre, M.T. Khan Road, Karachi.
2. BASIS OF PREPARATION 2.1 Basis of measurement
These financial statements have been prepared under the historical cost convention, except
that obligations under certain staff retirement benefits have been measured at present value, certain investments which have been measured at fair market value and investment in associate is accounted for using equity method.
2.2 Statement of compliance
These consolidated financial statements have been prepared in accordance with the requirements of the Companies Ordinance, 1984, and Approved Accounting and Financial Reporting Standards as applicable in Pakistan, unless otherwise disclosed. Approved Accounting and Financial Reporting Standards comprise of such International Accounting Standards (IAS) and International Financial Reporting Standards (IFRS) as notified under the provisions of the Companies Ordinance, 1984. Wherever, the requirements of the Companies Ordinance, 1984 or directives issued by the SECP differ with the requirements of these standards, the requirements of Companies Ordinance, 1984 or the requirements of the said directives shall take precedence.
2.3 Basis of consolidation
The consolidated financial statements include the financial statements of the Holding Company and the Subsidiary Company together constituting “the Group” financial statements. Subsidiaries

75Annual Report 2011
Notes to the Consolidated Financial StatementsFor the year ended December 31, 2011
are those enterprises in which the Holding Company directly or indirectly controls, beneficially owns or holds more than 50 percent of the voting securities or otherwise has power to elect and appoint more than 50 percent of its directors.
These financial statements of the Subsidiary Company have been consolidated on a line-by-line basis and the carrying value of the investments held by the Holding Company have been eliminated against the shareholders equity in the Subsidiary Company.
The financial statements of the subsidiary are prepared for the same reporting year as the parent company, using consistent accounting policies.
All intra-group balances, transactions, incomes, expenses, profits and losses resulting from intra-group transactions are eliminated in full.
Subsidiary is fully consolidated from the date of acquisition, being the date on which the
Company obtained control, and continue to be consolidated until the date that such control ceases.
These standards are either not relevant to the Group’s operations or are not expected to have
significant impact on the Group’s financial statements other than increased disclosures in certain cases.
2.4 Functional and presentation currency
These financial statements are presented in Pakistani Rupees which is the functional currency
of the Group and figures are stated to the nearest thousand rupees.
2.5 Critical accounting estimates and judgments
The preparation of financial statements in conformity with approved accounting standards require management to use judgments, estimates and assumptions that affect the application of accounting policies and the reported amounts of assets, liabilities, income and expenses. Estimates and judgments are continually evaluated, based on historical experience and other factors, including expectations of future events that are believed to be reasonable under the circumstances. Actual results may differ from these estimates. Significant areas of estimates are:-
Useful life and depreciation rate of: - Property, plant and equipment - Intangible assets Provision against stock in trade and stores and spares Employee benefits Taxation Impairment loss of ‘available for sale’ investments
2.6 Application of new and revised accounting standards
During the year, the following standards, amendments to standards and interpretations including amendments to interpretations became effective, however, the application of these amendments and interpretations did not have a material impact on the financial statements of the Holding Company:

76
Standards/Amendments/Interpretations Effective date (accounting period beginning on or after)
Amendment to IAS 1 - Presentation of Financial Statements January 01, 2011 IAS 24 (as revised in 2009) - Related Party Disclosures January 01, 2011 Amendment to IAS 27 (2008) - Consolidated and Separate Financial Statements July 01,2010 Amendments to IAS 32 - Financial Instruments – Presentation February 01, 2010 Amendment to IAS 34 - Interim Financial Reporting January 01, 2011 Amendments to IFRS 7 - Financial Instruments – Disclosures July 01,2010 Amendments to IFRS 3 (2008) - Business Combinations July 01,2010 Amendments to IFRS 7 - Financial Instruments – Disclosures January 01, 2011 IFRIC 19 - Extinguishing Financial Liabilities with Equity Instruments July 01,2010 Amendment to IFRIC 13 - Customer Loyalty Programmes January 01, 2011 Amendment to IFRIC 14 - Prepayments of a Minimum Funding Requirement January 01, 2011 2.7 Standards, interpretations and amendments to the published approved accounting
standards not yet effective: The following standards, amendments and interpretations are only effective for accounting
periods, beginning on or after the date mentioned against each of them. These standards, interpretations and amendments are either not relevant to the Company’s operations or are not expected to have a significant impact on the Company’s financial statements other than certain additional disclosures.
Standards/Amendments/Interpretations Effective date (accounting period beginning on or after)
Amendments to IAS 1 - Presentation of Financial Statements July 01, 2012 Amendments to IAS 12 - Income Taxes January 01, 2012 Amendments to IAS 19 - Employee Benefits January 01, 2013 Amendment to IFRS 7 - Enhanced Derecognition Disclosure Requirements July 01, 2011 IFRIC 20 - Stripping Costs in the Production Phase of a Surface Mine January 01, 2013
Other than the aforesaid standards, interpretations and amendments, the International Accounting Standards Board (IASB) has also issued the following standards which have not been considered by the Company as the standards and their relevant amendments have not been adopted locally by the Securities and Exchange Commission of Pakistan:
IFRS 1 – First Time Adoption of International Financial Reporting Standards
IFRS 9 – Financial Instruments IFRS 10 – Consolidated Financial Statements
IFRS 11 – Joint Arrangements IFRS 12 – Disclosure of Interests in Other Entities IFRS 13 – Fair Value Measurement IAS 27 (Revised 2011) – Separate Financial Statements due to non-adoption of IFRS 10 and
IFRS 11 IAS 28 (Revised 2011) – Investments in Associates and Joint Ventures due to non-adoption of IFRS 10 and IFRS 11
Notes to the Consolidated Financial StatementsFor the year ended December 31, 2011

77Annual Report 2011
3. SIGNIFICANT ACCOUNTING POLICIES
The principal accounting policies applied in the preparation of these financial statements are set out below. These policies have been consistently applied to all the years presented.
3.1 Property, plant and equipment and capital work in progress
3.1.1 Recognition & measurement
Property, plant and equipment, except for free hold land, are stated at cost less accumulated depreciation and accumulated impairment losses, if any. Cost includes expenditure that is directly attributable to the acquisition of the asset. Capital work-in-progress is stated at cost.
Disposal of assets is recognized when significant risks and rewards incidental to the ownership have been transferred to the buyers. Gains and losses on disposal of an item of property, plant and equipment are determined by comparing the proceeds from disposal with the carrying amount of property, plant and equipment and are recognized in profit and loss.
3.1.2 Subsequent costs
The cost of replacing part of an item of property, plant and equipment is recognized in the carrying amount of the item, if it is probable that the future economic benefits embodied within the part will flow to the Group and its cost can be measured reliably. The carrying amount of the replaced part is derecognized. The costs of the day to day servicing of property, plant and equipment are recognized in profit or loss as they are incurred.
3.1.3 Assetssubjecttofinancelease
Lease in terms of which the Group assumes substantially all the risks and rewards
of ownership, are classified as finance lease. Upon initial recognition, the leased asset is measured at an amount equal to the lower of its fair value or present value of minimum lease payments. Subsequent to initial recognition, the asset is accounted for in accordance with the accounting policy applicable to that asset. Outstanding obligations under the lease less finance cost allocated to future periods are shown as a liability.
Finance cost under lease agreements are allocated to the periods during the lease term so as to produce a constant periodic rate of markup on the remaining balance of principal liability for each period.
3.1.4 Depreciation
Depreciation is charged to profit and loss account applying reducing balance method, whereby the cost of an asset is written off over its estimated useful life. Depreciation on additions is charged from the date on which asset is available for use and on disposals, up to the date of deletion. Freehold land is not depreciated. The residual value, depreciation method and the useful lives of each part of property, plant and
Notes to the Consolidated Financial StatementsFor the year ended December 31, 2011

78
equipment that is significant in relation to the total cost of the asset are reviewed, and adjusted if appropriate, at each reporting date.
3.1.5 Impairment
Assets that have an indefinite useful life, for example goodwill, are not subject to amortization and are tested annually for impairment. Assets that are subject to amortization are reviewed for impairment whenever events or changes in circumstances indicate that the carrying amount may not be recoverable. An impairment loss is recognized for the amount by which the asset’s carrying amount exceeds its recoverable amount. The recoverable amount is the higher of an asset’s fair value less costs to sell and value in use. For the purposes of assessing impairment, assets are grouped at the lowest levels for which there are separately identifiable cash flows (cash-generating units).
3.2 Intangible assets
3.2.1 Goodwill
Goodwill represents the excess of the cost of an acquisition over the fair value of the group’s share of the net identifiable assets of the acquired subsidiary at the date of acquisition. Goodwill on acquisitions of subsidiaries is included in ‘intangible assets’. Goodwill is tested annually for impairment and carried at cost less accumulated impairment losses. Impairment losses on goodwill are not reversed.
3.2.2 Softwares
Acquired computer software licenses are capitalized on the basis of the costs incurred to acquire and bring to use the specific software. Software is stated at cost less accumulated amortization and accumulated impairment losses, if any. These are amortized using the ‘Straight Line Method’ from the month the software is available for use upto the month of its disposal at the rate mentioned in note 5.2. The residual values, useful lives and amortization method are reviewed and adjusted, if appropriate, at each balance sheet date.
3.3 Financial instruments
All financial assets and liabilities are recognized at the time when the Group becomes a party to the contractual provisions of the instrument. Financial assets include trade debts, other receivables, loans, advances and deposits. These are recognized initially at cost plus directly attributable transaction costs, if any, and subsequently measured at fair value or amortized cost using effective interest rate method as the case may be less provision for impairment, if any. Exchange gains and losses arising in respect of financial assets or liabilities in foreign currency are added to the respective carrying amounts.
3.4 Investments The Group recognizes an investment when it becomes a party to the contractual provisions
of the instrument. A regular way purchase of financial assets is recognized using trade date accounting. From this date any gains and losses arising from changes in fair value of the financial
Notes to the Consolidated Financial StatementsFor the year ended December 31, 2011

79Annual Report 2011
assets or financial liabilities are recorded. Financial liabilities are not recognized unless one of the parties has performed its part of the contract or the contract is a derivative contract.
3.4.1 Investments in associated company
Associates are entities over which the Company has significant influence but not control, generally represented by a shareholding of 20% to 50% of the voting rights or by virtue of common directorship. Investments in associates are accounted for using the equity method of accounting and are initially recognized at cost. The Holding Company’s share of its associates’ post acquisition profits or losses is recognized in profit and loss account and its share in post acquisition comprehensive income is recognized in Holding Company’s other comprehensive income.
3.4.2 Investments available for sale
Investments ‘available for sale’ are initially recognized at fair value, plus attributable transaction costs. Subsequent to initial recognition these are measured at fair value. Gains or losses on available-for-sale investments resulting from changes in fair value are recognized directly in equity until the investments are sold or disposed off, or until the investments are determined to be impaired, at that time cumulative gain or loss previously reported in equity is included in the current year’s profit and loss account.
All other investments in unquoted securities are stated at cost, less provision for impairment, if any.
3.4.3 Held-to-maturity investments
Held-to-maturity investments are financial assets with fixed or determinable payments
and fixed maturities that management has the positive intention and ability to hold to maturity. These are recorded at amortized cost using the effective interest rate method, less any amount written off to reflect impairment.
3.4.4 Financialassetsatfairvaluethroughprofitorloss
An instrument is classified as ‘fair value through profit or loss’ if it is held for trading or is designated as such upon initial recognition. Financial instruments are designated at fair value through profit or loss if the Group manages such investments and makes purchase and sales decisions based on their fair value. Upon initial recognition, attributable transaction costs are recognized in the profit and loss account when incurred. Financial instruments at fair value through profit or loss are measured at fair value, and changes therein are recognized in the profit and loss account. Purchases and sales of investments are accounted for at trade date, i.e., the date that the Group commits itself to purchase or sell the investment.
3.4.5 Impairment
A financial asset is assessed at each reporting date to determine whether there is any objective evidence that it is impaired. A financial asset is considered to be impaired if objective evidence indicates that one or more events have had a negative effect on the estimated future cash flows of that asset. Individually significant financial assets
Notes to the Consolidated Financial StatementsFor the year ended December 31, 2011

80
are tested for impairment on an individual basis. The remaining financial assets are assessed collectively in groups that share similar credit risk characteristics.
For ‘available-for-sale’ financial investments, the Group assesses at each balance sheet date whether there is objective evidence that an investment or a group of investments is impaired. In the case of equity investments classified as ‘available-for-sale,’ objective evidence would include a significant or prolonged decline in the fair value of the investment below its cost. Where there is evidence of impairment, the cumulative loss - measured as the difference between the acquisition cost and the current fair value, less any impairment loss on that investment previously recognized in the income statement - is removed from equity and recognized in the profit and loss account. Impairment losses on equity investments are not reversed through the income statement; increases in their fair value after impairment are recognized directly in equity.
3.4.6 Derecognition
The Group derecognizes a financial asset when the contractual rights to the cash flows from the financial asset expire or it transfers the financial asset and the transfer qualifies for derecognition in accordance with International Accounting Standard 39: Financial Instruments; Recognition and Measurement.
A financial liability is derecognized when the obligation specified in the contract is
discharged, cancelled or expired.
3.5 Stores, spares and loose tools
Stores, spares and loose tools are valued at weighted average cost except for items in transit, which are stated at cost incurred up to the balance sheet date. For items which are slow moving and / or identified as surplus to the Group requirements, adequate provision is made for any excess book value over estimated realizable value and for this, the Group reviews the carrying amount of stores and spares on a regular basis and accordingly provision is made for obsolescence.
3.6 Stock-in-trade
Stock-in-trade is valued at the lower of cost and net realizable value. Cost is determined using weighted average method except for raw material in transit, which is stated at cost. Cost includes applicable purchase cost and manufacturing expenses. The cost of work in process includes material and proportionate conversion costs.
Net realizable value represents the estimated selling price for inventories less all estimated costs of completion and costs necessary to make the sale.
3.7 Provisions Provisions are recognized when the Group has a legal or constructive obligation as a result of
past events and it is probable that an outflow of resources embodying economic benefits will be required to settle the obligation and a reliable estimate of the amount can be made. Provisions are reviewed at each balance sheet date and adjusted to reflect current best estimate.
Notes to the Consolidated Financial StatementsFor the year ended December 31, 2011

81Annual Report 2011
3.8 Cash and cash equivalents
Cash and cash equivalents comprise of cash in hand, deposits held with banks and highly liquid investments with less than three months maturity from the date of acquisition. Running finance facilities availed by the Group, which are repayable on demand and form an integral part of the Group’s cash management are included as part of cash and cash equivalents for the purpose of the statement of cash flows.
3.9 Non-current assets held for sale and discontinued operations
3.9.1 Non-current assets
Non-current assets that are expected to be recovered primarily through sale rather than through continuing use are classified as ‘held for sale’. The assets (or disposal group) are measured at lower of their carrying amount and fair value less cost to sell. Impairment losses on initial classification as held for sale and subsequent gains or losses on re-measurement are recognized in profit or loss. Non-Current assets classified as held for sale are not depreciated or amortized.
3.9.2 Discontinued operations
A discontinued operation is a component of the Holding Company’s business that represents a separate major line of business or geographical area of operations that has been disposed of or is being ‘held for sale’ or is a subsidiary acquired exclusively with a view to resale. Classification as a discontinued operation occurs upon disposal or when the operation meets the criteria to be classified as held for sale, if earlier. When an operation is classified as a discontinued operation, the comparative profit and loss account is re-presented as if the operation had been discontinued from the start of the comparative period.
3.10 Employees’retirementbenefits 3.10.1 Definedcontributionplan
A defined contribution plan is a post – employment benefit plan under which the Group pays fixed contribution into a separate entity and will have no legal or constructive obligation to pay further amounts. Obligations for contributions to defined contribution plans are recognized as an employee benefit expense in profit or loss when they are due. The Group operates defined contribution provident fund for the permanent employees at Burewala Unit. Monthly contributions are made both by the Group and employees to the fund at the rate of 8.33% of basic salary.
3.10.2 Definedbenefitplan
A defined benefit plan is a post-employment benefit plan other than a defined contribution plan. The Group’s net obligation in respect of defined benefit plan is calculated by estimating the amount of future benefit that employees have earned in return for their service in current and prior periods and that benefit is discounted to determine its present value. The calculation is performed at least once annually, by a qualified actuary using the projected unit credit method. The Group operates a Defined Benefit ‘Gratuity’ Plan, for its regular permanent employees who have completed
Notes to the Consolidated Financial StatementsFor the year ended December 31, 2011

82
qualifying period of service. A funded Gratuity scheme is in place for the Management employees of the Group’s ‘Lawrencepur Woolen and Textile Mills Unit’, and unfunded gratuity scheme is followed for other employees.
Provisions are made in the financial statements to cover obligations under the scheme. The provision requires assumptions to be made of future outcome which mainly include increase in remuneration, expected return on plan assets and the discount rate used to convert future cash flows to current values as per the actuarial valuation carried out as at December 31, 2011, following significant assumptions were used for determining the gratuity liability.
Discount rate 12.5% Expected rate of salary increase 11.5% Expected rate of return on plan assets 13% Average expected remaining life of employees 9 years
Actuarial gains or losses in excess of corridor limit of 10% of the difference between fair value of assets and present value of obligation are recognized over the estimated remaining service life of the employees.
3.10.3 Compensated absences
The Group provides for compensated absences of its employees on unavailed balance of leave in the period in which the leave is earned.
3.11 Taxation Income tax expense comprises current and deferred tax. Income tax expense is recognized in
profit or loss except to the extent that it relates to items recognized directly in equity, in which case it is also directly recognized in equity.
3.11.1 Current
Provision for current taxation is based on income streams chargeable at current rate of taxation under the normal tax regime after taking into account tax credits and tax rebates available, if any. The charge for current tax include adjustments to charge for prior years, if any.
3.11.2 Deferred
Deferred tax is provided using the balance sheet liability method, providing for temporary differences between the carrying amounts of assets and liabilities for financial reporting purposes and the amounts used for taxation purposes. The amount of deferred tax provided is measured at the tax rates that are expected to apply to the period when the asset is realized or the liability is settled, based on tax rates and the tax laws that have been enacted or substantively enacted by the balance sheet date.
Deferred tax liabilities are recognized for all taxable temporary differences. Deferred tax asset is recognized only when it is probable that future taxable profits will be available
Notes to the Consolidated Financial StatementsFor the year ended December 31, 2011

83Annual Report 2011
against which the deductible temporary differences can be utilized. Deferred tax assets are reduced to the extent that it is no longer probable that the related tax benefit will be realized.
3.12 Revenue recognition Revenue is recognized to the extent that it is probable that the economic benefits will flow to the
Group and the revenue can be reliably measured. Revenue is measured at the fair value of the consideration received or receivable in the normal course of business. Revenue is recognized net of brokerages, commission and trade discounts.
3.12.1 Sale of goods
Revenue from the sale of goods is recognized when the significant risks and rewards of ownership of the goods have passed to the buyer, usually on delivery of the goods.
3.12.2 Interest income
Income from investments and deposits is recognized on accrual basis.
3.12.3 Dividend income
Dividend income is recognized when the Group’s right to receive the dividend is established.
3.12.4 Capital gain
Capital gains / losses arising on sale of investments are included in the income on the date at which the transaction takes place.
3.13 Borrowing costs Borrowing costs are recognized as an expense in the period in which they are incurred except,
to the extent of borrowing costs that are directly attributable to the acquisition, construction or production of a qualifying asset. Such borrowing costs, if any, are capitalized as part of the cost of such asset.
3.14 Foreign currency translation
Transactions in foreign currencies are accounted for in Pakistani Rupees at the exchange rate prevailing at the date of the transactions. Monetary assets and liabilities in foreign currencies are translated into Pakistani Rupees at rates of exchange prevailing at the balance sheet date. Foreign exchange differences are recognized in the profit and loss account.
3.15 Earnings per share The Group presents basic and diluted earnings per share (EPS) data for its ordinary shares.
Basic EPS is calculated by dividing the profit or loss attributable to ordinary shareholders of the Group by the weighted average number of ordinary shares outstanding during the year. Diluted
Notes to the Consolidated Financial StatementsFor the year ended December 31, 2011

84
EPS is determined by adjusting the profit or loss attributable to ordinary share holders and the weighted average number of ordinary shares outstanding for the effects of all dilutive potential ordinary shares.
3.16 Off-settingoffinancialassetsandfinancialliabilities
Financial assets and financial liabilities are offset and the net amount is reported in the balance
sheet when there is a legally enforceable right to set-off the recognized amounts and the Group intends either to settle on a net basis, or to realize the asset and settle the liability simultaneously.
2011 2010Note Rupees in ‘000
4. PROPERTY PLANT AND EQUIPMENT
Operating assets 4.1 60,296 67,690
Capital work in progress 4.4 128,228 52,269
188,524 119,959
Notes to the Consolidated Financial StatementsFor the year ended December 31, 2011

85Annual Report 2011
4.1 Operating Assets
Particulars Cost
at January 01, 2011
Additions/ (disposals)
Cost at December
31, 2011
Accumulated depreciation at January 01, 2011
Depreciation/ (Disposals)
for the year
Accumulated depreciation at December
31, 2011
Carrying value at
December 31, 2011
Annual rate of
depreciation %
----------------------------------------------------------------- R u p e e s i n ‘0 0 0 -----------------------------------------------------------------
Freehold land 3,157 - 3,157 - - - 3,157 -
Leasehold land 1,081 - 1,081 481 6 487 594 1
Building on freehold land 70,557 - 70,557 61,268 758 62,026 8,531 5-10
Building on leasehold land 54,414 - 54,414 40,110 1,430 41,540 12,874 10
Plant and machinery 283,358 418 283,776 270,467 2,628 273,095 10,681 20
Wind measuring equipment 3,881 - 3,881 388 349 737 3,144 10
Furniture, f ixtures and off ice equipment 25,987 210 26,174 17,673 874 18,540 7,634 10
(23) (7)
Computer equipment 5,033 817 5,850 2,667 961 3,628 2,222 33
Vehicles 29,834 2,834 28,117 16,558 2,546 16,658 11,459 20
(4,551) (2,446)
2011 477,302 4,279 477,007 409,612 9,552 416,711 60,296
(4,574) (2,453)
The above includes carrying value of freehold land, leasehold land, building on freehold land and building on leasehold land amounting to Rs. 3.10 million, Rs. 0.60 million, Rs. 4.89 million and Rs. 12.87 million respectively, aggregated to Rs. 21.46 million (2010: Rs. 24.07 million) held as idle assets which relates to discontinued units. On January 25, 2012 in the Extra Ordinary General Meeting, a resolution has been passed for authorizing the Board of Directors of the Company to dispose off these idle assets.
Notes to the Consolidated Financial StatementsFor the year ended December 31, 2011

86
Notes to the Consolidated Financial StatementsFor the year ended December 31, 2011
For comparative year
Particulars Cost
at January 01, 2010
Additions/ (disposals)
Cost at December
31, 2010
Accumulated depreciation at January 01, 2010
Depreciation/ (Disposals)
for the year
Accumulated depreciation at December
31, 2010
Carrying value at
December 31, 2010
Annual rate of
depreciation %
----------------------------------------------------------------- R u p e e s i n ‘0 0 0 -----------------------------------------------------------------
Freehold land 3,157 - 3,157 - - - 3,157 -
Leasehold land 1,081 - 1,081 475 6 481 600 1
Building on freehold land 70,557 - 70,557 60,435 833 61,268 9,289 5-10
Building on leasehold land 54,414 - 54,414 38,556 1,554 40,110 14,304 10
Plant and machinery 284,794 90 283,358 268,091 3,346 270,467 12,891 20
(1,526) (970)
Wind measuring equipment - 3,881 3,881 - 388 388 3,493 10
Furniture, f ixtures and off ice equipment 25,836 151 25,987 16,674 999 17,673 8,314 10
Computer equipment 3,466 1,672 5,033 2,032 691 2,667 2,366 33
(105) (56)
Vehicles 25,125 6,886 29,834 16,362 2,020 16,558 13,276 20
(2,177) (1,824)
2010 468,430 12,680 477,302 402,625 9,837 409,612 67,690
(3,808) (2,850)
2011 2010Note Rupees in ‘000
4.2 Depreciation for the year has been allocated as under:
Cost of goods sold 21 4,489 4,395 Selling and distribution expenses 23 320 584 Administrative expenses 24 4,743 4,858
9,552 9,837

87Annual Report 2011
Notes to the Consolidated Financial StatementsFor the year ended December 31, 2011
4.3 The following assets were disposed off during the year:
Description Cost Accumulated depreciation
Carrying value
Sale proceed Mode of disposal Particulars of buyer
--------------------- Rupees in ‘000 ---------------------
Office equipment 19 6 13 5 Negotiation Mr. Altaf Moon
Office equipment 4 1 3 3 Company policy Dawood Corporation (Pvt) Limited
Vehicle 616 432 184 184 Company policy Mr. Zubair Abdullah
Vehicle 1,371 909 462 1,250 Tender Car Corporation
Vehicle 90 86 4 13 Company policy Muhammad Aslam Chaudary
Vehicle 285 195 90 190 Tender Adil & Tahir Traders
Vehicle 1,695 464 1,230 1,230 Company policy Dawood Corporation (Pvt) Limited
Vehicle 494 359 135 149 Company policy Mr. Aleem Baig
2011 4,574 2,452 2,122 3,024
2010 3,808 2,850 958 2,321
2011 2010Note Rupees in ‘000
4.4 Capital work in progress
This represents cost incurred in respect of the following:Lease hold land 23,296 23,296 Survey and consulting charges 23,095 13,816 Professional fee 65,506 7,508 Travelling, boarding and lodging 15,186 6,683 Soil investigations and grid inter connection study 147 147 Advances 998 818
128,228 52,268
5. INTANGIBLE ASSETS
Goodwill 5.1 22,834 22,834 Computer software 5.2 384 741
- - 23,218 23,575

88
Notes to the Consolidated Financial StatementsFor the year ended December 31, 2011
2011 2010
Note Rupees in ‘000
5.2 Computer software
Cost
Balance as on January 1 2,380 2,380
Addition during the year 14 -
Balance as on December 31 2,394 2,380
Amortization @ 33.33%
Balance as on January 1 1,639 1,269
During the year 24 371 370
Balance as on December 31 2,010 1,639
Carrying amount 384 741
5.1 Goodwill
During the year 2008, the Company acquired 100% shareholding of Tenaga Generasi Limited (TGL). The business combination with TGL has been accounted for by applying the purchase method. The cost of the acquisition has been measured at the fair value of equity instruments issued at the date of exchange plus cost directly attributable to acquisition. Identified assets acquired, liabilities (including contingent liabilities) assumed or incurred have been carried at the fair value at the acquisition date. The excess cost of acquisition over the fair value of identifiable net assets acquired has been recorded as goodwill in these consolidated financial statements.
Restated Restated
Note 2011 2010 2009
Rupees in ‘000
6. LONG TERM INVESTMENTS
Investment in associated company 6.1 4,077,979 3,587,798 3,081,962
Other investments 6.2 5,195 9,569 215,166
4,083,174 3,597,367 3,297,128

89Annual Report 2011
Notes to the Consolidated Financial StatementsFor the year ended December 31, 2011
Restated Restated2011 2010 2009
Rupees in ‘000
6.1 Investment in associated company
Associated Company - quoted
Dawood Hercules Corporation Limited (DHCL)
Percentage holding 16.19% (December 31,
2010: 16.19%)
77,931,896 (December 31, 2010: 19,482,974)
fully paid ordinary shares of Rs. 10/- each 65,294 65,294 65,294
Market value Rs. 3.273 billion (December 31,
2010: 3.864 billion)
Chief Executive Officer: Mr. Shahid Hamid Pracha
65,294 65,294 65,294
Opening balance
Share of post-acquisition profits 3,484,219 3,052,618 3,265,678
Share of other comprehensive income
of associated company 38,284 (35,950) (284,704)
3,522,503 3,016,668 2,980,974
Add: Share of profit before taxation 818,449 664,164 290,211
Share of other comprehensive income
of associated company (62,652) 74,234 248,754
Less: Share of taxation (188,744) (136,919) (85,111)
Share of impairment loss (57,388) - (365,025)
4,032,168 3,618,148 3,069,803
Less: Dividend received (19,483) (95,644) (53,135)
4,077,979 3,587,798 3,081,962
6.1.1 The financial year end of DHCL is December 31, 2011. Financial results as of September 30, 2011 have been used for the purpose of application of equity method.
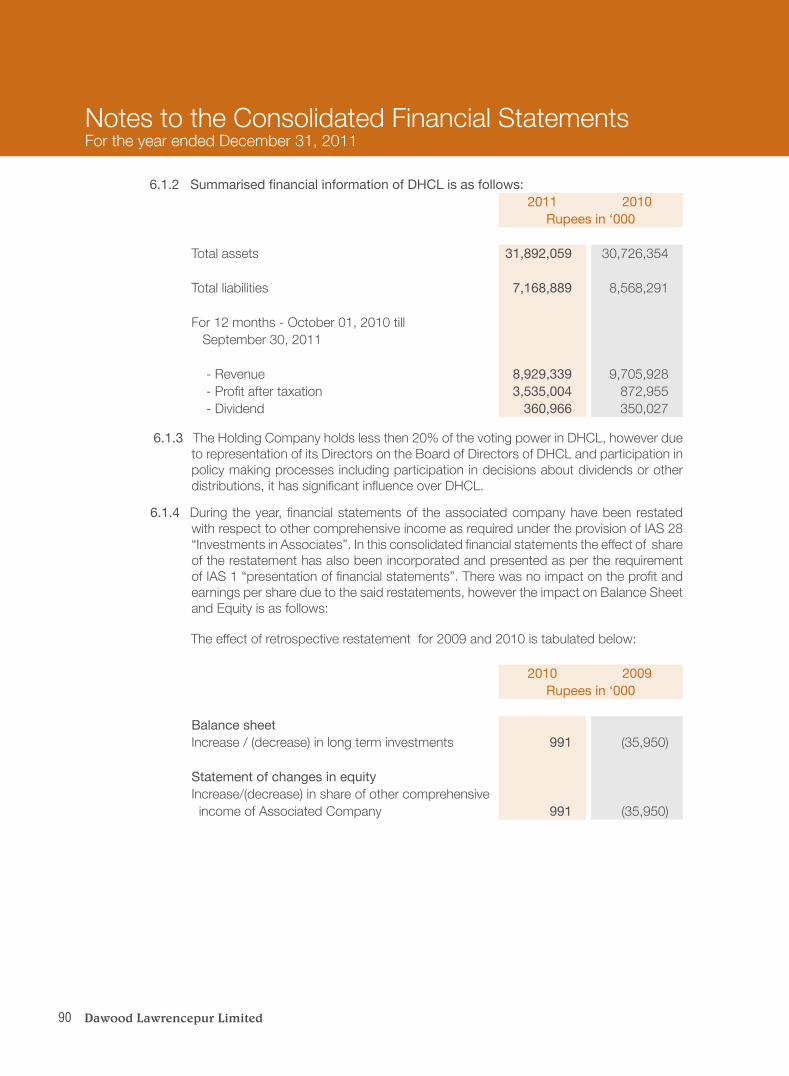
90
Notes to the Consolidated Financial StatementsFor the year ended December 31, 2011
6.1.2SummarisedfinancialinformationofDHCLisasfollows:2011 2010
Rupees in ‘000
Total assets 31,892,059 30,726,354
Total liabilities 7,168,889 8,568,291
For 12 months - October 01, 2010 till September 30, 2011
- Revenue 8,929,339 9,705,928 - Profit after taxation 3,535,004 872,955 - Dividend 360,966 350,027
6.1.3 The Holding Company holds less then 20% of the voting power in DHCL, however due to representation of its Directors on the Board of Directors of DHCL and participation in policy making processes including participation in decisions about dividends or other distributions, it has significant influence over DHCL.
6.1.4 During the year, financial statements of the associated company have been restated with respect to other comprehensive income as required under the provision of IAS 28 “Investments in Associates”. In this consolidated financial statements the effect of share of the restatement has also been incorporated and presented as per the requirement of IAS 1 “presentation of financial statements”. There was no impact on the profit and earnings per share due to the said restatements, however the impact on Balance Sheet and Equity is as follows:
The effect of retrospective restatement for 2009 and 2010 is tabulated below:
2010 2009Rupees in ‘000
Balance sheetIncrease / (decrease) in long term investments 991 (35,950)
Statement of changes in equityIncrease/(decrease) in share of other comprehensive income of Associated Company 991 (35,950)

91Annual Report 2011
Notes to the Consolidated Financial StatementsFor the year ended December 31, 2011
2011 2010Rupees in ‘000
6.2 Other investments Available for sale investments
2011 2010 Name of Investee No. of Shares / Units
Listed Securities200,000 200,000 National Investment Trust Limited 5,180 6,284 - 801,900 Southern Electric Power Company Ltd. - 1,788 - 69,137 Sui Southern Gas Company Limited - 1,481
5,180 9,553
Un-Listed Securities795,000 795,000 Karnaphuli Paper Mills Limited - - 100 100 Mianwali Central Co-operative Bank Ltd. - 1 1,500 1,500 Asian Co-operative Society Limited 15 15
15 165,195 9,569
6.3Reconciliationbetweenfairvalueandcostofinvestmentsclassifiedas‘availableforsale’
2011 2010Note Rupees in ‘000
Fair value of investments 5,195 9,569
Gain on remeasurement of investment recognized in equity (2,740) (4,627)Impairment loss charged to profit and loss account - for the year - 1,411 - in prior years - 10,713
(2,740) 7,497Cost of investments 2,455 17,066
7. LONG TERM DEPOSITS
Electricity and gas deposits 9,019 9,019 Others 1,525 1,525
10,544 10,5448. STORES AND SPARES
Stores 34,957 36,200 Spares 29,297 32,053
64,254 68,253 Stores in transit 1,263 -
65,517 68,253 Provision for slow moving and obsolete items 8.1 (20,311) (19,134)
45,206 49,119

92
Notes to the Consolidated Financial StatementsFor the year ended December 31, 2011
8.1 Movement in provision for stores and spares2011 2010
Note Rupees in ‘000
Opening balance 19,134 5,230 Provision made during the year 1,177 13,904 Closing balance 20,311 19,134
9. STOCK IN TRADE
Raw material 56,764 11,566 Work in process 101,500 86,862 Finished goods 134,173 105,393 Waste 2,412 1,513
294,849 205,334 Raw material in transit 39,833 10,763
334,682 216,097 Provision for slow moving and obsolete items 9.1 (14,994) (14,994)
319,688 201,103 9.1 Provision for slow moving and obsolete items
Raw material 4,915 4,915 Work in process 3,259 3,259 Finished goods 6,820 6,820
14,994 14,994 10. TRADE DEBTS
Unsecured Considered good 82,643 69,763 Considered doubtful 22,467 23,060
105,110 92,823 Provision against doubtful receivable 10.1 (22,467) (23,060)
82,643 69,763 10.1 Movement in provision for doubtful debt
Opening balance 23,060 19,714 Provision made during the year - 3,346 Reversal during the year (593) - Closing balance 22,467 23,060

93Annual Report 2011
Notes to the Consolidated Financial StatementsFor the year ended December 31, 2011
10.2 The amount due and maximum aggregate amount from related parties at the end of any month during the year as follows:-
Amount Outstanding
Maximum month end
balanceRupees in ‘000
December 31, 2011Sach International (Private) Limited 18,114 22,686
December 31, 2010 Sach International (Private) Limited 6,788 17,492
2011 2010Note Rupees in ‘000
11. LOANS AND ADVANCES
Unsecured Considered good
Advance tax 8,862 12,805 Loans and advances to employees 1,730 813 Advances to suppliers 1,365 594 Others 1,123 251
13,080 14,463
12. DEPOSITS, PREPAYMENTS AND OTHER RECEIVABLES
Profit on TDRs 1,033 - Income tax refundable 12.1 55,053 56,284 Security deposits 921 386 Prepayments 3,463 2,134 Letters of credit 3,163 1,053 Receivable against disposal of held for sale assets - 86,500 Sales tax 12.2 1,382 3,324 Others 12.3 4,886 5
69,900 149,686
12.1 Income tax refundable
Advance 76,562 77,793 Provision against doubtful receivable (21,509) (21,509)
55,053 56,284

94
Notes to the Consolidated Financial StatementsFor the year ended December 31, 2011
12.3 The amount due and maximum aggregate amount from related parties at the end of any month during the year is as follows:-
Amount Outstanding
Maximum month end
balanceRupees in ‘000
December 31, 2011
Sach International (Private) Limited 4,872 4,872Cyan Limited 9 376
December 31, 2010
Dawood Hercules Corporation Limited 5 5,033
2011 2010Note Rupees in ‘000
13. SHORT TERM INVESTMENTS
Held for trading at fair value through Profit and Loss 13.1 656,837 761,362
HeldfortradingatfairvaluethroughProfitandLoss
2011 2010 Name of Investee No. of Units3,560,143 4,906,434 Meezan Cash Fund 178,506 245,5181,680,961 2,690,456 UBL Liquidity Plus Fund 168,911 269,5752,525,114 2,409,499 MCB Cash Management Optimizer 259,798 246,2694,675,740 - NAFA Government Securities Liquid Fund 47,622 -
654,837 761,362
2011 2010Rupees in ‘000
12.2 Sales tax
Sales tax 9,510 11,452 Provision against doubtful receivable (8,128) (8,128)
1,382 3,324

95Annual Report 2011
Notes to the Consolidated Financial StatementsFor the year ended December 31, 2011
13.1Reconciliationbetweenfairvalueandcostofinvestmentsclassifiedas‘heldfortradingatfairvaluethroughprofitorloss’
2011 2010Note Rupees in ‘000
Fair value of investments 654,837 761,362
Unrealized gain on remeasurement of investments recognized in profit or loss account
- for the year 51,137 28,651- in prior years 30,445 1,794
(81,582) (30,445)Cost of investments 573,255 730,917
14. CASH AND BANK BALANCES
Cash in hand 799 1,118
Cash at banks 12,646 8,901 In current accounts 14.1 38,889 16,614 In deposit accounts 51,535 25,515
52,314 26,633
14.1 These represent deposits with commercial banks and carry profit at the rate of 5% (December 31, 2010: 5%) per annum.
2011 2010Note Rupees in ‘000
15. ASSETS CLASSIFIED AS HELD FOR SALE
Plant and equipment 15.1 172,762 172,762Stock-in-trade 6,218 11,946Stores and spares 15,578 16,447
194,558 201,155
Provision for slow moving and obsolete stock in trade and stores & spares 15.2 (5,883) (5,883)
188,675 195,272

96
Notes to the Consolidated Financial StatementsFor the year ended December 31, 2011
15.1 Plant and equipment
Particulars Cost
at January 01, 2011
Disposals Cost
at December 31, 2011
Accumulated depreciation at January 01, 2011
Depreciation adjusted for the year
Accumulated depreciation at December
31, 2011
Carrying value at
December 31, 2011
----------------------------------------------------- R u p e e s i n ‘0 0 0 ------------------------------------------------------
Plant and machinery 379,520 - 379,520 212,447 - 212,447 167,073
Electric installations 35,663 - 35,663 30,720 - 30,720 4,943
Tools and equipment 2,893 - 2,893 2,147 - 2,147 746
2011 418,076 - 418,076 245,314 - 245,314 172,762
For comparative year
Particulars Cost
at January 01, 2010
Disposals Cost
at December 31, 2010
Accumulated depreciation at January 01, 2010
Depreciation adjusted for the year
Accumulated depreciation at December
31, 2010
Carrying value at
December 31, 2010
----------------------------------------------------- R u p e e s i n ‘0 0 0 ------------------------------------------------------
Plant and machinery 1,296,452 (916,932) 379,520 654,001 (441,554) 212,447 167,073
Furniture, fixtures and office
equipment 1,169 (1,169) - 1,063 (1,063) - -
Electric installations 36,712 (1,049) 35,663 31,685 (965) 30,720 4,943
Tools and equipment 2,893 - 2,893 2,147 - 2,147 746
2010 1,337,226 (919,150) 418,076 688,896 (443,582) 245,314 172,762

97Annual Report 2011
Notes to the Consolidated Financial StatementsFor the year ended December 31, 2011
16. ISSUED SUBSCRIBED AND PAID UP CAPITAL
16.1 Authorized capital
2011 2010 Number of Shares
75,000,000 75,000,000 Ordinary shares of Rs. 10/- each 750,000 750,000
16.2 Issued, subscribed and paid up capital
2011 2010Number of Shares
Ordinary shares of Rs. 10/- each2,204,002 2,204,002 Fully paid in cash 22,040 22,040
12,805,118 12,805,118 Issued for consideration other than cash 128,051 128,05144,048,739 36,345,540 Fully paid as bonus 440,487 363,45659,057,859 51,354,660 590,578 513,547
2011 2010No. of shares
16.2.1 Reconciliation of number of ordinary shares
At January 01 51,354,660 51,354,660Add: Issue of bonus shares during the year 7,703,199 -At December 31 59,057,859 51,354,660
15.1.1 These represent the assets of Burewala unit for which approval of disposal has been obtained from shareholders.
15.2 Movement in slow moving and obsolete stock in trade and stores & spares
2011 2010Rupees in ‘000
Opening balance 5,883 18,467Provision made during the year - 4,066Stock in trade written off - (16,650)Closing balance 5,883 5,883

98
Notes to the Consolidated Financial StatementsFor the year ended December 31, 2011
16.2.2 Associates holding of the Company’s share capital as under:
2011 2010No. of shares
Dawood Corporation (Private) Limited 28,974,998 25,195,651Patek Private Limited 3,501,884 3,045,117Cyan Limited 3,215,095 2,795,735Pebbles (Private) Limited 685,718 596,277Dawood Industries (Private) Limited 154,921 105,959Sach International (Private) Limited 3,776 3,284
36,536,392 31,742,023
16.2.3 The Company has one class of ordinary shares which carry no right to fixed income. The holders are entitled to receive dividends as declared from time to time and are entitled to one vote per share at meetings of the Company. All shares rank equally with regard to the Company’s residual assets.
2011 2010Note Rupees in ‘000
17. DEFERRED LIABILITIES
Gratuity 17.1 59,674 48,557 Deferred taxation 17.2 - -
59,674 48,557
17.1 Movement in the liability recognized in the balance sheet
Opening balance 48,557 44,695 Net charge for the year 17.1.1 22,217 9,945
70,774 54,640 Payments made during the year (11,100) (6,083)Closing balance 59,674 48,557
17.1.1 Chargefordefinedbenefitplan
Current service cost 5,615 4,078 Interest cost 6,583 6,127 Return on plan assets (271) (260)Past service cost 17.1.3 10,290 -
22,217 9,945 17.1.2 Reconciliation
Present value of defined benefit obligation 69,058 50,644 Fair value of plan assets (2,132) (2,082)Actuarial losses to be recognized in later periods (7,252) (5)
59,674 48,557

99Annual Report 2011
Notes to the Consolidated Financial StatementsFor the year ended December 31, 2011
December2011
December2010
December2009
June2009
June2008
------------------------- R u p e e s i n ‘ 0 0 0 -------------------------
Present value of defined benefit obligation 69,058 50,644 51,059 47,107 29,616
Fair value of plan assets (2,132) (2,082) (2,163) (2,163) (2,163)
Surplus in the plan 66,926 48,562 48,896 44,944 27,453
Unrecognized actuarial (loss) / gain (7,252) (5) (4,201) (3,323) 10,287
Liability in balance sheet 59,674 48,557 44,695 41,621 37,740
Experience adjustment arising on plan liabilities losses / (gain) 7,026 (4,537) 749 12,580 4,054
Experience adjustment arising on plan assets losses (221) (341) (130) (216) (216)
17.1.3 During the year, the Company has made an amendment in the plan according to which gratuity obligation will be based on gross salary instead of basic salary of the entitled employees.
17.2 Deferred taxation Deferred tax asset works out to Rs. 180.27 million (December 31,2010: Rs. 135.43 million).
However, it is likely that the income of the Holding Company will be taxable based on turnover tax and under final tax regime in future, hence, as a matter of prudence, deferred tax asset is not recognized.
2011 2010Note Rupees in ‘000
18. TRADE AND OTHER PAYABLES
Creditors 18,004 22,400 Accrued expenses 42,022 33,968 Gratuity to ex staff 295 6,104 Advance from customers and others 10,777 3,770 Unclaimed dividend 21,031 21,058 Due to Islamic Development Bank 18.1 25,969 25,969 Deposits 18.2 1,115 719 Workers’ welfare fund 2,423 1,705 Withholding tax 142 93 Advance against scrap sales 10,529 7,690 Staff allowances and benefits 3,112 1,627 Others 18.3 - 447
135,419 125,550

100
Notes to the Consolidated Financial StatementsFor the year ended December 31, 2011
18.1 This represents amount payable against the preference shares issued before the amalgamation in the year 2004 by one of the merged entity to Islamic Development Bank with a right to redeem. The merged entity had served notice to the Bank for redemption before the scheme of amalgamation and redemption reserve has been created.
18.2 All deposits are interest free and re-payable on demand.
19. CONTINGENCIES AND COMMITMENTS
19.1 Contingencies a) The Taxation Officer while framing assessment for the tax year 2003 made errors in allowing
expenses relating to gratuity, lease rentals, employee perquisites and utilities amounting to Rs. 29.34 million, and for tax years 2004 to 2005 had made additions on account of allocation of expenses between the normal and presumptive income of the Company amounting to Rs. 136.10 million and had disallowed Rs. 20.62 million as adjustment of brought forward losses of the Company.
During the year, Appellate Tribunal Inland Revenue (ATIR) has decided the issue of brought forward losses against the Company, however, the Company has filed an appeal before the High Court and a decision is awaited. The remaining issues have been set aside by the said Tribunal and remanded to the taxation officer for reconsideration. The tax impact of all cases amounts to Rs. 65.12 million.
b) The subsidiary company has arranged a bank guarantee of USD 250,000 (2010: USD 50,000 arranged by Holding Company on behalf of the Company) to Alternative Energy Development Board (AEDB) for Letter of Interest. The guarantee is valid upto December 31, 2011.
c) The Holding Company is contingently liable against guarantees and counter guarantees amounting to Rs. 11.91 million (December 31, 2010: Rs. 64.37 million). These are secured against margins.
19.2 Commitments
The Holding Company has commitments against letters of credit for purchase of raw material amounting to Rs. 28.6 million (December, 2010: Rs. 42.44 million).
The Holding Company has a commitment to supply fabric to a customer amounting to Rs. 9.8 million (December 31, 2010: Rs. 16.79 million).
18.3 These represent amount due to the following related parties:2011 2010
Rupees in ‘000
Sach International (Private) Limited - 275 Dawood Corporation (Private) Limited - 155 The Dawood Foundation - 9 Cyan Limited - 8

101Annual Report 2011
Notes to the Consolidated Financial StatementsFor the year ended December 31, 2011
2011 2010Note Rupees in ‘000
20. SALES - NET
Fabric 377,807 387,208 Yarn 9,642 6,055 Waste - 3,805
387,449 397,068 Less: Brokerage, commission and discount (5,317) (4,704)
382,132 392,364 Related to discontinued operations Fabric (7,465) (11,502)
374,667 380,862
21. COST OF GOODS SOLD
Raw material consumed 21.1 168,388 122,362 Salaries, wages and allowances 21.2 105,893 96,171 Electricity, gas and water 72,145 61,869 Stores and spares consumed 21.3 24,710 24,289 Depreciation 4,489 4,395 Insurance 1,635 1,532 Repairs and maintenance 726 305 Workers’ canteen 1,247 1,251 Travelling and conveyance 2,822 2,078 Postage and telephone 327 339 Other manufacturing overheads 1,497 1,139
383,879 315,730 Work in process Opening balance 88,374 101,853 Closing balance (103,912) (88,374)
(15,538) 13,479 Cost of goods manufactured 368,341 329,209
Finished goods Opening balance 117,268 128,491 Closing balance (140,320) (117,268)
(23,052) 11,223 Cost of goods sold 345,289 340,432 Related to discontinued operations (5,728) (10,226)
339,561 330,206

102
2011 2010Rupees in ‘000
21.1 Raw material consumed At January 01 11,637 7,638
Purchases and related expenses 213,586 126,361 225,223 133,999
At December 31 (56,835) (11,637) 168,388 122,362
21.2 Staff salaries and benefits include Rs. 11.6 million (December 31, 2010: Rs. 5.3 million) in respect of staff retirement benefits.
21.3 Stores and spares consumed
2011 2010Rupees in ‘000
At January 01 68,253 54,105 Purchases and related expenses 20,711 38,437
88,964 92,542 At December 31 (64,254) (68,253)
24,710 24,289 22. OTHER OPERATING INCOME
Incomefromfinancialassets
Dividend Income National Investment Trust Limited 800 450 Sui Southern Gas Company Limited - 83
800 533 Profit on deposits 3,794 1,321 Capital gain on sale of investments - available for sale 722 22,335 - held for trading 35,837 6,918 Unrealized gain on short term investments 51,137 28,651
91,490 59,225 Incomefromnonfinancialassets
Profit on sale of property, plant and equipment 902 1,363 Profit on sale of assets classified as held for sale - 15 Interest on security deposits 344 344 Sundry sales and receipts 367 2,789 Insurance claim - 5,600 Other income 1,284 1,450 Storage income 12,961 4,882 Liabilities written back - 328
15,858 16,771 108,148 76,529
Related to discontinued operations (15,901) (13,149)92,247 63,380
Notes to the Consolidated Financial StatementsFor the year ended December 31, 2011

103Annual Report 2011
2011 2010Note Rupees in ‘000
23. SELLING AND DISTRIBUTION EXPENSES
Salaries and allowances 23.1 10,905 6,319 Sales promotion 1,788 1,517 Storage and forwarding 1,100 931 Depreciation 320 584 Conveyance and travelling 614 500 Rent, rates and taxes 389 401 Printing and stationery 103 395 Repairs and maintenance 160 153 Freight and insurance 354 147 Advertisement 197 136 Postage and telephone 165 111 Entertainment 72 88 Electricity and gas 64 63 Miscellaneous 1 4
16,232 11,349
23.1 This includes staff retirement benefits of Rs. 2.4 million (December 31, 2010: Rs. 1.1 million)
2011 2010Note Rupees in ‘000
24. ADMINISTRATIVE EXPENSES
Salaries and allowances 24.1 80,536 61,751 Printing and stationery 2,571 1,677 Rent, rates and taxes 10,086 7,277 Electricity and gas 7,044 6,343 Conveyance and travelling 2,588 3,103 Postage and telephone 2,108 2,152 Insurance 2,538 2,780 Repairs and maintenance 2,046 1,241 Legal and professional 2,333 3,550 Auditors’ remuneration 24.2 585 541 Fees and subscription 8,333 3,754 Entertainment 664 690 Workers’ welfare fund 718 1,705 Depreciation 4,743 4,858 Amortization 5.1 371 370 Bank charges and Zakat 815 1,771 Miscellaneous 1,000 1,018
129,079 104,581 Related to discontinued operations (48,173) (40,150)
80,906 64,431
Notes to the Consolidated Financial StatementsFor the year ended December 31, 2011

104
Notes to the Consolidated Financial StatementsFor the year ended December 31, 2011
24.1 Staff salaries and benefits include Rs. 7.4 million (December 31, 2010: Rs. 2.9 million) in respect of staff retirement benefits.
2011 2010Rupees in ‘000
24.2 Auditors’ remuneration
Annual audit fee 405 375 Audit fee of consolidated financial statements 40 40 Half yearly review and other certification fee 140 126
585 541
25. PROVISIONS / (REVERSALS)
Stores and spares 1,177 15,351 Stock in trade - 7,307 Debtors - 3,346 Sales tax refundable - 8,128 Reversal of provision for doubtful debts (593) -
584 34,132 Related to discontinued operations - (14,727)
584 19,405
26. TAXATION
Current year 8,541 13,591 Prior year 492 10,519 Share of taxation from associated company 188,744 136,919
197,777 161,029
26.1 Relationshipbetweentaxexpenseandaccountingprofit
The relationship between tax expense and accounting profit has not been presented in these financial statements as the total income falls under: (a) turnover tax provided under section 113 (b) and income that are separately taxed under respective sections of the Income Tax Ordinance, 2001.
2011 2010Note Rupees in ‘000
27. LOSS FROM DISCONTINUED OPERATIONS
Sales - net 7,465 11,502 Cost of goods sold 27.1 (5,728) (10,226)Gross profit 1,737 1,276 Other income 22 15,901 13,149 Administrative expenses (48,173) (40,150)Provisions - (14,727)Net loss from discontinued operations (30,535) (40,452)

105Annual Report 2011
Notes to the Consolidated Financial StatementsFor the year ended December 31, 2011
2011 2010Rupees in ‘000
27.1 Cost of goods sold
Raw material Opening inventory 71 71 Less: closing inventory (71) (71)Raw material consumed - -Add: opening inventory of finished goods 11,875 22,101 Less: closing inventory of finished goods (6,147) (11,875)Cost of goods sold 5,728 10,226
28. EARNINGS PER SHARE
- Basic & diluted
There is no dilutive effect on the basic earnings per share of the Company which is based on:-
28.1 Continuing operations
Profit after taxation 592,096 520,575 Weighted average number of ordinary shares outstanding during the year 59,058 59,058 Earnings per share (Rs.) 10.03 8.81
28.2 Discontinued operations
Loss after taxation (30,535) (40,452)Weighted average number of ordinary shares outstanding during the year 59,058 59,058 Earnings per share (Re.) (0.52) (0.68)
Number of ordinary shares outstanding as at December 31, 2010 have been increased to reflect the bonus shares issued during the year.
29. REMUNERATION OF CHIEF EXECUTIVE AND EXECUTIVES
2011 2010
Chief Executive Executives Chief Executive Executives------------------------- R u p e e s i n ‘ 0 0 0 -------------------------
Remuneration 4,115 10,423 4,348 8,424
House rent allowance 2,038 4,135 2,174 2,969
Utilities 1,019 1,131 1,087 1,036
Retirement benefits 78 435 347 207
Other allowance 2,513 5,841 1,714 3,537
9,763 21,965 9,670 16,173
No. of person(s) 1 8 1 7
Chief Executive and executives of the Company are entitled to use of Company maintained vehicle.

106
Notes to the Consolidated Financial StatementsFor the year ended December 31, 2011
30. TRANSACTIONS WITH RELATED PARTIES
Related parties comprise of associated companies, directors and key management personnel. The Company in the normal course of business carries out transactions with various related parties. Amounts due from and to related parties, directors and key management personnel are shown under respective notes of receivables and payables. Remuneration of directors and key management personnel is disclosed in note 29. Other significant transactions with related parties are as follows:
31. FINANCIAL RISK MANAGEMENT
The Group’s principal financial liabilities comprise trade and other payables. The Group’s financial assets comprise of trade debts, prepayments, other receivables, bank balances and investments in equity securities and units of mutual fund that derive directly from its operations. The Group also holds loans, advances and deposits.
The Group’s activities expose it to a variety of financial risks: credit risk, liquidity risk and market risk (including cash flow interest rate risk, currency risk, equity price risk and fair value interest rate risk).
Relationship Nature of transaction2011 2010Rupees in ‘000
a. Associated companies
Dawood Hercules Corporation Limited Dividend income 19,483 95,644 Reimbursement of expenses 823 -
Sach International (Private) Limited Sale of fabric 49,309 28,968 Reimbursement of expenses 5,529 -
Cyan Limited Premium paid - 3,240 Insurance premium refund 371 - Insurance claims received 43 - Reimbursement of expenses 9 -
b. Other related parties
Sui Northern Gas Pipelines Limited Utility charges 21,288 23,342
The Dawood Foundation Rental charges 7,306 6,353 Maintenance and utility charges 1,280 -
Dawood Corporation (Pvt) Limited Reimbursement of expenses 155 - Payment against assets transferred 1,233 -
Inbox Business Technologies (Pvt) Limited Purchase of computer equipment 501 174
Payment of hardware maintenance charges
250 -

107Annual Report 2011
Notes to the Consolidated Financial StatementsFor the year ended December 31, 2011
The Group’s overall risk management programme focuses on the unpredictability of financial markets and seeks to minimise potential adverse effects on the Group’s financial performance.
31.1 Credit risk and concentration of credit risk
Credit risk is the risk of financial loss to the Group if a customer or counterparty to a financial instrument fails to meet its contractual obligations and arises principally from the trade debts, loans and advances, trade deposits and other receivables.
The Group is exposed to credit risk from its operating activities (primarily for trade receivables and loans and advances, deposits, other receivables) and from its investing activities, including investment in securities, deposits with banks and other financial instruments.
Out of the total financial assets of Rs. 4,894.56 million (2010: Rs. 4,554.22 million), the financial assets which are subject to credit risk amounted to Rs. 4,893.78 million (2010: Rs. 4,553.10 million).
31.1.1 Credit risk related to receivables
The Holding Company only deals in local sales. Customer credit risk is managed by business unit subject to the Holding Company’s established policy, procedures and controls relating to customer credit risk management. Holding Company mainly deals with customers of high credit rating based on its internal assessment, taking account of financial position, past experience and other factors. In addition outstanding customer receivables are regularly monitored and appropriate actions are taken to minimize risk of bad debts.
At December 31, 2011, the Holding Company had approximately 150 customers
(2010:186 customers) that owed Rs. 82.64 million (2010: Rs. 69.76 million). There were 4 customers (2010:3 customers) with balances greater than Rs. 5 million covering over 44% (2010: 34%) of trade debts.
31.1.2 Creditriskrelatedtofinancialinstrumentsandcashdeposits
Credit risk from balances with banks and financial institutions is managed by chief
executive officer and chief financial officer in accordance with the Group’s policy.
The credit risk on liquid funds (cash and bank balances) is limited because the counter parties are banks with a high credit rating. The names and credit rating of major banks as at December 31, 2011, where the Company maintains its major bank balances are as follows:
Name of bank Rating agencyCredit rating
Short-term Long-term
Bank Al Habib Limited PACRA A1+ AA+
Habib Bank Limited JCR-VIS A-1+ AA+

108
Notes to the Consolidated Financial StatementsFor the year ended December 31, 2011
31.2 Liquidity risk Prudent liquidity risk management implies maintaining sufficient cash and the availability of
funding through an adequate amount of committed credit facilities.
The Group is equity financed and is not required to enter into any borrowing to support its financing requirement, therefore the Group is not materially exposed to liquidity risk as it is already surplus in funds. The contractual obligations to the Group is mainly through trade and other payable amounts to Rs. 135.41 million (2010: Rs. 125.55 million) having adequate liquidity backup against the currents assets of Rs. 799.8 million (2010: Rs. 946.30 million).
31.3 Market risk management Market risk is the risk that changes in market prices, such as interest rates and equity prices
will affect the Group’s income or the value of its holdings of financial instruments. The objective of market risk management is to manage and control market risk exposures within acceptable parameters while optimising returns.
31.3.1 Interest rate risk management
As the Group has no significant interest-bearing assets, the Group’s income and operating cash flows are substantially independent of changes in market interest rates. However, the Group has short term investments in units of money market mutual funds, the value of which will have direct impact due to change in interest rate. (Refer note 13)
31.3.2 Foreign exchange risk management
Foreign currency risk is the risk that the fair value or future cash flows of a financial instrument will fluctuate because of changes in foreign exchange rates. The Holding Company’s exposure to the risk of changes in foreign exchange rates relates primarily to the Holding Company’s operating activities which mainly include amounts payable to foreign suppliers for goods in foreign currency. The Holding Company deals completely in local sales and does not have any foreign currency exports against foreign debtors.
At December 31, 2011, considering the total outstanding exposure in foreign currency, if the Pakistani Rupee had weakened / strengthened by 5% against the US dollar with all other variables held constant, profit for the year would have been higher / lower by Rs. 0.047 million (2010: Rs. 1.10 million), mainly as a result of foreign exchange gains / losses on translation of foreign currency import loans.
31.3.3 Equity price risk management
The Group has investments in top listed and unlisted equity securities. These securities are susceptible to market price risk arising from uncertainties about future values of the investment securities. The Company manages the equity price risk through diversification and conducts proper review of individual and total equity instruments. Reports on the equity portfolio are submitted to the Company’s senior management on a regular basis.

109Annual Report 2011
Notes to the Consolidated Financial StatementsFor the year ended December 31, 2011
a) InvestmentsatFairValuethroughprofitorloss-listedunitsofMutualFunds
At the balance sheet date, the exposure to listed units of mutual funds at fair value is Rs. 654.83 million (2010: Rs. 761.36 million). A decrease / increase of 5% in the net asset value per unit would have an impact of approximately Rs. 2.56 million (2010: Rs. 1.43 million) on the income of the Company, depending on whether or not the decline is significant and prolonged.
b) Investments at ‘Available for sale’ - Equity securities
At the balance sheet date, the exposure to listed equity securities at fair value is Rs. 5.18 million (2010: Rs. 9.55 million). A decrease / increase of 5% on the KSE market index would have an impact of approximately Rs. 0.0943 million (2010: Rs. 0.0486 million) on the other comprehensive income of the Holding Company, depending on whether or not the decline is significant and prolonged .
31.4 Determination of fair values
31.4.1 Fairvalueoffinancialinstruments
Fair value is the amount for which an asset could be exchanged, or a liability settled, between knowledgeable willing parties in an arms length transaction other than in a forced or liquidation sale.
The carrying values of all financial assets and liabilities reflected in the financial statements approximate their fair values.
31.5 Financial instruments by category
The accounting policies for financial instruments have been applied for line items below:
Loan & advances
Available for sale
Fair value through prof it or loss Total
---------------------------------------- R u p e e s i n ‘ 0 0 0 ----------------------------------------
Assets as per balance sheet
- December 31, 2011
Long term investments - 4,083,175 - 4,083,175
Long term deposits 10,544 - - 10,544
Trade debts - net 82,643 - - 82,643
Loans and advances 4,218 - - 4,218
Deposits and other receivables 6,835 - - 6,835
Short term investments - - 654,837 654,837
Cash and bank balances 52,314 - - 52,314
156,554 4,083,175 654,837 4,894,566
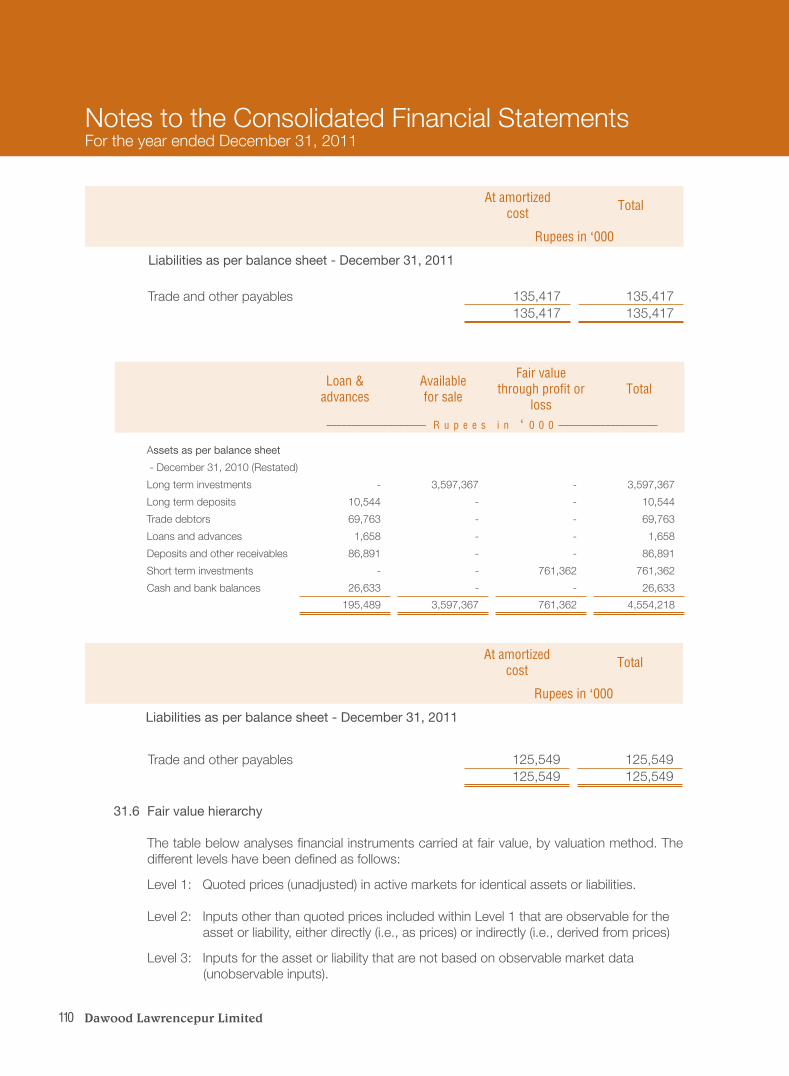
110
Notes to the Consolidated Financial StatementsFor the year ended December 31, 2011
At amortized cost Total
Rupees in ‘000
Liabilities as per balance sheet - December 31, 2011
Trade and other payables 135,417 135,417
135,417 135,417
At amortized cost Total
Rupees in ‘000
Liabilities as per balance sheet - December 31, 2011
Trade and other payables 125,549 125,549
125,549 125,549
Loan & advances
Available for sale
Fair value through prof it or
lossTotal
---------------------------------------- R u p e e s i n ‘ 0 0 0 ----------------------------------------
Assets as per balance sheet
- December 31, 2010 (Restated)
Long term investments - 3,597,367 - 3,597,367
Long term deposits 10,544 - - 10,544
Trade debtors 69,763 - - 69,763
Loans and advances 1,658 - - 1,658
Deposits and other receivables 86,891 - - 86,891
Short term investments - - 761,362 761,362
Cash and bank balances 26,633 - - 26,633
195,489 3,597,367 761,362 4,554,218
31.6 Fair value hierarchy
The table below analyses financial instruments carried at fair value, by valuation method. The different levels have been defined as follows:
Level 1: Quoted prices (unadjusted) in active markets for identical assets or liabilities.
Level 2: Inputs other than quoted prices included within Level 1 that are observable for the asset or liability, either directly (i.e., as prices) or indirectly (i.e., derived from prices)
Level 3: Inputs for the asset or liability that are not based on observable market data (unobservable inputs).

111Annual Report 2011
Notes to the Consolidated Financial StatementsFor the year ended December 31, 2011
32. CAPITAL RISK MANAGEMENT
The Group manages its capital to ensure that it will be able to continue as a going concern while maximizing the return to stakeholders through optimisation of the debt and equity balance.
Currently the Group is free from any sort of borrowings and is fully equity based and has adequate
funds to meet its short term and long term liabilities. During the year, the Holding Company has issued bonus shares of Rs. 77.03 million to it’s existing
shareholders.
33. PLANT CAPACITY AND ACTUAL PRODUCTION
Level 1 Level 2 Level 3 Total-------------------------------------------- R u p e e s i n ‘ 0 0 0 --------------------------------------------
Financial assets at fair value through profitorloss
Short term investments 654,837 - - 654,837
Available for sale
Long term investments 70,489 270,528 - 341,017
The main reason for low production is lower market demand.
34. SEGMENT REPORTING The Holding Company’s core business is manufacturing and sale of fabrics and yarn and it generates
more than 78% of its revenue from this business. Decision making process is centralized at Head Office led by the Chief Executive Officer who is continuously involved in day to day operations and regularly reviews operating results, assesses performance and makes necessary decisions regarding resources to be allocated to the segments. Currently the Holding Company has one operating manufacturing unit at Attock and other unit at Burewala where operations have been discontinued since 2008. The assets and results of the discontinued operations are separately disclosed in note 15 and 27 of these financial statements respectively. The Holding Company also holds investments in listed securities and units of open-end funds. Further, the Company also holds long term strategic investments in a wholly owned subsidiary and an associated company, performance results of which are disclosed in note 6 and note 13 to these financial statements.
UnitDecember 31, 2011 December 31, 2010
Capacity Actual Capacity Actual
Yarn
Fabric
Kgs.
Meters
358,000
754,000
136,063
540,938
358,000
754,000
170,000
664,000

112
35. CORRESPONDING FIGURES
Comparative information has been re-classified, re-arranged or additionally incorporated in these financial statements, wherever necessary, to facilitate comparison and to conform with changes in presentation in the current year.
36. DATE OF AUTHORIZATION FOR ISSUE
These consolidated financial statements were authorized for issue on March 01, 2012 by the Board of Directors of the Holding Company.
37. POST BALANCE SHEET EVENTS The Board of Directors of the Holding Company at its meeting held on March 01, 2012 has
proposed a final cash dividend @ Rs. 1/- per share amounting to Rs. 59,057,859 for the year ended December 31, 2011 for approval at the Annual General Meeting to be held on April 23, 2012. These financial statements do not reflect this proposed dividend.
38. GENERAL Figures have been rounded off to the nearest thousand of rupees.
Notes to the Consolidated Financial StatementsFor the year ended December 31, 2011
SHAHID HAMID PRACHAChairman
INAM UR RAHMANChief Executive

113Annual Report 2011
Pattern of ShareholdingAs at December 31, 2011
Number of Shareholders Type of Shareholdings Total Shares Held
2,770 1 TO 100 115,473 1,841 101 TO 500 460,353 595 501 TO 1,000 438,351 767 1,001 TO 5,000 1,669,562 121 5,001 TO 10,000 841,979 38 10,001 TO 15,000 449,377 19 15,001 TO 20,000 323,276 12 20,001 TO 25,000 269,685 7 25,001 TO 30,000 190,015 2 30,001 TO 35,000 66,508 3 35,001 TO 40,000 109,598 3 40,001 TO 45,000 131,640 2 45,001 TO 50,000 97,895 1 50,001 TO 55,000 52,500 2 55,001 TO 60,000 113,037 1 65,001 TO 70,000 67,639 1 70,001 TO 75,000 74,935 1 110,001 TO 115,000 115,000 1 115,001 TO 120,000 117,000 1 125,001 TO 130,000 128,319 1 135,001 TO 140,000 135,412 1 150,001 TO 155,000 154,921 1 275,001 TO 280,000 275,595 1 415,001 TO 420,000 418,341 1 555,001 TO 560,000 556,639 1 570,001 TO 575,000 575,000 1 685,001 TO 690,000 685,718 1 715,001 TO 720,000 719,808 3 1,015,001 TO 1,020,000 3,048,589 1 1,080,001 TO 1,085,000 1,081,357 2 1,175,001 TO 1,180,000 2,353,492 1 1,185,001 TO 1,190,000 1,186,139 1 2,975,001 TO 2,980,000 2,979,324 1 3,215,001 TO 3,220,000 3,215,095 1 3,360,001 TO 3,365,000 3,363,405 1 3,500,001 TO 3,505,000 3,501,884 1 28,970,001 TO 28,975,000 28,974,998
6,208 TOTAL 59,057,859

114
Pattern of ShareholdingAs at December 31, 2011
Catagories of Shareholders as at December 31, 2011 Number of Shareholders
Total Shares Held Percentage
Individuals 5,658 17,782,749 30.11Investment Companies 5 14,239 0.02Insurance Companies 4 570,265 0.97Joint Stock Companies 44 36,695,293 62.13Financial Institutions 18 391,258 0.66Mutual Funds 1 275,595 0.47
OthersOther Trusts 7 3,035,382 5.14Charitable Organisations 1 36,366 0.06Co-operative Societies 466 117,181 0.20Administrator, Abandoned Properties Organization 2 137,908 0.23Administrator General of Sindh 1 1,596 0.00Kukab Agencies (Pakistan) 1 27 0.00
Total 6,208 59,057,859 100.00
Disclosure Requirement under Code of Corporate GovernanceShares Held
1 Directors, and CEOShahid Hamid Pracha Chairman 1,265 Inam ur Rahman Chief Executive 1,150 Shahzada Dawood Director 1,016,196 A. Samad Dawood Director 1,186,139 S.M. Asghar Director 1,265 Haroon Mahenti Director 15,315 Shafiq Ahmed Director 1,154 Mir Muhammad Nasir Director 1,150 Sulaiman Sadruddin Mehdi Director 1,150
2 Associated CompaniesCyan Limited 3,215,095 Dawood Corporation (Pvt.) Ltd. 28,974,998 Sach International (Pvt.) Ltd. 3,776 Dawood Industries (Pvt.) Ltd. 154,921 Patek (Pvt.) Ltd. 3,501,884 Pebbles (Pvt.) Ltd. 685,718
3 N I T and I C PNational Investment Trust 6,842 Investment Corporation of Pakistan 1,593
4 Banks, DFI, NBFI, Insurance Companies, Modaraba and Mutual Funds 1,228,683
5 Investment Companies 14,239 6 Joint Stock Companies 158,901 7 Others (Detail below)
Other Trusts 3,035,382 Charitable Organisation 36,366 Co-operative Societies 117,181 Administrator General of Sindh 1,596 Kaukab Agencies (Pakistan) 27 Administrator, Abandoned Properties Organizations 137,908
8 Shareholders holding ten percent or more sharesDawood Corporation (Pvt.) Ltd. 28,974,998

115Annual Report 2011
Pattern of ShareholdingAs at December 31, 2011
9. Detailofpurchase/saleofsharesbyDirectors/CompanySecretary/ChiefFinancialOfficerand their spouses/minor children during 2011
Name Dated Purchase Sale Rate Rs./Share
Shahid Hamid Pracha May 24 165*
Inam ur Rahman May 24 150*
Shahzada Dawood May 24 132,547*
A. Samad Dawood
May 24 132,547*
Sep 26 21,599** 23.51
Sep 27 59** 23.56
Oct 26 52,358** 25.09
Oct 27 11,885** 25.06
Oct 28 1,199** 25.06
Nov 02 4,700** 25.06
Nov 10 4,970** 25.06
Nov 17 15,408** 25.02
Nov 21 7,000** 25.06
Nov 22 3,837** 25.04
Nov 23 9,099** 25.06
Nov 24 990** 25.06
Dec 02 35,839** 25.06
Dec 07 1,000** 25.06
S.M. Asghar May 24 165*
Haroon Mahenti May 24 1,997*
* 15% Bonus Shares** Shares purchased from Karachi Stock Exchange


Proxy Form
I/Weof being a member of Dawood Lawrencepur Limited and holder of Ordinary Shares, as per:
Share Register Folio No. and/orCDC Participant ID No. Sub A/c No.hereby appoint Mr./Ms. of ,another member of the Company* (or failing him Mr./Ms. of , another member of the Company*) as my/our proxy to attend, speak and vote for me/us and on my/our behalf, at the Sixty Second Annual General Meeting of the Company to be held on Monday April 23, 2012 at Karachi Marriott Hotel, 9 Abdullah Haroon Road, Karachi and at any adjournment thereof.
Signed this day of 2012.
WITNESSES:
1. Signature: Name: Address: CNIC No. or Passport No.
2. Signature: Name: Address:
CNIC No. or Passport No.
* Proxy representing a corporation may or may not himself be a member of the Company.
IMPORTANT:
1. This Proxy Form, duly completed, must be deposited at the Company’s Registered Office, not less than forty eight hours before the meeting.
2. CDC shareholders and their proxies are each requested to attach an attested photocopy of their new/Computerized National Identity Card (CNIC) or Passport with this proxy form before submission to the Company.
3. All proxies attending the AGM are requested to bring their original CNIC/Passport for identification.
Signature onRevenue Stampsof Rupees Five
Signature should agree with the specimen signature with
the Company.
The Company SecretaryDawood Lawrencepur Limited3rd Floor, Dawood Centre, M.T. Khan Road, Karachi-75530Tel: +92 21 35686001 Fax: +92 21 35633970www.dawoodlawrencepur.com
AFFIXCORRECTPOSTAGE

Registered Office / Head Office / Shares Department:Dawood Centre, M.T. Khan Road, Karachi-75530
Tel: (92-21) 35686001-16Fax: (92-21) 35633970
E-mail: [email protected] Website: www.dawoodlawrencepur.com


