16
1 Day 3: Energy Flow Through an Ecosystem Food Chains, Food Webs, Energy Pyramids copyright cmassengale

1
Day 3: Energy Flow Through an
Ecosystem
Food Chains, Food Webs, Energy Pyramids
copyright cmassengale

2
Organisms that make their own energy through photosynthesis are calledProducers or Autotrophs.
Photosynthesis – process using light, CO2 & H2O to form energy (glucose)
copyright cmassengale
3
Organisms that cannot make their own energy & take energy from other sources are called Consumers or Heterotrophs
copyright cmassengale

4
•Carnivore– meat only •Herbivore– plants only•Omnivore– both meat & plants•Decomposer– breaks down & absorbs dead/decaying organisms; recycles material back into earth•Detritivore (scavenger)- eats dead organisms (carcasses)
Types of heterotrophs:
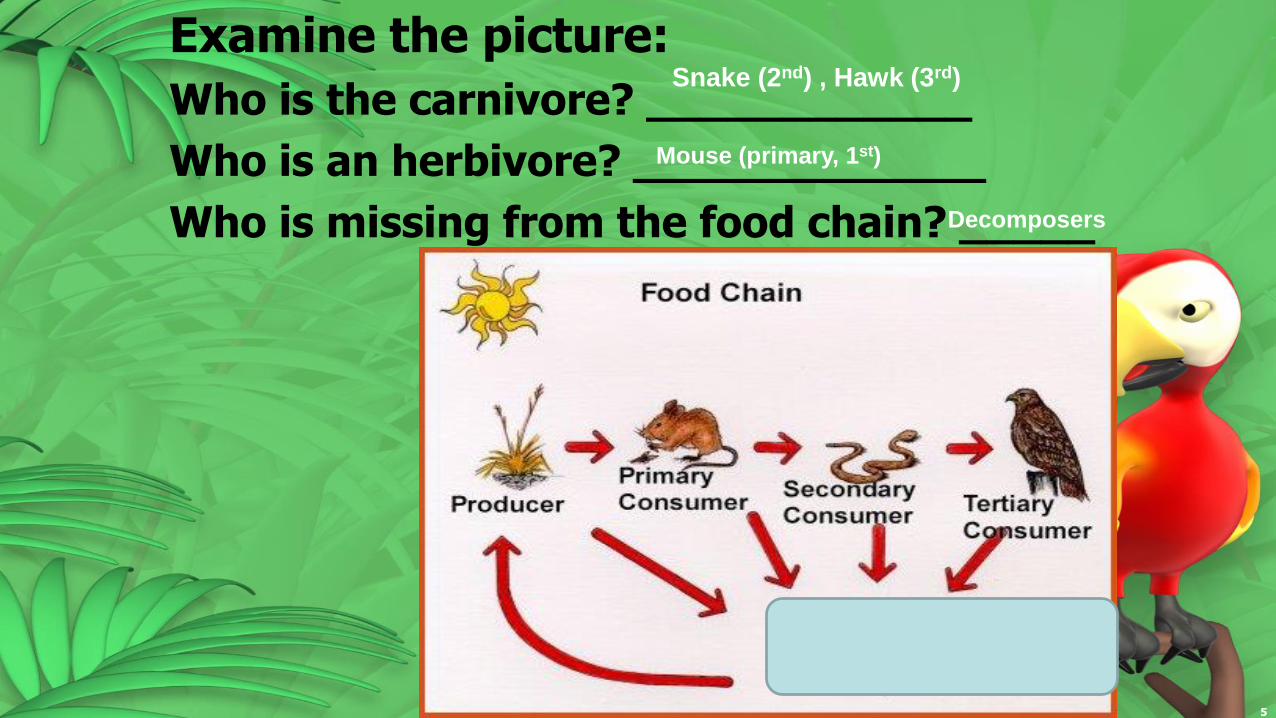
Examine the picture:
Who is the carnivore? ____________
Who is an herbivore? _____________
Who is missing from the food chain? _____
copyright cmassengale 5
Snake (2nd) , Hawk (3rd)
Mouse (primary, 1st)
Decomposers

6
FOOD CHAIN:The transfer of energyfrom the sun to producers,to primary consumer, then to higher order consumer
The arrow represents the direction of energy flow.
copyright cmassengale
7copyright cmassengale
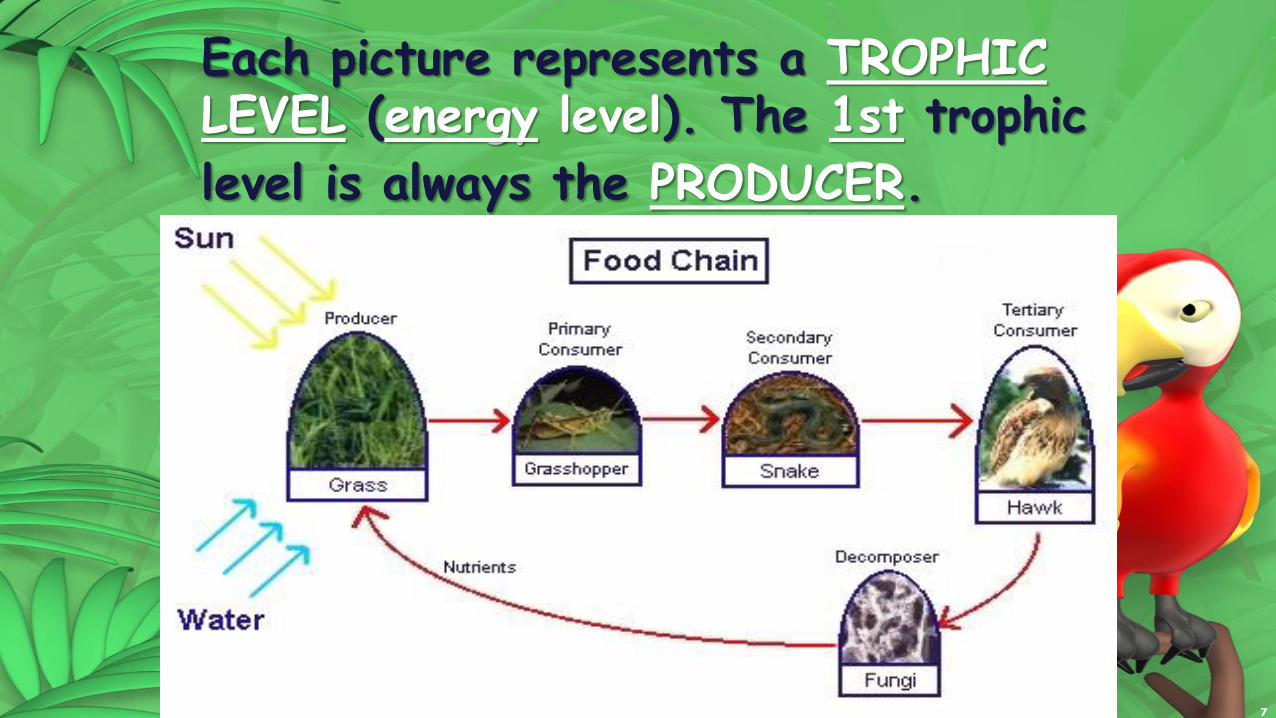
Each picture represents a TROPHIC LEVEL (energy level). The 1st trophic
level is always the PRODUCER.
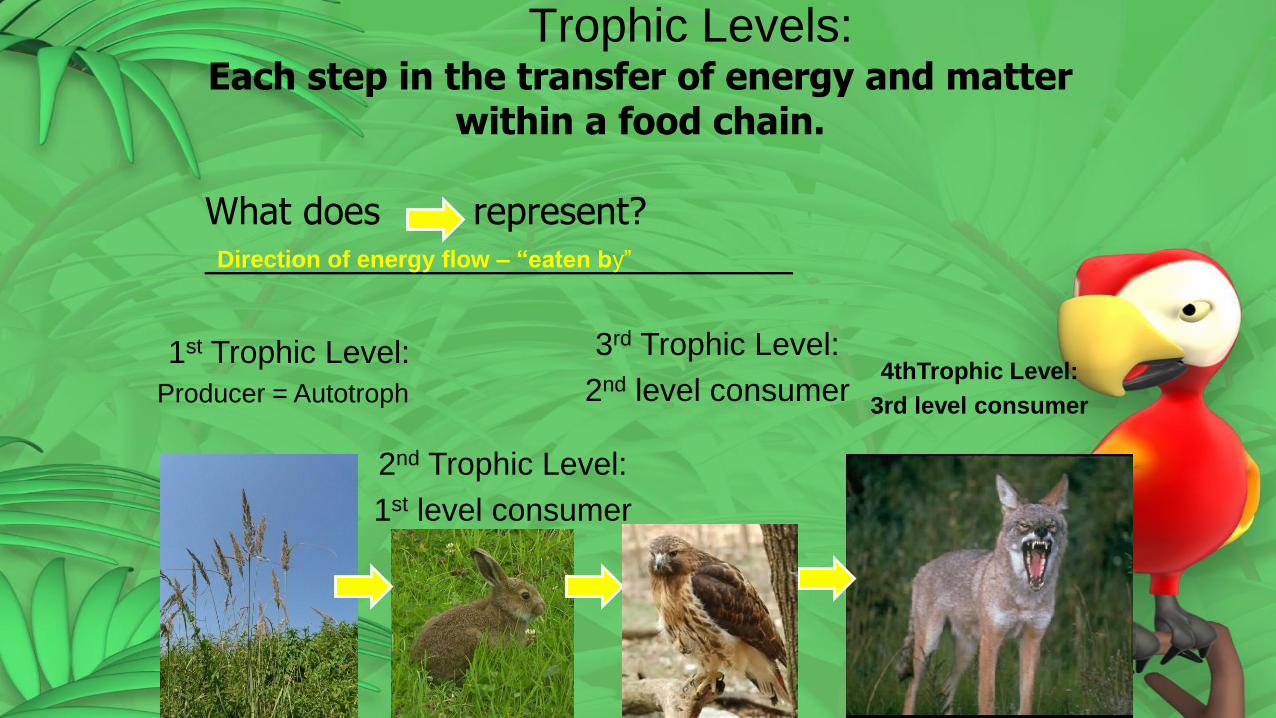
Trophic Levels:Each step in the transfer of energy and matter
within a food chain.
1st Trophic Level:
Producer = Autotroph
2nd Trophic Level:
1st level consumer
3rd Trophic Level:
2nd level consumer
What does represent?_____________________________
4thTrophic Level:
3rd level consumer
Direction of energy flow – “eaten by”
9
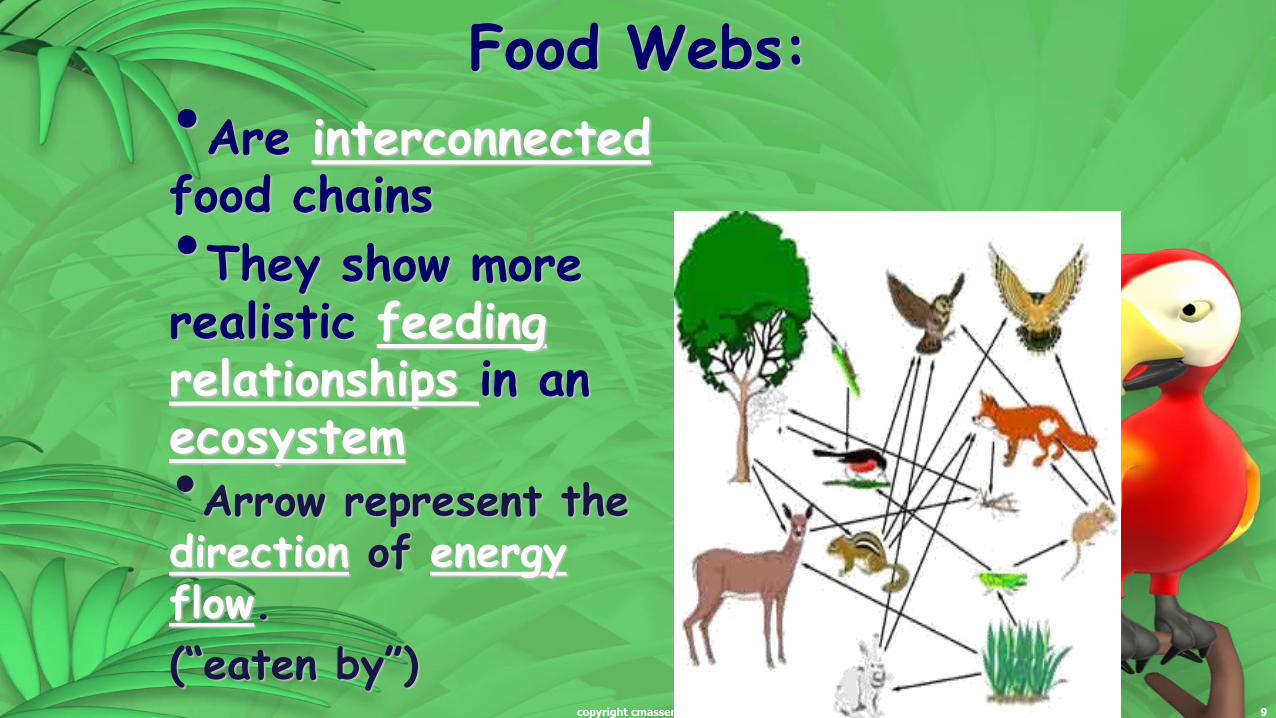
Food Webs:
•Are interconnectedfood chains
•They show more realistic feeding relationships in an ecosystem•Arrow represent the direction of energy flow.
(“eaten by”)copyright cmassengale

10
ENERGY PYRAMID:
-Can show the amount of energy flowing through an ecosystem. (it’s just a vertical food chain!!)
-The base of the ecological pyramid represents the autotrophs, or first trophic level. -Higher trophic levels are layered on top of one another.

11
Movement up the levels will show a DECREASE in ENERGY
copyright cmassengale
100 %
10 %
1%90 % Loss
as Heat
12copyright cmassengale
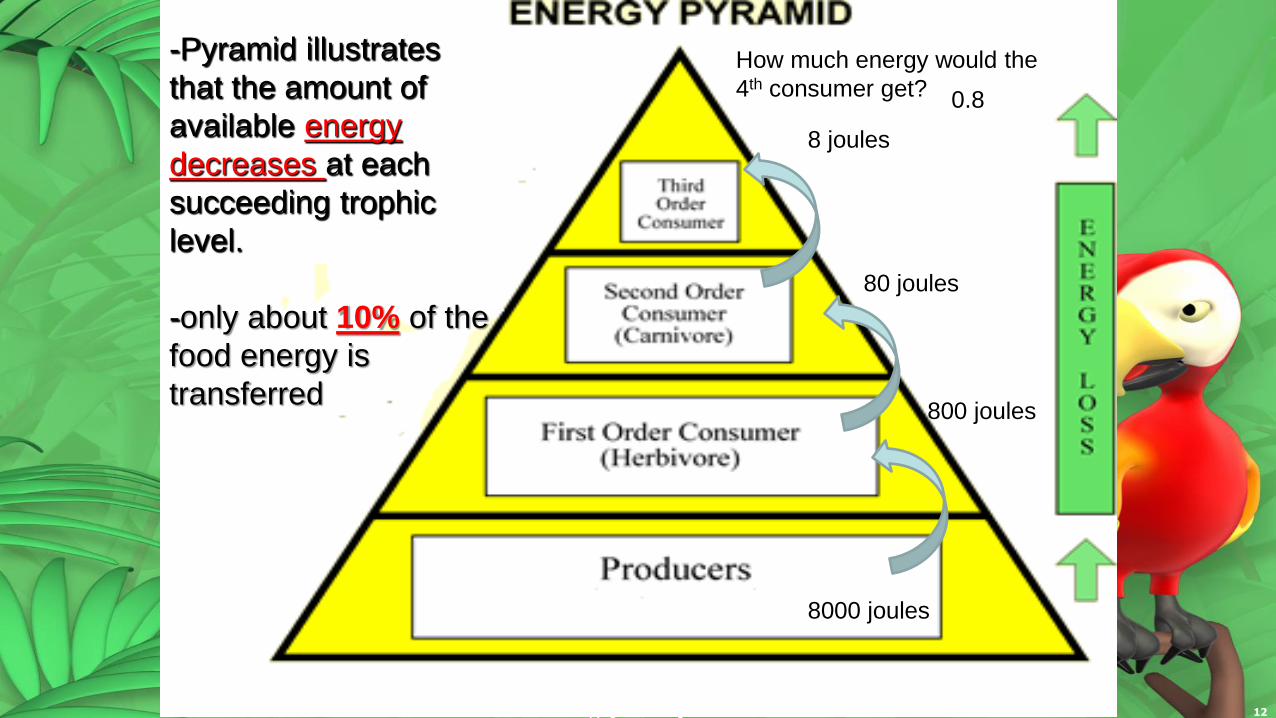
-Pyramid illustrates
that the amount of
available energy
decreases at each
succeeding trophic
level.
-only about 10% of the
food energy is
transferred
8000 joules
800 joules
80 joules
8 joules
How much energy would the
4th consumer get? 0.8
13
10% of the energy is transferred. 90% is lost as HEAT as you move up the energy
pyramid.
copyright cmassengale
10% Rule
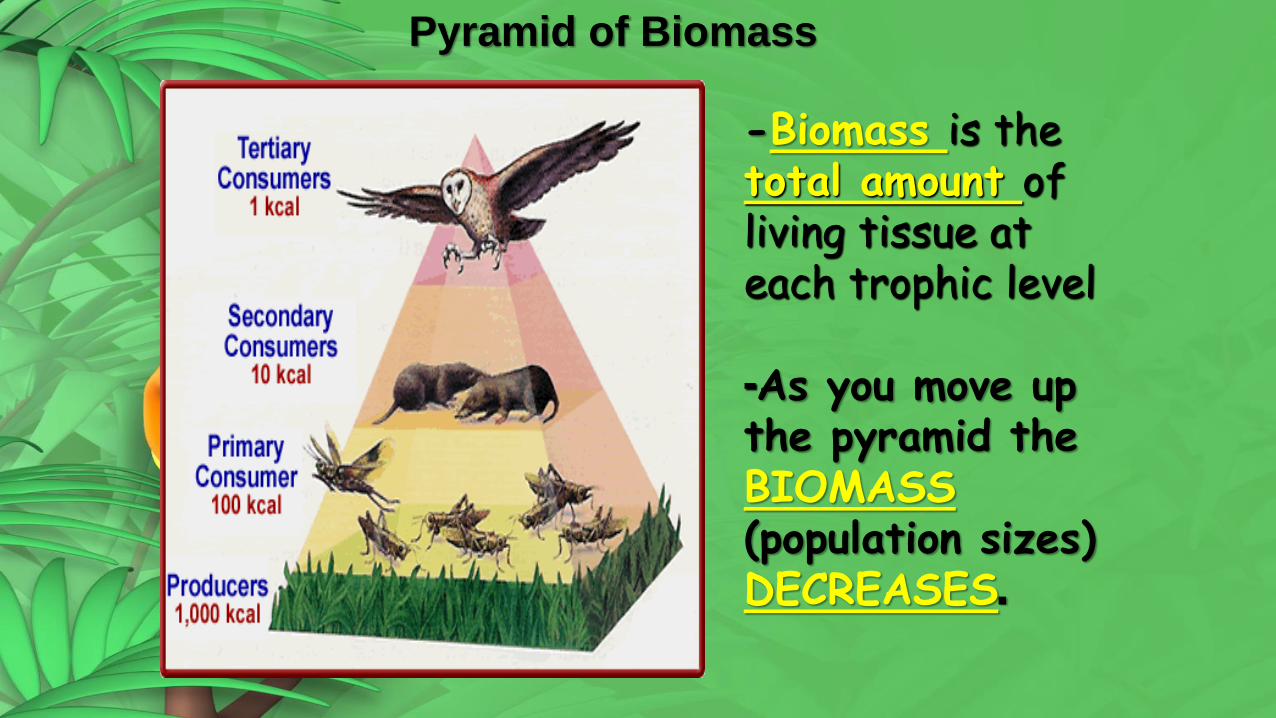
-Biomass is the total amount of living tissue at each trophic level
-As you move up the pyramid the BIOMASS(population sizes) DECREASES.
Pyramid of Biomass
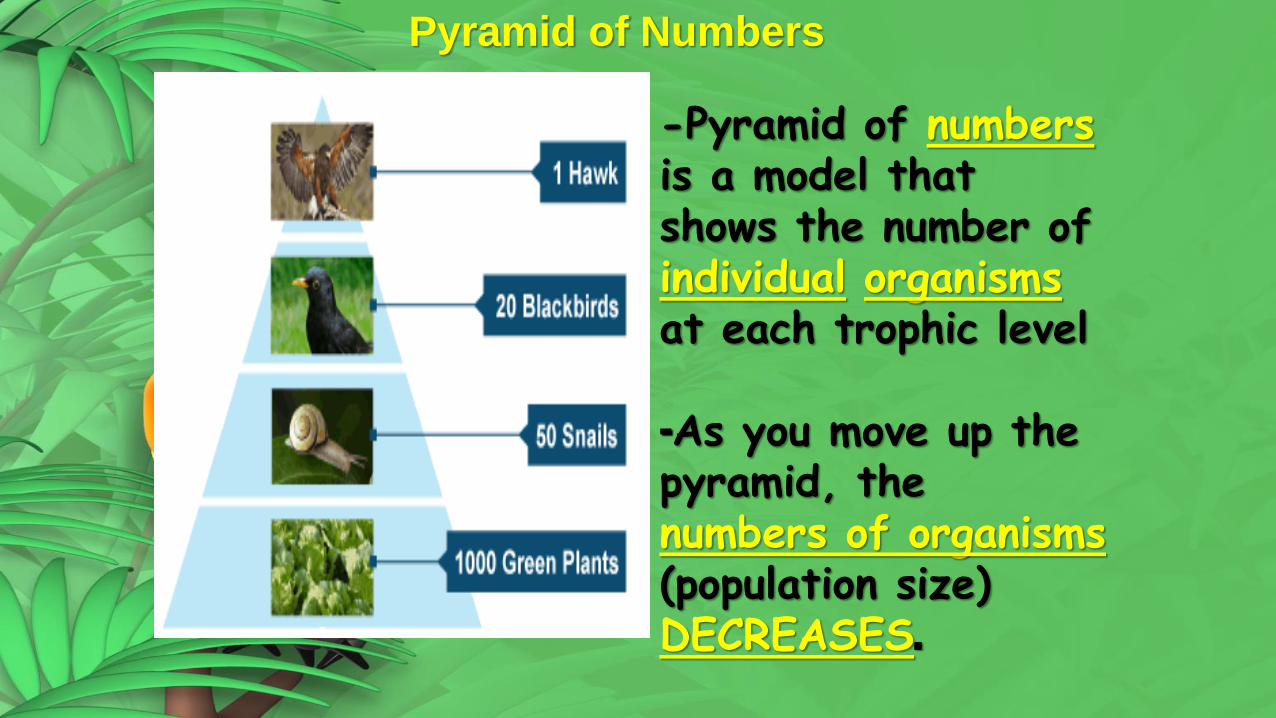
-Pyramid of numbersis a model that shows the number of individual organismsat each trophic level
-As you move up the pyramid, the numbers of organisms (population size) DECREASES.
Pyramid of Numbers

Biological Magnification
Biological Magnification: when the concentration of a harmful substanceincreases in organisms at higher trophic levels in a food chain or food web
Ex. DDT was used to control pests. The pesticide moved up the food chain and birds would accumulate toxic levels of DDT which would cause their eggs to become fragile & break. The eagle almost became extinct, but lawmakers banned DDT and the eagle is now in recovery.
Ppm= parts per million


